Article

Computational Fluid Dynamics Analysis of Wet Dust Removal in High-Gravity Countercurrent Rotating Packed Bed

Shanxi Province Key Laboratory of Higee-Oriented Chemical Engineering, School of Chemical Engineering and Technology, North University of China, Taiyuan 030051, China
*
Authors to whom correspondence should be addressed.
Atmosphere 2024, 15(2), 157; https://doi.org/10.3390/atmos15020157
Submission received: 26 December 2023 / Revised: 17 January 2024 / Accepted: 23 January 2024 / Published: 25 January 2024
(This article belongs to the Section Air Pollution Control)

Abstract

:
High-gravity wet dust removal technology has attracted much attention because of its potential to cut liquid into smaller liquid droplets and lower energy consumption. However, the complex structure and the high-speed rotation of the rotating packed bed do not allow us to analyze the flow field using conventional methods, and thus the capture mechanism of fine particles in a high-gravity environment is poorly understood. In this study, a two-dimensional computational fluid dynamics model was established to investigate the distribution of the gas–liquid two-phase flow field inside of a rotating packed bed. The characteristics of the flow field, such as the liquid form, gas–liquid contact time, and gas flow path, were investigated, and the droplet size distribution and gas–liquid slip velocity were quantitatively analyzed. The inertial capture efficiency was calculated using the Stokes number, and the dust removal efficiency distribution in the rotating packed bed was compared. The reason for the high collection efficiency of fine particles by the high-gravity wet dust removal technology was explained by numerical simulations. Two new structures were designed to improve the total dust removal efficiency.

1. Introduction

Fine particulate matter emissions can have potentially serious consequences for human health, the ecological environment, and industrial production [1]. The emissions arising from natural processes appear to be less harmful than those arising from human activities because of the large storage capacity and high self-purification ability of nature. The industrial emissions from thermal power generation, steel production, and fuel combustion are currently the most important source of dust pollution [2,3], and these emissions are often released continuously from a point source and contain a large amount of soot. In China, coal-fired boilers alone emit more than 400 million tons of soot per year, accounting for 32% of the total particulate matter emissions of the country. Therefore, there is a need to develop more efficient technology for removing fine particles from industrial emissions.
The methods for removing fine particles are broadly classified into the dry method and the wet method, according to the gas–solid separation principle, including bag dust removal, electrostatic dust removal, spray tower, and Venturi scrubber. However, it is still very difficult to achieve the deep purification of fine particles [4] because fine particles differ greatly from liquid droplets with respect to volume and mass, and they will flow around and drift in the flow field near the liquid droplets and, therefore, are difficult to trap. High-gravity wet dust removal technology has recently emerged as a new wet method for trapping fine particles [5]. The gas-phase pressure drop is only 350–800 Pa and the capture efficiency is 99.7% for PM2.5 particles. The rotating packed bed is the core equipment of high-gravity technology, and it can be classified into a countercurrent and a crossflow rotating packed bed based on the gas–liquid contact mode, as shown in Figure 1. The liquid is dispersed onto the high-speed rotating packing through a liquid distributor installed at the inner edge of the bed and then cut into smaller droplets. In the voids of the packing, liquid droplets will collide with each other to entrap and encapsulate the dust particles, forming larger liquid droplets that will collide with each other again in the next layer of the packing. The liquid droplets can be cut into liquid filaments by the large shear force of the packing. Once the surface tension of the liquid cannot overcome the shear force, the liquid filaments will break down into smaller satellite droplets, which will undergo the same collision and merging processes. Throughout the entire dust removal process, the dispersion–coalescence–dispersion cycle of the liquid phase is continually repeated. This is different from the traditional wet method, in which liquid dispersion occurs only once and, thus, there is little chance for the dust particles to collide with the liquid droplets. In the rotating packed bed, fine particles can be captured with liquid droplets through inertial collision, interception, diffusion, and thermophoresis. The capture efficiency of the fine particles may differ depending on the capture mechanism [6], and the capture efficiency by inertial collision is typically 2–3 orders of magnitude higher than that of other mechanisms [7]. It has also been noted that the thermophoresis effect is negligible in the rotating packed bed because of the extremely high gas–liquid mass transfer efficiency and low temperature difference, and the Brownian diffusion effect is small for micrometer-sized particles. Therefore, inertial collision is the primary mechanism for dust removal in a high-gravity environment. Previous studies have explored the optimal operating conditions for dust removal [5], gas–liquid contact modes [8], packing material characteristics [9], and equipment optimization [10].
The internal flow field is very complex, due to the complex three-phase fluid mixture involved in high-gravity wet dust removal. This makes it extremely difficult to analyze the dust removal mechanisms using conventional methods. In this case, mathematical models and numerical simulations are more suitable to characterize the internal flow field. Claudia et al. [11] developed a wet electrostatic precipitator model that considers main particle scavenging mechanisms such as inertial collision, interception, Brownian diffusion, electrostatics, and thermophoresis and found that the model predicted a capture efficiency of 99.5% under optimized process parameters. Li et al. [12] developed an empirical correlation by fitting experimental data to predict the removal efficiency of ultrafine dust particles with high-gravity wet dust removal technology, which predicted the dust removal efficiency with the temperature, liquid-to-gas ratio, and rotational speed, with an error within ±2%. Thanks to the development of computers and computational fluid dynamics (CFD), numerical simulation has become the primary means of characterizing multiphase fluid systems. Pak and Chang [13] developed a computational model to predict the pressure drop in a Venturi scrubber. Gas flow was solved by the Eulerian approach, and the movement of droplets and fine particles was described by the Basset–Boussinesq–Oseen equation, which was solved by the Lagrangian approach. Then, a three-dimensional numerical model was established to predict the pressure drop and capture efficiency of the Venturi scrubber. Ali et al. [14] developed a calculation model to estimate the dust removal efficiency of a wet centrifugal scrubber, which took into account the collection of the liquid film formed by droplet–wall collision on fine particles. The simulation results were consistent with the experimental results and predicted the performance variations in full-scale scrubbers under changing airflow conditions.
However, the internal flow field in high-gravity rotating packed beds is more complex than that in the traditional wet scrubber. Li et al. [15] investigated the fluid dynamics of a novel countercurrent rotating packed bed using particle image velocimetry (PIV) and CFD and the relationship between the average droplet diameter and the rotational speed and initial liquid velocity. Shi et al. [16] developed a two-dimensional computational model for the rotating packed bed. They found that liquid was not uniformly distributed in the packing, and the average residence time of the liquid decreased with increasing rotational speed and initial liquid velocity. Guo et al. [17] developed a three-dimensional computational model to describe liquid films, droplets, and flow patterns in the packing, and they also investigated the effects of rotational speed, inlet liquid velocity, and contact angle between the liquid and the packing on the liquid specific surface area and average residence time.
There are currently no numerical simulations of the removal of fine particles with high-gravity wet dust removal technology. This study investigated the liquid flow patterns in the gas–liquid two-phase flow field, as well as the gas–liquid contact time and gas flow paths in the flow field. This study also quantitatively analyzed the droplet size distribution and gas–liquid slip velocity. The dust removal efficiency of the rotating packed bed was determined using the Stokes number (St), and the mechanism of the high efficiency of the high-gravity wet dust removal technology was elucidated. Importantly, two novel structures were designed to improve the dust removal efficiency.

2. CFD Model

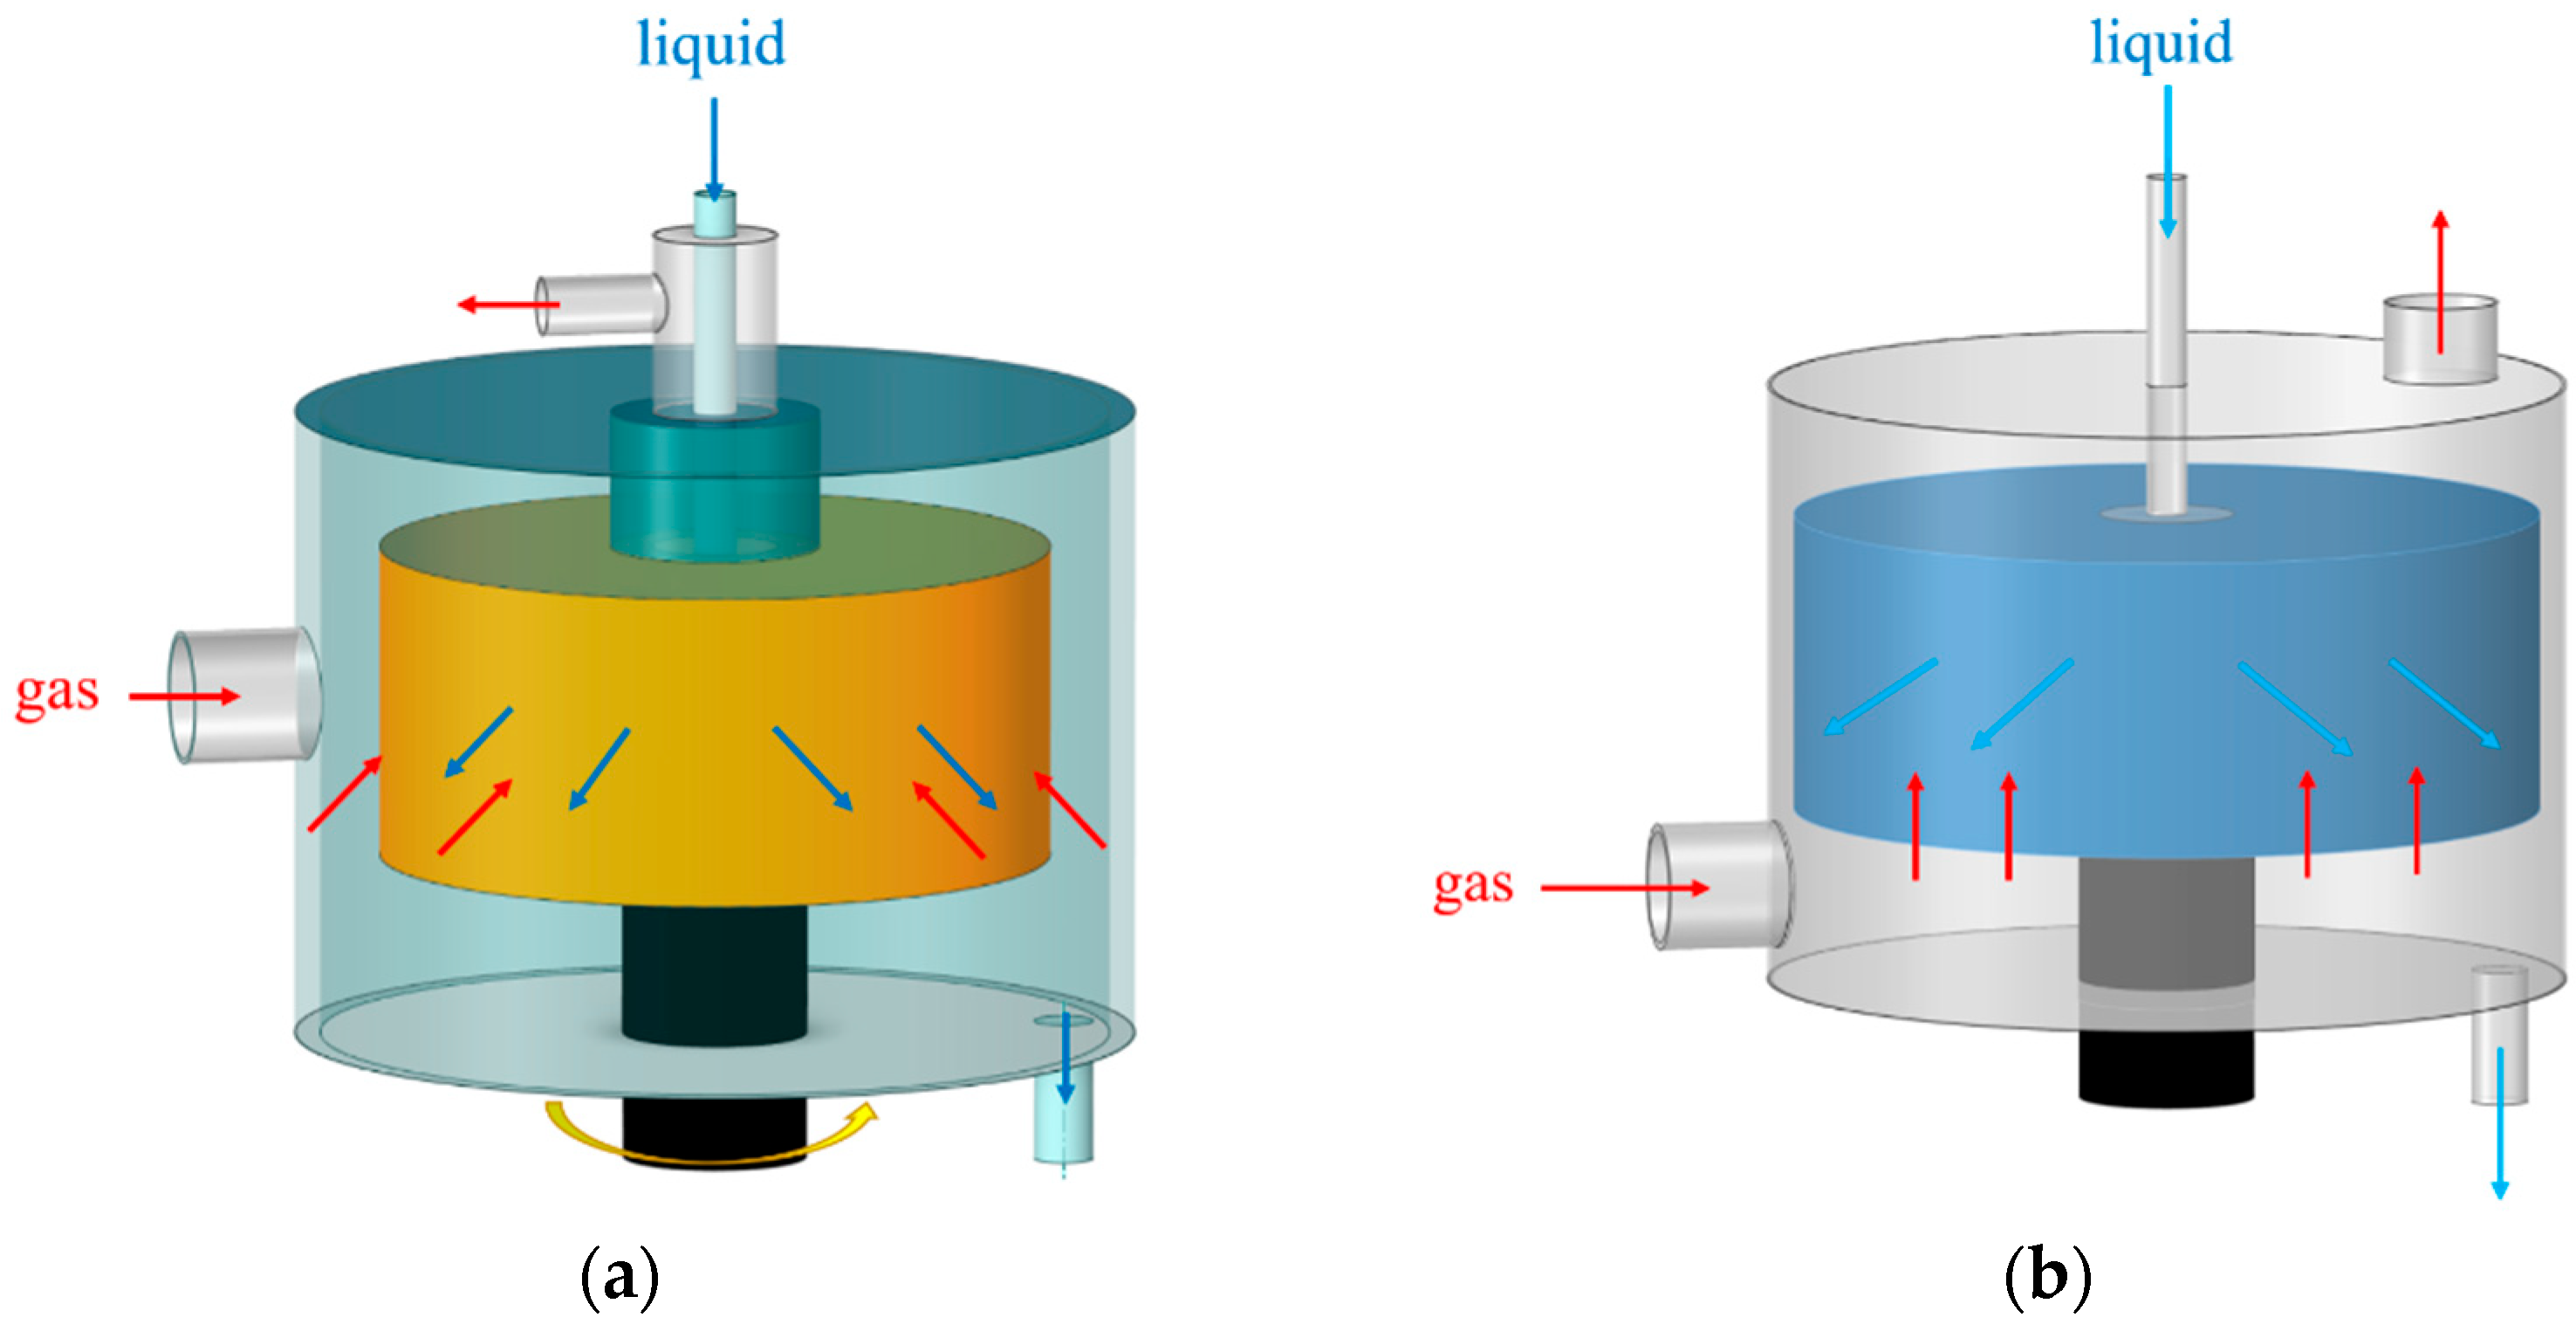
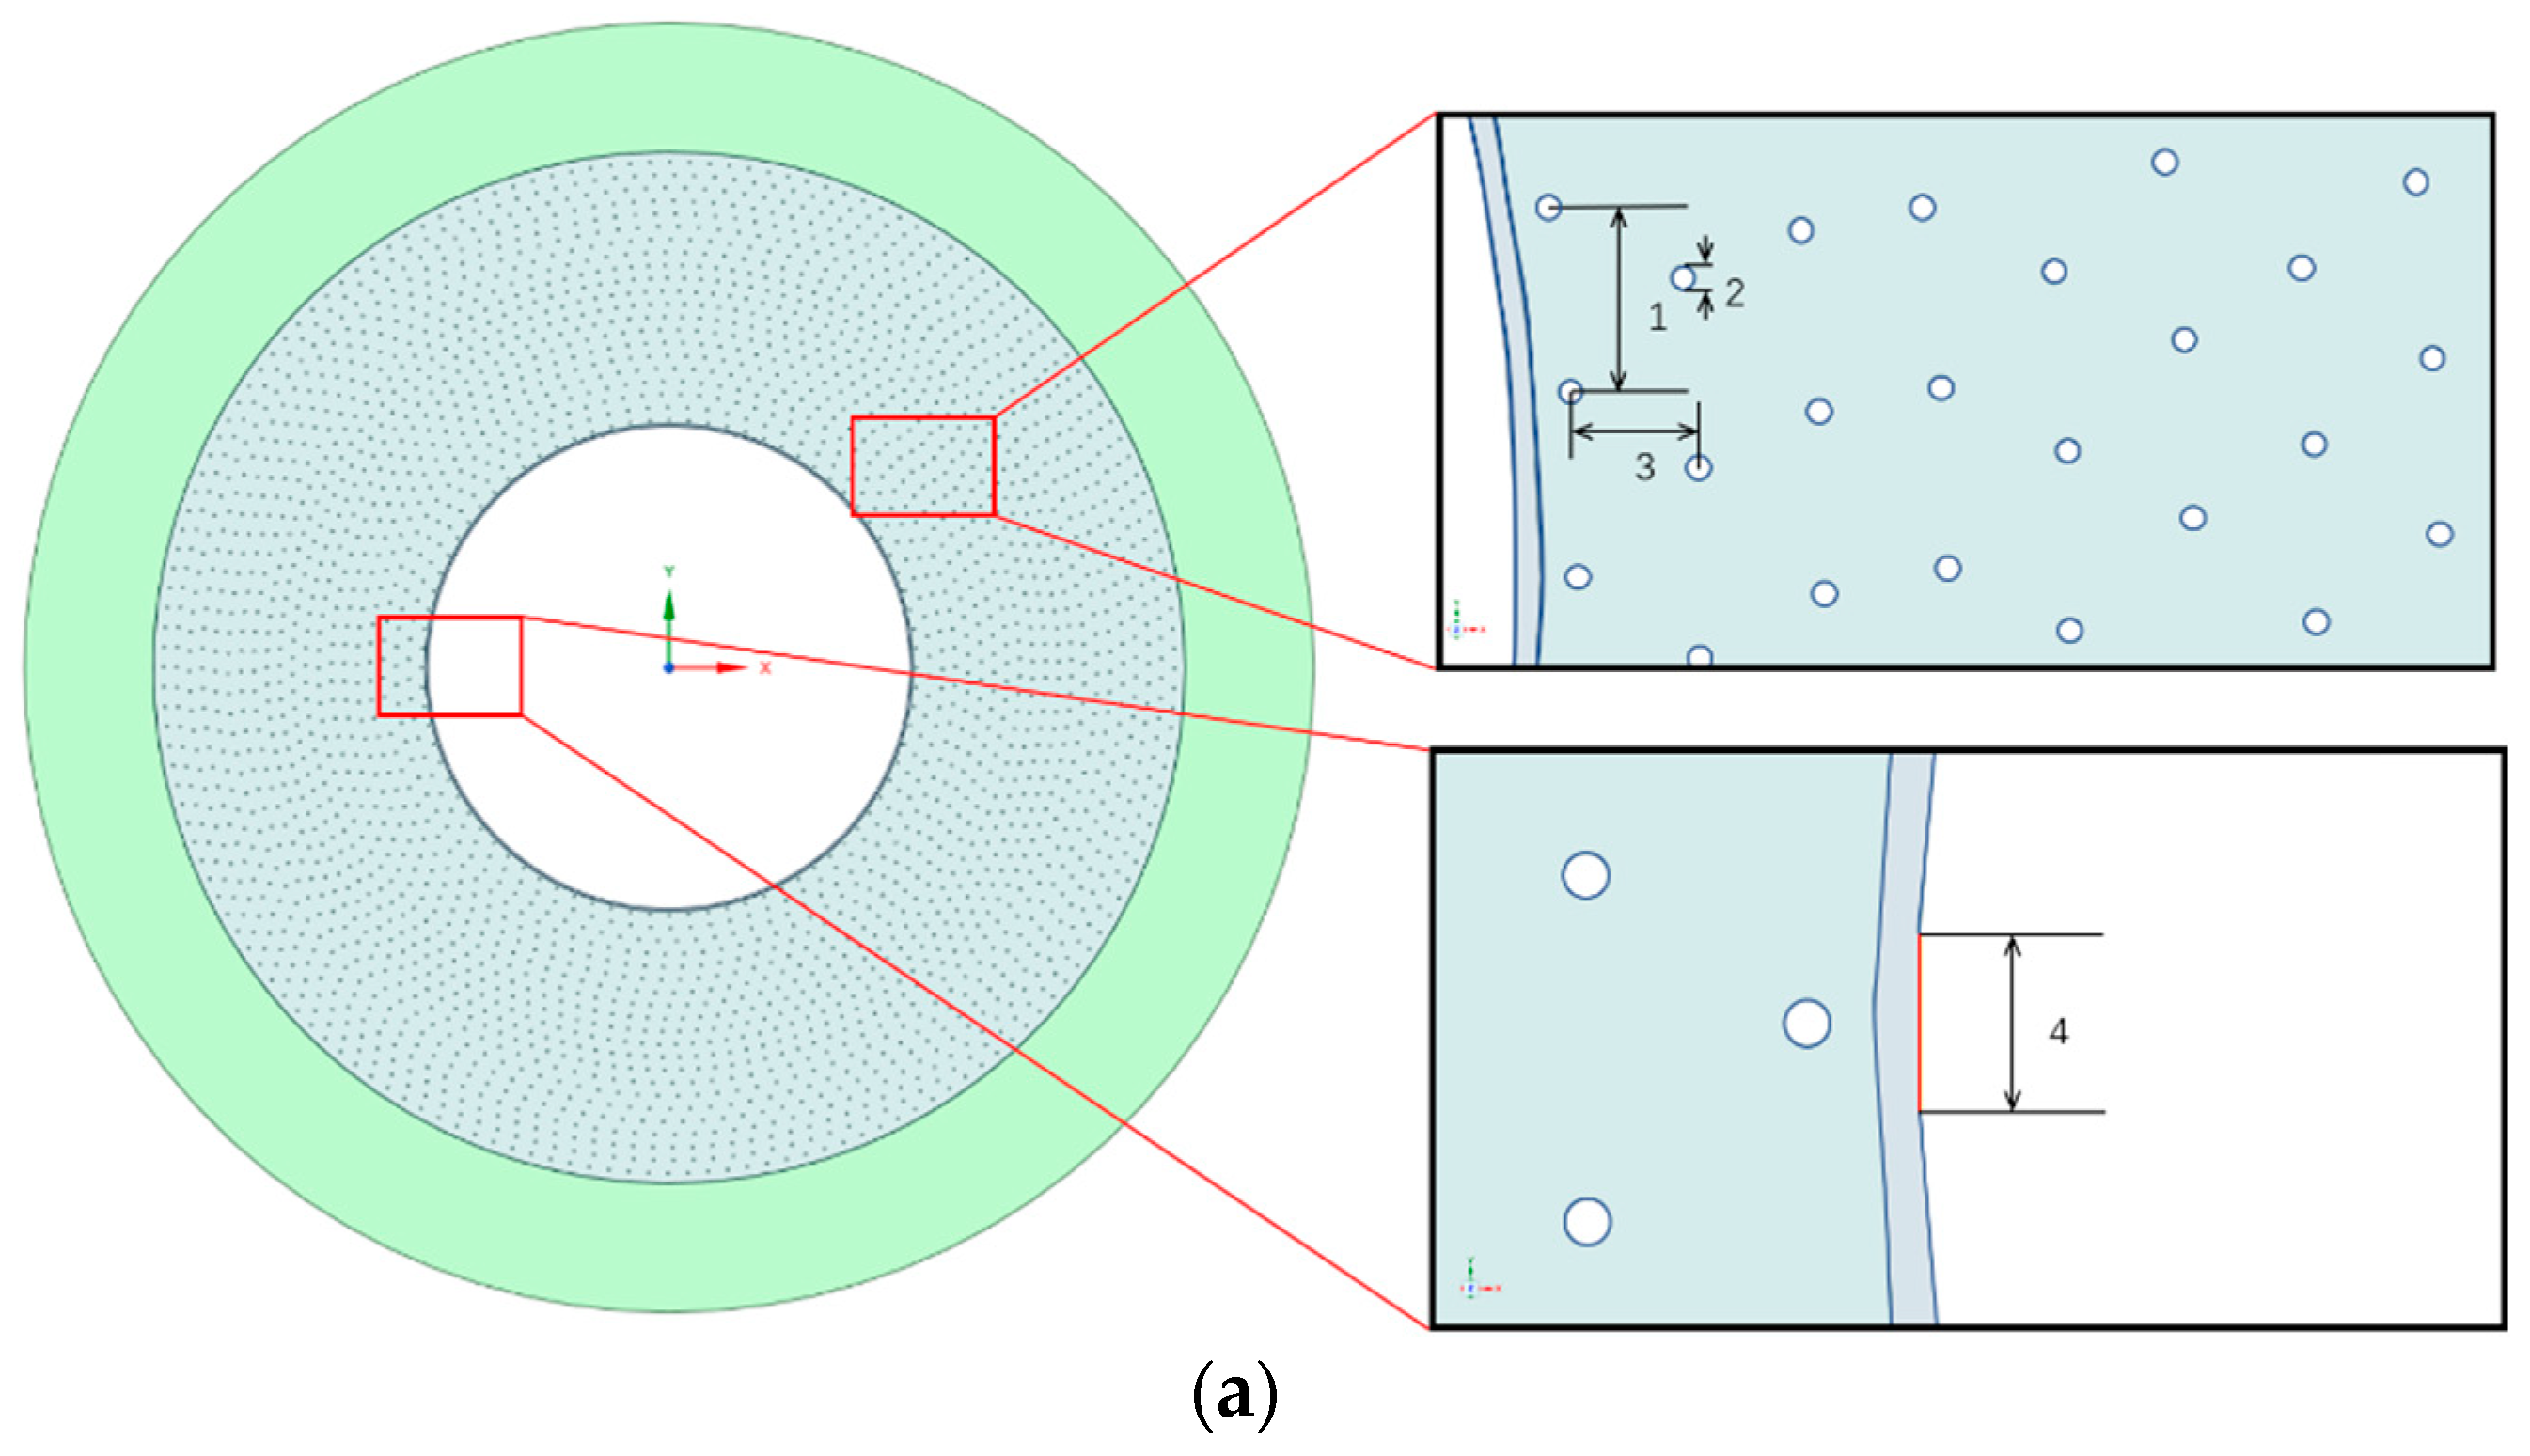
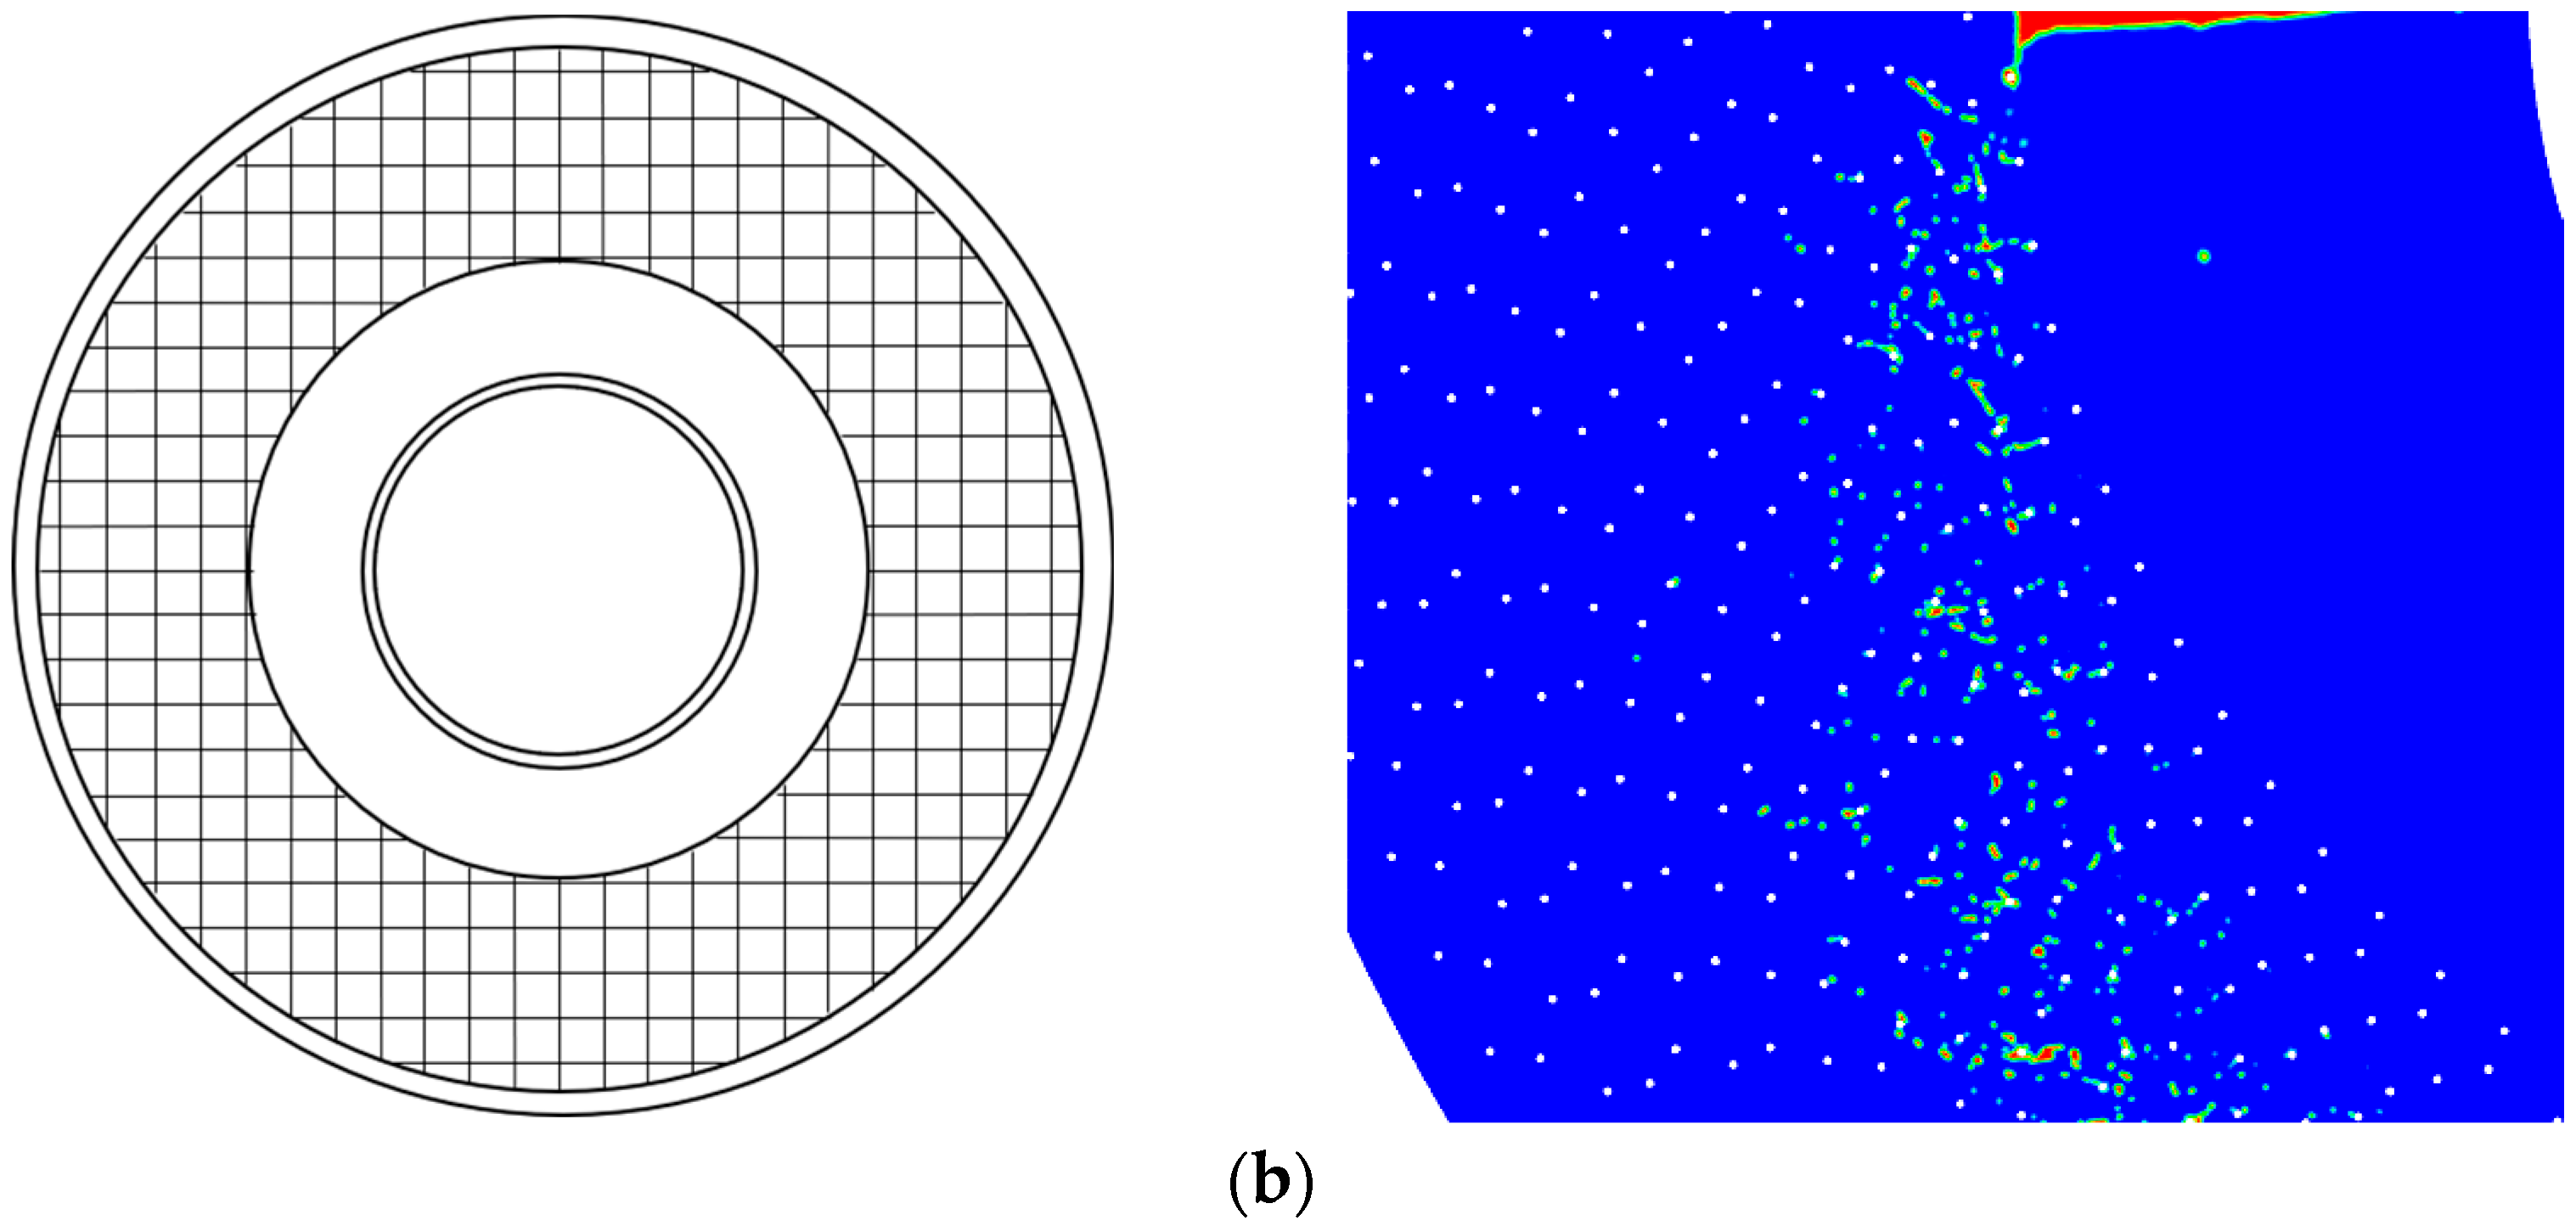
2.1. Geometrical Model

Based on the pilot study of Fu et al. [5], the physical model of the countercurrent rotating packed bed is shown in Figure 2a. The outer diameter of the bed is 500 mm. The packing consists of an outer ring 400 mm in diameter and an inner ring 189 mm in diameter. The regular wire mesh packing is made of metal wires that are interwoven in both horizontal and vertical directions. Considering that the horizontal wire mesh is less capable of cutting and dispersing the liquid, and that, in a two-dimensional model, the liquid cannot pass through the concentric circles representing the horizontal wire meshes, each vertical wire mesh is simplified to a circle of 1 mm in diameter. The circular wire meshes are arranged uniformly in multiple layers, where the axial spacing in the same layer is 7 mm and the radial spacing between the adjacent layers is 3 mm. Liquid distributors are installed in the inner layer of the packing along both positive and negative directions of the x-axis, with a length of 4 mm. To observe the flow field distribution during gas–liquid contact in the voids, the outer diameter of the voids is set to 500 mm.

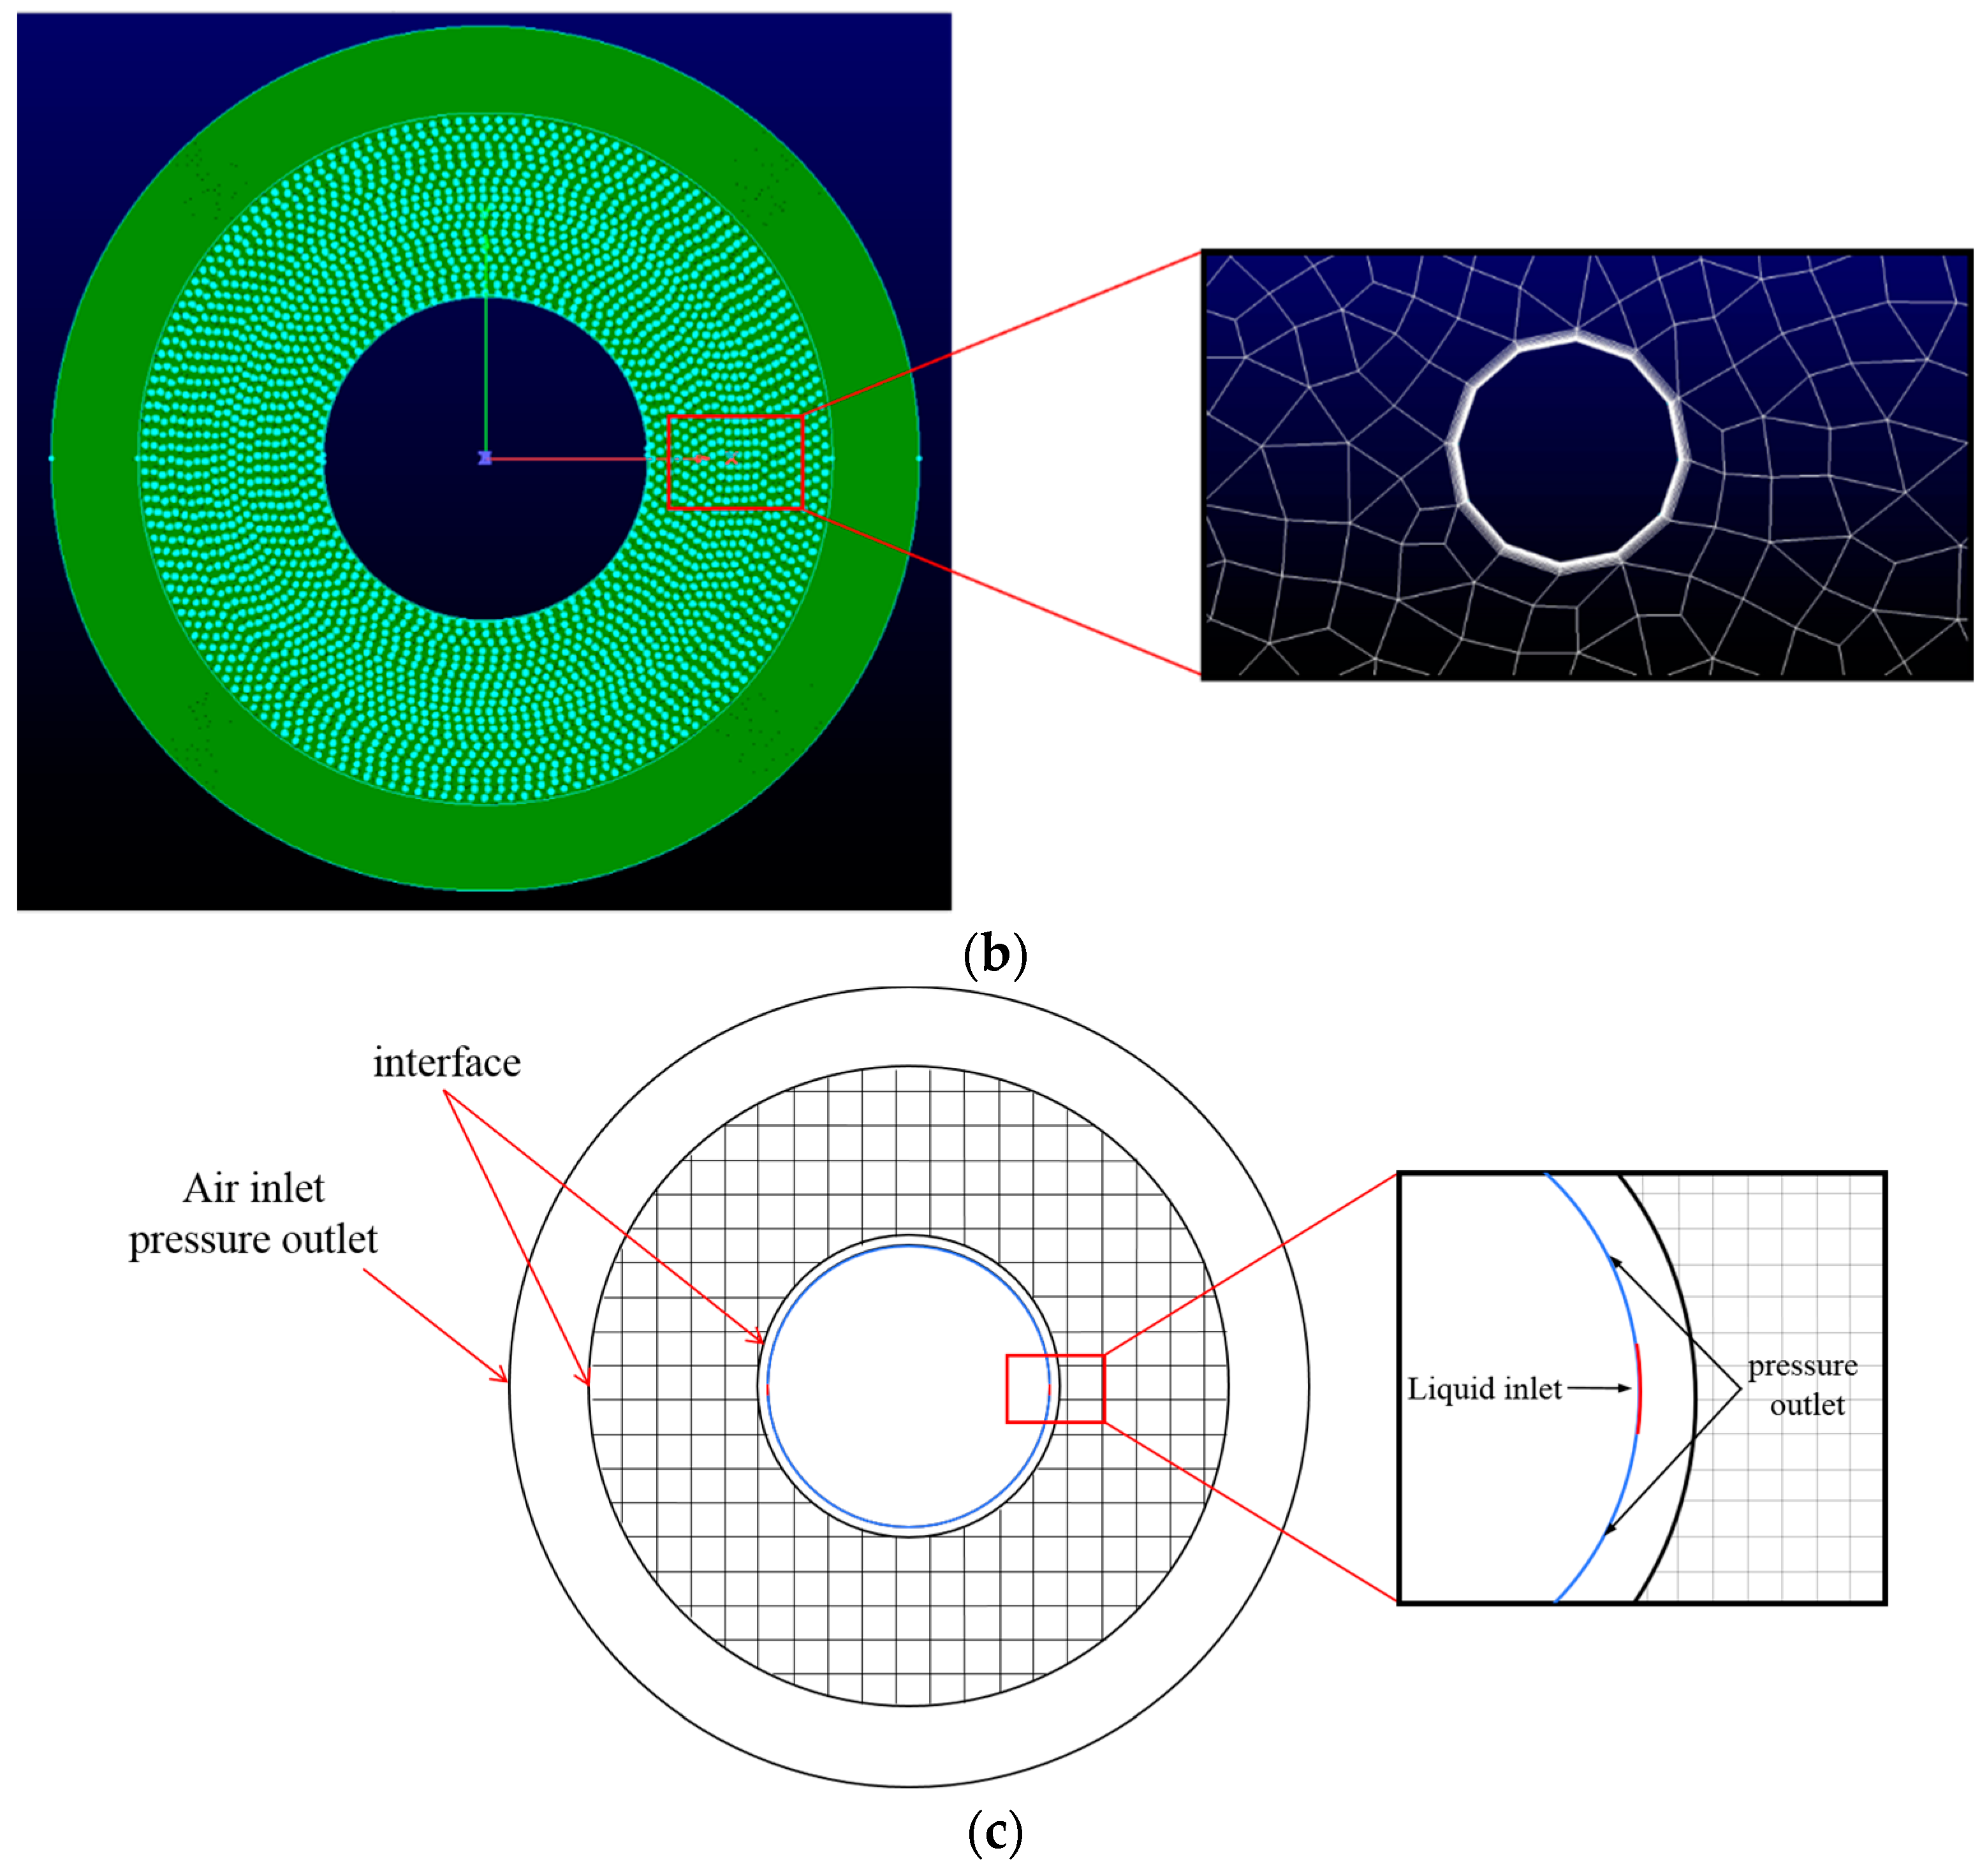
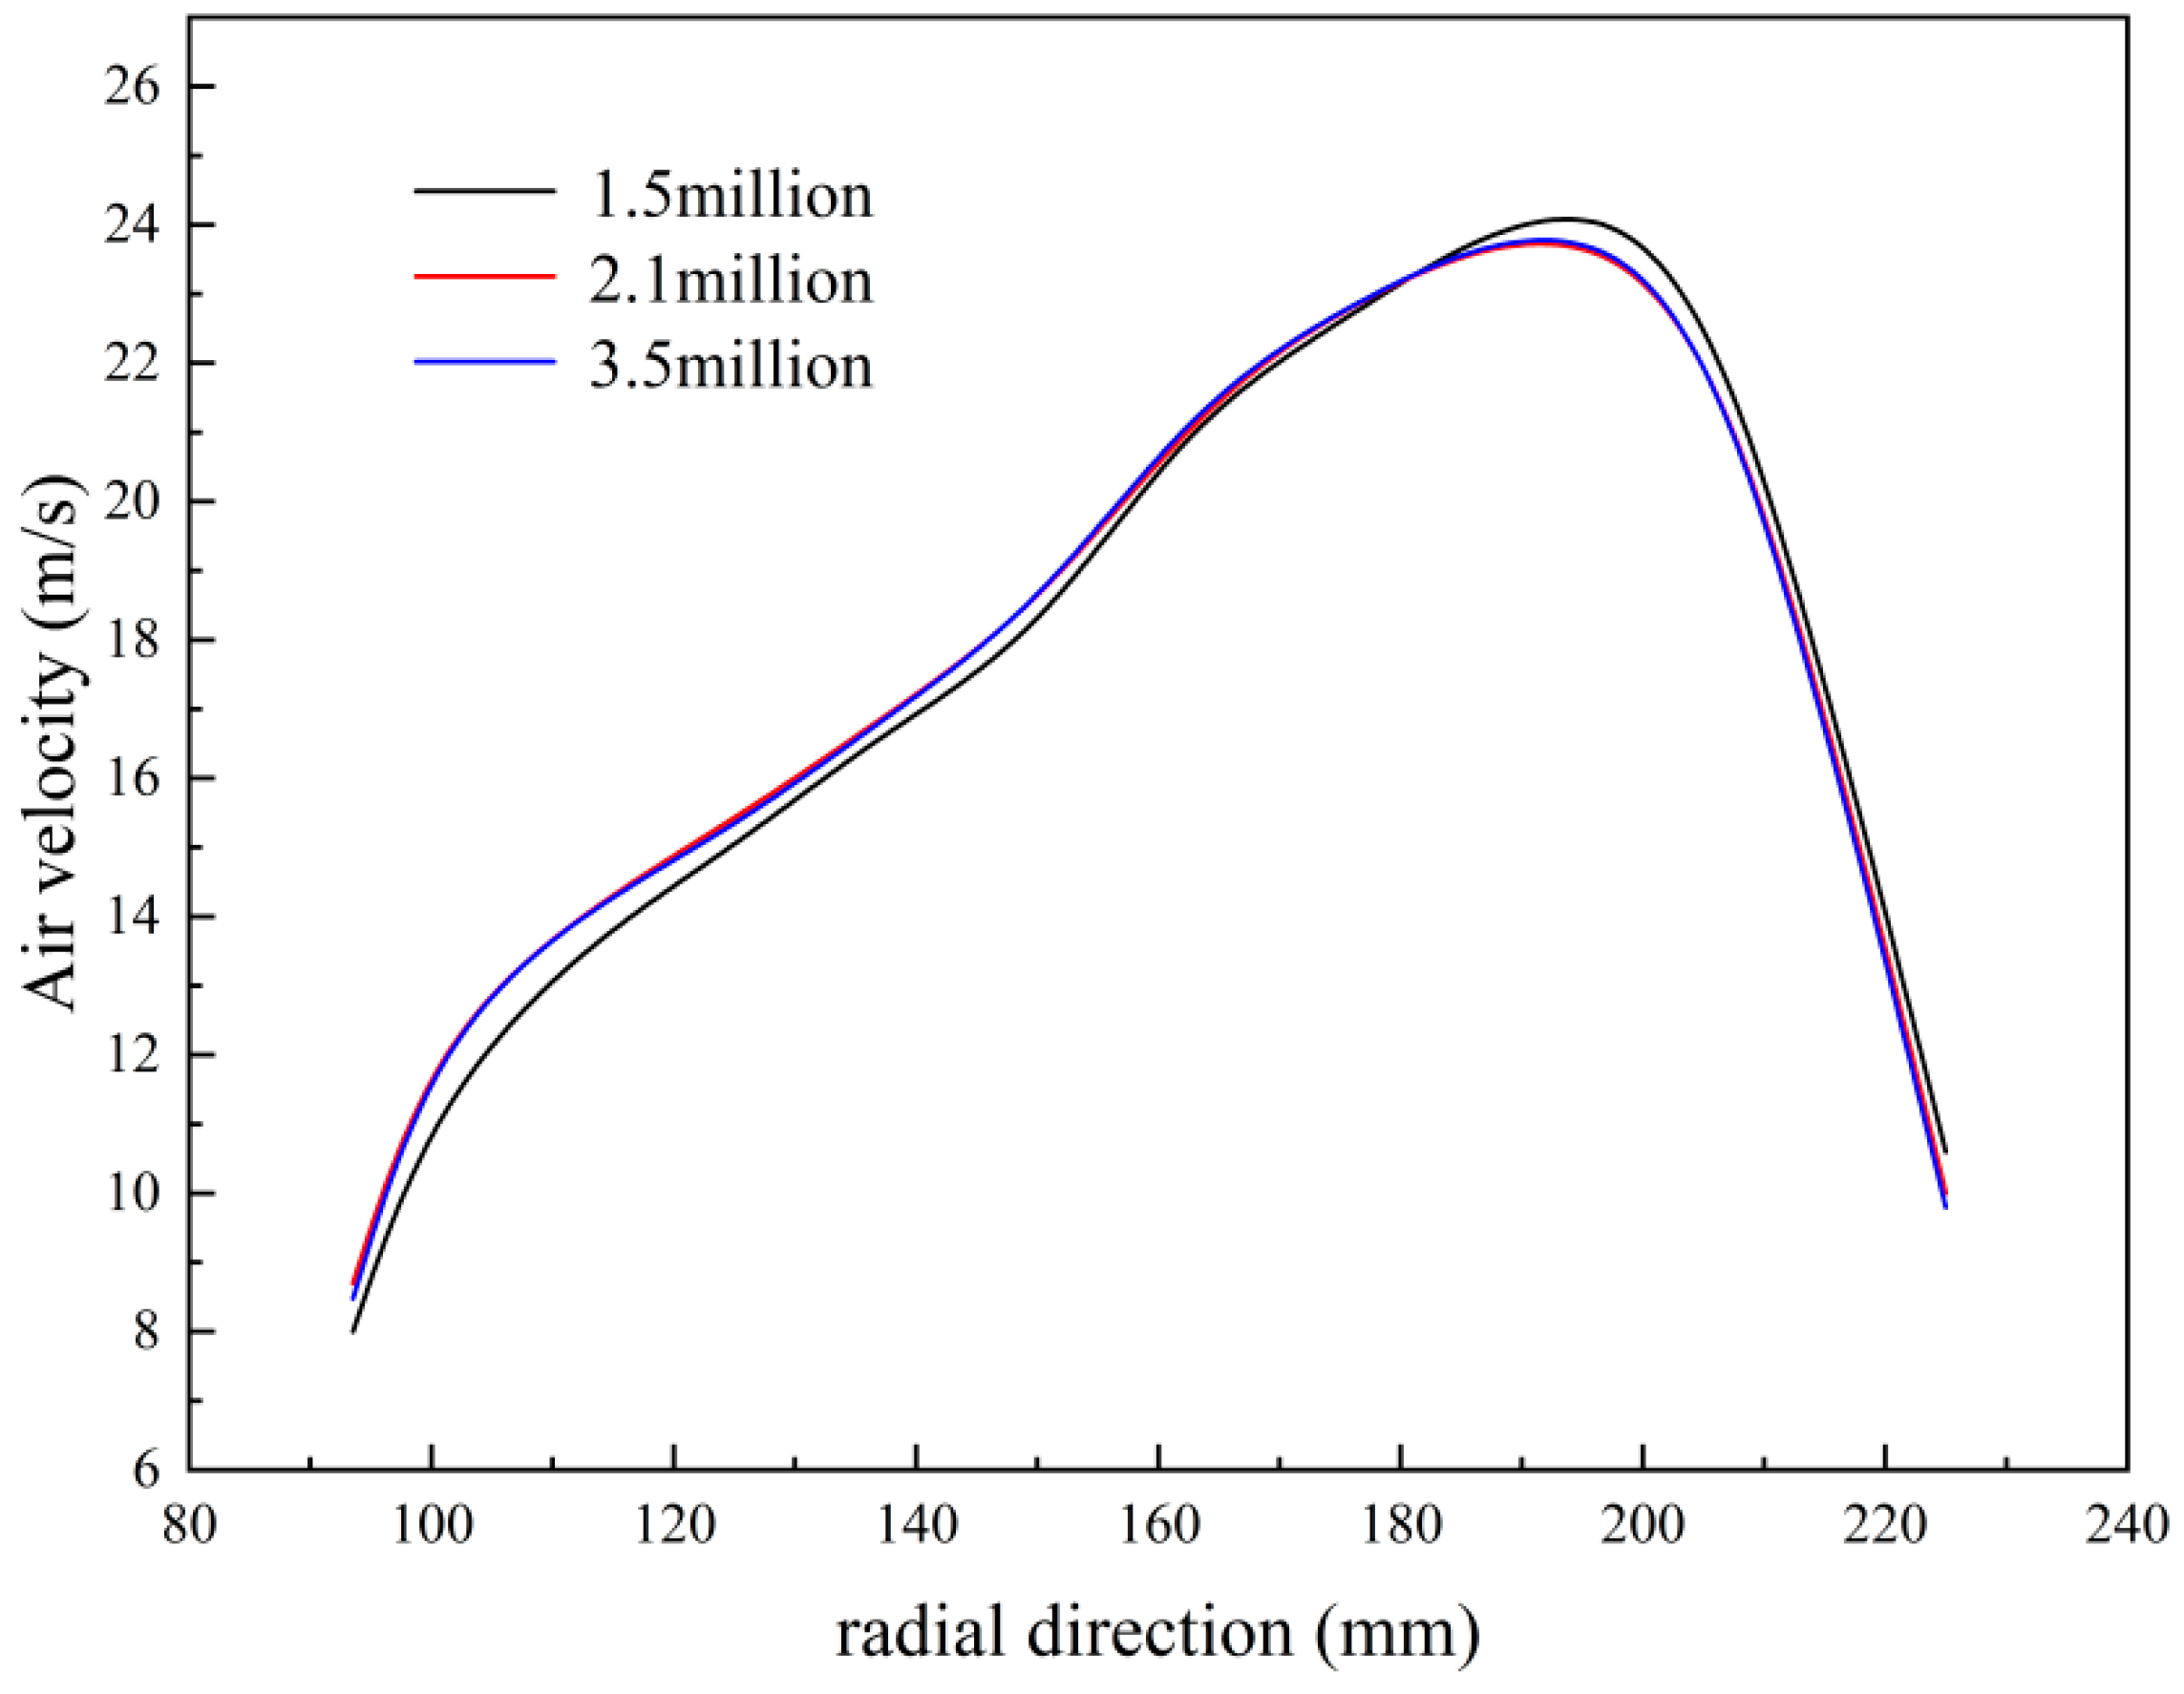
2.2. Computational Grid

Due to the complex internal structure of the packing, the mesh is composed of quadrilaterals with some triangles in between (Figure 2b). The physical model is established for the rotor region and the packing region with concentric rings. Using structured meshes can effectively reduce the number of meshes and improve the calculation accuracy. The high-speed rotation of the packing leads to the intense cutting and dispersion of the liquid and, consequently, a significant increase in the mass transfer coefficient. Therefore, the boundary layer on the surface of the packing is refined in order to improve the accuracy of solving the flow boundary layer. The specific parameters of the mesh model are shown in Table 1, where the minimum orthogonal quality is 0.631, which proves that the grid quality in this experiment is high.
The mesh independence is verified using 1.5 million, 2.1 million, and 3.5 million grids, and the corresponding simulation results are shown in Figure 3. No significant changes are found in the simulation results as the grid number increased from 2.1 million to 3.5 million. Therefore, a grid quantity of 2.1 million is chosen, yielding a grid size of approximately 0.2 mm. The final simulated values are deviated by ±10%, compared to experimental values.

2.3. Boundary Conditions

The two-dimensional physical model of the countercurrent rotating packed bed mainly consists of the stationary outer ring, the inner ring, and the rotating packing. The interfaces are taken as the boundaries between them, as shown in Figure 2c. Except for the liquid inlet, all of the other regions along the inner edge serve as pressure outlets. The initial liquid phase volume fraction is 0 in the entire fluid domain, and the domain is completely filled with air. At the outer boundary of the model, the UDF (user-defined function) is implemented to introduce source terms for both the gas and the liquid phases. The interface is set to be both a gas inlet and a liquid outlet with a gas volume fraction of one. The momentum source terms for both the gas and the liquid phases are adjusted in order to make the simulation results more consistent with the experimental observations. The surface of the packing is set as a no-slip boundary condition. The rotation of the packing in the filling zone is achieved by using the sliding mesh (SM) technique and the rotational speed is in the range of 300–1200 rpm. Both the inner and the outer rings are stationary.

2.4. Mathematical Model

2.4.1. Multiphase Model

As the fine particulate matter in the gas is extremely small, the slip velocity between the gas and the solid particles is very low and, as a result, the presence of the fine particulate matter has a negligible effect on the gas-phase flow [18]. For this reason, the gas–liquid–solid system can be simplified to a gas–liquid system for simulation purposes. The volume of fluid (VOF) model is used to determine the droplet diameter, which can simulate the clear interface between phases. This method was originally proposed by Hirt and Nichols [19] and belongs to the continuum models in the Eulerian framework. The principle is that two or more fluids share a set of momentum equations and that the interface between two phases in each computational cell is tracked by calculating the volume fraction of each phase within each control volume. The volume fraction equation is shown below.
t α l ρ l + · α l ρ l v l r = 0
where l is the liquid phase, t is the time, α l is the volume fraction of the liquid, and v l r is the relative velocity of the liquid. The following constraint is set to ensure that the sum of all of the volume fractions of each phase is one.
q = 1 n α q = 1
Continuity equation:
ρ t + · ρ v r = 0
Within the entire computational domain, a single momentum equation is solved to obtain the velocity field shared by all phases. The form of this momentum equation primarily depends on the volume fractions of density ( ρ ) and viscosity ( μ ) for all phases. The momentum conservation equation is described as follows:
t ρ v + · ρ v v = p + · [ μ ( v + v T ) ] + ρ g + F
The above analysis suggests that the velocities of the gas and liquid phases could not be obtained separately for the VOF model. In this study, the Euler–Euler multiphase model [20] was used to obtain the slip velocity between the gas and liquid phases. In the Euler model, each phase is considered to be interconnected. The mixture is solved by describing the momentum equation of the mixture, while the discrete phases are described using the relative velocities.
Continuity equation:
ρ k t + · ( ρ k u k ) = 0
where k = g represents the gas phase, k = l represents the liquid phase, and u k represents the velocity vector of each phase. The mass conservation equation is shown below.
t ( α q ρ q ) + · ( α q ρ q v q ) = p = 1 n m ˙ p q
where v q is the velocity of phase q and m ˙ p q is the mass transfer from phase p to phase q , from which the following equation can be obtained:
m ˙ p q = m ˙ q p
Momentum conservation equation (taking phase q for example):
t α q ρ q v q + · α q ρ q v q u k u k = α q p + · τ q ̿ + p = 1 n R p q + m ˙ p q v p q + α q ρ q ( F q + F l i f e , q + F V m , q )
where τ q ̿ is the pressure strain tensor of phase q ,   F q is the external volume force, F l i f e , q is the lift force, F V m , q is the virtual mass force, R p q is the inter-phase interaction force, p is the pressure shared by all phases, and v p q is the velocity between phases.

2.4.2. Turbulence Model

Selecting an appropriate turbulence model is crucial to obtain accurate simulation results. The SST k-ω model [21] is suitable for complex boundary layers and rotating machinery, which is described as follows:
t ρ k + x i ρ k u i = x j Γ k k x j + G k Y k + S k
t ρ ω + x i ρ ω u i = x j Γ ω ω x j + G ω Y ω + D ω + S ω
where G k represents the turbulent kinetic energy and Γ k and Γ ω , respectively, represent the effective diffusion terms for k and ω , as follows:
Γ k = μ + μ t σ k
Γ ω = μ + μ t σ ω
where σ k and σ ω , respectively, represent the turbulent Prandtl numbers for k and ω and μ t is the turbulent viscosity coefficient.

2.4.3. SM Model

The rotating packed bed is composed of the packing with a stationary inner ring and an outer ring. The sliding mesh (SM) model is used to simulate this process. In the sliding mesh model, the relative motion between the stationary and rotating parts induces transient changes, and data exchange at the interface is accomplished through the velocity variation at each time frame. For a generic scalar, φ , the integral form of the conservation equation on any control volume, V, is as follows:
d d t v ρ φ d V + v ρ φ u u g · d A = v Γ φ · d A + V S φ d V
where ρ is the fluid density, u is the flow velocity vector, u g is the mesh moving velocity, and Γ is the diffusion coefficient.

2.5. Calculation Method

All CFD simulations are performed in a double precision mode using FLUENT code. The SIMPLE algorithm is used to solve the pressure–velocity coupling problem. The second-order upwind scheme is used in the momentum and turbulent kinetic energy equations. The time step is set at 10−7–10−5, depending on whether the fluid domain reaches a quasi-steady state. The changes in gas flow rate with time step in a monitoring point in the packing are shown in Figure 4. It has been found that the gas velocity fluctuates periodically at 16–21 m/s, at which time the fluid domain reaches a quasi-stable state. The fluctuation can be attributed to the rapid decrease in the velocity field after each layer of wire mesh. The same conclusion was also reached by Yang et al. for the single liquid phase flow field [22].

3. Results and Discussion

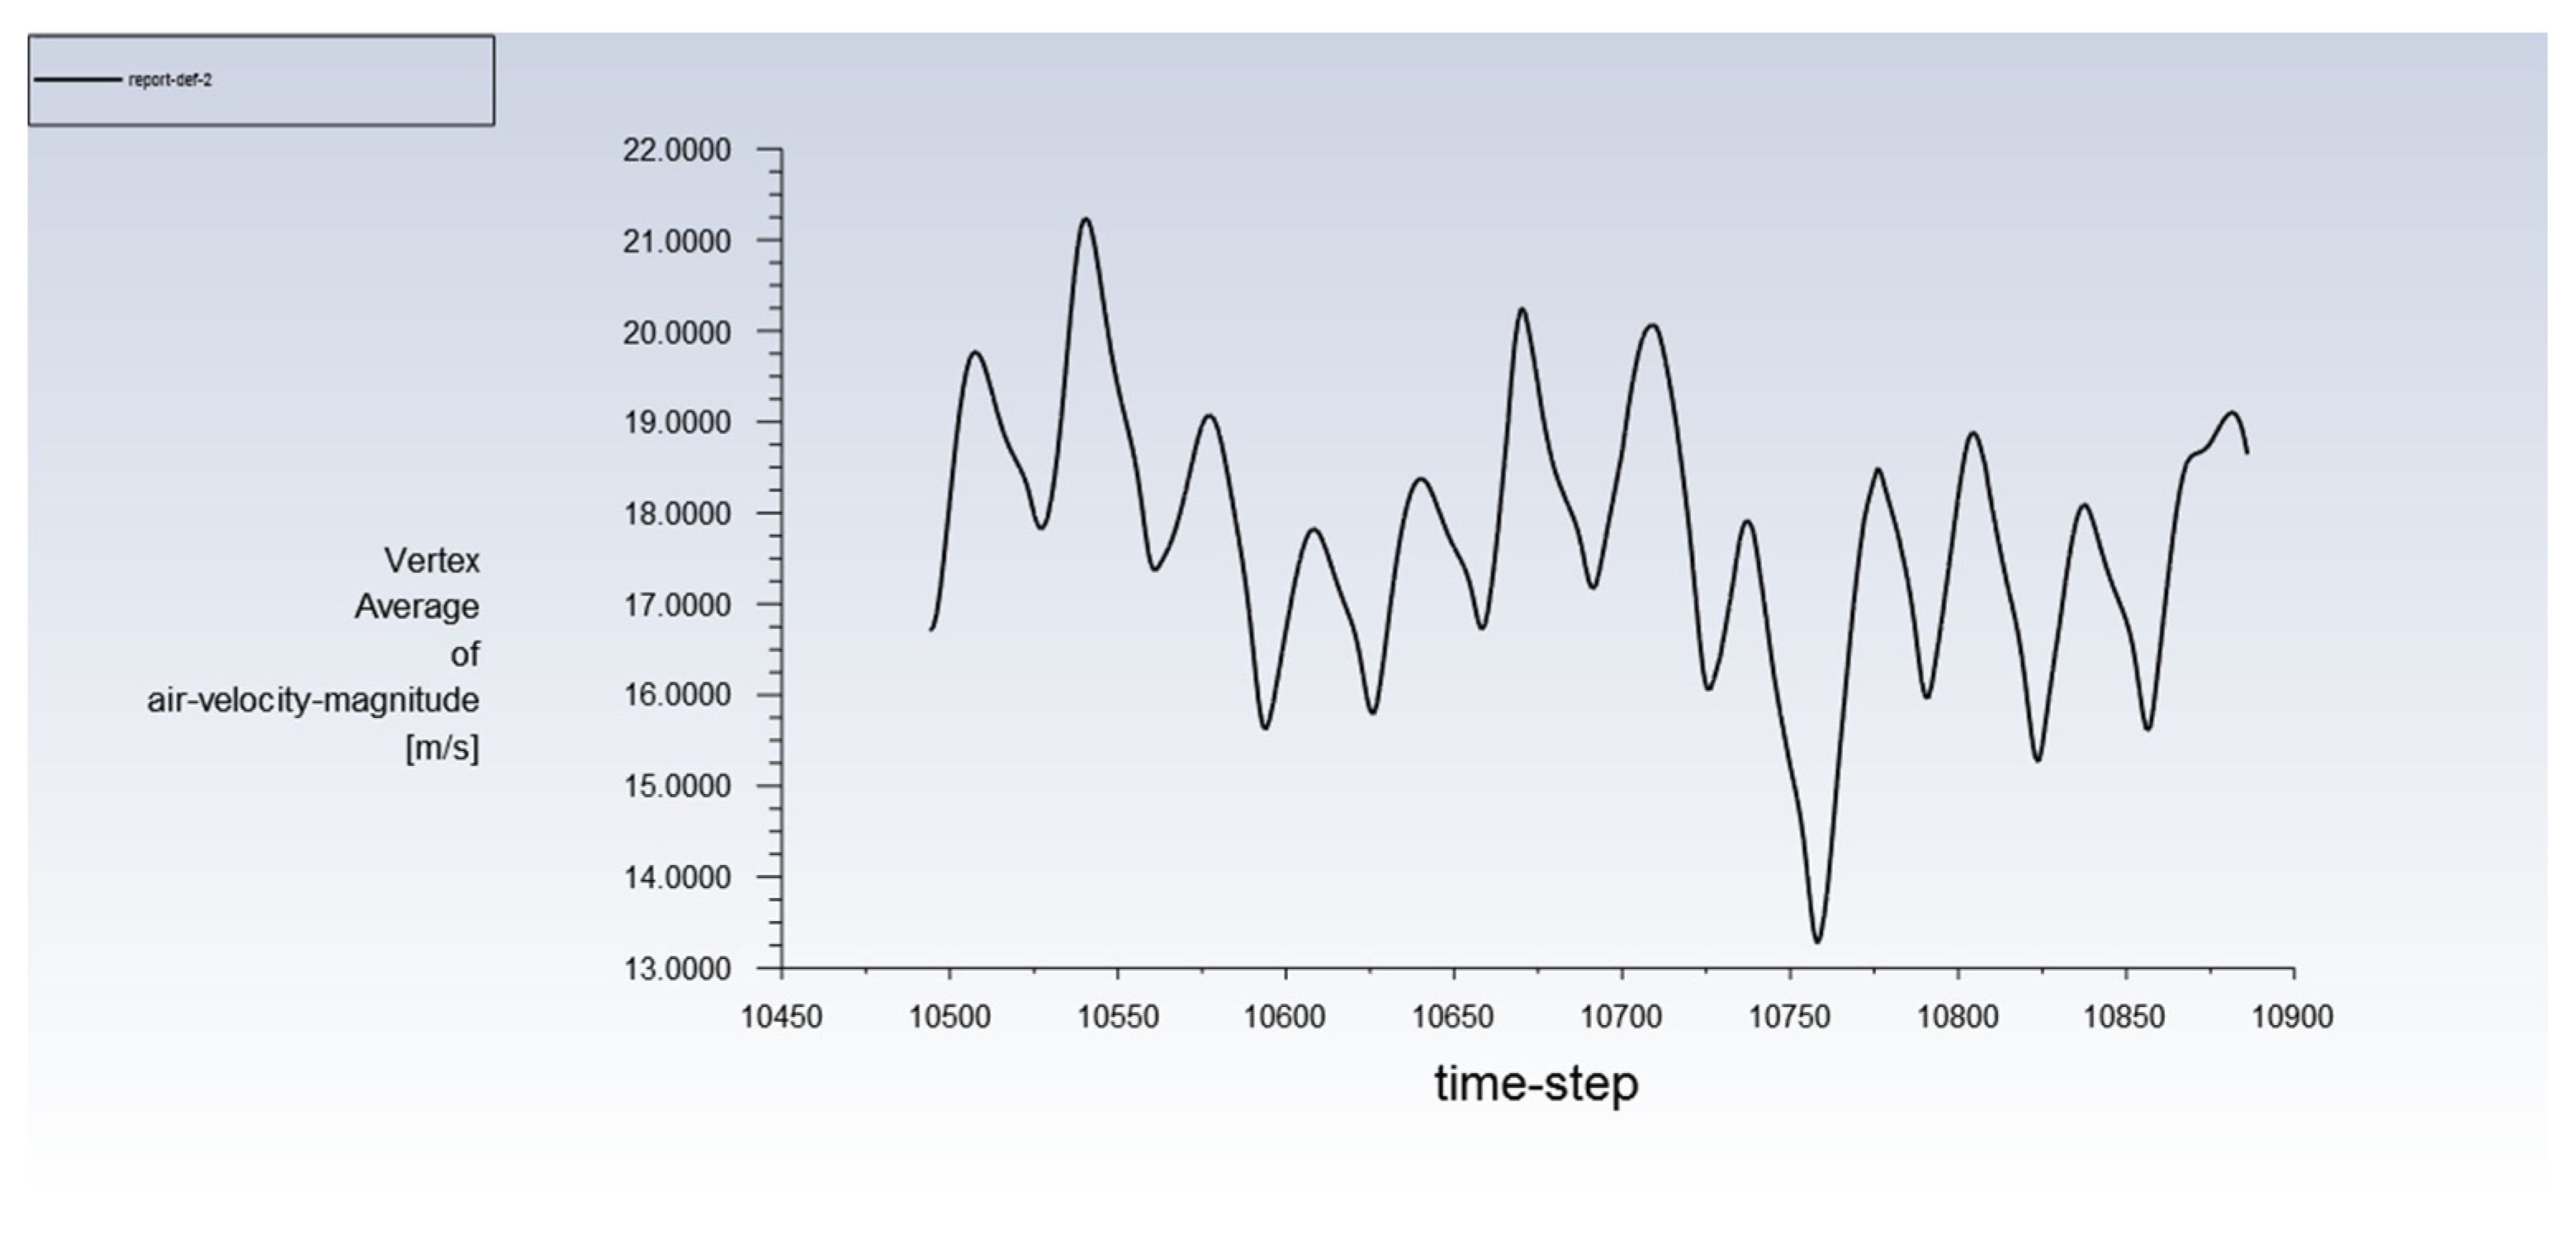
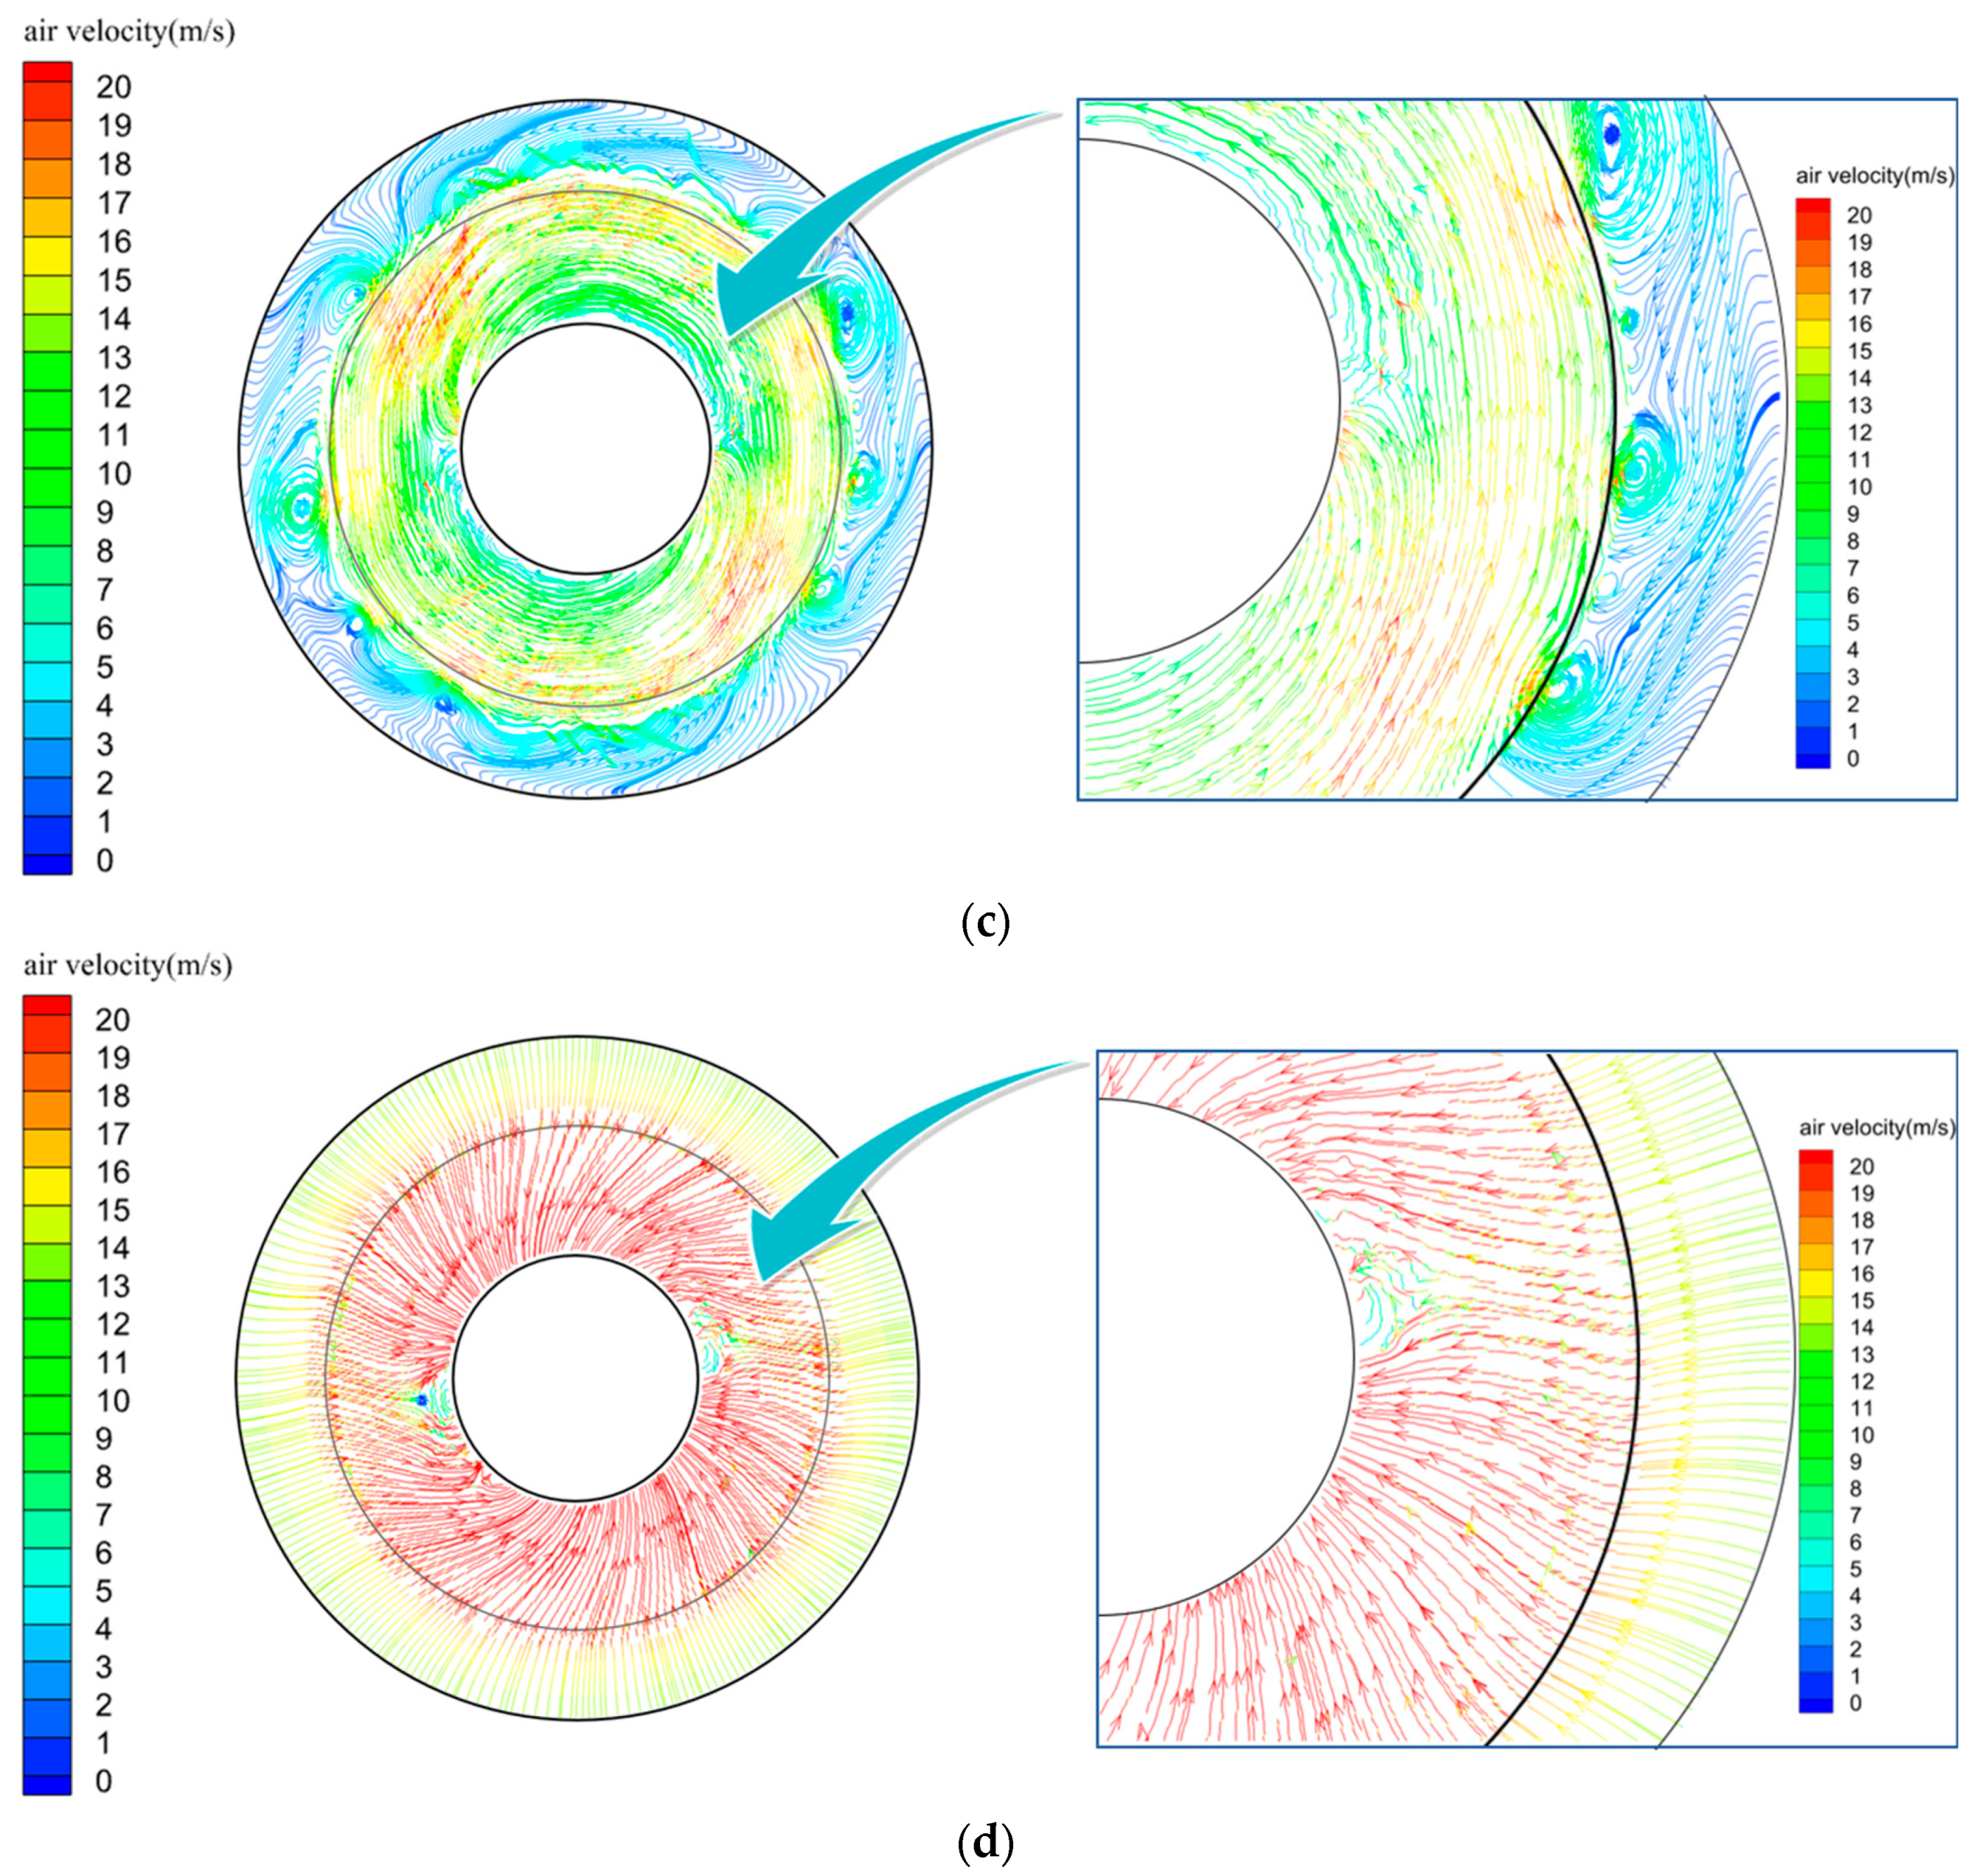
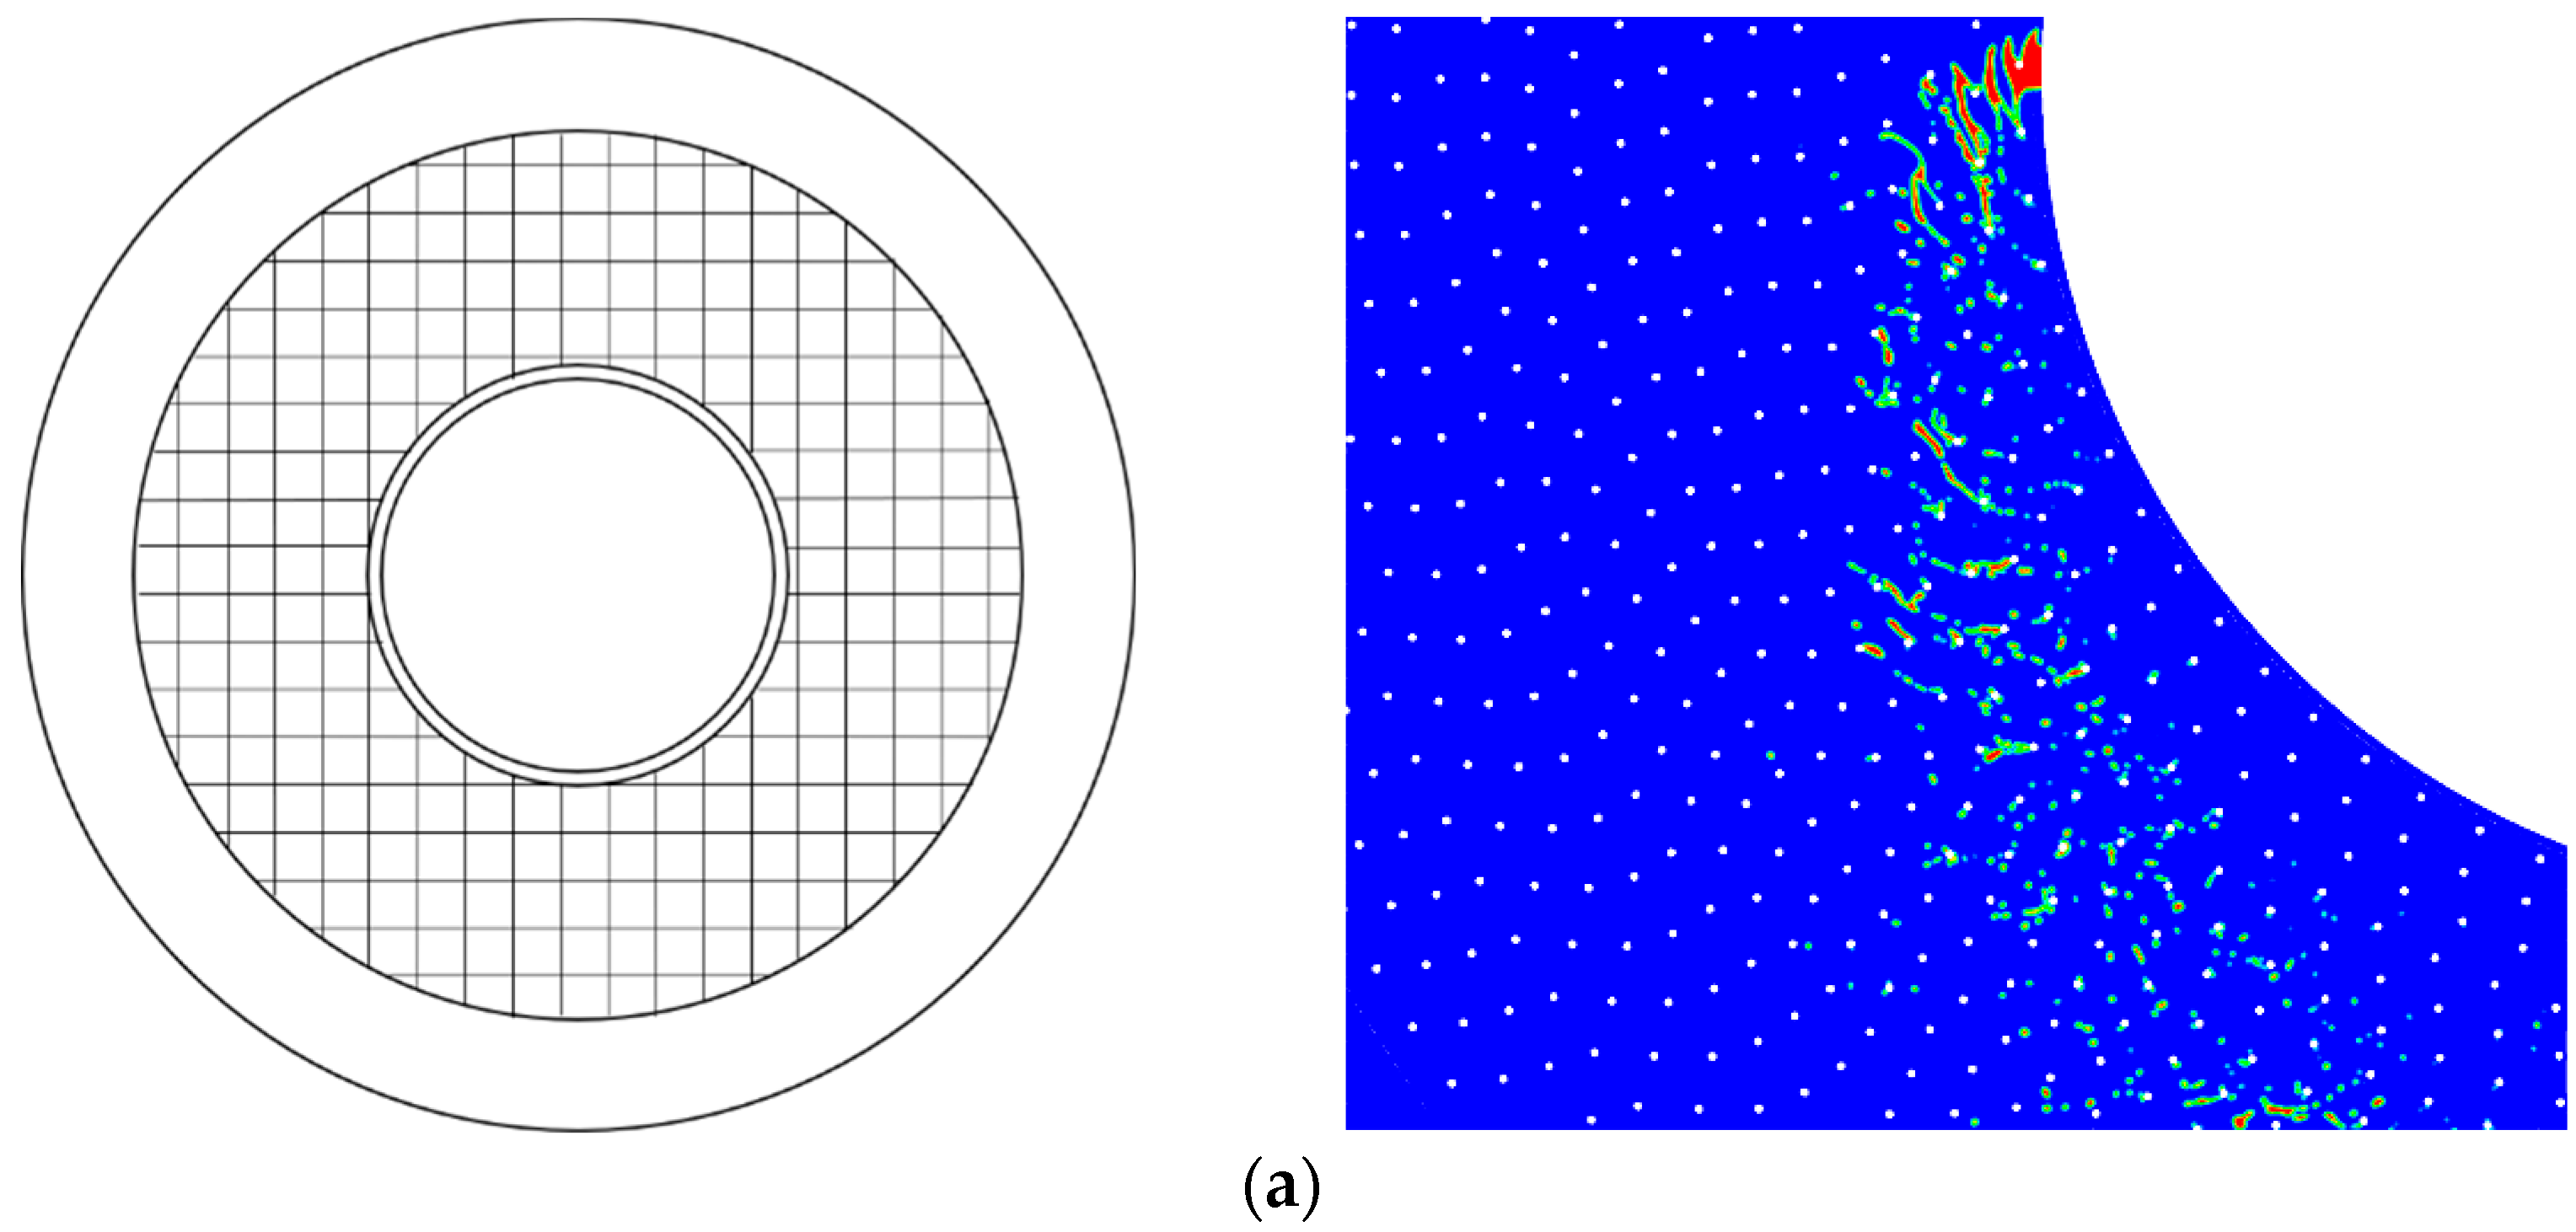
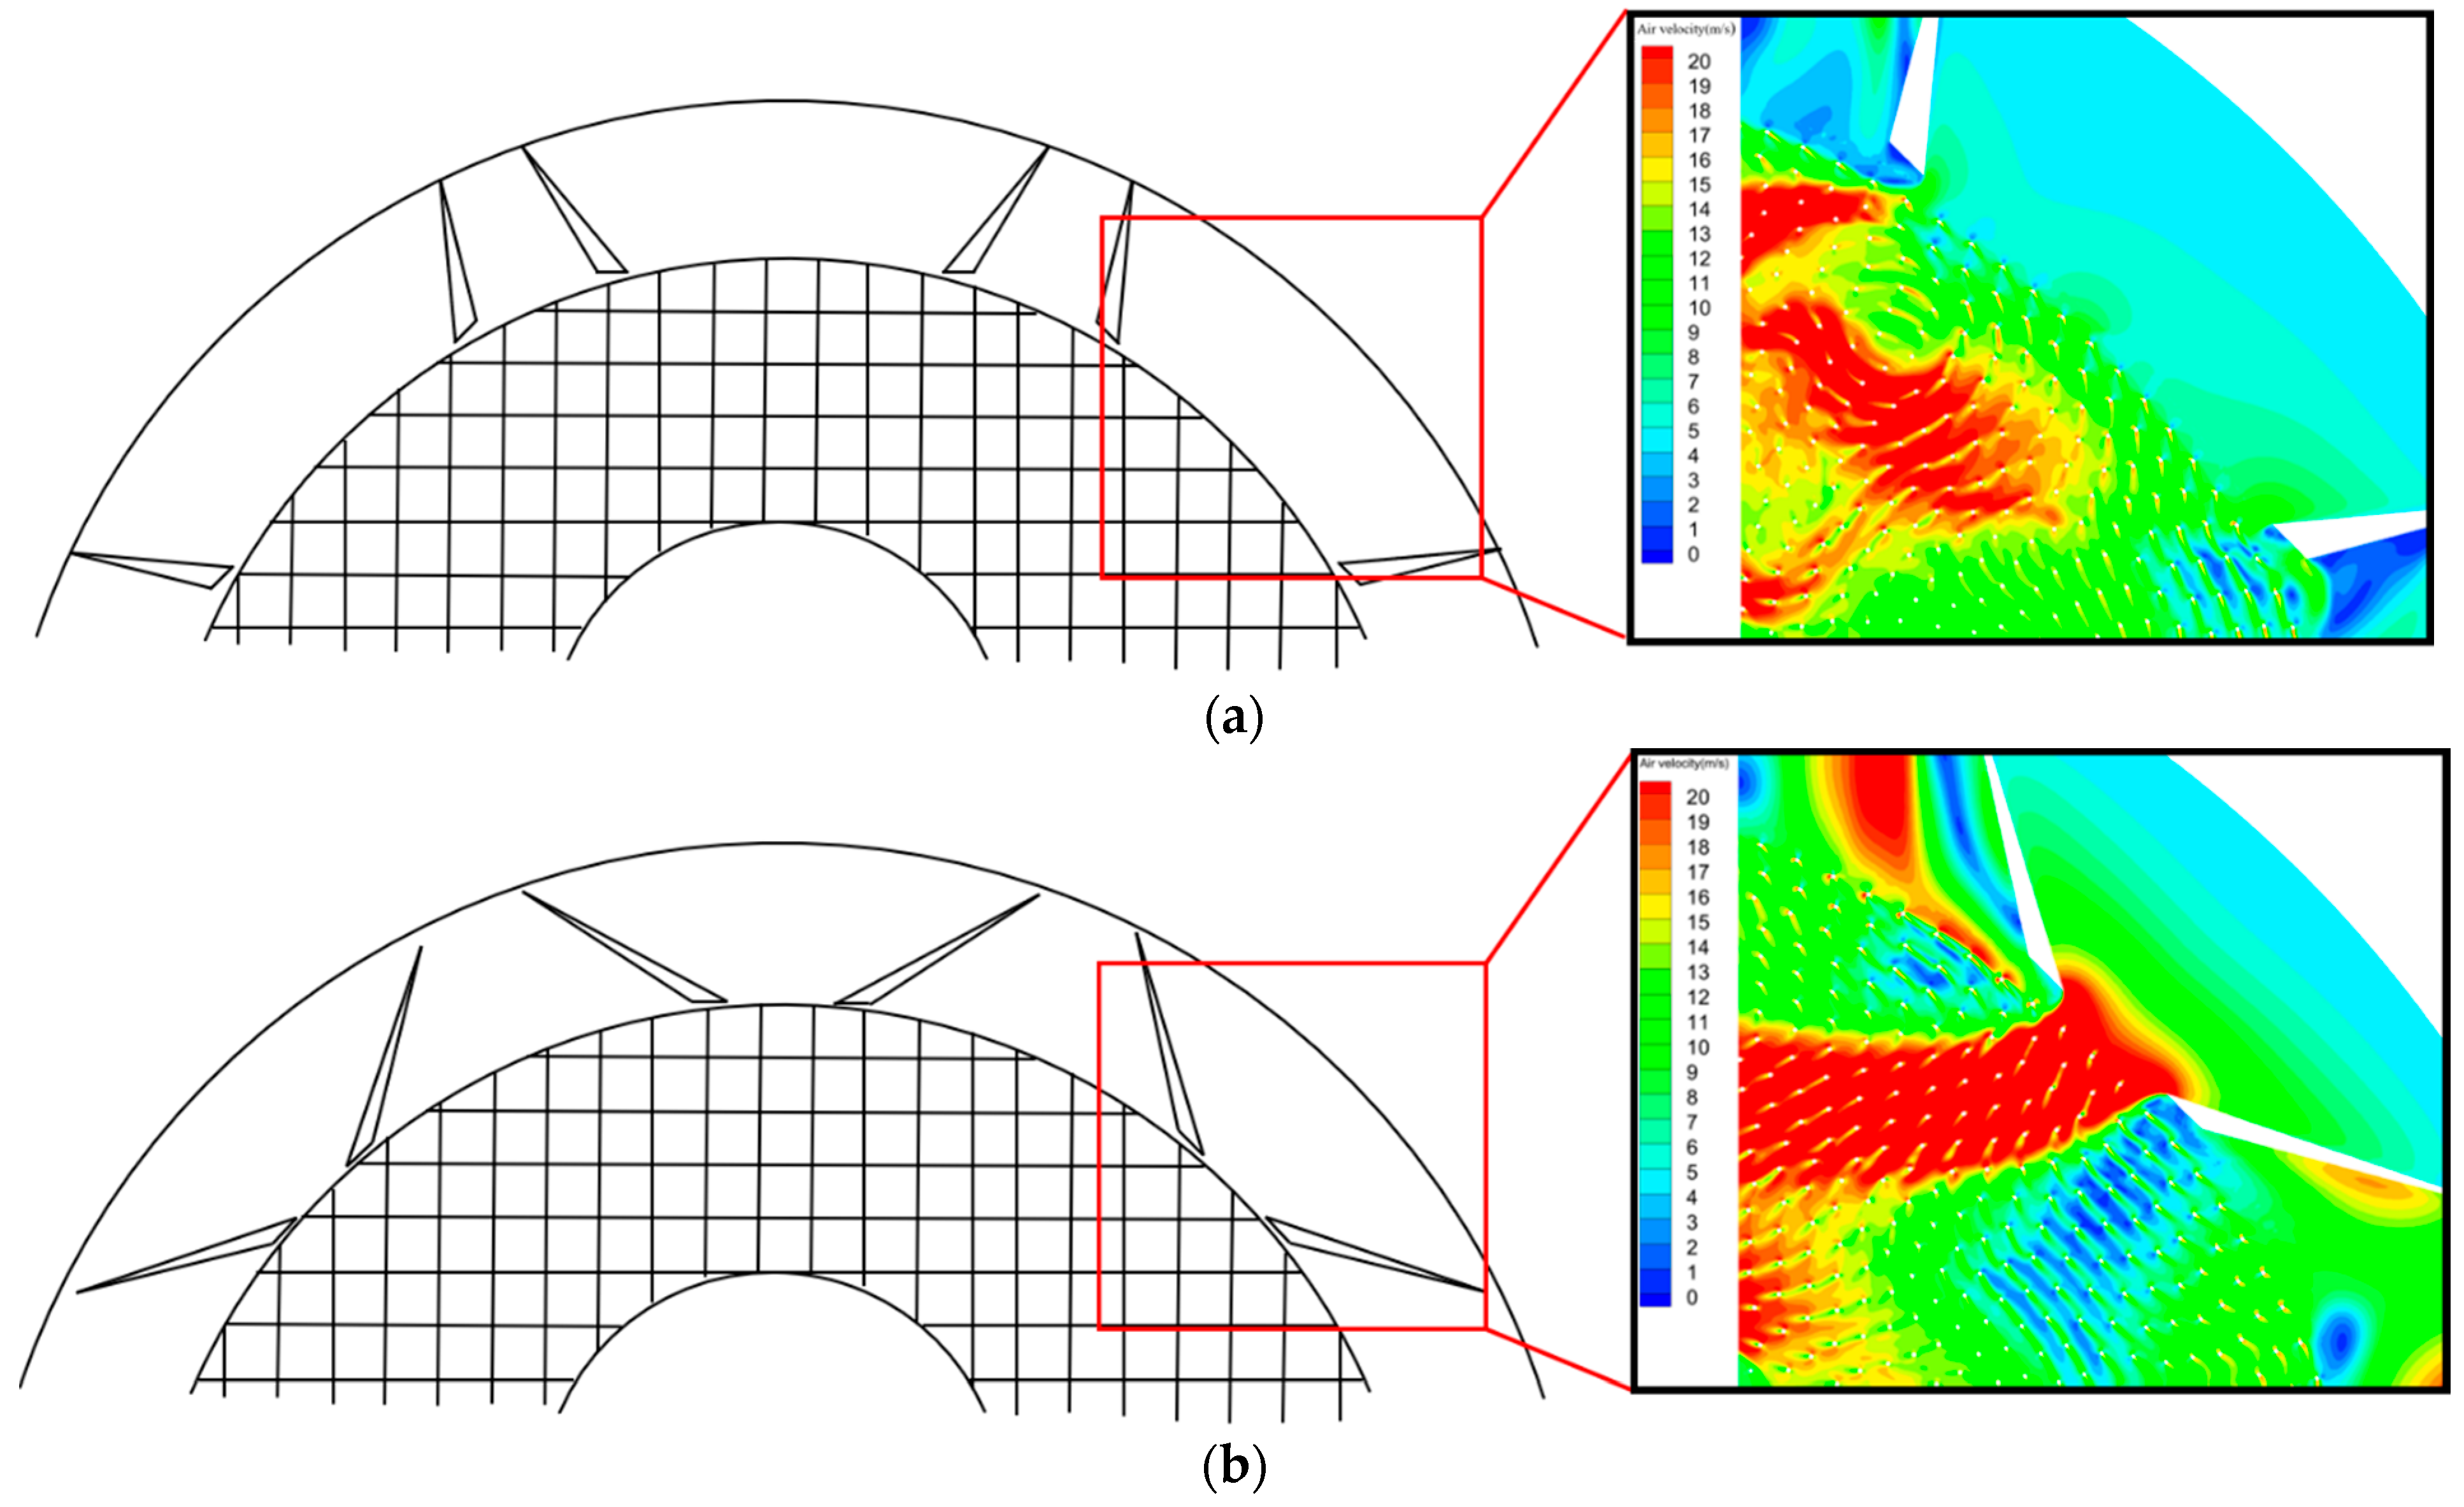
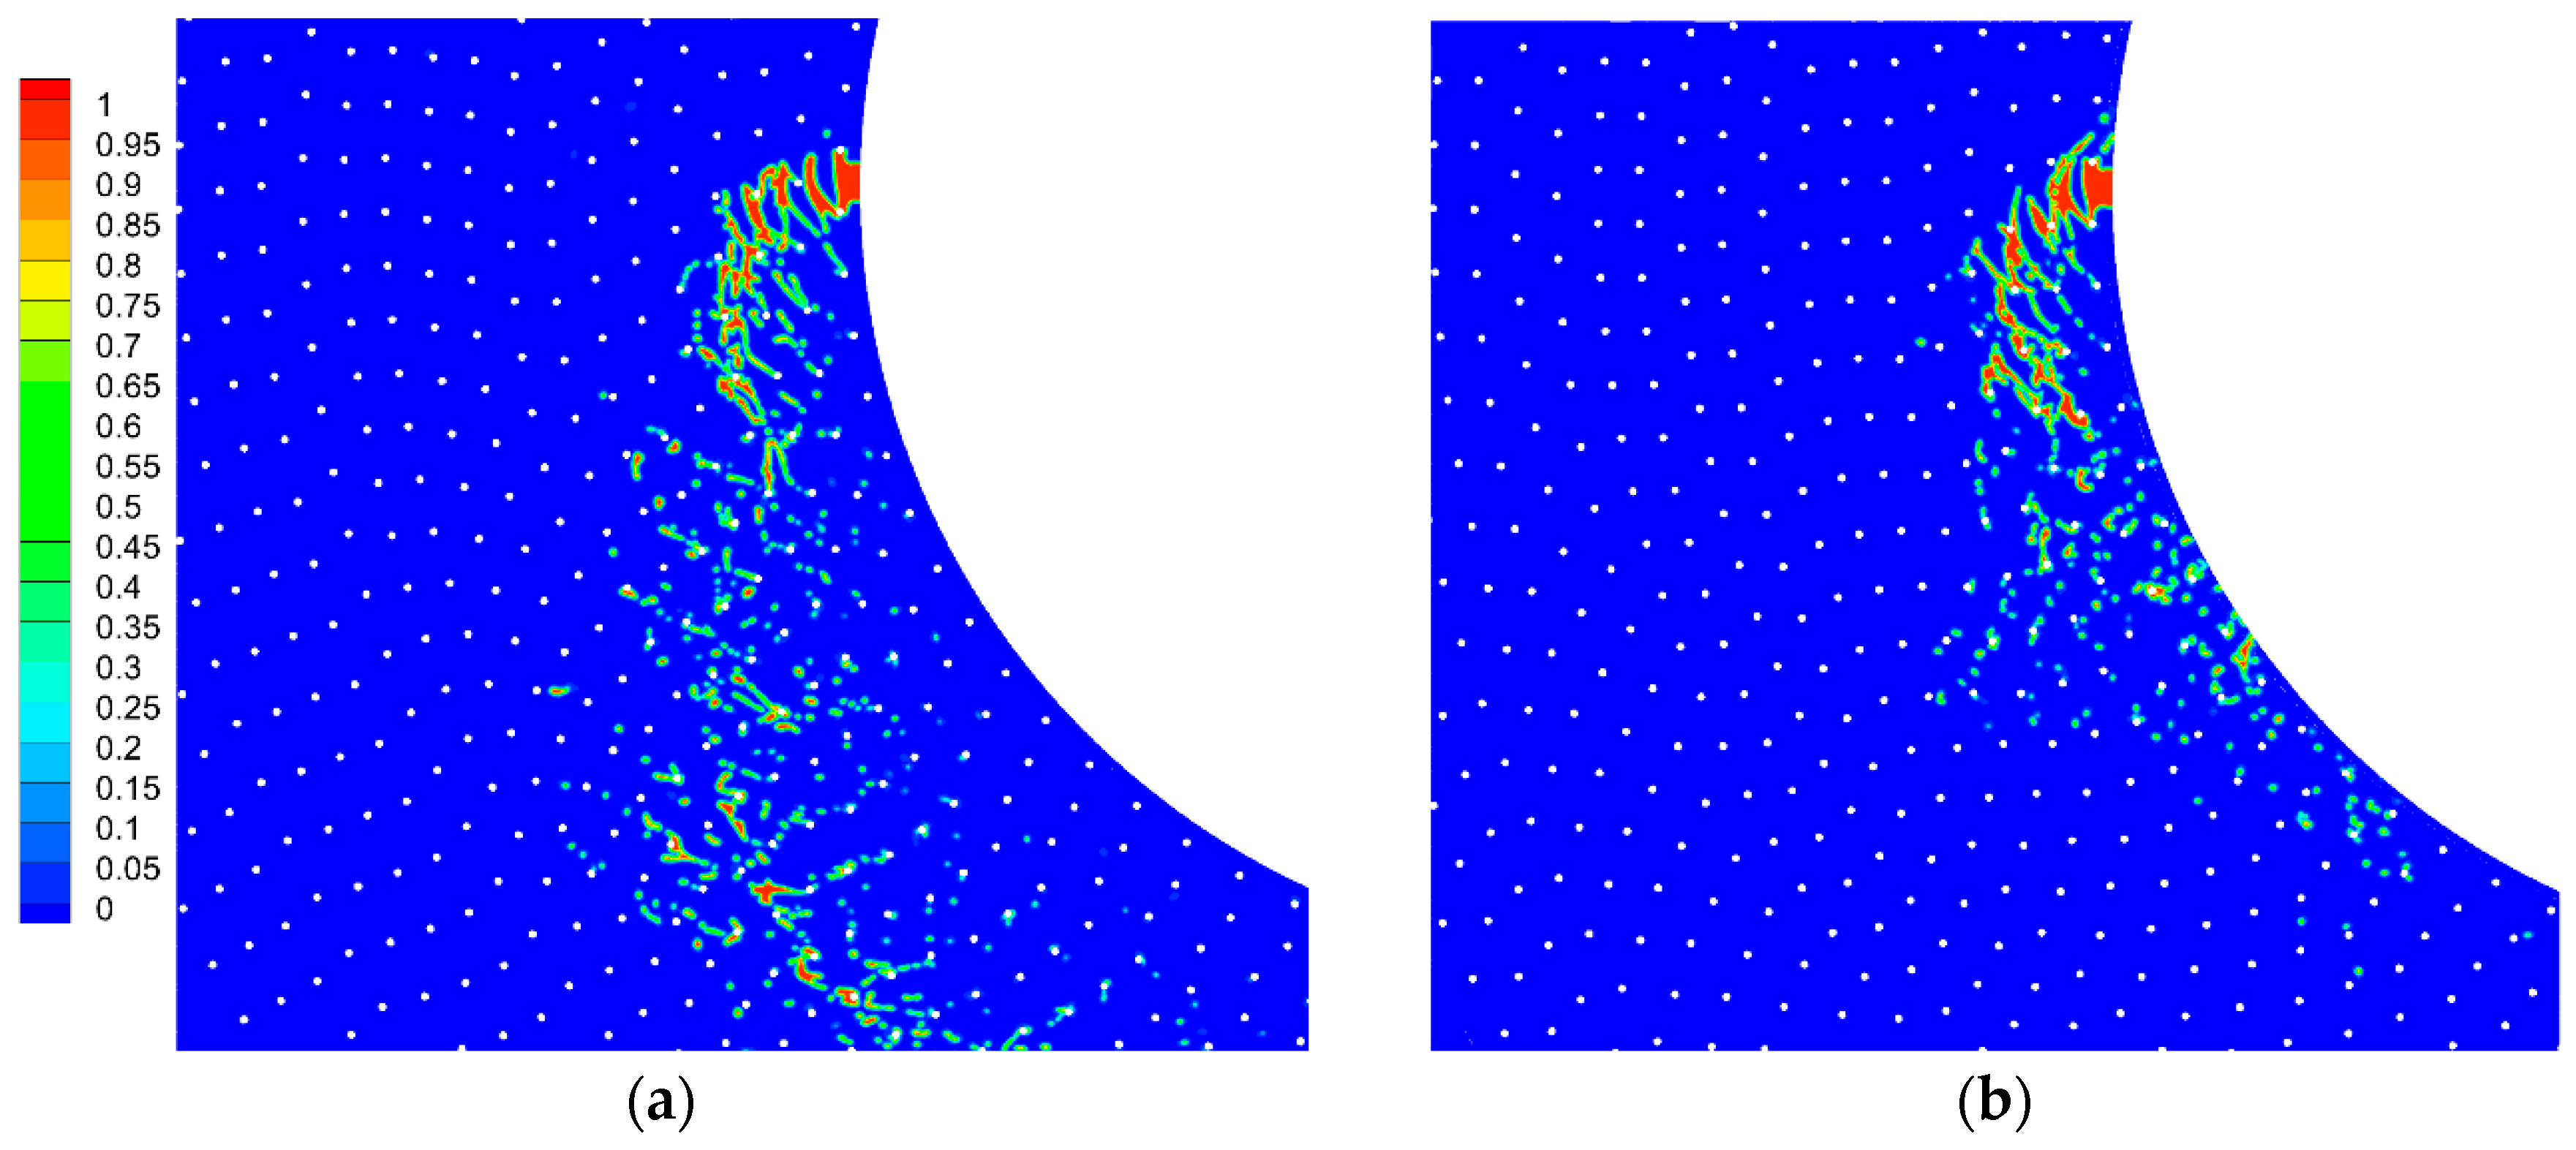
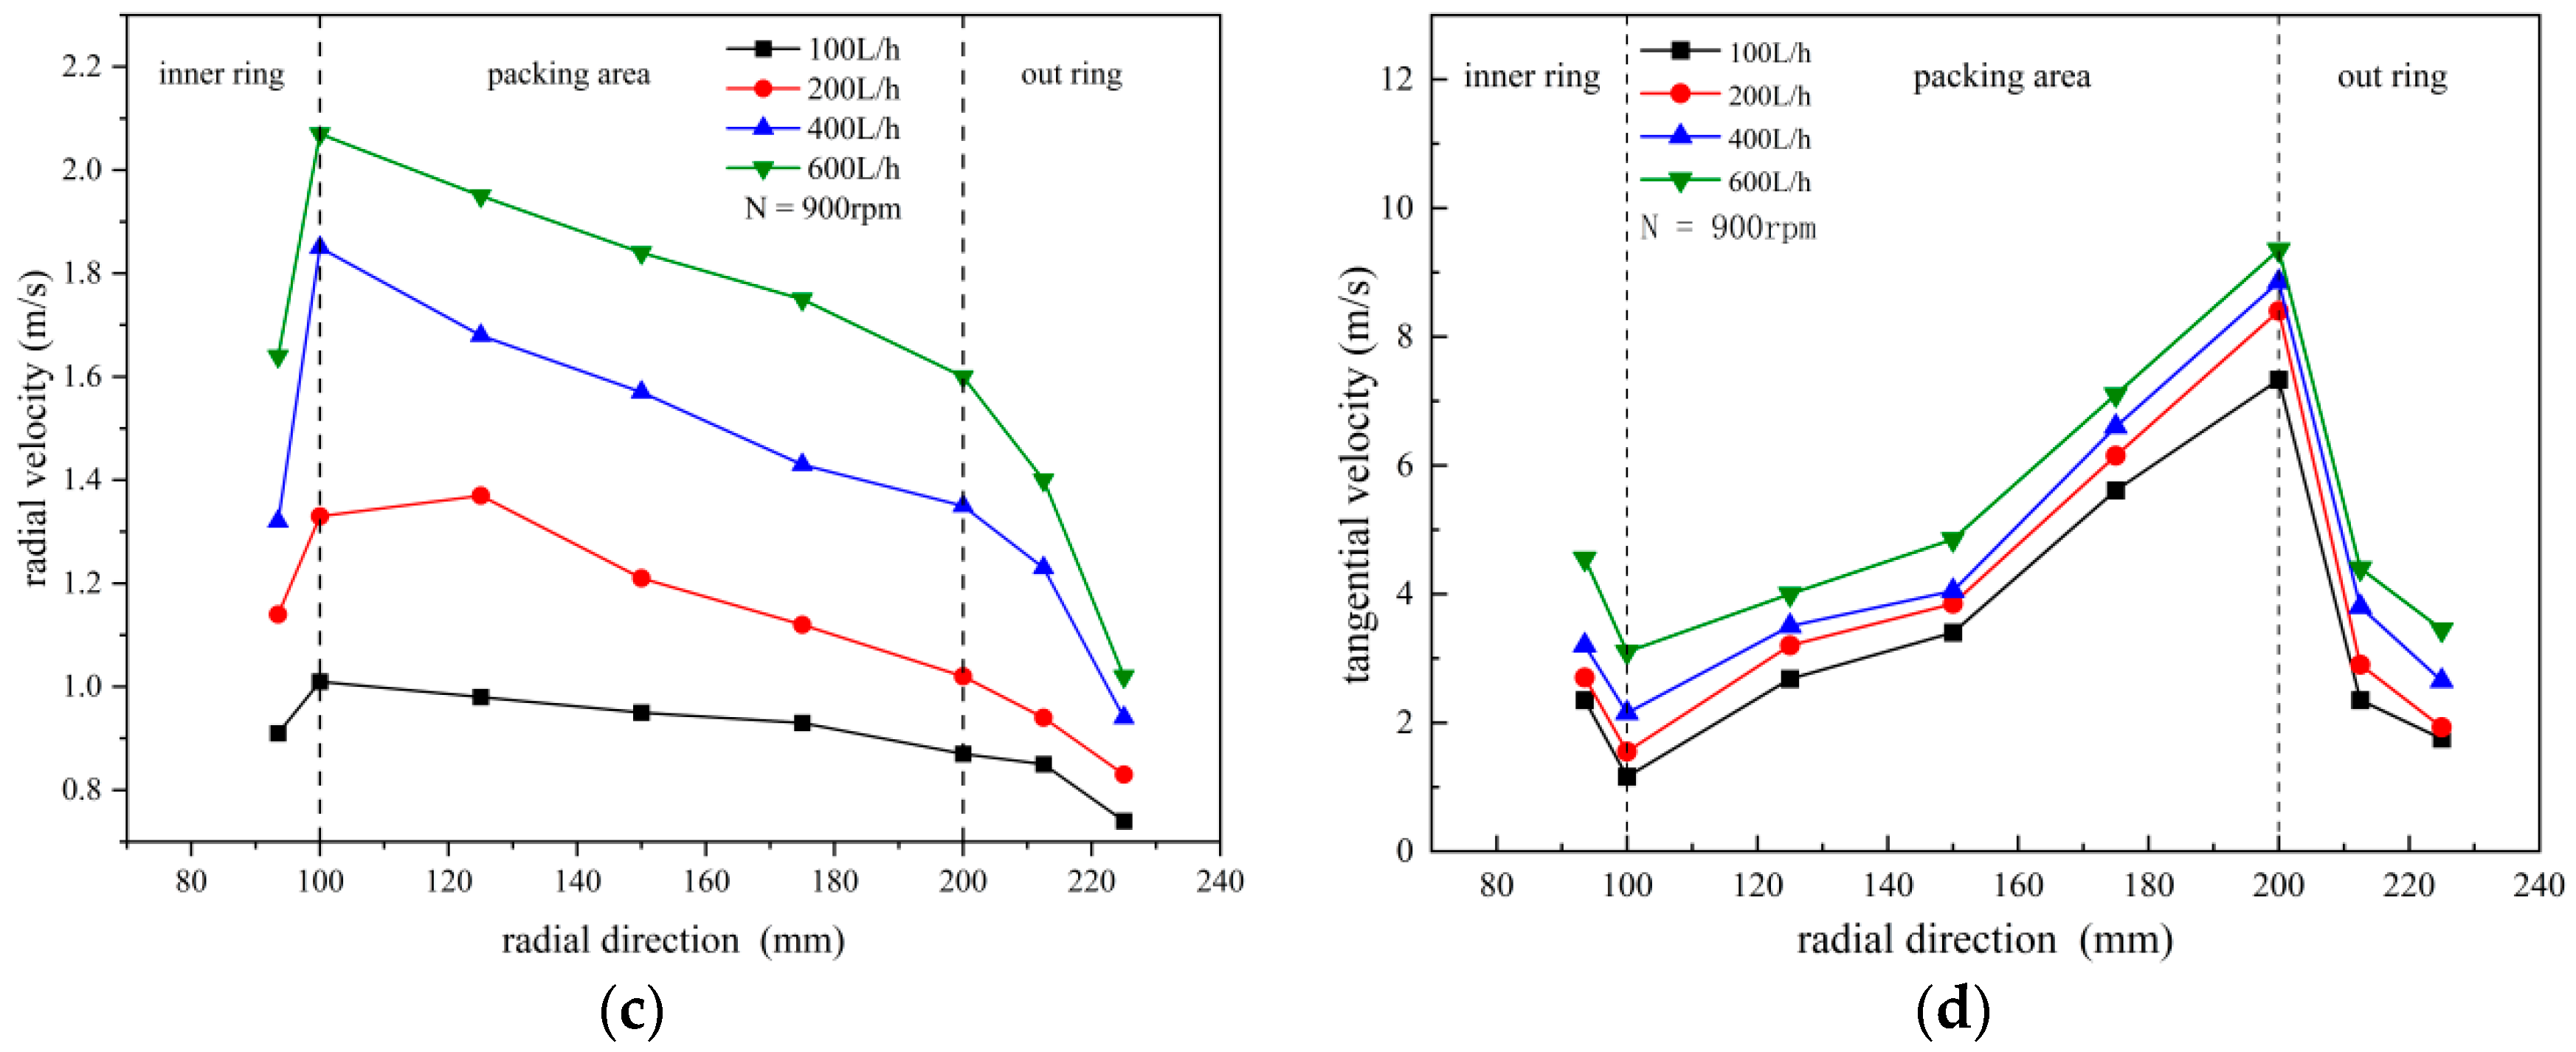
3.1. Gas–Liquid Flow Field

In the countercurrent rotating packed bed, liquid is sprayed onto the annular zone of the packing with a liquid distributor and then cut and dispersed into micro/nano-sized liquid threads and films with the high-speed rotating packing, which are repeatedly merged and dispersed in the packing. Driven by pressure, the gas comes into contact with the liquid in a countercurrent manner as it flows along the spiral paths from the outer to the inner zone of the packing, and the collision between the gas and the liquid and packing forms a complex internal flow field. Therefore, a better understanding of the flow field distribution is of great significance in order to elucidate the dust removal mechanism and optimize the process and equipment. As shown in Figure 5, the gas flow rate has an impact on the liquid flow patterns and paths. Figure 5a,b shows the liquid flow pattern at different gas volumes. As shown in the Figure 5a, at lower gas flow rates, it has minimal influence on the liquid distribution, because the drag force exerted by the reverse gas flow on the liquid is much smaller than the disturbance caused by the high-speed rotation of the packing to the flow field. As the gas flow rate increases, a large amount of liquid is driven towards the gas outlet by the drag force, leading to the entrainment of gas bubbles, as shown in Figure 5b. As shown in Figure 5c, when the gas flows into the cavity at lower velocities, the strong vortices generated by the packing cause a significant disturbance to the gas phase and, thus, form more vortices and backflow. However, an excessive gas volume will cause the gas to quickly leave the packing area without sufficient contact with the liquid, resulting in a greatly shortened residence time and a reduced dust removal effect.
In summary, the gas volume has an effect on the liquid phase distribution and gas–liquid contact time, the latter of which is a key factor affecting the wet dust removal efficiency. Inside of the packing, both liquid and gas phases undergo irregular helical motion at an extremely high speed, making it difficult to quantitatively analyze them using conventional methods. The method used in this study is as follows: After the flow field reaches a quasi-steady state, nitrogen gas with a volume fraction of one is introduced at the inlet, while the other boundary conditions are kept unchanged. Five measurement points are uniformly set along the circumference inside of the packing to measure the nitrogen gas concentration. The time at which the nitrogen gas is detected at all five of the measurement points is taken as the gas–liquid contact time. Figure 6 shows the influence of the rotational speed and the gas flow rate on the gas–liquid contact time. Increasing the gas flow rate will increase the initial kinetic energy of the gas and reduce the gas flow path in the packing, thus resulting in a significant decrease in residence time. However, the rotational speed has a minimal effect on the gas velocity, because it can hardly affect the radial velocity distribution of the flow field. Therefore, the gas residence time in the rotating packed bed is inversely proportional to the gas flow rate, and an increase in residence time is conducive to the capture of dust by droplets and liquid films within the packing. Excessively high gas flow rates lead to a reduction in the residence time of dust-laden gas, resulting in a lower overall dust removal efficiency.

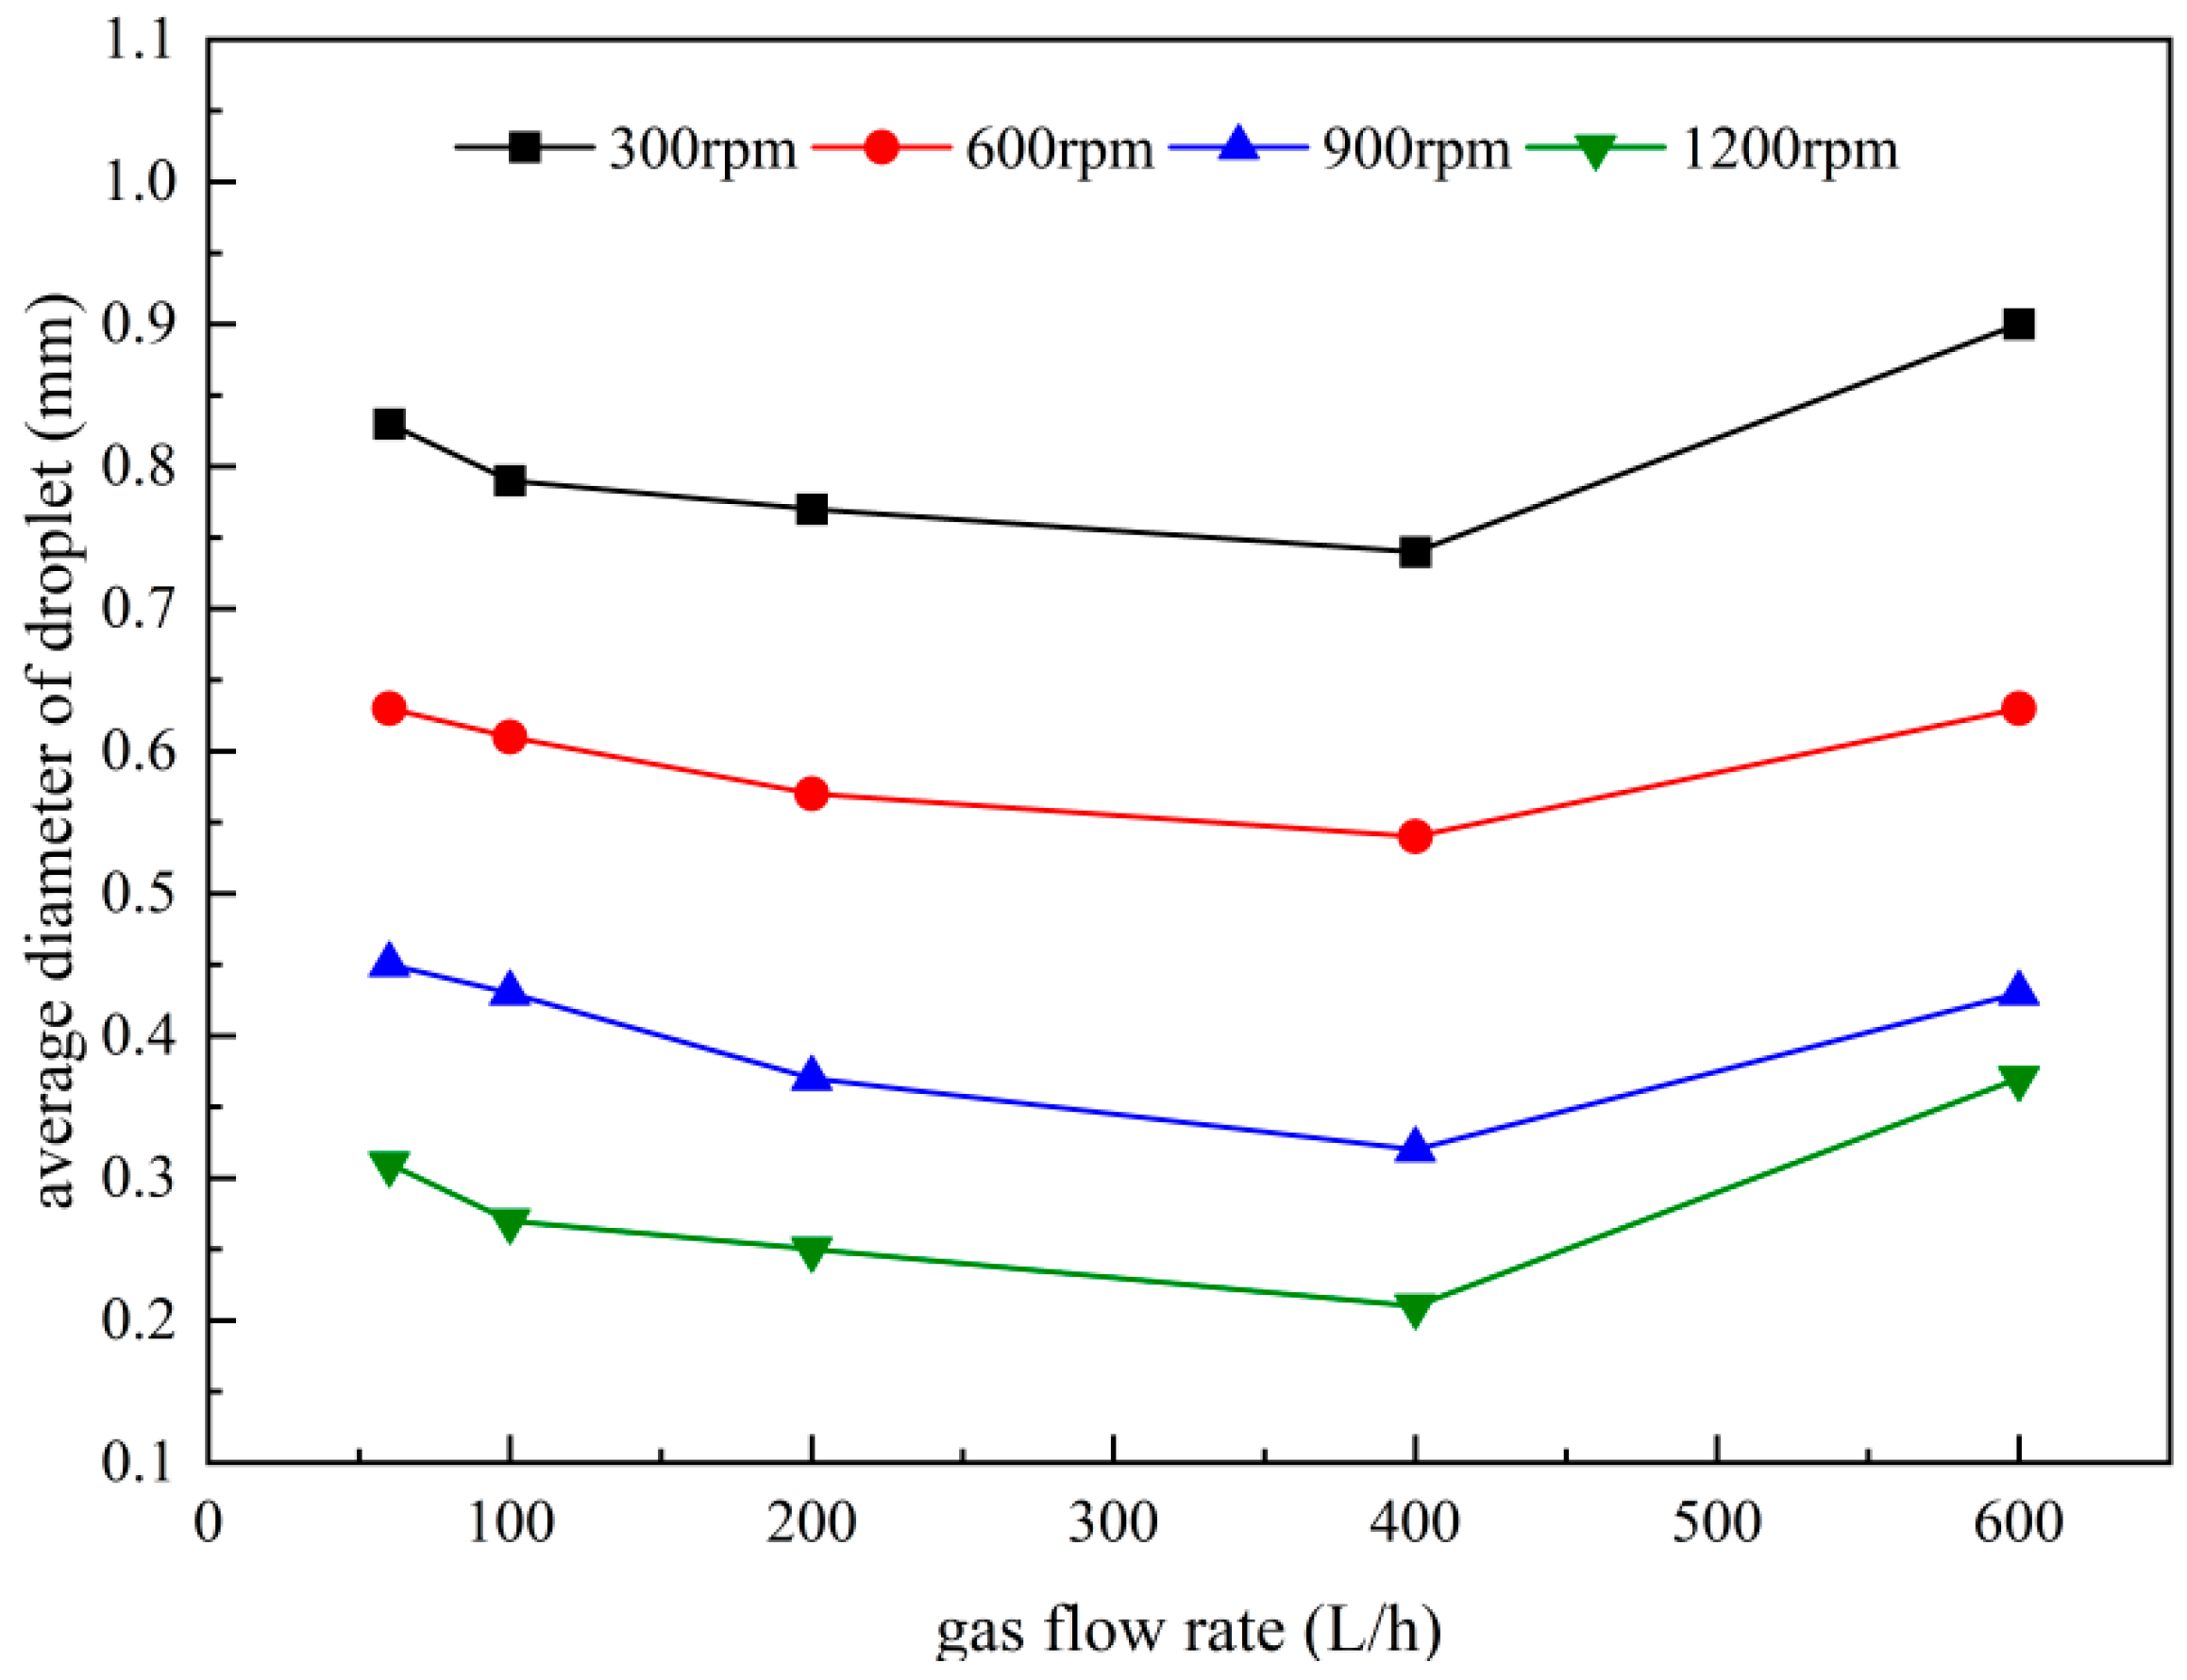
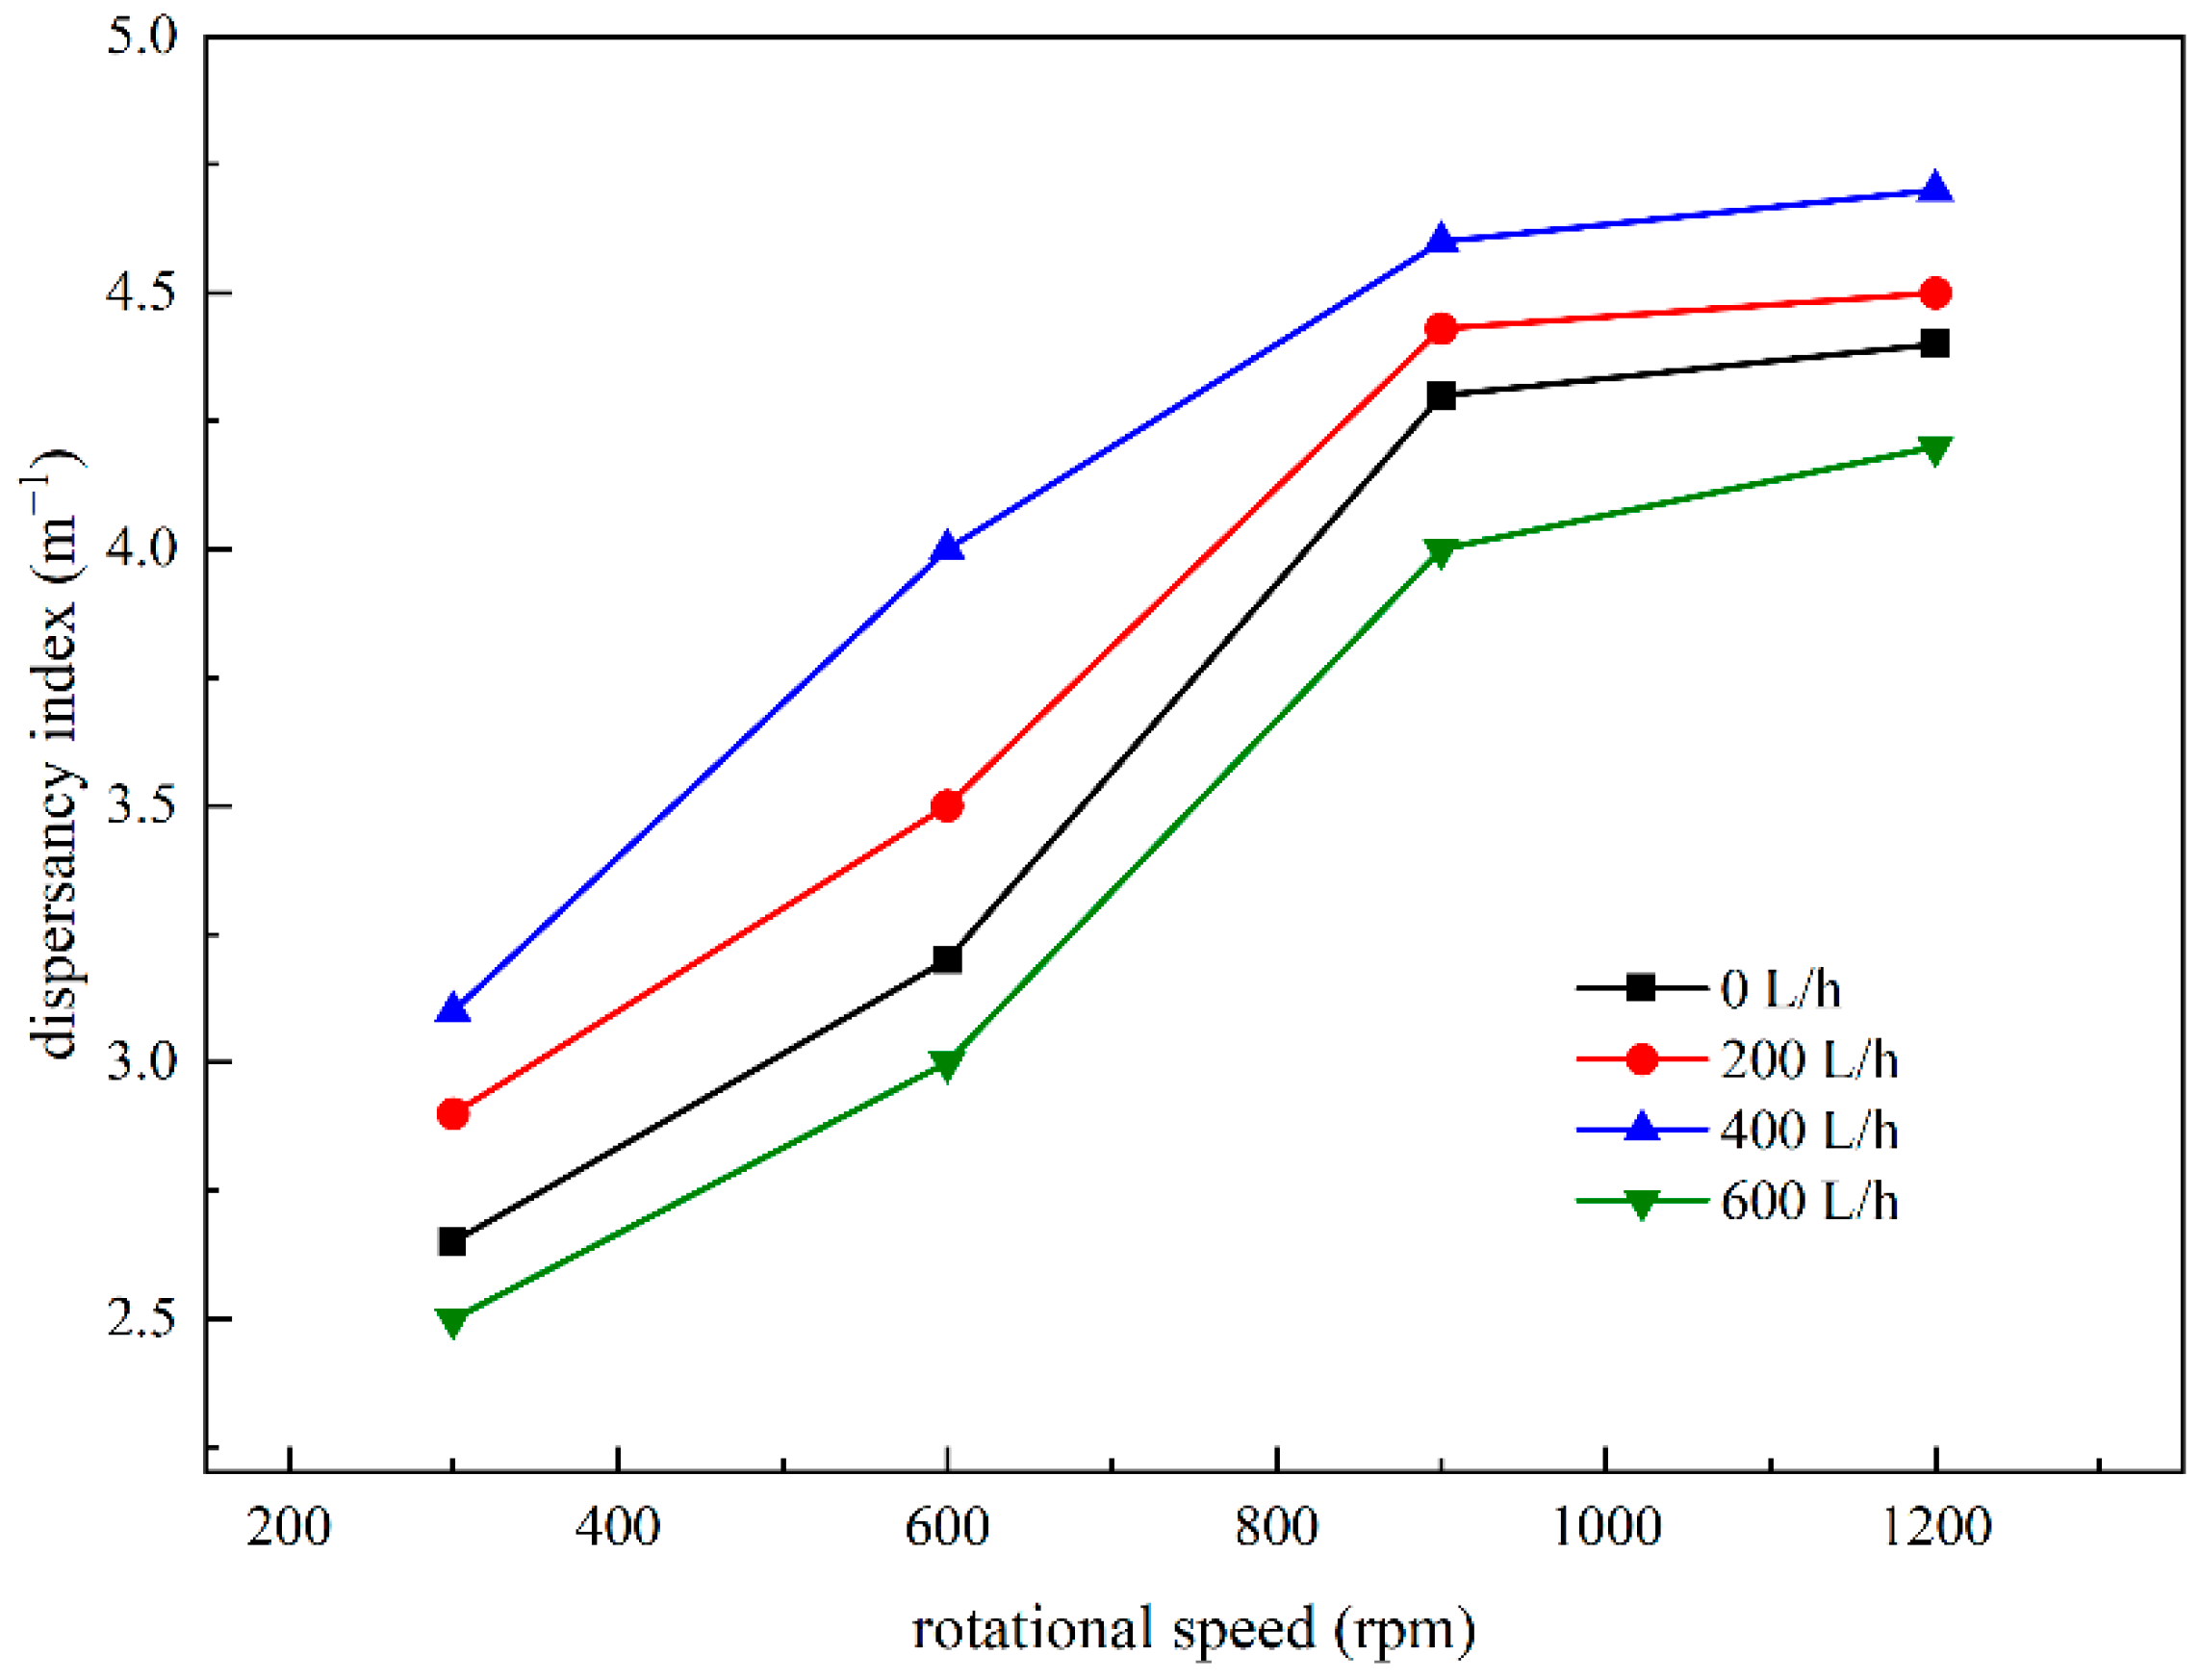
3.2. Liquid Droplet Size

The droplet size distribution is one of the key factors influencing the inertial capture efficiency. This section explores the droplet distribution in the two-phase flow field under different operating conditions, as well as the droplet size distribution and dispersion. The flow field distribution with a clear gas–liquid interface is simulated using the VOF model, and the droplet parameters are calculated using Image-Pro Plus 6.0. The watershed split method is employed to separate the contours of agglomerated droplets in order to improve the accuracy of the structure.
The effect of the gas flow rate on the average droplet diameter is shown in Figure 7. As the gas flow rate increases, the average droplet diameter initially decreases and then increases. In the horizontal direction, the liquid is influenced by the centrifugal force and the drag force in opposing directions. At low gas flow rates, the gas has little influence on the flow pattern of the liquid in the packing. Increasing the gas flow rate slightly increases the residence time of the liquid and the collision between the liquid and the packing, thereby increasing the cutting efficiency of the packing and decreasing the average droplet diameter. However, as the gas flow rate further increases, the centrifugal force acting on the liquid is reduced, especially for the liquid near the inner edge of the packing, and, consequently, the net force acting on the droplets in the horizontal direction is also reduced. This makes it difficult to overcome the surface tension and, thus, leads to an increase in the average droplet diameter.
The average droplet diameter alone is insufficient to fully describe the droplet size distribution. In the high-gravity wet dust removal processes, droplet dispersion is an important indicator of dust removal efficiency. An increase in droplet dispersion can increase not only the interfacial area between the gas and liquid phases, but also the capture of fine particulate matter under the same liquid-to-gas ratio. When the liquid is dispersed into smaller droplets or threads, the inertial capture efficiency is enhanced and, consequently, the dust removal efficiency is also improved. Guo et al. [17] established the following three-dimensional packing model to calculate the three-dimensional interfacial area of the liquid phase:
A S = A l i q u i d V p a c k i n g  
where A l i q u i d is the droplet surface area and V p a c k i n g is the packing area. It has been found that the specific interfacial area of the liquid increases with the increase in inlet velocity and rotational speed. In a two-dimensional plane, as the perimeters of the liquid threads and films are much smaller than those of droplets with the same mass, the droplet dispersion index for the two-dimensional calculation model used in this experiment can be defined as follows:
A d = A l S
where A l is the total perimeter of the droplet and S is the packing area. In the VOF model, a liquid volume fraction of 0.5 is used to define the gas–liquid interface [23]. Over 2000 droplets were measured under each operating condition to ensure the generality of the results. Figure 8 reveals that increasing the gas flow rate can increase the droplet dispersion index. Therefore, increasing the airflow allows the droplets to be dispersed into smaller ones, thereby increasing the interfacial area. However, at gas velocities that are too high, some droplets in the packing may collide, thus forming liquid threads and films and decreasing the gas–liquid contact area. As a result, the droplet dispersion index decreases.

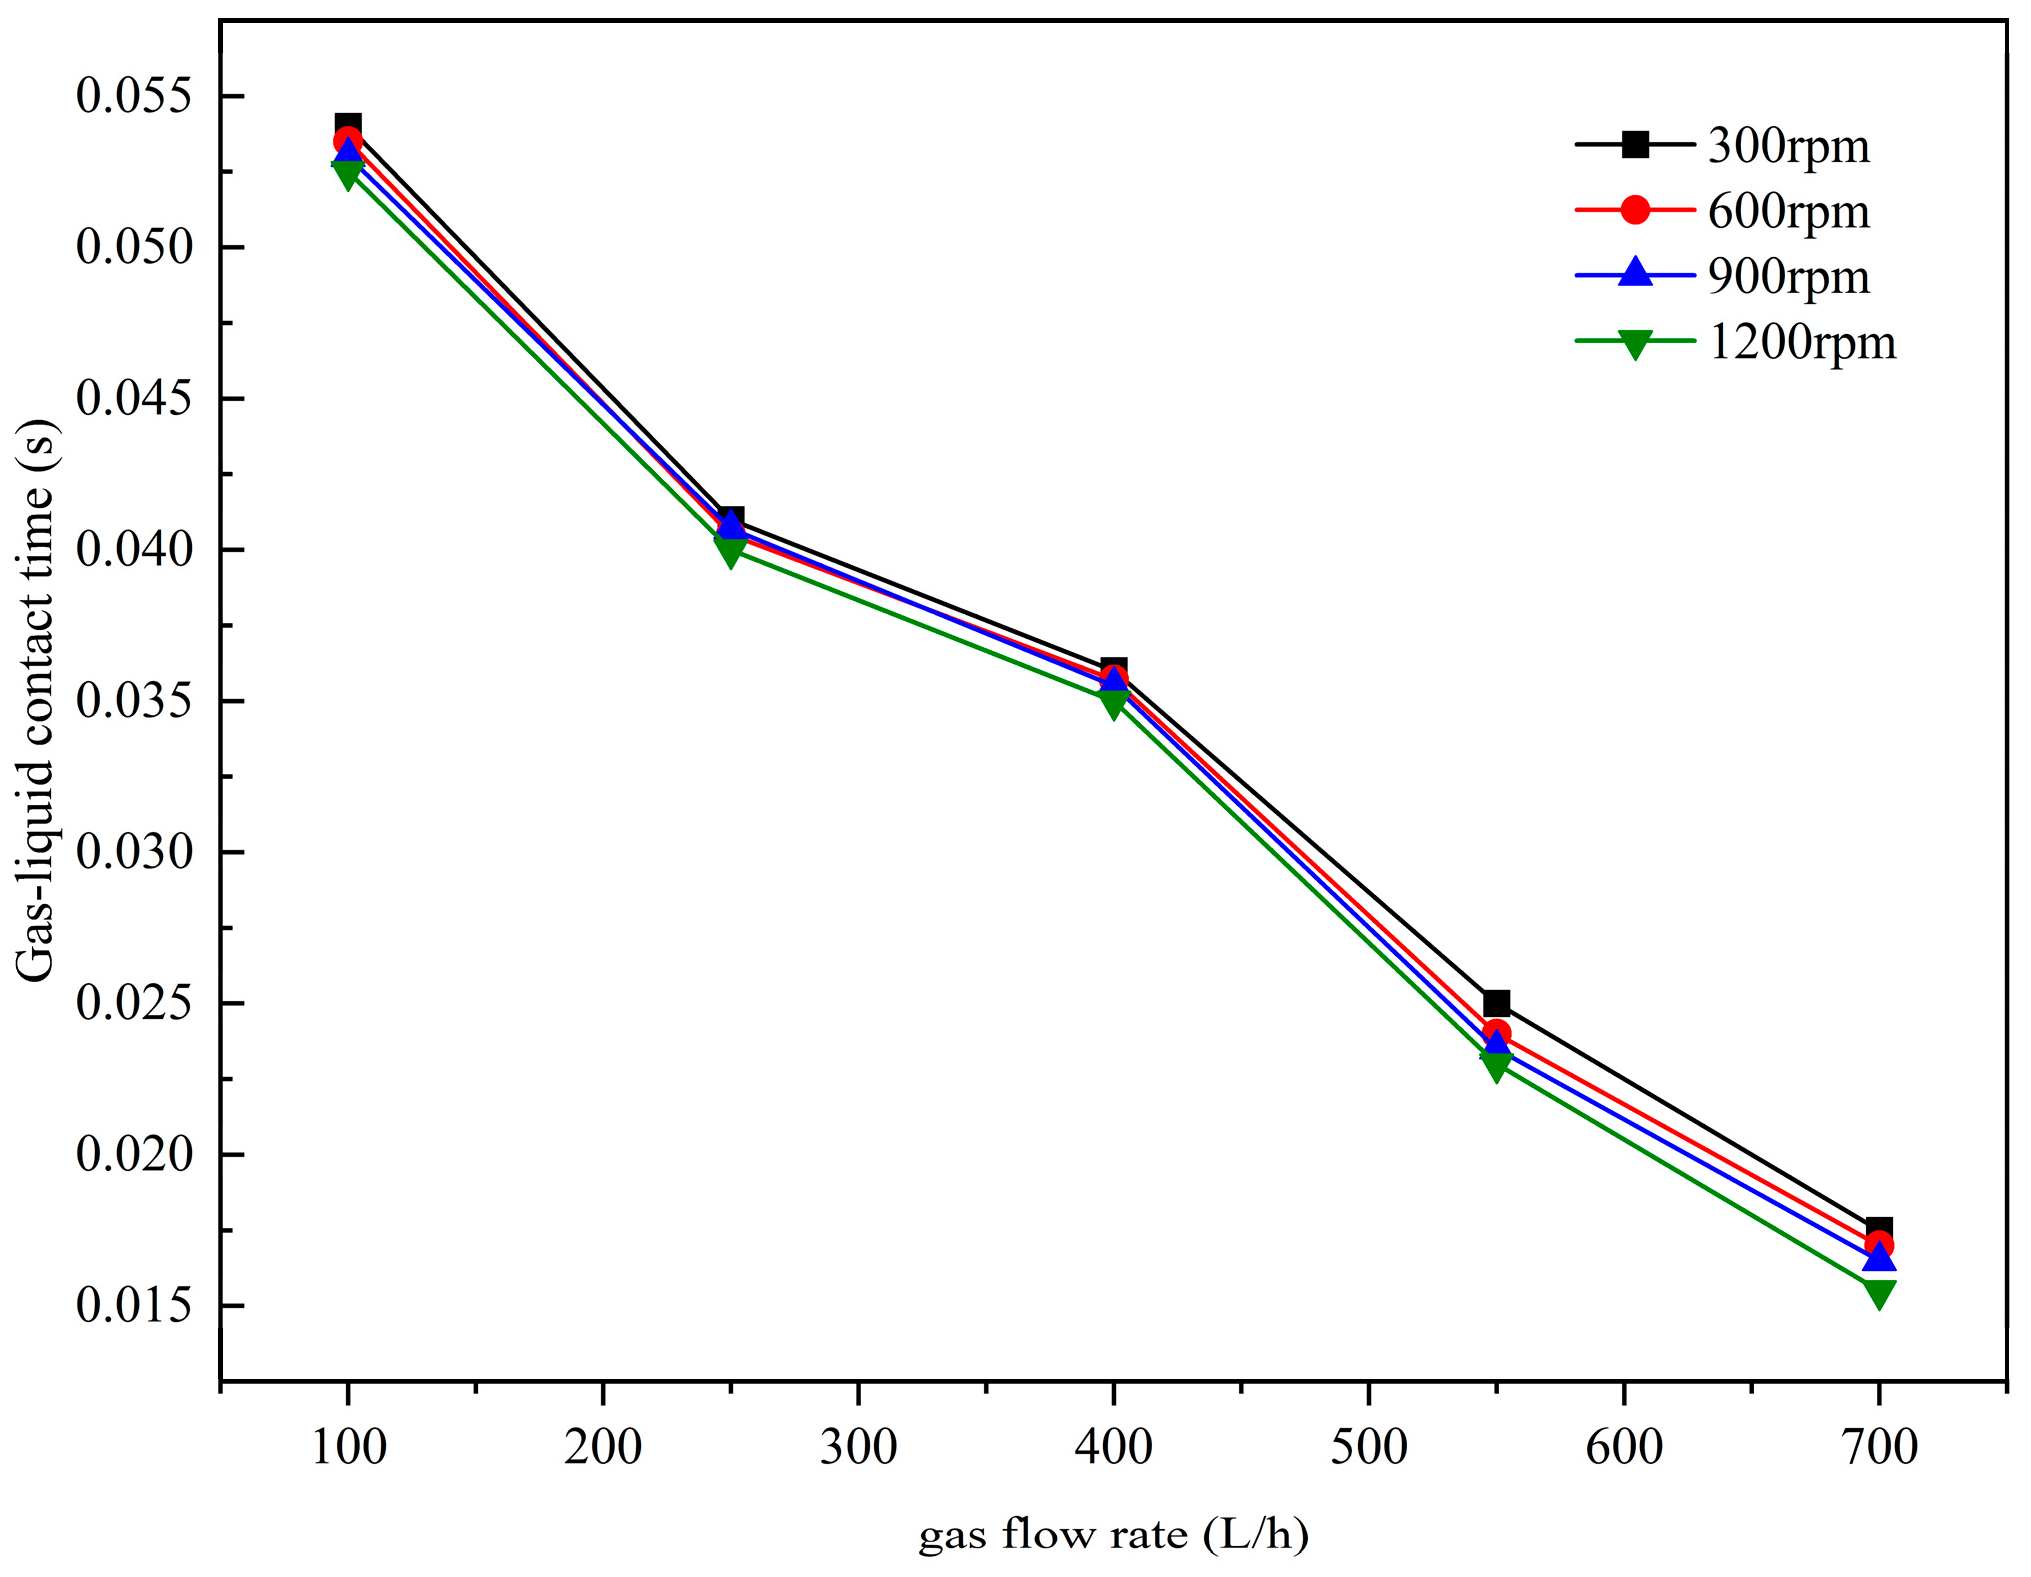
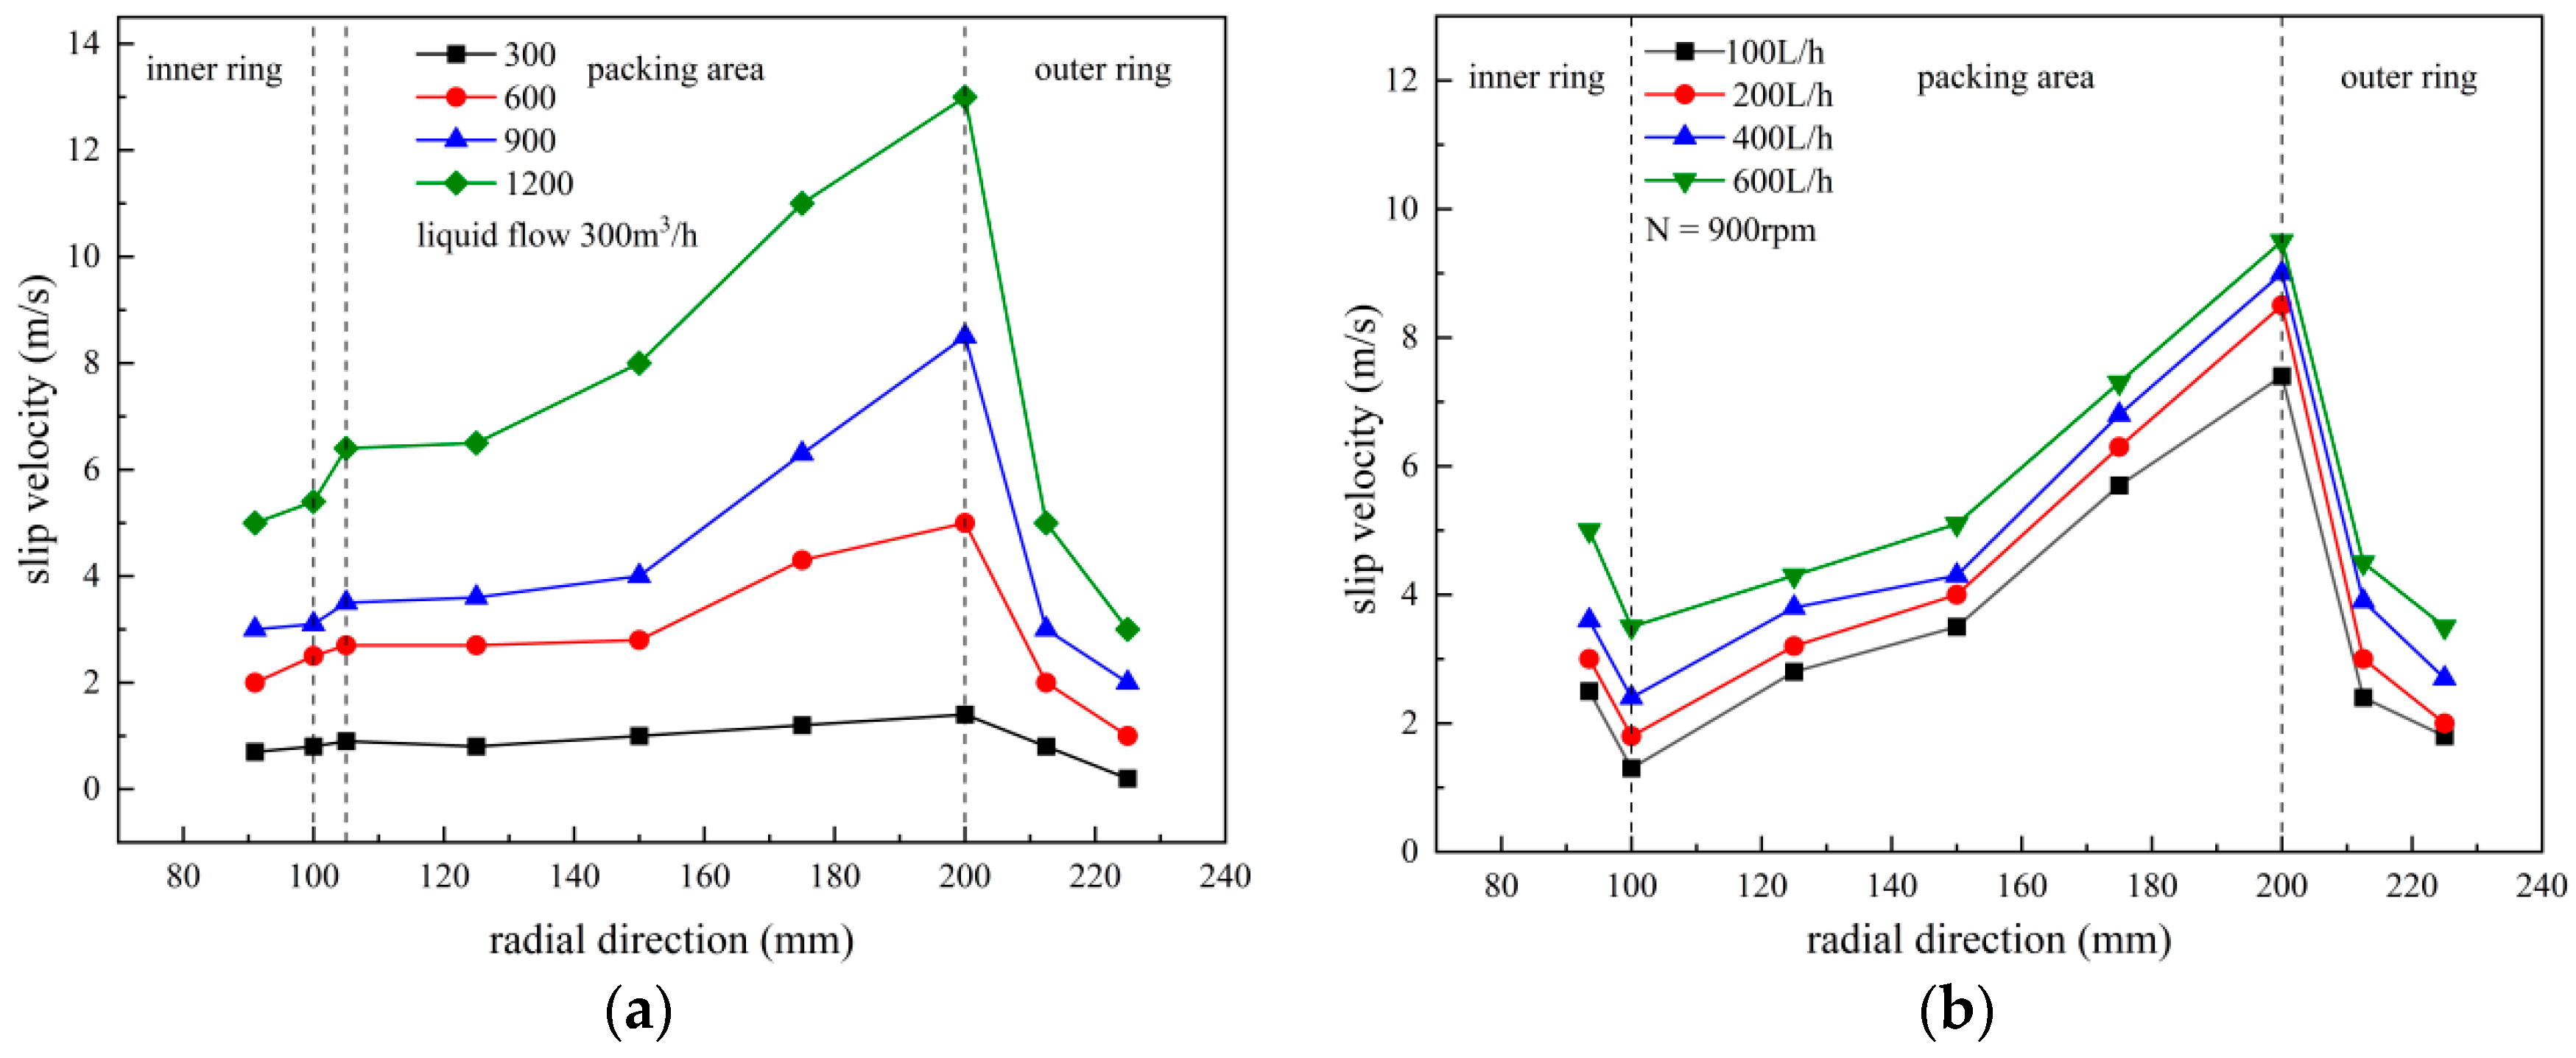
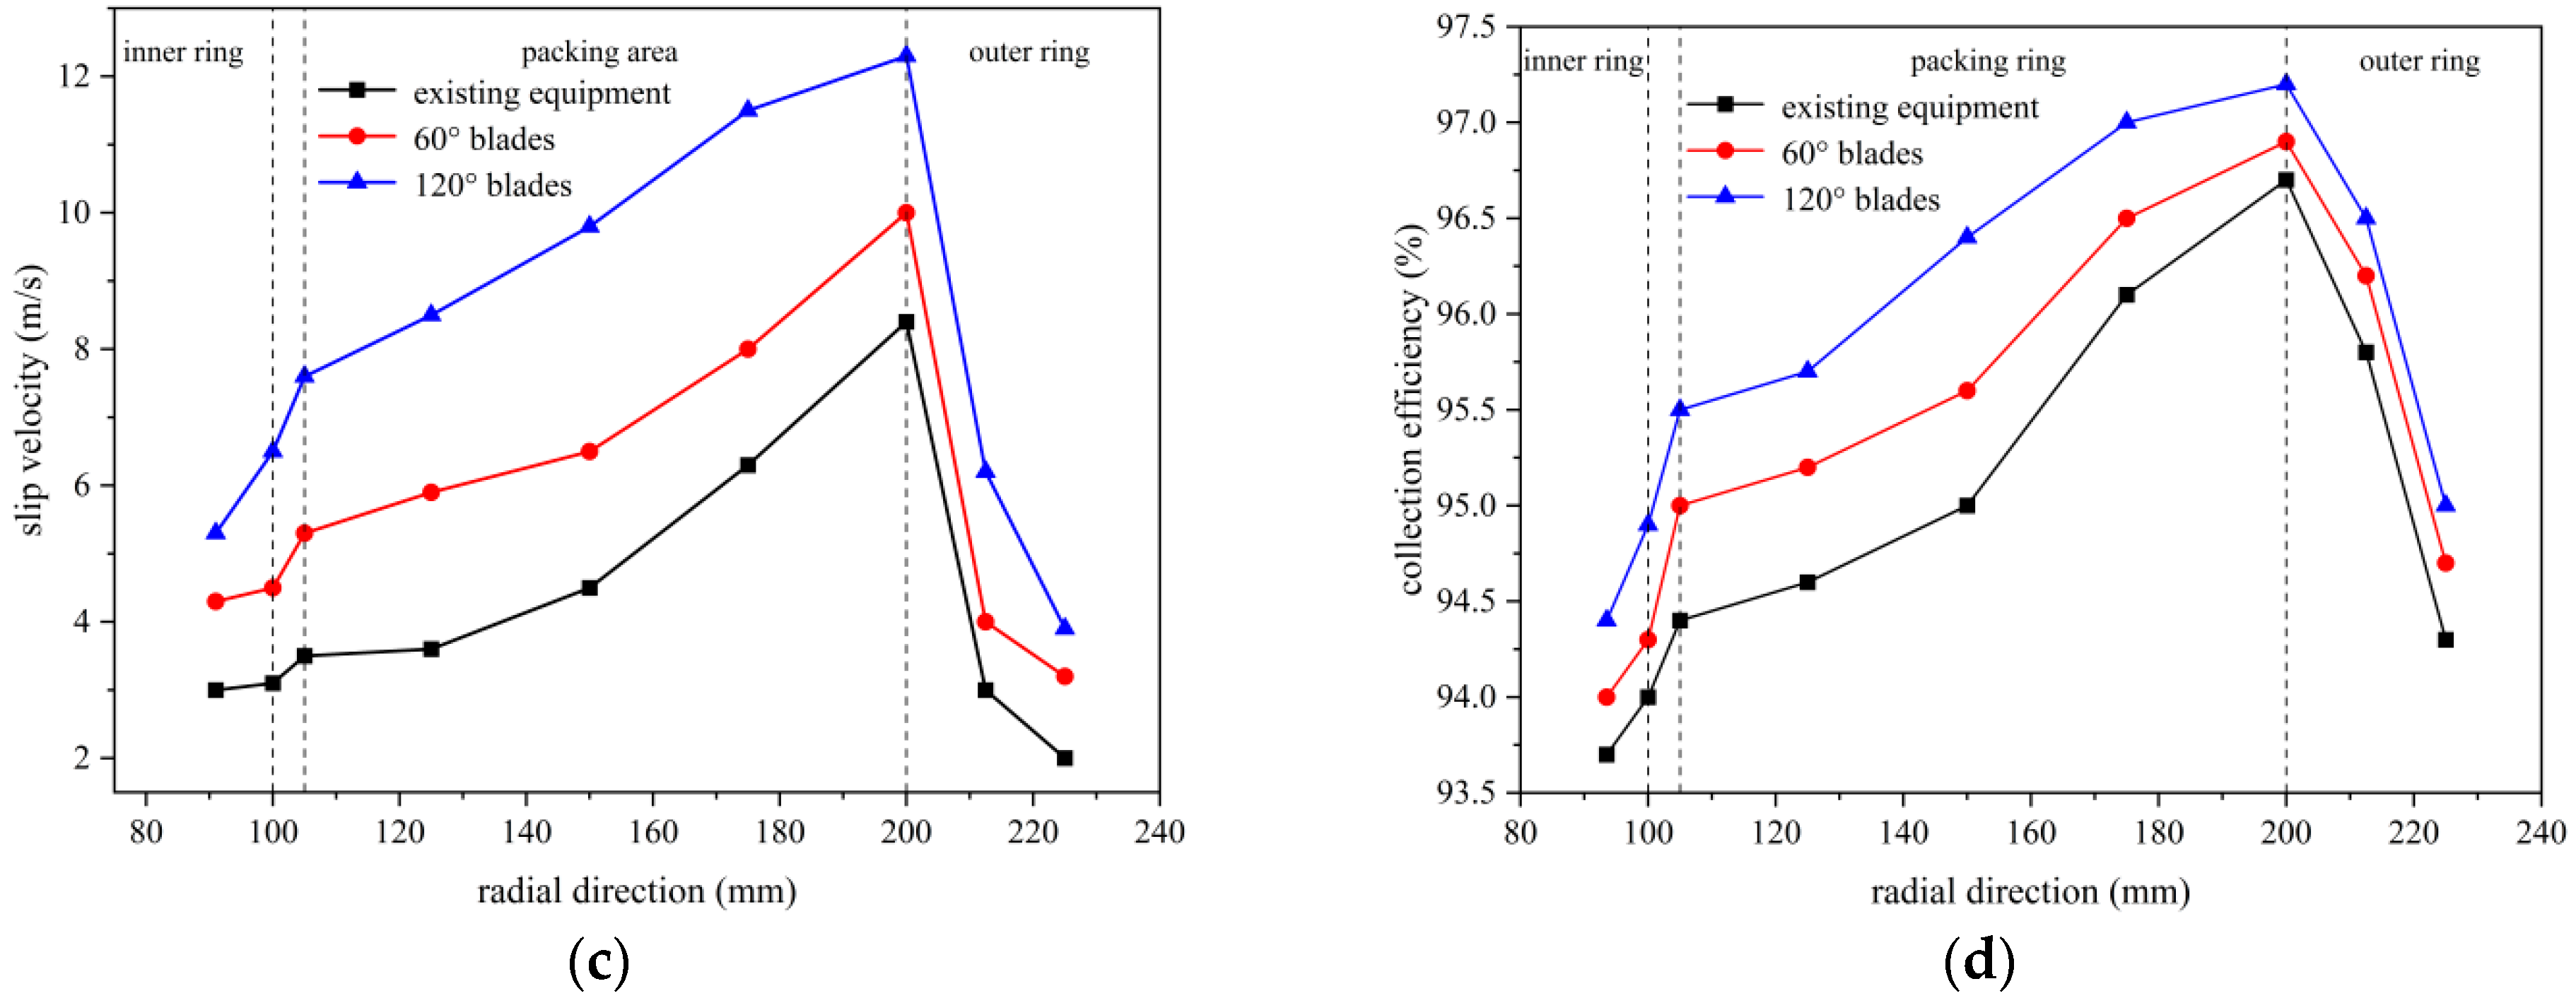
3.3. Gas–Liquid Slip Velocity

The slip velocity between the gas and liquid phases is also an important factor affecting the inertial capture efficiency. In a two-dimensional model, it is calculated as follows:
V s = [ u l x u a x 2 + u l y u a y 2 ] 1 2
Figure 9a shows the radial distribution of the gas–liquid slip velocity at different rotational speeds. The slip velocity varies within the inner cavity, the packing, and the void. Initially, the liquid in the inner ring of the packing flows at low velocities, while the gas undergoes rotational acceleration, due to the rotation of the packing. Notably, the smaller cross-sectional area of the gas passage in this region results in higher gas velocities and, therefore, higher slip velocities between the two phases. At the moment of entering the packing, the tangential velocity of the liquid (which is initially 0) rapidly increases due to the cutting effect of the packing, thus leading to a rapid increase in the slip velocity. This special fluid mechanics effect is also called the end effect. As the liquid enters the void where there is no cutting effect from the packing, the slip velocity rapidly decreases. Therefore, an increase in the rotational speed leads to more significant changes in the velocities of both the gas and liquid phases, which is the main reason for the increase in the gas–liquid slip velocity. Figure 9b,c show the effect of the gas flow rate on the gas–liquid slip velocity. It has been found that increasing the gas flow rate increases the radial slip velocity, while its impact on the tangential velocity is minimal.

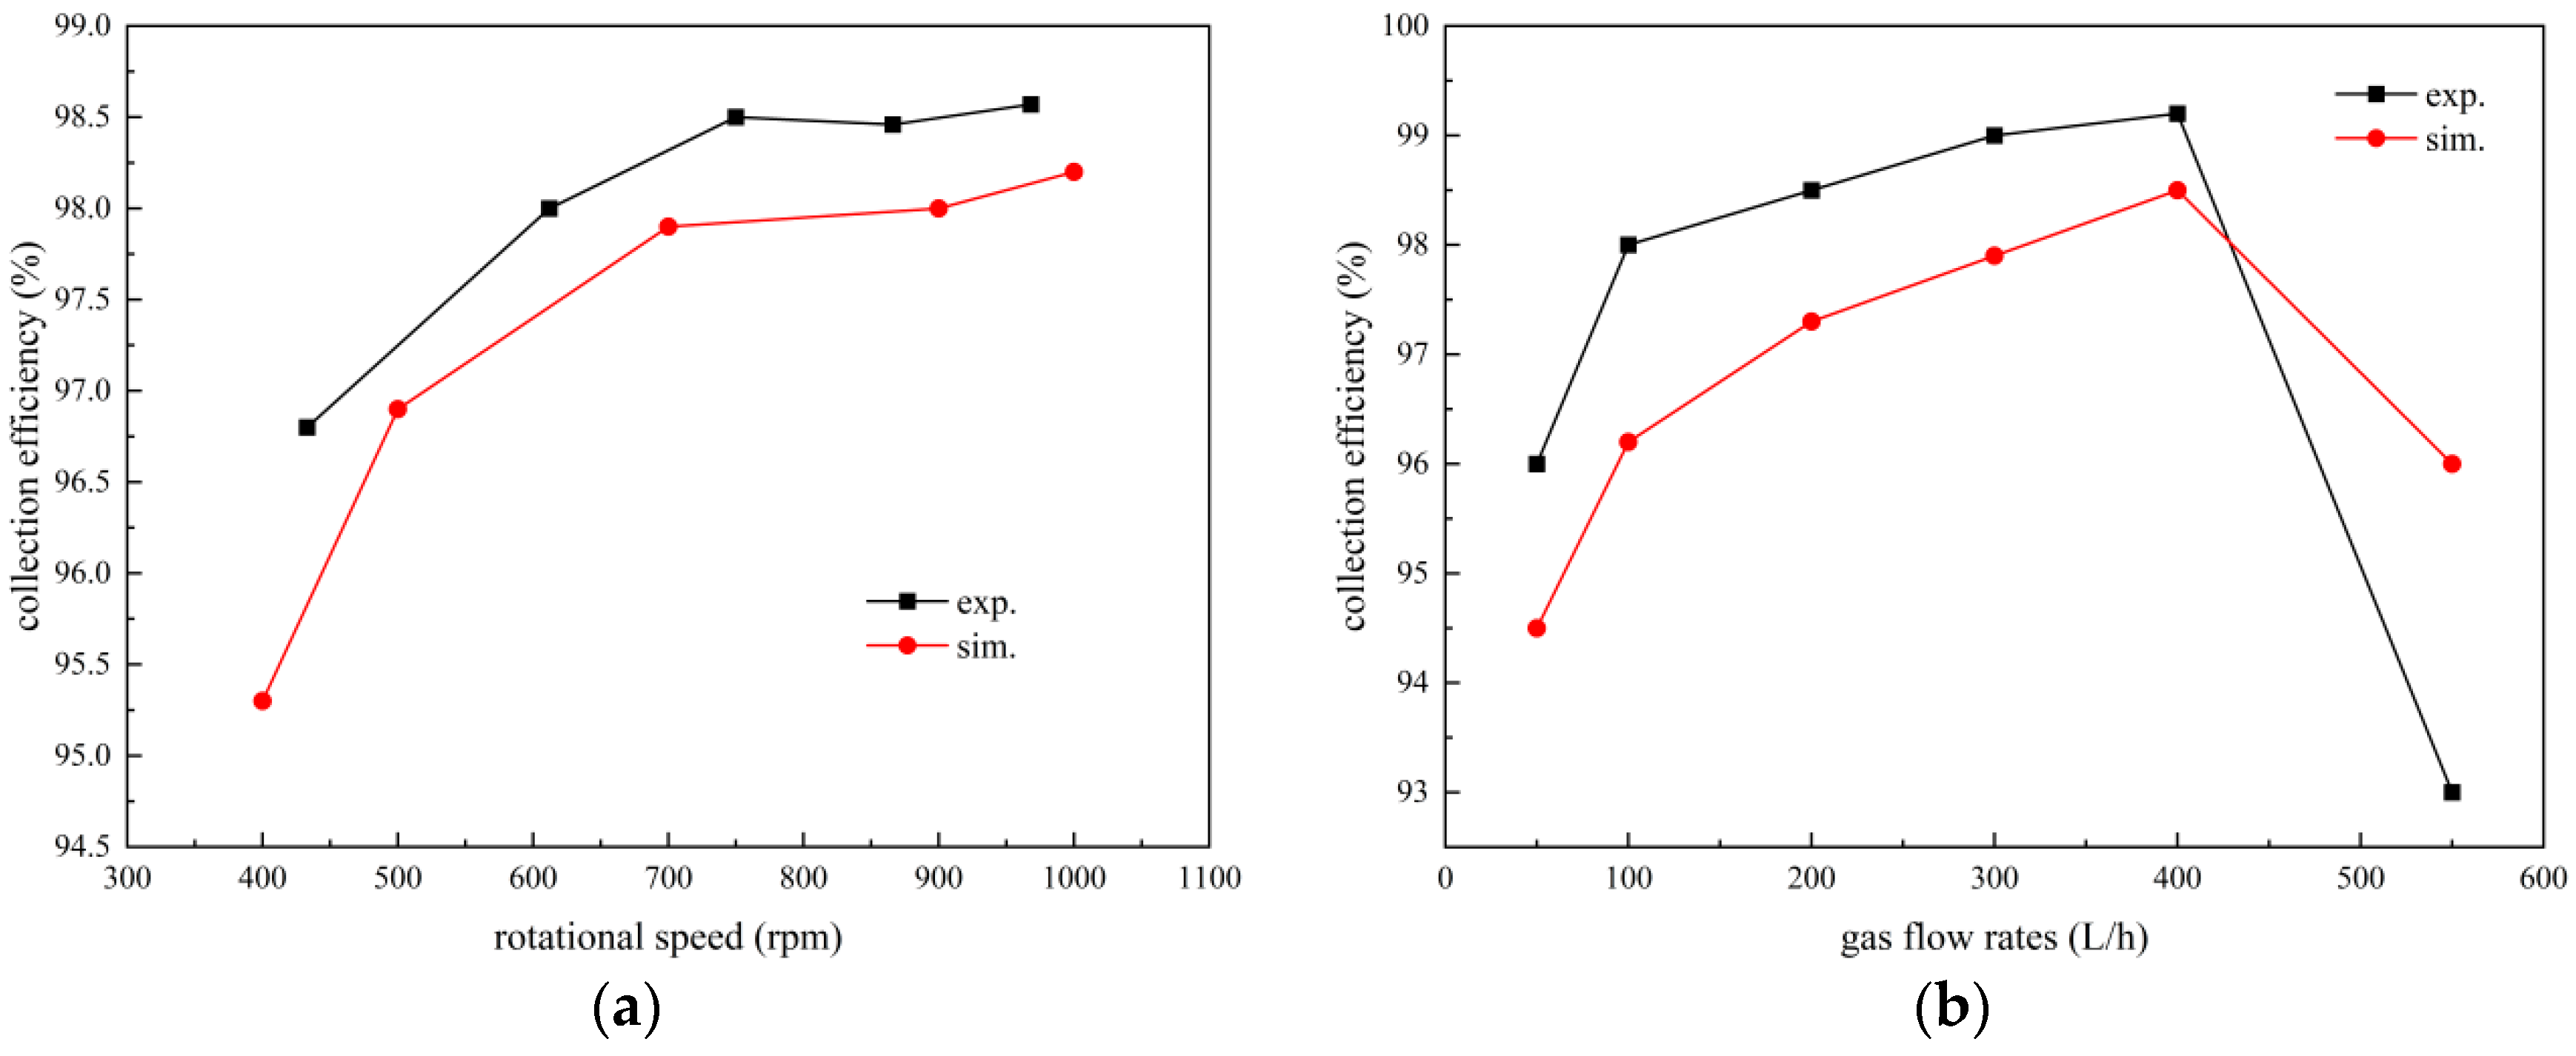
3.4. Dust Collection Efficiency

It is necessary to better understand the dust removal in the internal flow field in order to clarify the dust removal mechanism. The capture mechanism mainly involves single-droplet capture. In a wet scrubber with a rotating packed bed, fine particles can be captured by droplets through inertial collision, interception, diffusion, and thermophoresis, and the capture efficiency may differ substantially depending on the capture mechanism. For fine particles, the capture efficiency of inertial collision is 2–3 orders of magnitude higher than that of other mechanisms [15]. The gas–liquid mass transfer efficiency is extremely high in a rotating packed bed with a low temperature difference, and the thermophoresis effect can be neglected. For micrometer-sized particles, the Brownian diffusion effect is very weak. Therefore, inertial collision is considered to be the main mechanism for high-gravity wet dust removal.
The Stokes number (St) indicates the ability of particles to follow the fluid, and its physical meaning is the ratio of particle inertia to diffusion, as follows:
S t = C c ρ p d p 2 u 0 18 μ d c
where C c is the Cunningham correction coefficient, which is used to indicate the slip motion of fine particles relative to the fluid; ρ p is the particle density (kg/m3); d p is the particle size (m); u 0 is the relative velocity between the gas and liquid phases, which is also known as the slip velocity (m/s); μ is the gas viscosity (Pa·s); and d c is the droplet size (m).
Inertia has a more significant effect on fine particles at higher St values. Fine particles are more likely to deviate from the gas streamlines and collide with droplets, due to their own inertia. Consequently, the capture efficiency by liquid is increased. Chate et al. [24] investigated the capture efficiency of droplets for particles under different Stokes numbers and found that the capture efficiency increased from 0.11 to 0.59 as the St increased from 0.29 to 1.58. It follows from Equation (1) that the capture efficiency of fine particles can be improved by increasing the relative velocity between the gas and liquid, u 0 , or by reducing the droplet size, d c . These two factors are associated with the internal flow field in a rotating packed bed. Therefore, compared to traditional towers, high-gravity wet dust removal technology is more capable of removing fine particles.
The analysis of dust removal efficiency in the internal flow field of a rotating packed bed is mainly based on the empirical relationships derived from dust capture mechanisms. Building upon the studies of Boll [25] and Calvert [26], Mohebbi et al. [27] proposed a more accurate formula for predicting the relationship between inertia capture efficiency and Stokes number (St), as follows:
η c o l = S t 2 S t + 1 r
where r = 0.759 S t 0.245 .

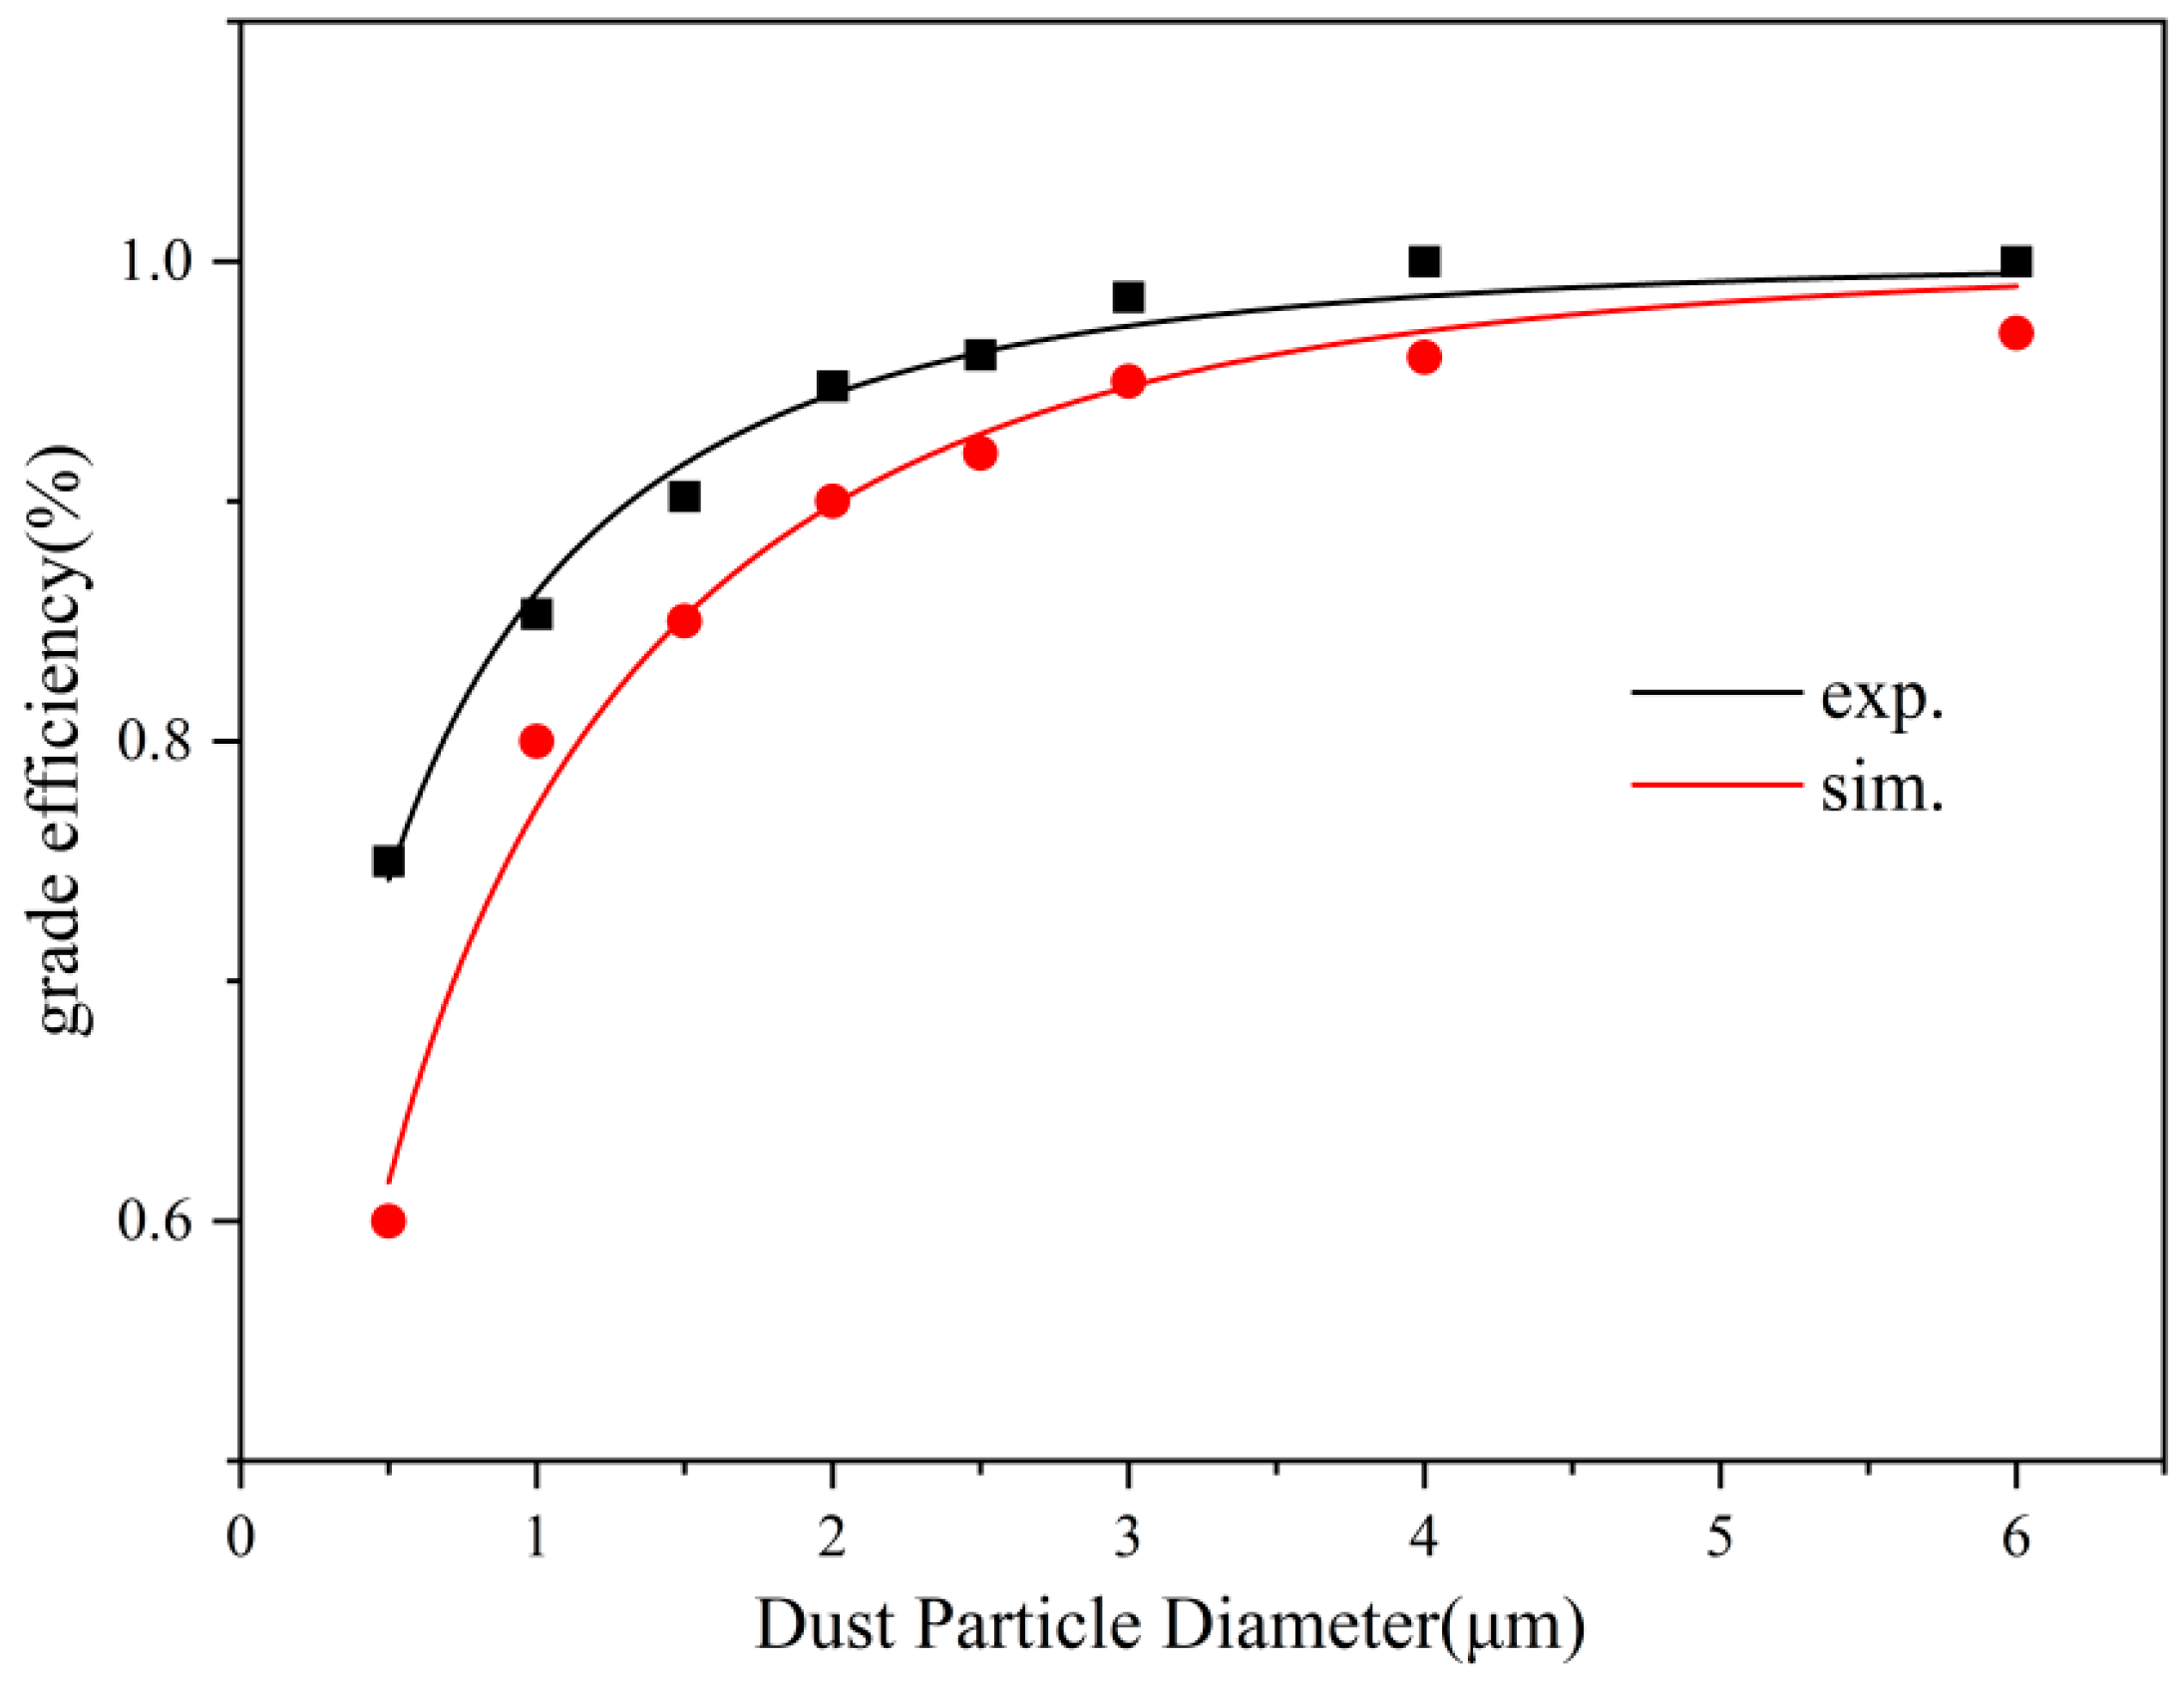
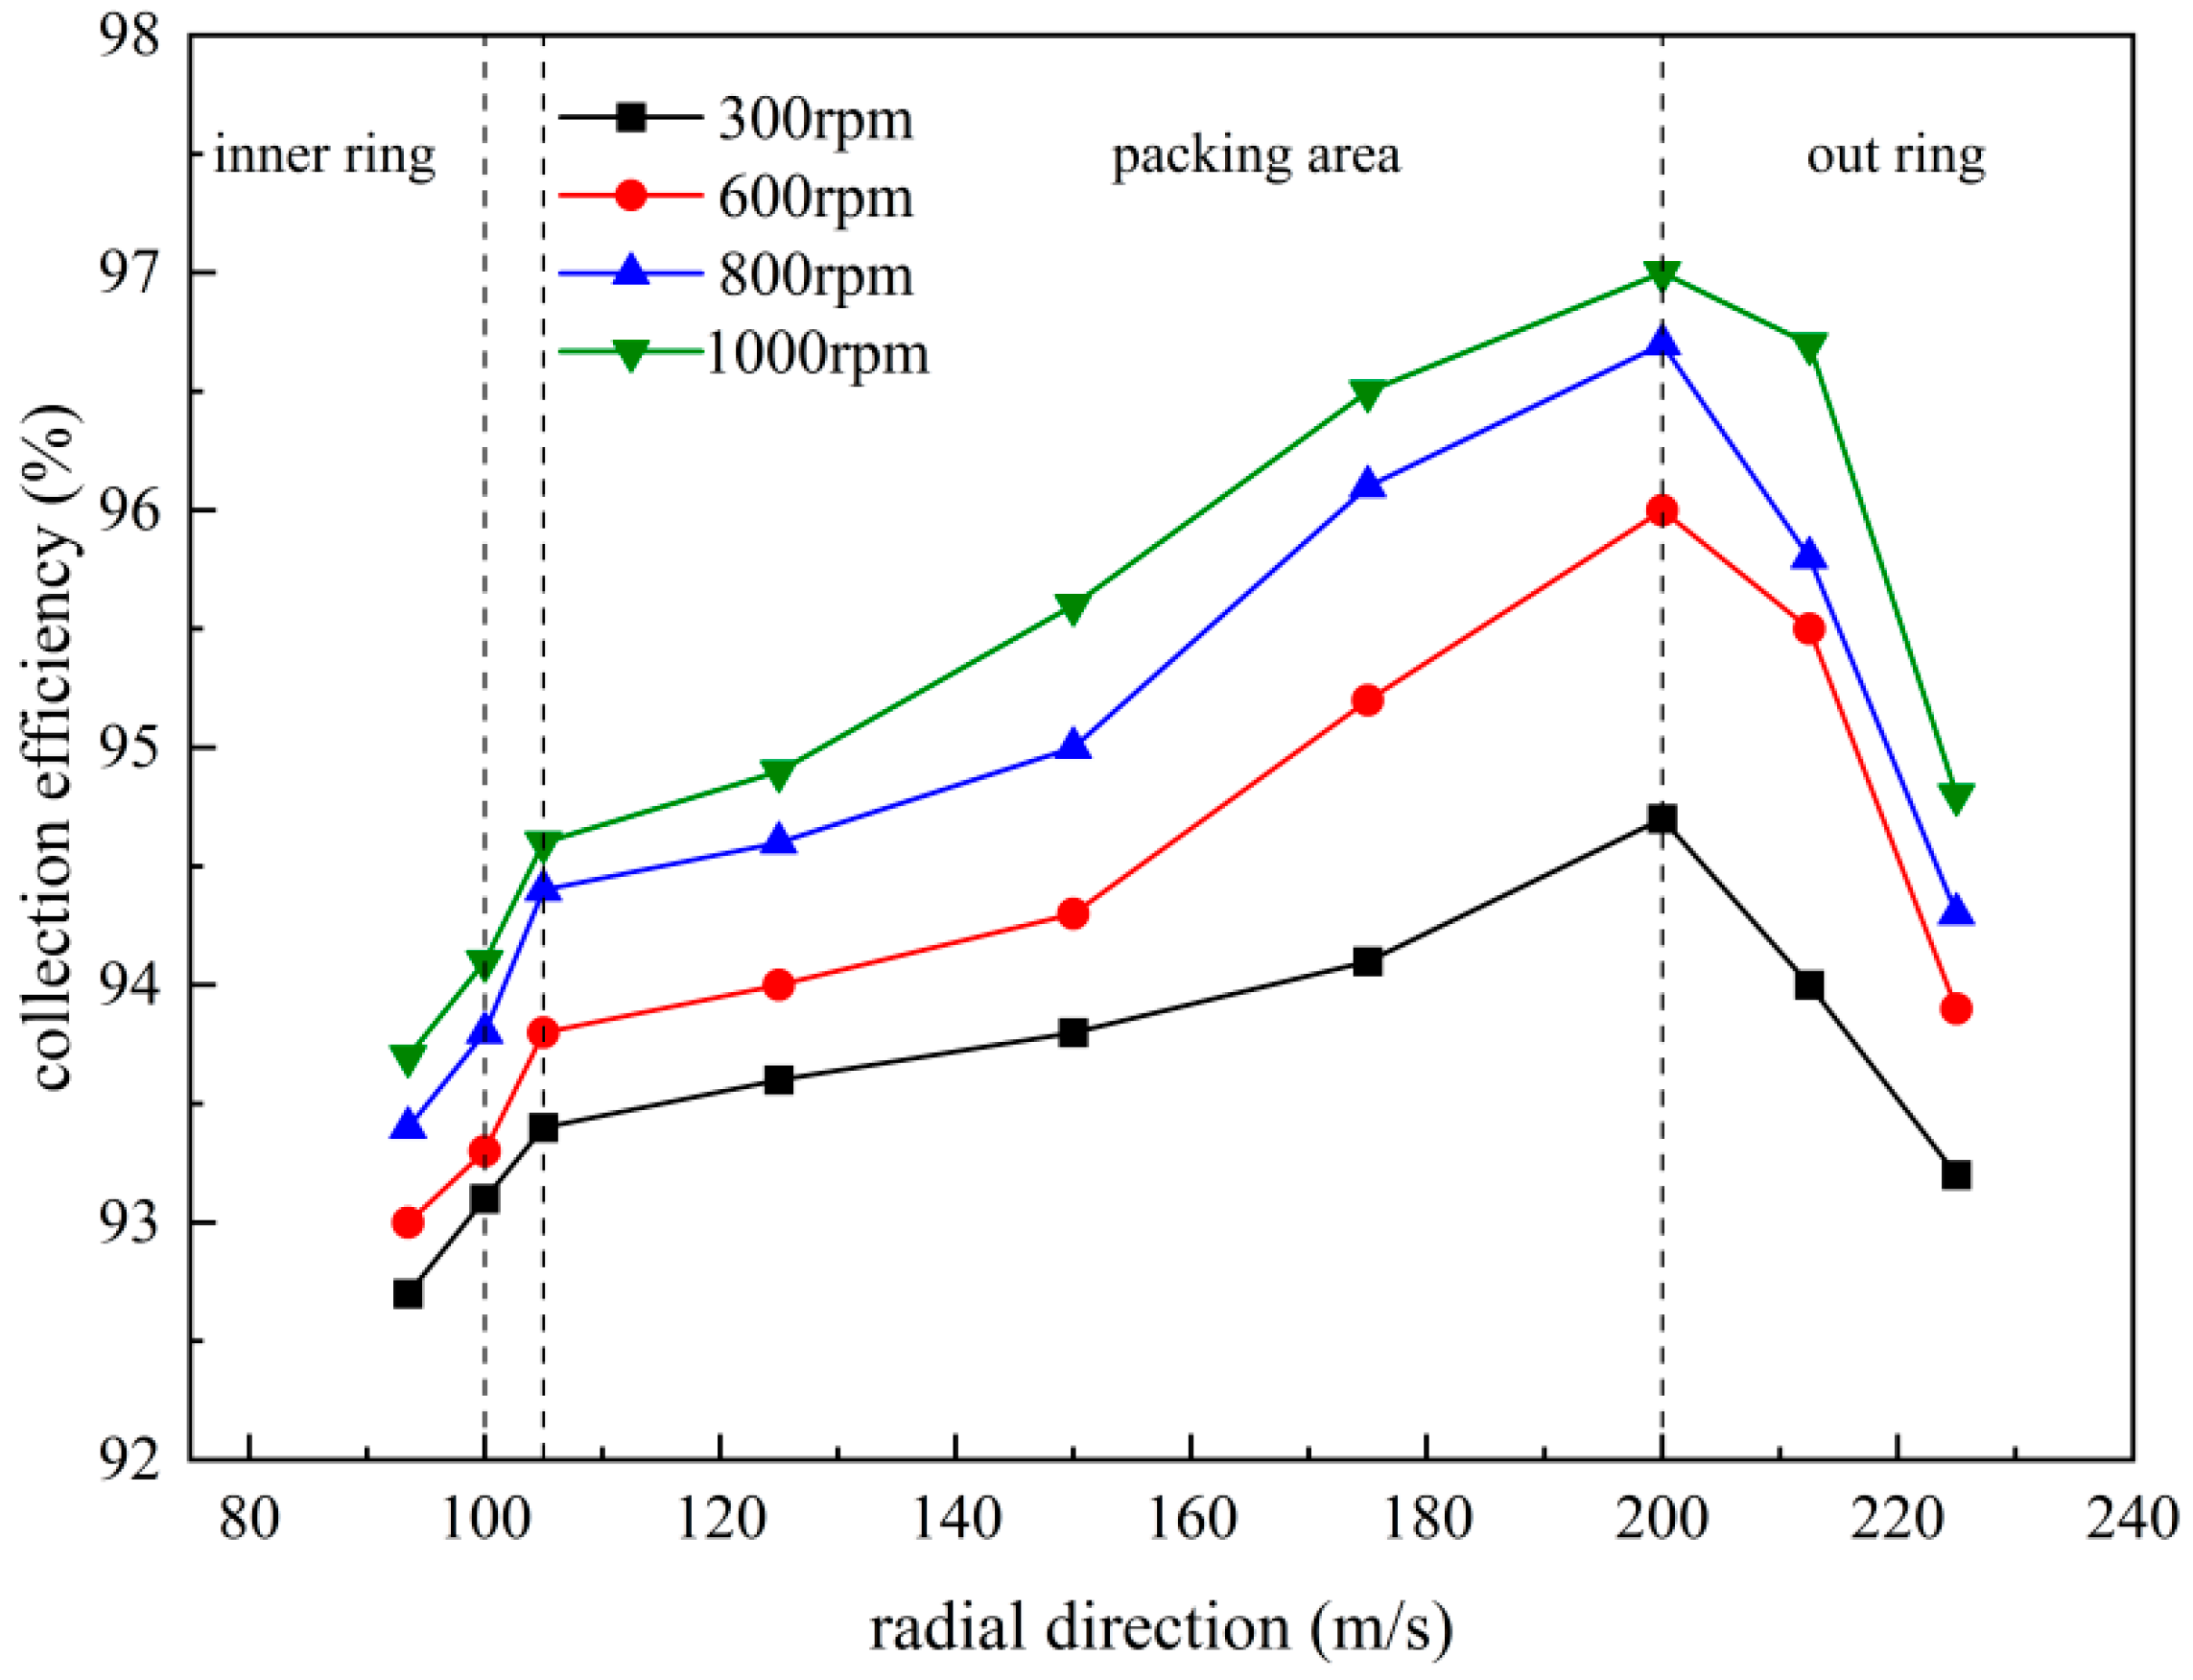
3.4.1. Classification Efficiency

The total dust removal efficiency refers to the percentage of dust captured with a dust collector relative to the amount of dust entering the device, and is a crucial indicator of the dust collector’s performance. Additionally, the fractional efficiency refers to the separation efficiency of the dust collector within a certain range of dust particle sizes, which can be used to assess the device’s performance in removing fine particulate matter. The classification efficiency refers to the separation efficiency of the dust within a certain range captured with the dust collector. The relationship between them is described as follows:
η i = 1 ( 1 η t o t a l ) P m i P m i
Figure 10 shows the particle size distribution used in this experiment, where the average particle size is 2.25 µm.
The relationship between the classification efficiency of most dust collectors and the particle size can be expressed by the following equation proposed by Licht et al. [28]:
η i = 1.0 e x p m d p n
where m represents the classification efficiency and n represents the effect of the particle size on the classification efficiency. It can be seen in Figure 11 that the classification efficiency sharply decreases for dust particles of 1 μm in diameter, which is attributed to the decrease in St with the decrease in particle size. For dust particles of <1 μm in diameter, there is a significant deviation between the simulated and the experimental results (about 15%). For extremely small particles, the Reynolds number is very small, and the capture mechanism mainly involves viscous force rather than inertia. As the particle size increases, inertia gradually becomes the main mechanism for wet dust removal, and, therefore, the deviation between the simulated and experimental results is reduced.

3.4.2. Total Dust Removal Efficiency

The single-factor method is used to investigate the influence of the rotational speed and gas flow rate on the total dust removal efficiency of the counterflow rotating packed bed, as shown in Figure 12. It has been found that, with the increase in rotational speed and gas velocity, the slip velocity between the gas and the liquid increases significantly, the droplet diameter becomes smaller, the distribution becomes more uniform, the St number becomes larger, and the inertia capture efficiency of a single droplet increases. As a result, the total dust removal efficiency is improved. However, it is worth noting that, when the gas flow rate reaches 600 L/h, the simulated value exceeds the experimental value. This is because increasing the gas flow rate can not only increase the slip velocity but can also reduce the contact time between the gas and the liquid. In this case, inertia alone may not accurately predict the dust removal efficiency.
Figure 13 shows the radial variation of the total dust removal efficiency inside of the rotating packed bed. The closer it is to the outer edge of the bed, the higher the total dust removal efficiency. This region is filled with extremely thin liquid threads and fine liquid films, and the gas–liquid slip velocity is high. The dust removal efficiency rapidly increases in the end-effect region, which is related to the sharp increase in slip velocity there. However, the simulated values at the liquid inlet may deviate significantly from the experimental ones. This is because, although the Stokes number is small in this region, the spraying density is highest throughout the fluid domain and the gas flow cross-section is smaller. The density of the fine particles is also higher in this region. Further research is needed in order to establish a three-dimensional model to characterize the fluid flow in this region.

3.5. New Equipment Structure

Numerical simulations have significant advantages for equipment optimization [29,30]. Previous studies have suggested that the total dust removal efficiency can be improved either by reducing the droplet diameter or by increasing the gas–liquid interfacial velocity. In this study, the total dust removal efficiency increases with the radial distance, and the packing near to the rotor contributes less to the total dust removal efficiency. Therefore, given the same shell diameter and packing thickness, increasing the inner and outer diameters of the packing has the potential to increase the total dust removal efficiency, as shown in Figure 14. Compared to the original structure, the packing with a larger radius can provide a higher centrifugal force and relative velocity between the liquid and the packing. Less liquid threads and films are present inside of the packing. The average droplet diameter decreases from 1.12 mm to 0.97 mm, resulting in an increase in inertia capture efficiency. Therefore, given the same packing thickness, the total dust removal efficiency can be improved by increasing the inner cavity and reducing the outer cavity.
Two new structures were designed to improve the relative velocity between the gas and the liquid, as shown in Figure 15. Arrays of stationary baffles of 60° and 120° were arranged circumferentially in the outer cavity. It has been found from the velocity contours of the gas phase that, as the gas flows through the annular outer cavity with baffles, its velocity significantly increases with the narrowing of the cross-section. As a result, the gas–liquid slip velocity and the dust removal efficiency in the packing are increased. Figure 15c,d depict the velocity distribution and dust removal efficiency of the existing equipment and the new equipment with different angles of baffles. The presence of the baffles also leads to an increase in the pressure drop of the gas phase. For baffles with an angle of 120°, the gas pressure drop is 900 Pa; however, for baffles with an angle of 60°, the capture efficiency is improved, and the gas pressure drop is only about 600 Pa.

4. Conclusions

In this study, a two-dimensional computational model of a counter-flow rotating packed bed was established. The source terms for mass and momentum were introduced to simulate the interaction between the gas and liquid phases, and the liquid flow pattern, gas–liquid contact time, gas flow path, and other characteristics of the gas–liquid two-phase flow field in the rotating packed bed were simulated and analyzed using the VOF model and Euler–Euler model. The results showed that the liquid was mainly in the form of liquid threads and films near to the inner edge of the packing and that gas entrainment occurred at the outlet. The droplet size distribution and the gas–liquid slip velocity in the two-phase flow field were quantitatively analyzed. The slip velocity increased with an increasing rotational speed and gas flow rate. However, the average droplet diameter first increased and then decreased, which was attributed to the high gas drag force acting on the droplets in the horizontal direction, which made it difficult for centrifugal forces to break them into smaller droplets. The classification efficiency and the dust removal efficiency in the rotating packed bed were determined by calculating the Stokes number. The results revealed that the capture efficiency was higher in the end-effect zone and near to the outer edge of the packing. The theoretical basis for deep purification by high-gravity wet dust removal technology was elucidated through numerical simulations. Finally, two novel structures were designed to reduce the average droplet diameter and increase the gas–liquid interfacial velocity in order to improve the total dust removal efficiency. However, further research is needed to establish a three-dimensional computational model, especially for regions such as the end-effect zone, in order to further improve dust removal efficiency.

Author Contributions

Conceptualization, S.G. and Y.L. (Youzhi Liu); methodology, S.G., Y.L. (Youzhi Liu) and C.Z. (Chao Zhang); validation, C.Z. (Chengqian Zhang) and S.W.; formal analysis, Y.L. (Yuliang Li); resources, S.C.; data curation, S.G.; writing—original draft preparation, S.G.; writing—review and editing, S.G.; visualization, S.G.; supervision, Y.L. (Youzhi Liu) and C.Z. (Chao Zhang); project administration, S.C.; funding acquisition, S.G., C.Z. (Chao Zhang) and S.C. All authors have read and agreed to the published version of the manuscript.

Funding

This research was funded by National Natural Science Foundation of China (22208328), the Fundamental Research Program of Shanxi Province (20210302124618), the National Natural Science Foundation of China (22108263), the Fundamental Research Program of Shanxi Province (20210302124060), and the 18th graduate science and technology project of North University of China (20221827).

Institutional Review Board Statement

Not applicable.

Informed Consent Statement

Not applicable.

Data Availability Statement

The data presented in this study are available on request from the corresponding author. The data are not publicly available due to confidentiality of test data.

Conflicts of Interest

The authors declare no conflict of interest.

References

  1. Pui, D.Y.H.; Chen, S.-C.; Zuo, Z. PM2.5 in China: Measurements, sources, visibility and health effects, and mitigation. Particuology 2014, 13, 1–26. [Google Scholar] [CrossRef]
  2. Cao, R.; Tan, H.; Xiong, Y.; Mikulčić, H.; Vujanović, M.; Wang, X.; Duić, N. Improving the removal of particles and trace elements from coal-fired power plants by combining a wet phase transition agglomerator with wet electrostatic precipitator. J. Clean. Prod. 2017, 161, 1459–1465. [Google Scholar] [CrossRef]
  3. Tian, S.-R.; Yang, G.-H.; Li, Z.; Shi, K.-Y.; Ding, G.-Z.; Hu, F.-X. Cascade filtration properties of a dual-layer granular bed filter. Powder Technol. 2016, 301, 545–556. [Google Scholar] [CrossRef]
  4. Li, W.; Wu, X.; Jiao, W.; Qi, G.; Liu, Y. Modelling of dust removal in rotating packed bed using artificial neural networks (ANN). Appl. Therm. Eng. 2017, 112, 208–213. [Google Scholar] [CrossRef]
  5. Fu, J.; Qi, G.; Liu, Y.; Tian, J.; Guo, Q.; Dong, M. Research on removal of fine particles by cross-flow rotating packed bed. Chem. Ind. Eng. Prog. 2015, 34, 680–694. [Google Scholar]
  6. Wang, A.; Song, Q.; Ji, B.; Yao, Q. Effect of droplet deformation on inertial and thermophoretic capture of particles. Atmos. Environ. 2016, 127, 187–195. [Google Scholar] [CrossRef]
  7. Mohan, B.R.; Meikap, B. Performance characteristics of the particulate removal in a novel spray-cum-bubble column scrubber. Chem. Eng. Res. Des. 2009, 87, 109–118. [Google Scholar] [CrossRef]
  8. Guo, F.; Zheng, C.; Guo, K.; Feng, Y.; Gardner, N.C. hydrodynamics and mass transfer in crossflow rotating packed bed. Chem. Eng. Sci. 1997, 52, 3853–3859. [Google Scholar] [CrossRef]
  9. Jamaat, S.S.; Abolhasani, M. Effect of blade packing structure and high-frequency ultrasound on micromixing efficiency enhancement in an RPB reactor. Chem. Eng. Res. Des. 2022, 188, 197–208. [Google Scholar] [CrossRef]
  10. Wu, W.; Luo, Y.; Chu, G.-W.; Su, M.-J.; Cai, Y.; Zou, H.-K.; Chen, J.-F. Liquid flow behavior in a multiliquid-inlet rotating packed bed reactor with three-dimensional printed packing. Chem. Eng. J. 2020, 386, 121537. [Google Scholar] [CrossRef]
  11. Carotenuto, C.; Di Natale, F.; Lancia, A. Wet electrostatic scrubbers for the abatement of submicronic particulate. Chem. Eng. J. 2010, 165, 35–45. [Google Scholar] [CrossRef]
  12. Li, Z.Y.; Dong, K.; Liang, Y.; Zhang, L.; Sun, B.; Chu, G.W.; Zou, H.K.; Chen, J.F. Study on the removal of fine particles by using water in a rotating packed bed. Canadian J. Chem. Eng. 2017, 95, 1063–1068. [Google Scholar] [CrossRef]
  13. Pak, S.I.; Chang, K.S. Performance estimation of a Venturi scrubber using a computational model for capturing dust particles with liquid spray. J. Hazard. Mater. 2006, 138, 560–573. [Google Scholar] [CrossRef]
  14. Ali, H.; Plaza, F.; Mann, A. Numerical Prediction of Dust Capture Efficiency of a Centrifugal Wet Scrubber. Aiche J. 2018, 64, 1001–1012. [Google Scholar] [CrossRef]
  15. Li, H.; Yuan, Z.; Liu, Y.; Liu, H. Characteristics of liquid flow in a countercurrent rotating bed. Chem. Eng. Process.-Process Intensif. 2019, 136, 72–81. [Google Scholar] [CrossRef]
  16. Shi, X.; Xiang, Y.; Wen, L.-X.; Chen, J.-F. CFD analysis of liquid phase flow in a rotating packed bed reactor. Chem. Eng. J. 2013, 228, 1040–1049. [Google Scholar] [CrossRef]
  17. Guo, T.-Y.; Cheng, K.-P.; Wen, L.-X.; Andersson, R.; Chen, J.-F. Three-Dimensional Simulation on Liquid Flow in a Rotating Packed Bed Reactor. Ind. Eng. Chem. Res. 2017, 56, 8169–8179. [Google Scholar] [CrossRef]
  18. Troshko, A.A.; Zdravistch, F. CFD modeling of slurry bubble column reactors for Fisher–Tropsch synthesis. Chem. Eng. Sci. 2009, 64, 892–903. [Google Scholar] [CrossRef]
  19. Harlow, F.H. Volume of fluid method for the dynamics of free boundary. Jcomputphys 1965, 201–225. [Google Scholar]
  20. INCA. ANSYS Fluent Theory Guide; Ansys Inc.: Canonsburg, PA, USA, 2013. [Google Scholar]
  21. Menter, F.R. Two-equation eddy-viscosity turbulence models for engineering applications. Aiaa J. 1994, 32, 1598–1605. [Google Scholar] [CrossRef]
  22. Yang, W.; Wang, Y.; Chen, J.; Fei, W. Computational fluid dynamic simulation of fluid flow in a rotating packed bed. Chem. Eng. J. 2010, 156, 582–587. [Google Scholar] [CrossRef]
  23. Lan, H.; Wegener, J.L.; Armaly, B.F.; Drallmeier, J.A. Developing Laminar Gravity-Driven Thin Liquid Film Flow Down an Inclined Plane. J. Fluids Eng. 2010, 132, 081301. [Google Scholar] [CrossRef]
  24. Chate, D.; Kamra, A. Collection efficiencies of large water drops collecting aerosol particles of various densities. Atmos. Environ. 1997, 31, 1631–1635. [Google Scholar] [CrossRef]
  25. Boll, R.H. Particle Collection and Pressure Drop in Venturi Scrubbers. Ind. Eng. Chem. Fundam. 1973, 12, 40–50. [Google Scholar] [CrossRef]
  26. Calvert, S. Venturi and other atomizing scrubbers efficiency and pressure drop. Aiche J. 1970, 16, 392–396. [Google Scholar] [CrossRef]
  27. Mohebbi, A.; Taheri, M.; Fathikaljahi, J.; Talaie, M. Simulation of an orifice scrubber performance based on Eulerian/Lagrangian method. J. Hazard. Mater. 2003, 99, 13–25. [Google Scholar] [CrossRef]
  28. Licht, W. Air Pollution Control Engineering: Basic Calculations for Particulate Collection; CRC Press: Boca Raton, FL, USA, 1980. [Google Scholar]
  29. Llerena-Chavez, H.; Larachi, F. Analysis of flow in rotating packed beds via CFD simulations—Dry pressure drop and gas flow maldistribution. Chem. Eng. Sci. 2009, 64, 2113–2126. [Google Scholar] [CrossRef]
  30. Yang, Y.C.; Xiang, Y.; Li, Y.; Chu, G.; Zou, H.; Arowo, M.; Chen, J. 3D CFD modelling and optimization of single-phase flow in rotating packed beds. Can. J. Chem. Eng. 2015, 93, 1138–1148. [Google Scholar] [CrossRef]
Figure 1. (a) Countercurrent rotating packed bed and (b) crossflow rotating packed bed.
Atmosphere 15 00157 g001
Figure 2. (a) The geometrical model of the rotating packed bed (1. axial spacing in the same layer; 2. wire mesh diameter; 3. radial spacing between adjacent layers; 4. liquid inlet). (b) Meshed geometry. (c) Boundary conditions.
Atmosphere 15 00157 g002aAtmosphere 15 00157 g002b
Figure 3. Mesh independence verification.
Atmosphere 15 00157 g003
Figure 4. Gas phase velocity changes at the monitoring point.
Atmosphere 15 00157 g004
Figure 5. Effect of gas volume on liquid flow pattern and gas flow path. (a) 85m3/h. (b) 600m3/h. (c) 85 m3/h. (d) 600 m3/h.
Atmosphere 15 00157 g005aAtmosphere 15 00157 g005b
Figure 6. Effect of rotational speed and gas volume on the gas–liquid contact time.
Atmosphere 15 00157 g006
Figure 7. Effect of gas volume on the average droplet diameter.
Atmosphere 15 00157 g007
Figure 8. Effect of gas volume on droplet dispersion index.
Atmosphere 15 00157 g008
Figure 9. Effect of rotational speed on (a) slip velocity, (b) mean slip velocity, (c) radial slip velocity, and (d) tangential slip velocity.
Atmosphere 15 00157 g009aAtmosphere 15 00157 g009b
Figure 10. Particle size distribution.
Atmosphere 15 00157 g010
Figure 11. Classification efficiency as a function of dust particle diameter.
Atmosphere 15 00157 g011
Figure 12. (a) Effect of rotational speed and (b) gas volume on total dust removal efficiency.
Atmosphere 15 00157 g012
Figure 13. Radial distribution of total dust removal efficiency.
Atmosphere 15 00157 g013
Figure 14. (a) Existing structure and (b) new structure.
Atmosphere 15 00157 g014aAtmosphere 15 00157 g014b
Figure 15. (a) A 60° baffle; (b) 120° baffle; (c) slip velocity; (d) dust removal efficiency.
Atmosphere 15 00157 g015aAtmosphere 15 00157 g015b
Table 1. Mesh model parameter.
ProjectValue
Mesh Quantity2,102,140
Boundary layer quantity12
Growth rate1.2
Minimum face area1.26 × 10−4
Maximum face area4.95 × 10−4
Minimum Orthogonal Quality0.631
Maximum Aspect Ratio4.53
Disclaimer/Publisher’s Note: The statements, opinions and data contained in all publications are solely those of the individual author(s) and contributor(s) and not of MDPI and/or the editor(s). MDPI and/or the editor(s) disclaim responsibility for any injury to people or property resulting from any ideas, methods, instructions or products referred to in the content.

