

The WRF Simulation Influence of Assimilating GNSS Water Vapor and Parameterization Schemes on Typhoon Rumbia

Research Center of Beidou Navigation and Environmental Remote Sensing, Suzhou University of Science and Technology, Suzhou 215009, China
*
Author to whom correspondence should be addressed.
Atmosphere 2024, 15(3), 255; https://doi.org/10.3390/atmos15030255
Submission received: 28 December 2023
/
Revised: 17 February 2024
/
Accepted: 20 February 2024
/
Published: 21 February 2024
(This article belongs to the Special Issue GNSS Remote Sensing in Atmosphere and Environment)
Abstract
:The Weather Research and Forecasting (WRF) model was used to simulate Typhoon Rumbia in this paper. The sensitivity experiments were conducted with 16 different parameterization combination schemes, including four microphysics (WSM6, WSM5, Lin, and Thompson), two boundary layers (YSU and MYJ), and two cumulus convection (Kain–Fritsch and Grell–Freitas) schemes. The impacts of 16 parameterization combination schemes and the data assimilation (DA) of Global Navigation Satellite System (GNSS) water vapor were evaluated by the simulation accuracy of typhoon track and intensity. The results show that the typhoon track and intensity are significantly influenced by parameterization schemes of cumulus and boundary layers rather than microphysics. The averaged track error of Lin_KF_Y is 104.73 km in the entire 72-h simulation period. The track errors of all the other combination schemes are higher than Lin_KF_Y. During the entire 72-h, the averaged intensity error of Thompson_GF_M is 1.36 hPa. It is the lowest among all the combination schemes. As for data assimilation, the simulation accuracy of typhoon tracks can be significantly improved by adding the GNSS water vapor. Thompson_GF_M-DA combination scheme has the lowest average track error of 45.05 km in the initial 24 h. The Lin_KF_Y-DA combination scheme exhibits an average track error of 32.17 km on the second day, 28.03 km on the third day, and 35.33 km during 72-h. The study shows that the combination of parameterization schemes and the GNSS water vapor data assimilation significantly improve the initial conditions and the accuracy of typhoon predictions. The study results contribute to the selection of appropriate combinations of physical parameterization schemes for the WRF-ARW model in the mid-latitude region of the western Pacific coast.
Keywords:
GNSS; WRF; typhoon; microphysics; cumulus convection; boundary layer; parameterization; water vapor; data assimilation1. Introduction
The growing global concern about climate change has made typhoons a key topic that will attract significant attention in the future [1]. China, located on the western coast of the Pacific Ocean, is frequently affected by high-intensity typhoons [2]. China’s coastal regions are struck by an average of seven typhoons each year. These typhoons can cause meteorological calamities such as storm surges and severe convective weather, which can have a significant impact on residents of coastal and adjacent areas [3,4,5]. The track errors may lead to an accuracy decrease of weather event predictions. When the forecasting time is extended, the accumulation of errors may result in incorrect estimations of typhoon tracks. As such, these errors may affect the decisions of emergency preparedness and evacuation and disrupt resource allocation and post-disaster recovery planning. For example, the Typhoon “In-fa” triggered a severe rainstorm in Zhengzhou City in Henan province on 20 July 2021, causing substantial loss of life and property [6,7]. Accurately forecasting typhoon movement tracks and intensity are crucial, and so it has become a significant research focus.
The rapid development of the typhoon numerical weather prediction (NWP) model has been enabled by advances in computer science [8,9,10]. The numerical prediction accuracy of a typhoon is typically influenced by two primary factors: the selection of model parameterization schemes and the optimization of initial conditions [11]. In the field of tropical cyclone simulation, researchers have studied the influences of different parameterization schemes on typhoon tracks and intensity. These studies found that the choice of different parameterization schemes may lead to different simulation results, and these differences may involve simulated typhoon tracks, intensity, structure, and precipitation [12,13,14,15,16,17,18,19]. The study of different parameterization schemes will provide a deeper understanding of the dynamic mechanisms driving typhoon behavior and development. The research results reveal the differences of the convection structure and evolution in the WRF model. The intensity distribution and interaction of turbulence in the lower atmosphere, the energy source and water vapor supply of typhoons, and the dynamic influence of simulated precipitation processes can improve the understanding of typhoon development. The understanding of key dynamic processes provides a more accurate model basis from which to understand and predict typhoon behavior. It is crucial to optimize initial conditions as higher quality initial fields are beneficial to the NWP model [20,21]. Raju et al. utilized a combination of schemes, called YonSei University (YSU) [22] and Kain–Fritsch (KF) [23,24,25], to simulate Typhoon “Nargis”, resulting in a central pressure error of 4.2 hPa and a maximum wind error of approximately 11.7 m/s. However, the predicted landfall time was five hours earlier [26]. Kanase et al. studied the track and intensity of Typhoon “Laila” using various parameterization schemes and discovered that the Betts–Miller–Janjić (BMJ) [27] scheme was better in cumulus convection, while the YSU [28] scheme excelled in boundary layer parameterization. Chutia et al. investigated the impact of different microphysics parameterization schemes on the prediction track accuracy of Typhoon “Mora”. They found that all schemes overestimated the maximum surface wind (MSW) and minimum sea level pressure (MSLP) during the typhoon period. The predicted tracks of typhoons varied among different microphysics parameterization schemes, where the WSM3 demonstrates the superior performance with the minimum Root Mean Square Error (RMSE) [29]. A higher horizontal resolution also resulted in a more accurate simulation of the observed track [30]. From 2003 to 2008, Li conducted 20 numerical typhoons simulations in the northwest Pacific region. The results indicated that the Kain–Fritsch scheme simulated the strongest vertical convection of the typhoon with a distinct warm core structure, abundant precipitation, and higher intensity. In contrast, the BMJ and Grell–Devenyi (GD) schemes simulated weaker convection, a smaller precipitation range, and relatively weaker intensity. The KF scheme exhibited better performance in typhoon simulation [31]. Nasrollahi et al. found that WSM3 and WSM5 schemes had lower deviations in forecasting the precipitation area compared to no cumulus parameterization (NCP) and KF schemes. As for precipitation accumulation, the LIN-GD, WSM5-BMJ, and WSM5-GD scheme combinations are more reasonable. For typhoon tracks, the LIN and Kessler (KES) microphysics schemes, as well as the BMJ cumulus convection scheme (LIN-BMJ and KES-BMJ), forecast the best track. It is evident that that the WRF simulations require different combinations of physical parameterization schemes for better typhoon predictions due to significant variations of meteorological and geographical conditions (terrain, ocean conditions, atmospheric conditions, etc.) in different regions [32]. The most accurate typhoon landfall times were produced by the combination schemes of WSM5-BMJ, WSM3-BMJ, and Ferrier (FER) [33] in combination with Grell–Devenyi (GD) [34]. Wang et al. (2023) conducted sensitivity experiments on 12 different initial tropical cyclone intensities and sizes using the WRF model to study their impact on typhoon track simulation. They found that the typhoon volume increased with higher initial typhoon intensity and size, which led to an earlier northward turn of the typhoon [35]. However, most of the aforementioned studies have primarily focused on the parameterization scheme combinations of the microphysics and cumulus, or on the parameterization scheme combinations of microphysics and boundary layer. There is insufficient research on the parameterization scheme combinations of microphysics, cumulus, and boundary layer. In addition to the selection of parameterization schemes, the assimilation of Global Precipitation Measurement (GPM) microwave and GNSS water vapor can improve the initial and lateral boundary conditions, enhancing the prediction accuracy of typhoon track and intensity [36,37]. Li et al. employed a continuous cycling assimilation method to analyze the influence of different Advanced TIROS Operational Vertical Sounder (ATOVS) satellites on the simulation of Typhoon Fanapi [38]. In these studies, the data assimilation of different types of ATOVS effectively improved the prediction of typhoon intensity, with no significant difference between data types. Song et al. (2013) used the National Centers for Environmental Prediction (NCEP), Global Telecommunication System (GTS), and the Constellation Observing System for Meteorology, Ionosphere, and Climate (COSMIC) reanalysis data to simulate Typhoon “Morakot” in 2009. The researchers found that COSMIC data assimilation provided valuable insights into the thermal structure of Typhoon “Morakot”, which in turn led to improved prediction accuracy of typhoon precipitation and track [39]. Clear-sky infrared radiance data from the Japanese meteorological satellite “Himawari-8” were assimilated to improve the analysis accuracy of the wind field and 500 hPa pressure fields, and to simulate the structure and intensity of Typhoon “Hato” in 2017 [40]. Data assimilation is a method that combines observational data with numerical weather models to improve the prediction accuracy of typhoon track. The data assimilation of GNSS water vapor not only enhances the model’s initial conditions and optimizes atmospheric humidity distribution, providing a more realistic initial meteorological state, but also enables a better simulation of atmospheric dynamical processes, resulting in a more accurate simulation of typhoon tracks.
In this paper, the WRF model and its three-dimensional variational (WRF-3DVAR) data assimilation system are used to simulate the track and intensity of Typhoon “Rumbia”, which occurred between 15–17 August 2018. The simulation will analyze the track and intensity errors of Typhoon “Rumbia” under different parameterization combination schemes. Furthermore, WRF-3DVAR data assimilation experiments will be carried out to evaluate the assimilation impact of GNSS water vapor on the track and intensity of typhoon. Our research aims to investigate how various combinations of four microphysics, two cumulus convection, and two boundary layer parameterization schemes influence the typhoon prediction accuracy in the WRF model. Due to the lower horizontal resolution and the rich vertical information available from the Global Forecast System Final Reanalysis Data (GFS-FNL) analysis data, we further employ GNSS water vapor data assimilation to enhance the initial conditions and typhoon prediction results.
Therefore, this study will primarily investigate the improvement of initial conditions and typhoon prediction accuracy through the combination of microphysics, cumulus, and boundary layer parameterization schemes, along with GNSS water vapor data assimilation. The results of the study will provide valuable insights for selecting appropriate parameterization schemes combinations for the WRF-ARW model in the mid-latitude region of the western Pacific coast. The remaining parts of the paper are arranged as follows. The model and experimental design are introduced in Section 2. The typhoon simulation results using different parameterization scheme combinations and data assimilation are compared with observed results in Section 3. The conclusions are provided in the last section.
2. Data and Methods
2.1. Data
The WRF model is a new-generation, non-hydrostatic, high-resolution mesoscale NWP model developed by NCEP and the National Center for Atmospheric Research (NCAR). The version of WRF used in the study is 4.4.1. Two dynamic frameworks are included in the WRF model: The Advanced Research WRF (ARW) model and the Nonhydrostatic Mesoscale Model (NMM) model. Experimental configurations will be based on the ARW model.
The WRF-3DVAR system was employed in the data assimilation experiments. The control variables (CV3) dataset from WRF was used as the background error covariance matrix for the general background field. The Global Data Assimilation System (GDAS) of NCEP incorporated GNSS occultation from data sources such as COSMIC-2 and Cyclone Global Navigation Satellite System (CYGNSS), infrared radiation, atmospheric ozone, atmospheric pressure, and Integrated Water Vapor (IWV) content. The IWV refers to the total amount of vertical water vapor in the atmosphere, usually expressed in units per square meter. The measurement of IWV is conducted through the delay between a signal transmitted from satellite of GNSS (GPS, GLONASS, Galileo, etc.) and received by the ground station. Due to the absorption of microwave signals by water vapor, the GNSS signals will be delayed when passing through the atmosphere. This delay is related to the water vapor content in the atmosphere. By measuring the signal delay of GNSS, the total amount of water vapor on the path can be inverted, and thus the IWV can be obtained.
Typhoon “Rumbia”, the 18th typhoon of the 2018 season, originated in the West Pacific Ocean at 11:00 UTC on 15 August 2018. It made landfall on the southern coast of Pudong New Area, Shanghai, at 4:00 UTC on August 17. The typhoon’s best track datasets utilized in this study were obtained from the tropical cyclone data center of the China Meteorological Administration (CMA) (https://tcdata.typhoon.org.cn/zjljsjj_zlhq.html, accessed on 11 December 2023).
The initial field data for the simulation were provided by the Global Forecast System Final Reanalysis Data (GFS-FNL) operational dataset, which was produced by the NCEP/NCAR historical reanalysis data. The GFS-FNL dataset is issued four times daily at 00:00, 06:00, 12:00, and 18:00 UTC, and is recorded in GRIB format. The simulation incorporates Noah land surface models [41,42], the Rapid Radiative Transfer Model (RRTM) longwave radiation scheme [43], and the Dudhia shortwave radiation scheme [44].
The simulation period ranged from 15 August, 00:00 UTC, to 18 August 00:00 UTC, a period of 72 h. The white solid line region “d02” represents the simulation area, as shown in Figure 1. The simulation adopts a two-level nested approach. The “d01” consisting of 150 × 140 grid points and a resolution of 27 km; the “d02” consists of 211 × 181 horizontal grid points with a resolution of 9 km. The vertical direction is divided into 44 layers, and the integration time step is 60 s. Table 1 presents the configuration details of WRF model.
2.2. Methods
The WRF model is equipped with various parameterization schemes to represent physical processes, such as microphysics, cumulus convection, longwave radiation, shortwave radiation, near-surface layer, land surface processes, and boundary layer. The boundary between the atmospheric boundary layer and the atmospheric surface layer involves the use of land surface and boundary layer parameterization schemes. This includes setting appropriate boundary conditions in both the horizontal and vertical directions of the WRF model, configuring various boundary conditions, such as periodic boundaries, nested boundaries, and meteorological condition boundaries, and determining the model’s horizontal and vertical resolutions. Furthermore, based on previous experimental results, the selection of parameterization schemes plays a crucial role in choosing the different parameterization schemes, which can impact wind speeds, turbulence structures, and temperature vertical distributions in the lower atmosphere, thus influencing simulation outcomes [45,46,47]. By configuring the WRF model with specific horizontal and vertical grid resolutions, providing particular boundary conditions as input files, setting different initial fields and boundary conditions, choosing appropriate land surface, physics, and boundary layer parameterization schemes, and specifying an adequate time step for integration to ensure accurate simulation of rapidly changing atmospheric processes, one can simulate the entire atmospheric layer, including temperature and wind speed. Adjusting these factors allows for the modeling of atmospheric stratification. The simulated results can be compared with observational data to ensure the accuracy of the model in reflecting real atmospheric conditions. In this study, sixteen combinations of parameterization schemes were selected, including four microphysics schemes describing cloud and precipitation microscopic processes, two cumulus convection schemes simulating the convection activity, and two boundary layer schemes simulating the processes such as turbulence, heat flux, and humidity flux in the lower atmosphere. The remaining experimental parameters were held constant. The WRF model output will be compared to the actual observed data in the study. It quantitatively assesses the impact of various combinations of parameterization schemes and GNSS water vapor data assimilation on the accuracy of simulation results through the mean error.
Table 2 summarizes the combination schemes used in the sensitivity experiments. The first four experiments used the KF_Y scheme combination; the second four experiments used the KF_M scheme combination; the third four experiments used the GF_Y scheme combination; and the final four experiments used the GF_M scheme combination.
The WSM5, WSM6, Lin, and Thompson parameterization schemes generally perform well under a wide range of meteorological conditions. The Kain–Fritsch parameterization scheme exhibits good capabilities in simulating convective precipitation, while the Grell–Freitas parameterization scheme provides a comprehensive description of turbulence and convection. The YSU parameterization scheme is grounded in similarity theory, simulating turbulent processes in the atmospheric boundary layer to account for vertical motion in the atmosphere. The scheme is well-suited for mesoscale meteorological conditions and excels in simulating intricate terrains like mountains, urban areas, and land/ocean interfaces. On the other hand, the MYJ parameterization scheme is rooted in the Mellor–Yamada–Janjic theory, offering a comprehensive depiction of turbulent mixing processes and demonstrating proficiency in large-scale and global-scale meteorological simulations. The parameterization of the atmospheric surface layer is accomplished by selecting land surface processes and boundary layer parameterization schemes in the WRF model. The Noah land surface model was chosen for land surface parameterization due to its relatively precise simulation of soil temperature, humidity, and energy balance. The YSU and MYJ boundary layer parameterization schemes were specifically chosen for atmospheric simulations in regions characterized by low to mid-latitudes, showing effective performance. Therefore, the selection of the YSU and MYJ parameterization schemes is driven by their individual strengths in simulating diverse meteorological conditions and terrains.
The WRF model output will be compared to the actual observed data in the study. It quantitatively assesses the impact of various combinations of parameterization schemes and GNSS water vapor data assimilation on the accuracy of simulation results through the mean error. The simulation accuracy of 16 parameterization combination schemes for typhoon track and intensity will be first analyzed over different time scales (24-h, 48-h, and 72-h). Based on the performance, the combination schemes with the best track and intensity errors will be selected for GNSS water vapor data assimilation. The impact of GNSS water vapor on the simulation accuracy of typhoon track and intensity can also be evaluated. In addition to a 24-h spin-up period between 15 and 16 August, the GNSS water vapor data assimilation ran for 72 h beginning on 15 August 2018. The flowchart of the research implementation is shown in Figure 2.
3. Results
3.1. The Impact of Parameterization Schemes
In this section, the impact of the sixteen combination schemes in Table 2 on the track and intensity of Typhoon Rumbia was investigated, and the track and intensity simulation errors of three physical parameterization schemes (microphysics, cumulus convection, and boundary layer) at different time scales were analyzed and statistically summarized.
3.1.1. Typhoon Track
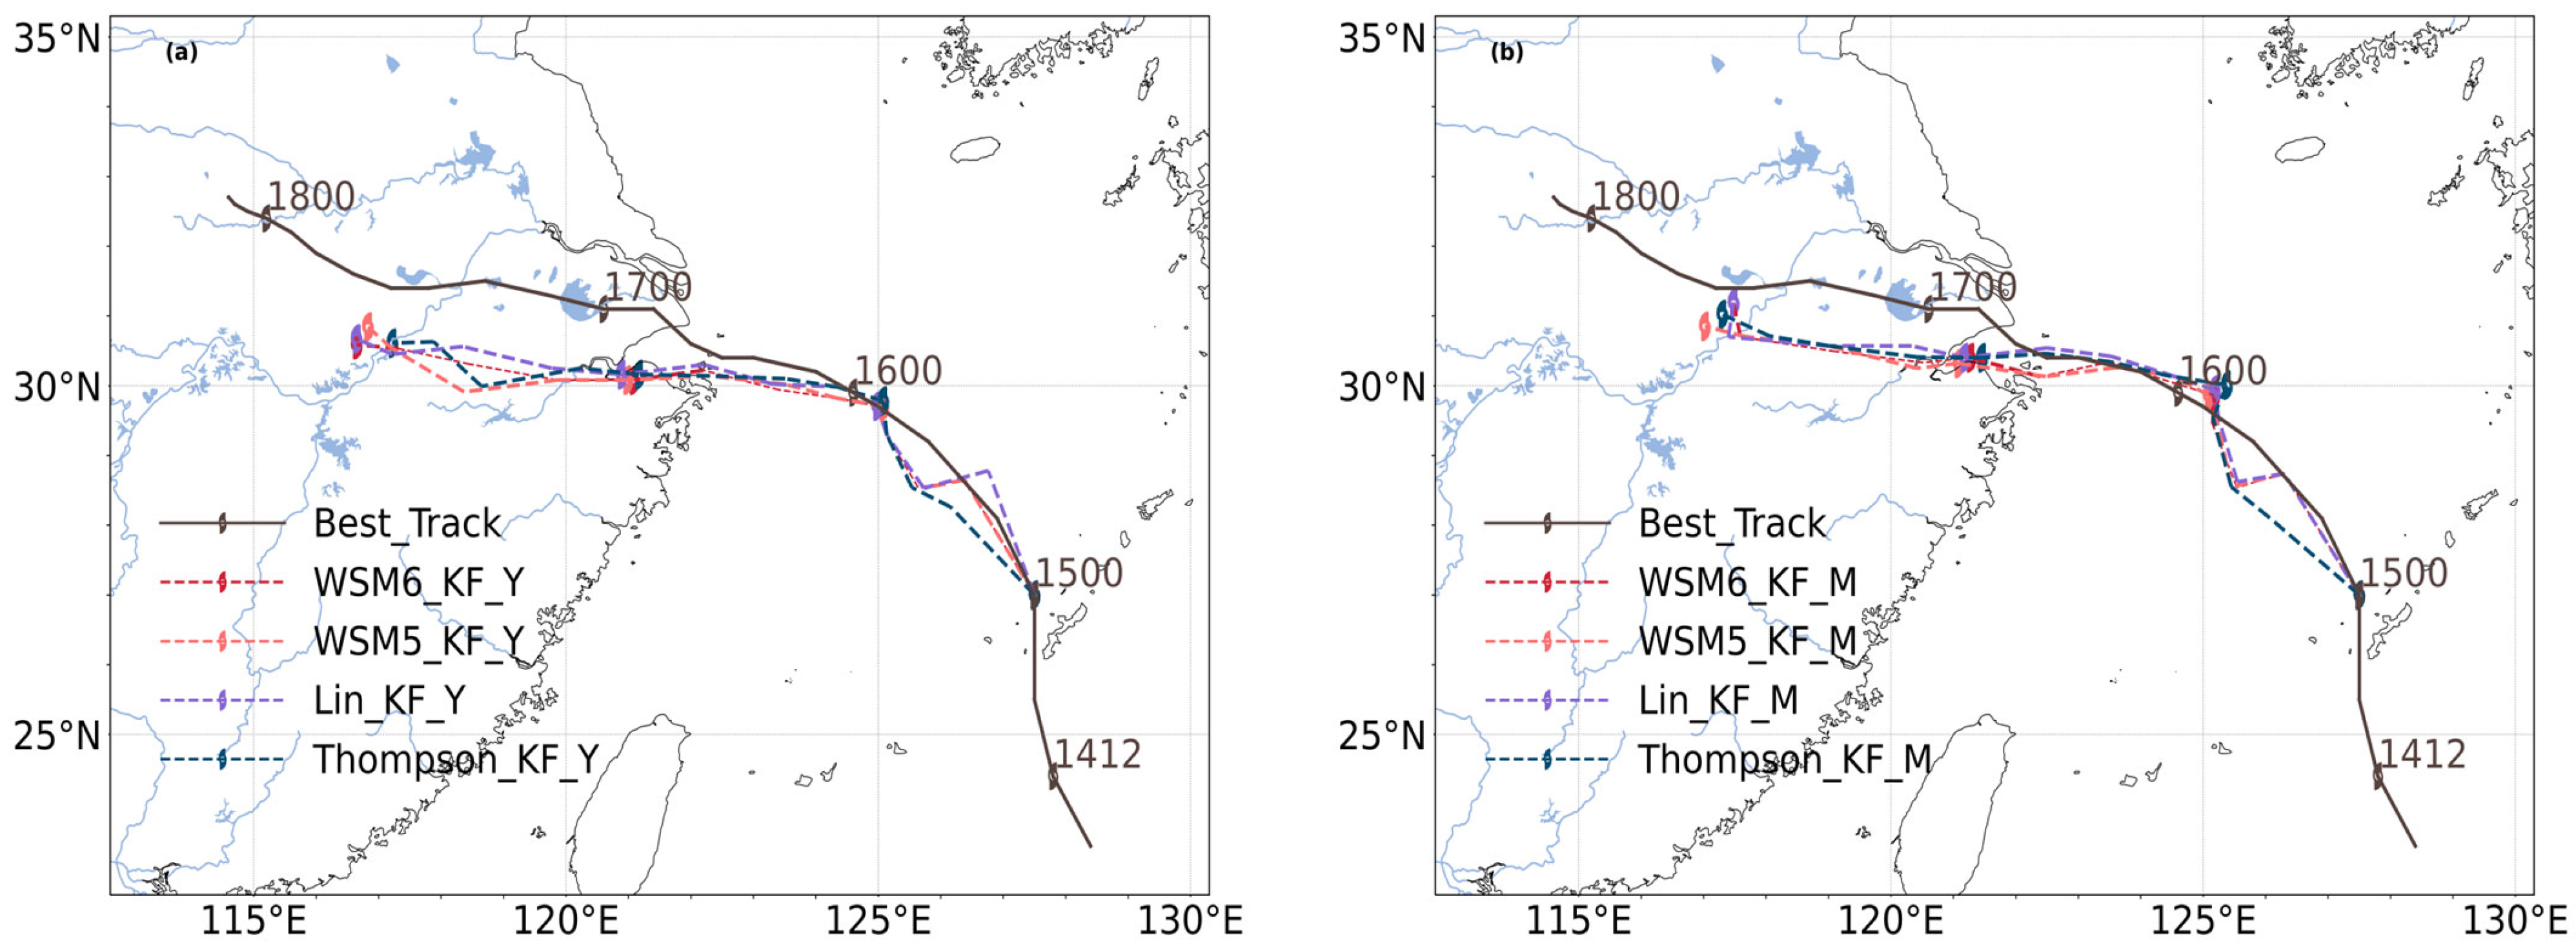
The simulated track evolution of Typhoon Rumbia over time for different parameterization schemes (KF_Y (a), KF_M (b), GF_Y (c), and GF_M (d)) is shown in Figure 3. The typhoon generally moved northwestward. The predicted tracks of KF_Y (a) and KF_M (b) combinations were in good agreement with the observed typhoon track released by the China Meteorological Administration before typhoon landfall. However, after typhoon landfall, both the KF_Y (a) and KF_M (b) combination tracks exhibited a certain degree of southward deviation. The GF_Y (c) and GF_M (d) combinations showed a more pronounced southward deviation.
In Figure 3a–d, it can be seen that different microphysical parameterization schemes have a relatively small impact on the simulation of typhoon tracks. A horizontal comparison of Figure 3a–d shows that different boundary layer parameterization schemes have a more significant impact on the simulation of typhoon tracks, with MYJ being superior to YSU. A vertical comparison of Figure 3a–d shows that different convective parameterization schemes have a particularly significant impact on the simulation of typhoon tracks, with Grell–Freitas being superior to Kain–Fritsch, especially after landfall.
Table 3 summarizes the average track errors of Typhoon Rumbia simulated by different parameterization schemes on the first day, second day, third day, and daily average. As shown in the table, the GF_M combination scheme has the minimum average track error on the first day, with the Thompson_GF_M combination scheme having the minimum average track error of 40.90 km. The KF_Y combination scheme has the minimum average error on the second day, while the Lin_KF_Y combination scheme has the minimum average error of 61.38 km. The GF_M combination scheme has the minimum average error on the third day, while the WSM5_GF_M combination scheme has the minimum average error of 165.30 km. The KF_Y combination scheme also has the minimum average error for daily simulation; the Lin_KF_Y and WSM5_GF_M combination schemes have relatively small average track errors of 104.73 km and 104.98 km, respectively.
Overall, the comparison of different combination schemes showed that the simulation track error of Typhoon Rumbia with different microphysical parameterization schemes was relatively stable at different time periods, while the simulation track results with different cumulus convection and boundary layer parameterization schemes showed significant temporal variations. Compared to the other schemes, the Lin_KF_Y combination scheme exhibits the smallest track error at both the 24–48 h and 0–72 h predictions, indicating superior predicting performance for the track of Typhoon Rumbia. The Lin_KF_Y combination scheme shows the advantage of accuracy enhancement of typhoon track simulations. It is noteworthy that typhoon track simulation is sensitive to cumulus and boundary layer parameterization schemes. If only one cumulus scheme is adopted in the model, it may lead to larger simulation trajectory errors. Therefore, it is essential to choose appropriate cumulus and boundary layer convection parameterization schemes for typhoon track simulation.
3.1.2. Typhoon Intensity
Figure 4 shows the intensity of Typhoon Rumbia simulated by different combination schemes. Compared with the minimum sea level pressure provided by the China Meteorological Administration, all the schemes, except GF_M (d), overestimated the typhoon intensity, especially the KF_Y (a) and KF_M (b) schemes, which overestimated the typhoon intensity significantly. As can be seen from Figure 4a, the impact of different microphysical parameterization schemes on the typhoon intensity is relatively small. A horizontal comparison of Figure 4a–d, and a vertical comparison of Figure 4a–d, shows that the combination schemes of cumulus convection and boundary layer parameterization has a more significant impact on the intensity of typhoon, especially on the second and third days. The simulated intensity of the GF_M (d) scheme is closer to the actual situation.
The average simulated intensity errors of Typhoon Rumbia by different combination schemes are compared for the first day, second day, third day, and daily average in Table 4. The GF_M (d) scheme combination has the smallest average error for all three days. The Thompson_GF_M scheme combination has the smallest average error of 1.40 hPa on the first day and 0.64 hPa on the second day. The Lin_GF_M scheme combination has the smallest average error of 1.11 hPa on the third day.
The observed differences in intensity errors among various combination schemes arise from the combinations of parameterizations in microphysics, cumulus convection, and boundary layer processes. Various microphysics parameterization schemes exhibit variations in describing microscopic processes, including cloud droplets, raindrops, and ice crystals. Various cumulus convection schemes introduce differences in simulating convective activities and latent heat release, thereby impacting the simulated convection intensity, structure, atmospheric stability, and energy distribution in various combinations. The Thompson_GF_M combination performs well in simulating typhoon intensity because the Thompson microphysics scheme can accurately simulate the small-scale weather processes such as cloud droplets, raindrops, and ice crystals. The Grell–Freitas scheme excels in simulating turbulence and convection, while the MYJ scheme performs exceptionally in simulating terrain and ocean surfaces. After analyzing the simulated intensity bias of different combination schemes, it is apparent that the intensity errors of different microphysical parameterization schemes are comparable. Cumulus convection and boundary layer parameterization schemes have a significant impact on the intensity errors at all times.
3.2. The Impact of GNSS Water Vapor Assimilation
3.2.1. Typhoon Track
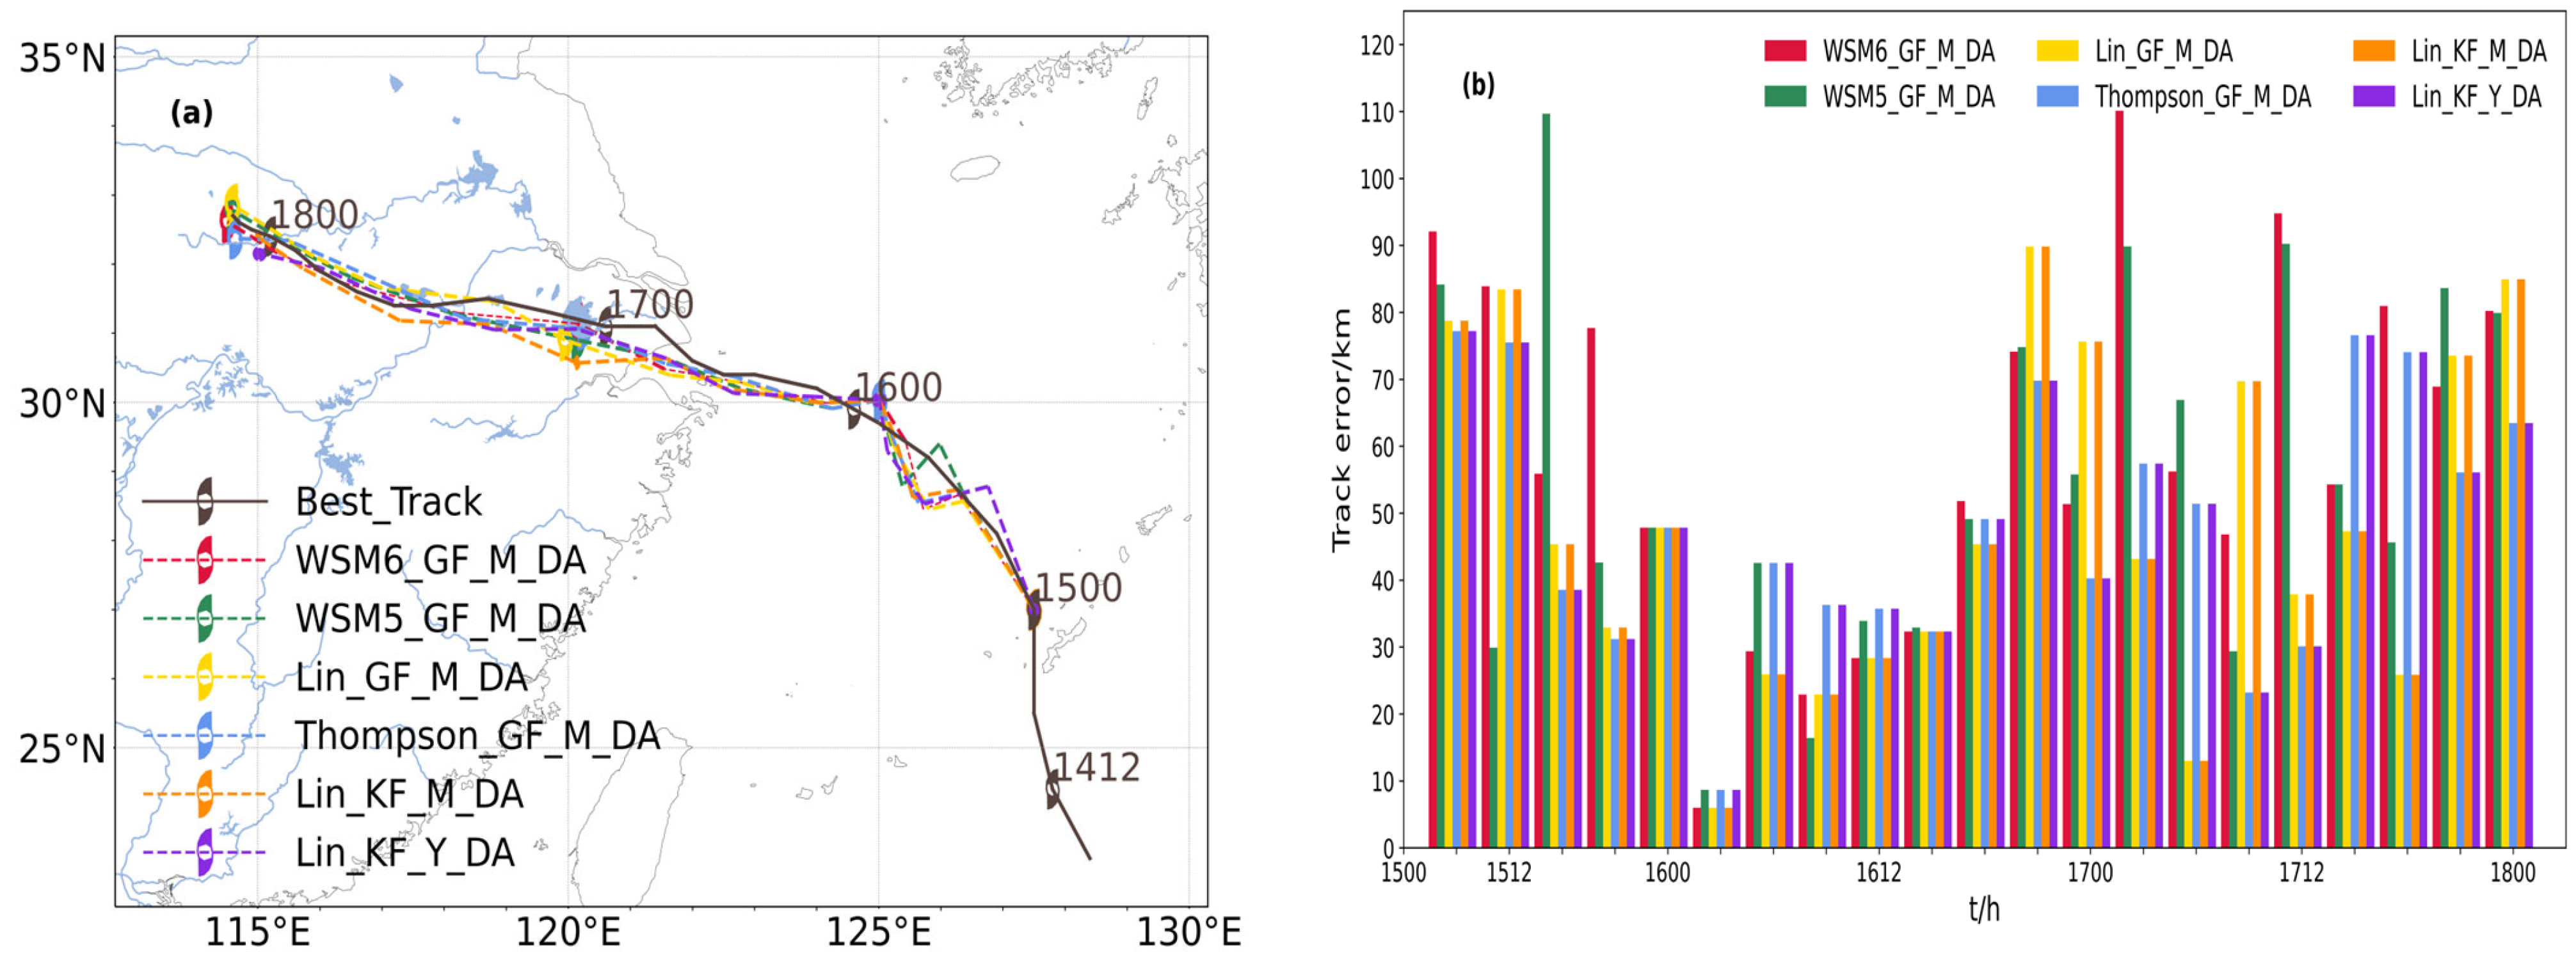
The simulated tracks and errors of Typhoon Rumbia after the data assimilation of GNSS water vapor are shown in Figure 5a,b. Figure 5a shows that the simulated track was generally significantly improved after GNSS water vapor data assimilation, with the southward bias being reduced. The simulated track was closer to the observed track provided by the CMA. Figure 5b shows that the average typhoon track error of each scheme on the second day after the data assimilation of GNSS water vapor was significantly reduced.
Table 5 shows the average typhoon track errors for the first day, second day, third day, and daily average after the GNSS water vapor data assimilation. It shows that the average track error of the Thompson_GF_M_DA scheme combination on the first day is the smallest at 45.05 km (−10%). The average track error of the Lin_KF_Y_DA scheme combination on the second day is the smallest at 32.17 km (48%). The average track error of the Lin_KF_Y_DA scheme combination on the third day is the smallest at 28.03 km (85%). The Lin_KF_Y_DA scheme combination also has the smallest daily average track error at 35.33 km (66%). Combining Figure 5b and Table 5, it is evident that the data assimilation of GNSS water vapor significantly reduces the track errors of different physical parameterization schemes at all times. The daily average track error of the Lin_GF_M_DA scheme combination has the most significant reduction, and the simulation track of the Lin_KF_Y_DA scheme combination is the most accurate.
The Thompson_GF_M-DA combination scheme exhibits lower prediction errors of average typhoon track in the initial 24 h, because its data assimilates the GNSS water vapor, optimizes the model’s initial conditions, and more accurately reflects the actual atmospheric state. These research findings can contribute to a more precise prediction of typhoon movement tracks, enhancing the short-term forecasting accuracy of typhoons. The Lin_KF_Y-DA combination scheme exhibits slightly higher typhoon track errors in the initial 24 h, but the track errors gradually decrease when compared to other schemes in the subsequent timeframe. The 72-h simulation of the Lin_KF_Y-DA combination scheme is notably accurate, precisely simulating the evolution of the typhoon track. The scheme demonstrates minimal fluctuations of track errors throughout the entire simulation, maintaining a relatively low level of track error. This shows that data assimilation effectively enhances the model’s simulation accuracy over a relatively extended timeframe. In conclusion, the data assimilation of GNSS water vapor is an effective method to improve typhoon track simulation. The effect is particularly pronounced in the initial simulation stage.
3.2.2. Typhoon Intensity
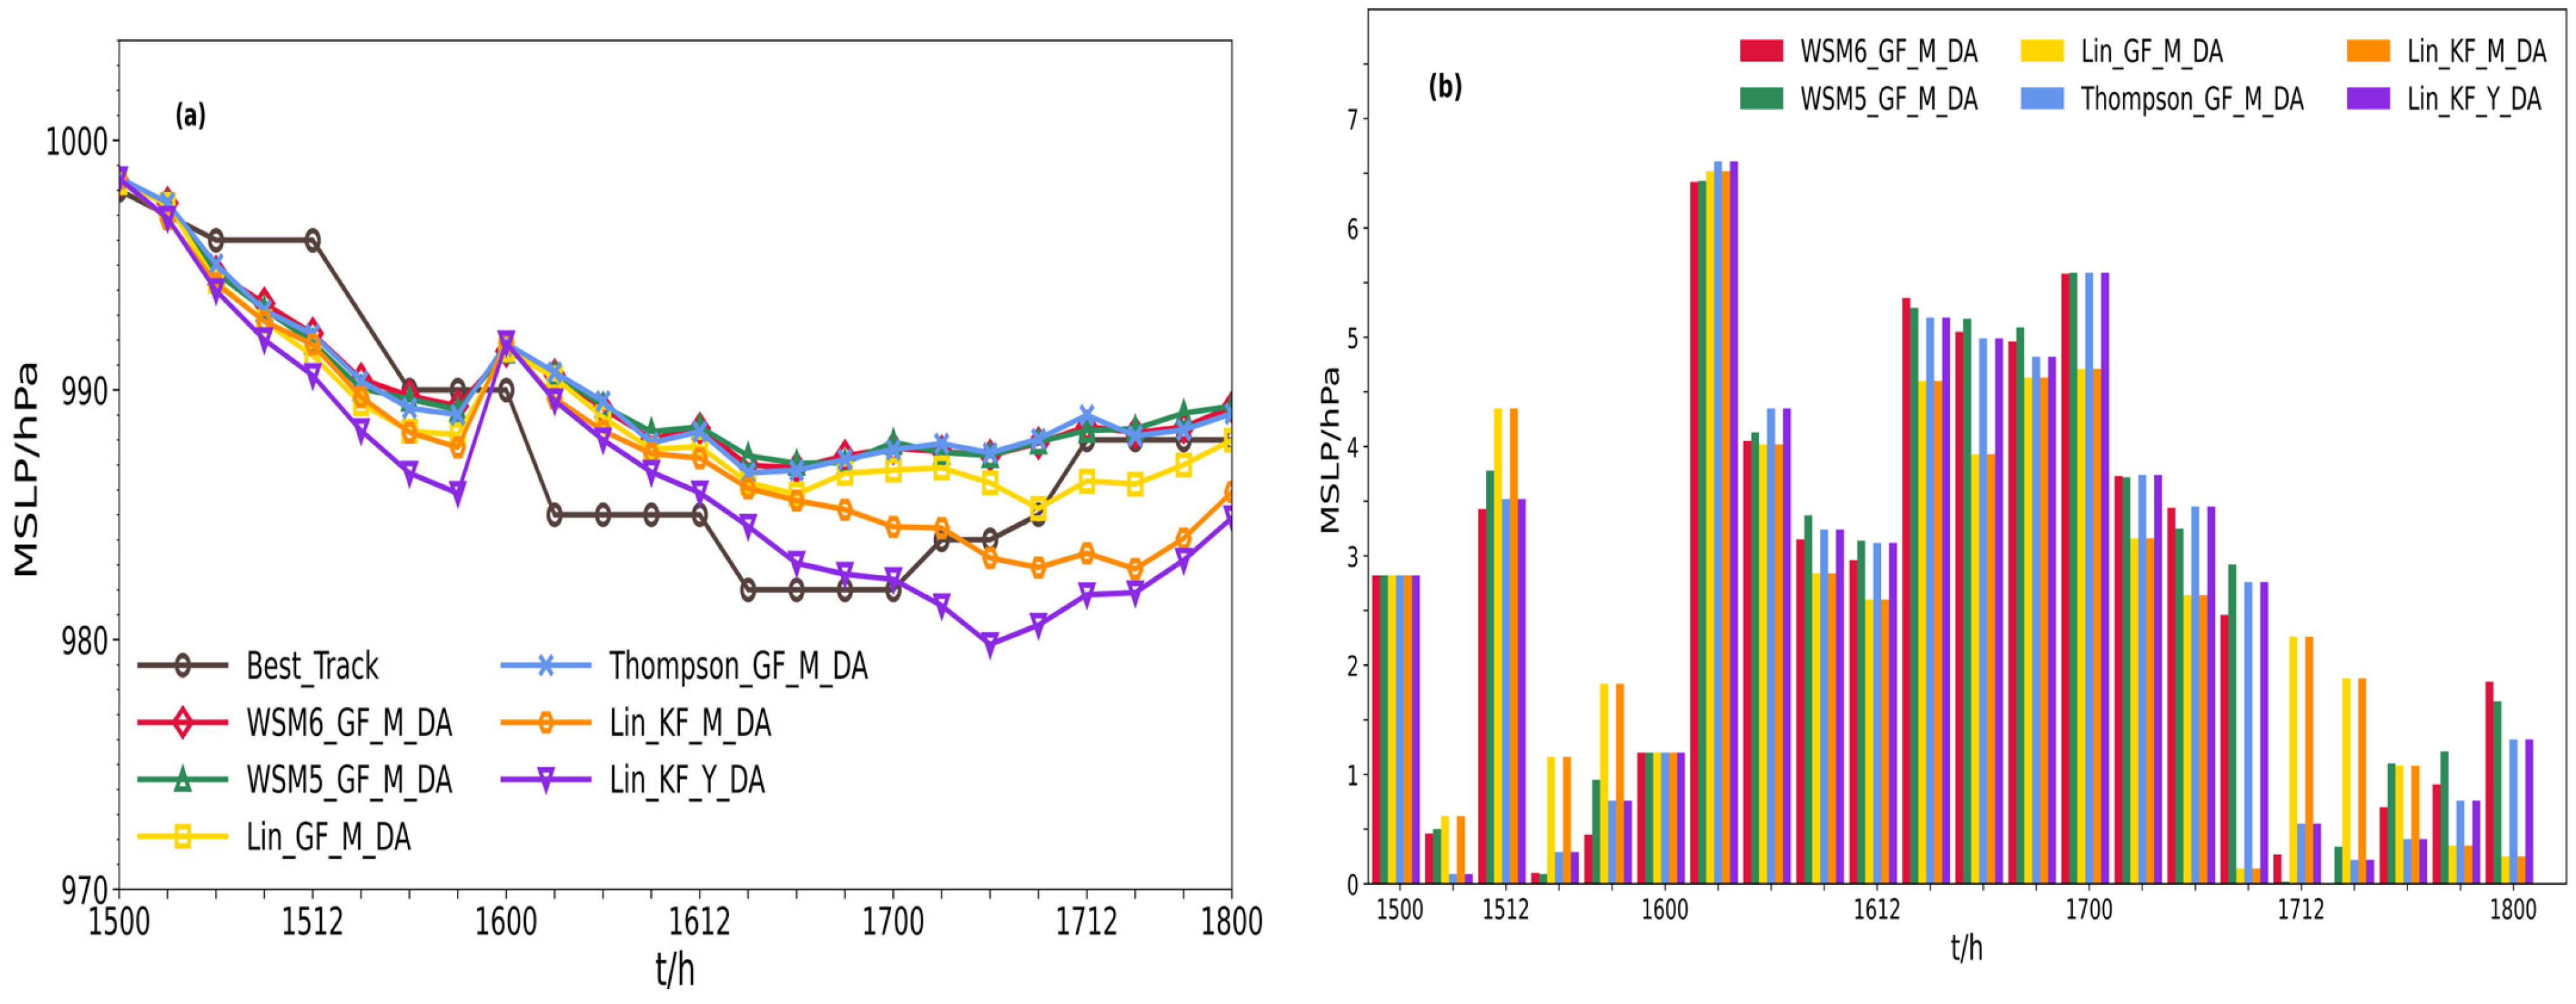
Figure 6 shows the simulated intensity of Typhoon Rumbia. The simulated intensity of all combination schemes after GNSS water vapor data assimilation were generally underestimated on the first day, being lower than the observed intensity. On the second day, the simulated typhoon intensity began to gradually increase, exceeding the observed intensity. The simulated typhoon intensity after GNSS water vapor data assimilation showed a rapidly increasing trend, gradually approaching the best intensity after the third day.
The average simulated intensity errors of Typhoon Rumbia for three consecutive days after assimilating GNSS water vapor data are presented in Table 6. The table shows that the average intensity error of the WSM6_GF_M_DA scheme combination is the smallest on the first day at 1.41 hPa (3%). The average intensity error of the Lin_KF_Y_DA scheme combination is the smallest on the second day at 2.34 hPa (57%). The average intensity error of the Lin_GF_M_DA scheme combination is the smallest on the third day at 1.47 hPa (−32%). The average intensity error of the Lin_GF_M_DA scheme combination is also the smallest on a daily basis, at 2.62 hPa (−47%). Combining Figure 6b and Table 6, it can be concluded that the improvement effect of the intensity error of different combination schemes at different times is not significant after assimilating GNSS water vapor data.
4. Conclusions
In this study, the ARW model was used in combination with four microphysics schemes, two cumulus convection schemes, and two boundary layer parameterization schemes. Various parameterization schemes and GNSS water vapor data assimilations were analyzed to simulate Typhoon Rumbia.
The cumulus convection and boundary layer schemes had a greater impact on the simulation track results of Typhoon Rumbia than microphysical process parameterization scheme. This effect was particularly evident in the track simulations. The selections of an appropriate cumulus convection parameterization scheme can improve the prediction accuracy of typhoon track, which is similar to the findings of Chen et al. [48]. The typhoon track showed a southward trend. The WSM6_GF_Y scheme had a 72-h track error of 35.92 km higher than the WSM6_KF_Y scheme. Among all the schemes, Lin_KF_Y had the best simulation track effect. The typhoon track simulation of the KF and YSU scheme combination performs well, with the track error increasing as the forecast time extends, which is similar to the findings of Osuri et al. [49]. The sensitivity of typhoon intensity to cumulus convection and boundary layer is greater than that of microphysics parameterization schemes during the intensity simulation of Typhoon Rumbia. This is evident from the simulated intensity bias observed for the KF_Y and KF_M in comparison to the GF_Y and GF_M combination schemes [18]. The intensity errors of KF_Y scheme combination are approximately 2–3 hPa higher than other tests during the 72-h period. The simulation typhoon intensity effect combined with the GF_M is significantly better than with other combination schemes. Compared to the microphysics, the parameterization schemes related to cumulus and boundary layers are more important for simulating the track and intensity of typhoons. The main reasons include turbulence, convection, humidity flux, and other processes in the lower atmosphere. Their evolutions have significant impacts on the overall simulation of typhoon structure. Microphysics focuses on the microscopic processes of cloud droplets and precipitation particles. Therefore, the selections of appropriate cumulus and boundary layer parameterization schemes are important factors during typhoon simulations.
The assimilation of GNSS water vapor data significantly improves the simulation accuracy of typhoon tracking, but its impact on typhoon intensity is less pronounced. The data assimilation has a positive impact on improving the prediction of the typhoon track, confirming the findings of Thodsan et al. and Chen et al. [50,51]. GNSS water vapor assimilation reduces simulated track errors, minimizing the southward drift observed in non-assimilated schemes [20]. Compared to the observed typhoon track from CMA, the simulations show an improvement in track errors of over 29.21 km within the second day, 97.83 km during the third day, and 51.88 km over the entire 72-h period. Among the GNSS water vapor data assimilation schemes, the greatest reduction of track errors was from Lin_GF_M-DA, reducing by 82.65 km over 72-h period. The Lin_KF_Y-DA shows the smallest track errors for all four time periods, indicating superior track simulation performance. Over the course of 72 h, the intensity errors for the GF_M-DA combination increase. The Lin_KF_M-DA combination exhibits an increased intensity errors during the second day, followed by a decrease during the third day. The Lin_KF_Y-DA combination shows decreased intensity errors on all three days. Among these combinations, the Lin_KF_Y-DA combination shows a reduction of 3.19 hPa over 72 h.
The focus of this study is Typhoon Rumbia, which may be influenced by the parameterization scheme and GNSS water vapor data assimilation. The WRF simulations require different parameterization scheme combinations in different regions due to its significantly different meteorological and geographical conditions (terrain, ocean conditions, atmospheric conditions, etc.) in different regions. Therefore, the results of this study are only applicable to the mid-latitude region of the western Pacific. More nesting levels can provide higher spatial resolution and capture more details of the eye and outer circulation of a typhoon. However, due to experimental costs and resource constraints, only two nesting levels were ultimately chosen. Modeling inaccuracies may be attributed to factors such as the selected parameterization schemes, boundary conditions, accuracy of meteorological observational data, and the simulation of physical processes. GNSS water vapor data assimilation has evident advantages in improving the reliability of simulation results. However, it also entails potential limitations and uncertainties. First, the limited vertical resolution of GNSS water vapor may lead to less accurate simulation of water vapor distribution in the upper atmosphere. Second, inherent flaws in the model imply the potential generation of systematic errors during the data assimilation process. Last, different choices in data assimilation schemes may result in inaccurate model estimates of actual atmospheric conditions, thereby reducing the reliability of forecasting results. As the WRF model undergoes regular updates and iterations, solutions may evolve in the future. Therefore, it is worthwhile to explore which scheme is better. Based on the Lin_KF_Y-DA, it is imperative to test, optimize, and explore better parameterization combinations and data assimilation techniques. In addition, it is important to place emphasis on the data assimilation of GNSS water vapor, selecting appropriate assimilation intervals, which will be to further improve the accuracy of typhoon simulation and prediction.
Author Contributions
Conceptualization, L.L. and Y.M.; methodology, Y.M.; software, Y.M.; validation, Y.M.; formal analysis, Y.M.; investigation, L.L. and Y.M.; resources, L.L.; data curation, Y.M., M.Z. and J.P.; writing—original draft preparation, Y.M.; writing—review and editing, L.L. and Y.M.; visualization, Y.M. and K.L.; supervision, L.L.; project administration, L.L.; funding acquisition, L.L. All authors have read and agreed to the published version of the manuscript.
Funding
This research was supported in part by the China Natural Science Funds under Grants 41904033 and 42204014, the Jiangsu Province Science and Technology Plan Project under Grant BK20230660, the Jiangsu Province Graduate Practical Innovation Project under Grant SJCX23_1718.
Institutional Review Board Statement
Not applicable.
Informed Consent Statement
Not applicable.
Data Availability Statement
The code of the WRF software was obtained from https://www2.mmm.ucar.edu/wrf/users/download/get_sources.html (accessed on 11 December 2023). The FNL data were adopted from https://doi.org/10.5065/D6M043C6 (accessed on 11 December 2023).
Acknowledgments
The authors would like to express their sincere gratitude to the Research Data Archive at the National Center for Atmospheric Research, Computational and Information Systems Laboratory for the GNSS observations. We also thank the Reviewers for their constructive comments and suggestions, which resulted in a significant improvement in the quality of the paper.
Conflicts of Interest
The authors declare no conflicts of interest.
Abbreviations
The following abbreviations are used in this manuscript.
| WRF | Weather Research and Forecasting |
| KF | Kain-Fritsch |
| GF | Grell-Freitas |
| DA | Data Assimilation |
| GNSS | Global Navigation Satellite System |
| NWP | Numerical Weather Prediction |
| YSU | YonSei University |
| WSM3 | Single-Moment 3-Class Microphysics |
| WSM5 | Single-Moment 5-Class Microphysics |
| WSM6 | Single-Moment 6-Class Microphysics |
| FER | Ferrier |
| GD | Grell–Devenyi |
| GPM | Global Precipitation Measurement |
| ATOVS | Advanced TIROS Operational Vertical Sounder |
| NCEP | National Centers for Environmental Prediction |
| GTS | Global Telecommunication System |
| BMJ | Betts–Miller–Janjić |
| MSW | Maximum Surface Wind |
| MSLP | Minimum Sea Level Pressure |
| RMSE | Root Mean Square Error |
| NCP | No Cumulus Parameterization |
| KES | Kessler |
| COSMIC | Constellation Observing System for Meteorology, Ionosphere, and Climate |
| NCAR | National Center for Atmospheric Research |
| GFS-FNL | Global Forecast System Final Reanalysis Data |
| ARW | Advanced Research WRF |
| NMM | Nonhydrostatic Mesoscale Model |
| GFS | Global Forecast System |
| FNL | Final Reanalysis Data |
| RRTM | Rapid Radiative Transfer Model |
References
- Salarieh, B.; Ugwu, I.A.; Salman, A.M. Impact of changes in sea surface temperature due to climate change on hurricane wind and storm surge hazards across US Atlantic and Gulf coast regions. SN Appl. Sci. 2023, 5, 205. [Google Scholar] [CrossRef]
- Fang, J.; Liu, W.; Yang, S.; Brown, S.; Nicholls, R.J.; Hinkel, J.; Shi, X.; Shi, P. Spatial-temporal changes of coastal and marine disasters risks and impacts in China’s mainland. Ocean Coast. Manag. 2017, 139, 125–140. [Google Scholar] [CrossRef]
- Shoude, G.; Shuiqing, L.; Yijun, H.; Po, H.; Ze, L.; Junqiao, F. Increasing threat of landfalling typhoons in the western North Pacific between 1974 and 2013. Int. J. Appl. Earth Obs. Geoinf. 2017, 68, 279–286. [Google Scholar]
- Rao, C.; Chen, G.; Ran, L. Effects of Typhoon In-Fa (2021) and the Western Pacific Subtropical High on an Extreme Heavy Rainfall Event in Central China. J. Geophys. Res. Atmos. 2023, 128, e2022JD037924. [Google Scholar] [CrossRef]
- Du, M.; Hou, Y.; Hu, P.; Wang, K. Effects of Typhoon Paths on Storm Surge and Coastal Inundation in the Pearl River Estuary, China. Remote Sens. 2020, 12, 1851. [Google Scholar] [CrossRef]
- Xu, H.; Zhao, D.; Yin, J.; Duan, Y.; Gao, W.; Li, Y.; Zhou, L. Indirect Effects of Binary Typhoons on an Extreme Rainfall Event in Henan Province, China From 19 to 21 July 2021. 3. Sensitivities to Microphysics Schemes. J. Geophys. Res. Atmos. 2023, 128, e2022JD037936. [Google Scholar] [CrossRef]
- Yu, Y.; Gao, T.; Xie, L.; Zhang, R.-H.; Zhang, W.; Xu, H.; Cao, F.; Chen, B. Tropical cyclone over the western Pacific triggers the record-breaking ‘21/7’ extreme rainfall in Henan, central-eastern China. Environ. Res. Lett. 2022, 17, 124003. [Google Scholar] [CrossRef]
- Son, J.H.; Kim, H.; Heo, K.Y.; Kwon, J.I.; Jeong, S.H.; Choi, J.Y.; Chun, J.Y.; Kwon, Y.Y.; Choi, J.W. Strategy for the Prediction of Typhoon Wind and Storm Surge Height Using the Parametric Typhoon Model: Case Study for Hinnamnor in 2022. Atmosphere 2022, 14, 82. [Google Scholar] [CrossRef]
- Mamad, T.; Changkye, L.; SeongHoon, K.; JurngJae, Y. Regional Typhoon Track Prediction Using Ensemble k-Nearest Neighbor Machine Learning in the GIS Environment. Remote Sens. 2022, 14, 5292. [Google Scholar]
- SungHun, K.; IlJu, M.; SeongHee, W.; HyounWoo, K.; Kuh, K.S. Decision-Tree-Based Classification of Lifetime Maximum Intensity of Tropical Cyclones in the Tropical Western North Pacific. Atmosphere 2021, 12, 802. [Google Scholar]
- Sun, M.; Yuan, H. Sensitivity Analysis of Microphysics and Cumulus Parameterization Schemes in WRF Model for Typhoon Morakot Simulation. J. Trop. Meteorol. 2014, 30, 941–951. [Google Scholar]
- Ferrier, B.S.; Jin, Y.; Lin, Y.; Black, T.; Rogers, E.; DiMego, G. Implementation of a new grid-scale cloud and precipitation scheme in the NCEP Eta model. In Proceedings of the 15th Conference on Numerical Weather Prediction, San Antonio, TX, USA, 11–18 August 2002; pp. 280–283. [Google Scholar]
- Zhang, C.; Wang, Y.; Hamilton, K. Improved Representation of Boundary Layer Clouds over the Southeast Pacific in ARW-WRF Using a Modified Tiedtke Cumulus Parameterization Scheme. Mon. Weather Rev. 2011, 139, 3489–3513. [Google Scholar] [CrossRef]
- Shepherd, T.J.; Walsh, K.J. Sensitivity of hurricane track to cumulus parameterization schemes in the WRF model for three intense tropical cyclones: Impact of convective asymmetry. Meteorol. Atmos. Phys. 2017, 129, 345–374. [Google Scholar] [CrossRef]
- Borge, R.; Alexandrov, V.; Vas, J.J.d.; Lumbreras, J.; Rodríguez, E. A comprehensive sensitivity analysis of the WRF model for air quality applications over the Iberian Peninsula. Atmos. Environ. 2008, 42, 8560–8574. [Google Scholar] [CrossRef]
- Rajeevan, M.; Kesarkar, A.; Thampi, S.B.; Rao, T.N.; Radhakrishna, B.; Rajasekhar, M. Sensitivity of WRF cloud microphysics to simulations of a severe thunderstorm event over Southeast India. Ann. Geophys. 2010, 28, 603–619. [Google Scholar] [CrossRef]
- Bopape, M.-J.M.; Cardoso, H.; Plant, R.S.; Phaduli, E.; Chikoore, H.; Ndarana, T.; Khalau, L.; Rakate, E. Sensitivity of Tropical Cyclone Idai Simulations to Cumulus Parametrization Schemes. Atmosphere 2021, 12, 932. [Google Scholar] [CrossRef]
- Tu, C.; Zhao, Z.; Zhou, M.; Li, W.; Xie, M.; Ni, C.; Chen, S. Assessment of Different Boundary Layer Parameterization Schemes in Numerical Simulations of Typhoon Nida (2016) Based on Aircraft Observations. Atmosphere 2023, 14, 1403. [Google Scholar] [CrossRef]
- Di, Z.; Gong, W.; Gan, Y.; Shen, C.; Duan, Q. Combinatorial Optimization for WRF Physical Parameterization Schemes: A Case Study of Three-Day Typhoon Simulations over the Northwest Pacific Ocean. Atmosphere 2019, 10, 233. [Google Scholar] [CrossRef]
- Singh, K.S.; Mandal, M.; Bhaskaran, P.K. Impact of radiance data assimilation on the prediction performance of cyclonic storm SIDR using WRF-3DVAR modelling system. Meteorol. Atmos. Phys. 2019, 131, 11–28. [Google Scholar] [CrossRef]
- Wen, X.; Lu, S.; Jin, J. Integrating Remote Sensing Data with WRF for Improved Simulations of Oasis Effects on Local Weather Processes over an Arid Region in Northwestern China. J. Hydrometeorol. 2012, 13, 573–587. [Google Scholar] [CrossRef]
- Hong, S.Y.; Noh, Y.; Dudhia, J. A New Vertical Diffusion Package with an Explicit Treatment of Entrainment Processes. Am. Meteorol. Soc. 2006, 134, 125–137. [Google Scholar] [CrossRef]
- Kain, J.S.; Fritsch, J.M. A One-Dimensional Entraining/Detraining Plume Model and Its Application in Convective Parameterization. Am. Meteorol. Soc. 1989, 47, 2784–2802. [Google Scholar] [CrossRef]
- Kain, J.S.; Fritsch, J.M. Convective Parameterization for Mesoscale Models: The Kain-Fritsch Scheme. In The Representation of Cumulus Convection in Numerical Models; American Meteorological Society: Boston, MA, USA, 1993; pp. 165–170. [Google Scholar]
- Kain, J.S. The Kain–Fritsch convective parameterization: An update. Am. Meteorol. Soc. 2004, 43, 170–181. [Google Scholar] [CrossRef]
- Raju, P.V.S.; Potty, J.; Mohanty, U.C. Sensitivity of physical parameterizations on prediction of tropical cyclone Nargis over the Bay of Bengal using WRF model. Meteorol. Atmos. Phys. 2011, 113, 125–137. [Google Scholar] [CrossRef]
- JanjiÄ, Z.a.I. The Step-Mountain Eta Coordinate Model: Further Developments of the Convection, Viscous Sublayer, and Turbulence Closure Schemes. Am. Meteorol. Soc. 1994, 122, 927–945. [Google Scholar] [CrossRef]
- Kanase, R.D.; Salvekar, P.S. Effect of physical parameterization schemes on track and intensity of cyclone LAILA using WRF model. Asia-Pac. J. Atmos. Sci. 2015, 51, 205–227. [Google Scholar] [CrossRef]
- Chutia, L.; Pathak, B.; Parottil, A.; Bhuyan, P.K. Impact of microphysics parameterizations and horizontal resolutions on simulation of “MORA” tropical cyclone over Bay of Bengal using Numerical Weather Prediction Model. Meteorol. Atmos. Phys. 2019, 131, 1483–1495. [Google Scholar] [CrossRef]
- Hong, S.Y.; Dudhia, J.; Chen, S.H. A Revised Approach to Ice Microphysical Processes for the Bulk Parameterization of Clouds and Precipitation. Am. Meteorol. Soc. 2004, 132, 103–120. [Google Scholar] [CrossRef]
- Li, X. The Influence of Cumulus Parameterization Schemes in WRF Model on Simulated Tracks and Intensity of Typhoons in the Northwestern Pacific. Sci. Sin. Terrae 2012, 42, 1966–1978. [Google Scholar]
- Nasrollahi, N.; AghaKouchak, A.; Li, J.; Gao, X.; Hsu, K.; Sorooshian, S. Assessing the Impacts of Different WRF Precipitation Physics in Hurricane Simulations. Weather Forecast. 2012, 27, 1003–1016. [Google Scholar] [CrossRef]
- Ferrier, B.S. A Double-Moment Multiple-Phase Four-Class Bulk Ice Scheme. Part I: Description. Am. Meteorol. Soc. 1994, 51, 249–280. [Google Scholar]
- Grell, G.A.; Dévényi, D. A generalized approach to parameterizing convection combining ensemble and data assimilation techniques. Geophys. Res. Lett. 2002, 29, 38-1–38-4. [Google Scholar] [CrossRef]
- Wang, Y.; Sun, Y.; Liao, Q.; Zhong, Z.; Hu, Y.; Liu, K. Impact of initial storm intensity and size on the simulation of tropical cyclone track and western Pacific subtropical high extent. J. Meteorol. Res. 2017, 31, 946–954. [Google Scholar] [CrossRef]
- Shen, F.; Min, J.; Li, H.; Xu, D.; Xing, J.; Shu, A.; Song, L. The Impact of Assimilating GPM Microwave Imager Data on the Track Forecast of Typhoon Maitak. Haiyang Xuebao 2021, 43, 124–136. [Google Scholar]
- Wang, H.; Liu, Y.; Liu, Y.; Cao, Y.; Liang, H.; Hu, H.; Liang, J.; Tu, M. Assimilation of GNSS PWV with NCAR-RTFDDA to Improve Prediction of a Landfall Typhoon. Remote Sens. 2022, 14, 178. [Google Scholar] [CrossRef]
- Li, X.; Dong, H.; Guo, W.; Gao, T. Assimilation Experiments of ATOVS Data from Different Satellites in Typhoon Simulations. J. Trop. Meteorol. 2012, 28, 157–166. [Google Scholar]
- Song, X.; Yang, X.; Xing, J. Improving Typhoon Model Forecast with Three-Dimensional Variational Assimilation of GPS Occultation Data. Haiyang Xuebao 2013, 35, 67–75. [Google Scholar]
- Xu, D.; Shen, F.; Li, H.; Liu, R.; Wang, Y.; Shu, A. The Impact of Assimilating Clear-Sky Infrared Radiance Data from the Next-Generation Geostationary Meteorological Satellite Himawari-8 on the Forecast of Typhoon Hato. Haiyang Xuebao 2022, 44, 40–52. [Google Scholar]
- Chen, F.; Dudhia, J. Coupling an Advanced Land Surface–Hydrology Model with the Penn State–NCAR MM5 Modeling System. Part I: Model Implementation and Sensitivity. Am. Meteorol. Soc. 2001, 129, 569–585. [Google Scholar] [CrossRef]
- Chen, F.; Dudhia, J. Coupling an Advanced Land Surface–Hydrology Model with the Penn State–NCAR MM5 Modeling System. Part II: Preliminary Model Validation. Am. Meteorol. Soc. 2001, 129, 587–604. [Google Scholar] [CrossRef]
- Mlawer, E.J.; Taubman, S.J.; Brown, P.D.; Iacono, M.J.; Clough, S.A. Radiative transfer for inhomogeneous atmospheres: RRTM, a validated correlated-k model for the longwave. J. Geophys. Res. Atmos. 1997, 102, 16663–16682. [Google Scholar] [CrossRef]
- Dudhia, J. Numerical Study of Convection Observed during the Winter Monsoon Experiment Using a Mesoscale Two-Dimensional Model. Am. Meteorol. Soc. 1988, 46, 3077–3107. [Google Scholar] [CrossRef]
- Ma, H.; Cao, X.; Ma, X.; Su, H.; Jing, Y.; Zhu, K. Improving the Wind Power Density Forecast in the Middle- and High-Latitude Regions of China by Selecting the Relatively Optimal Planetary Boundary Layer Schemes. Atmosphere 2022, 13, 2034. [Google Scholar] [CrossRef]
- Hu, X.M.; Klein, P.M.; Xue, M. Evaluation of the updated YSU planetary boundary layer scheme within WRF for wind resource and air quality assessments. J. Geophys. Res. Atmos. 2013, 118, 10490–10505. [Google Scholar] [CrossRef]
- Shikhovtsev, A.Y.; Kovadlo, P.G.; Lezhenin, A.A.; Korobov, O.A.; Kiselev, A.V.; Russkikh, I.V.; Kolobov, D.Y.; Shikhovtsev, M.Y. Influence of Atmospheric Flow Structure on Optical Turbulence Characteristics. Appl. Sci. 2023, 13, 1282. [Google Scholar] [CrossRef]
- Chen, S.; Qian, Y.-K.; Peng, S. Effects of various combinations of boundary layer schemes and microphysics schemes on the track forecasts of tropical cyclones over the South China Sea. Nat. Hazards 2015, 78, 61–74. [Google Scholar] [CrossRef]
- Osuri, K.K.; Mohanty, U.; Routray, A.; Kulkarni, M.A.; Mohapatra, M. Customization of WRF-ARW model with physical parameterization schemes for the simulation of tropical cyclones over North Indian Ocean. Nat. Hazards 2012, 63, 1337–1359. [Google Scholar] [CrossRef]
- Thodsan, T.; Wu, F.; Torsri, K.; Cuestas, E.M.A.; Yang, G. Satellite Radiance Data Assimilation Using the WRF-3DVAR System for Tropical Storm Dianmu (2021) Forecasts. Atmosphere 2022, 13, 956. [Google Scholar] [CrossRef]
- Chen, S.-Y.; Nguyen, T.-C.; Huang, C.-Y. Impact of Radio Occultation Data on the Prediction of Typhoon Haishen (2020) with WRFDA Hybrid Assimilation. Atmosphere 2021, 12, 1397. [Google Scholar] [CrossRef]
Figure 1.
The simulation region “d01” and “d02” of Typhoon Rumbia, where the shading is the terrain altitude (m).
Figure 1.
The simulation region “d01” and “d02” of Typhoon Rumbia, where the shading is the terrain altitude (m).
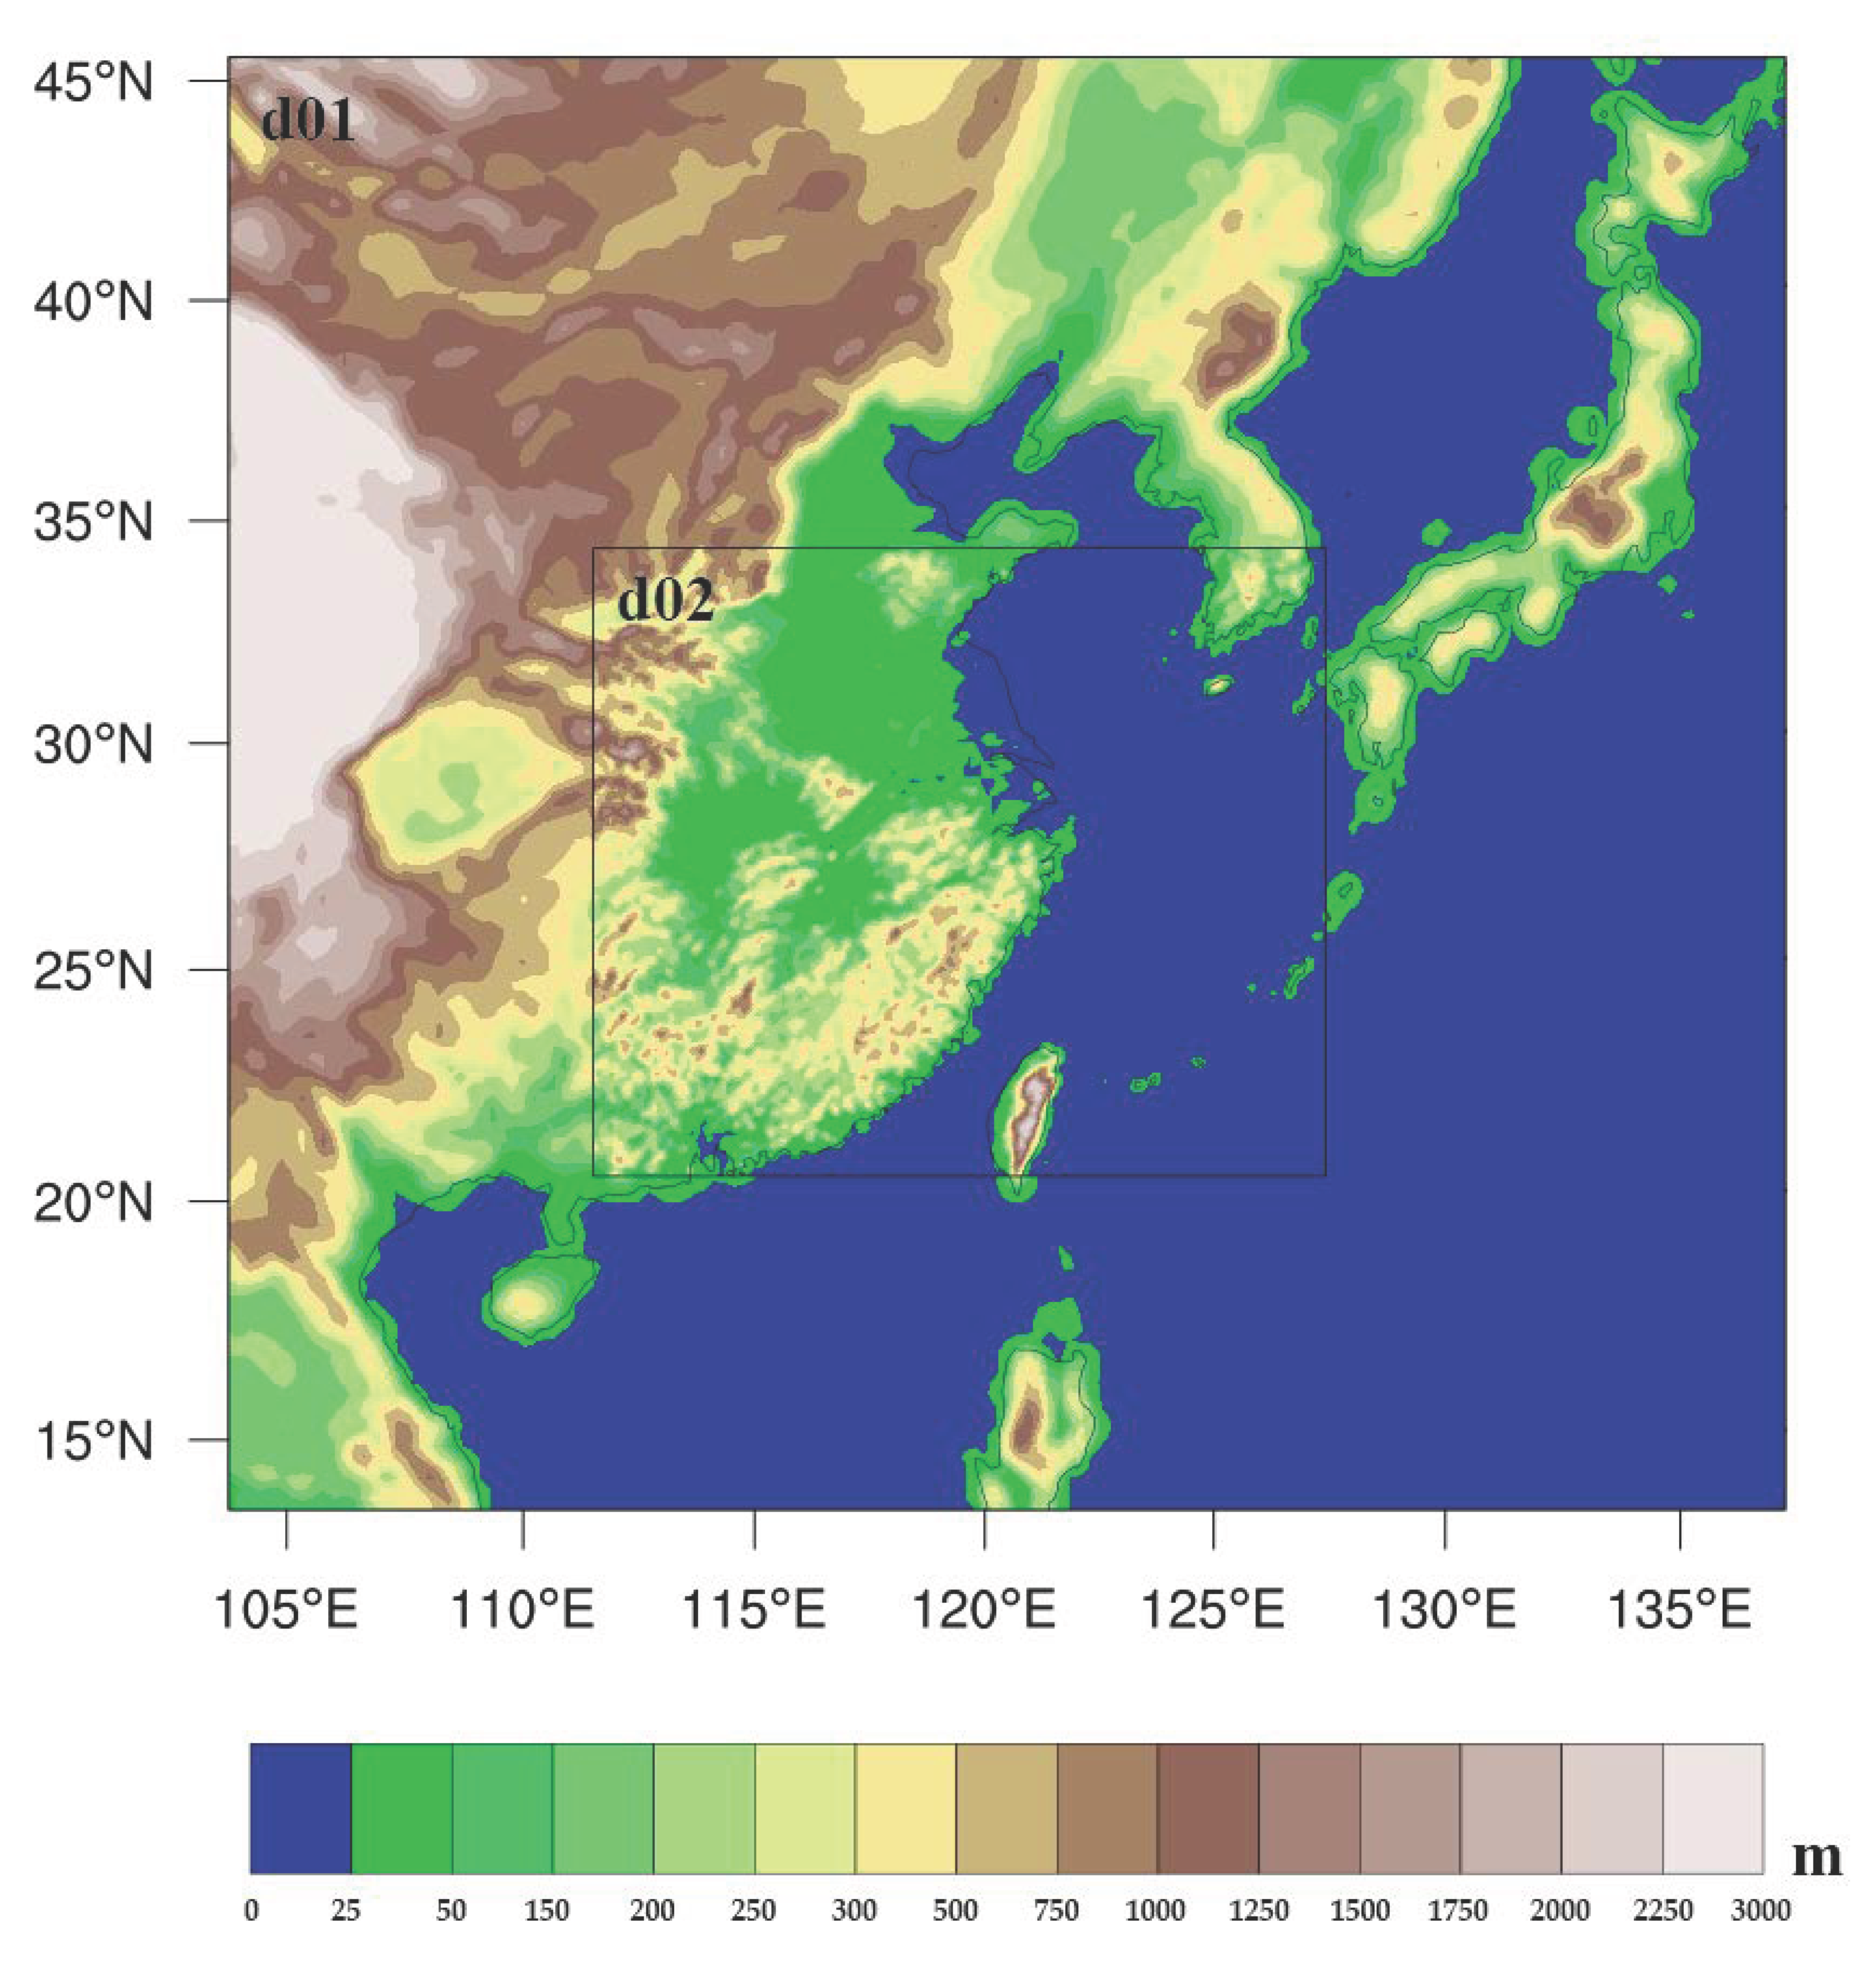
Figure 2.
The flowchart of data assimilation and parameterization schemes in the WRF model.
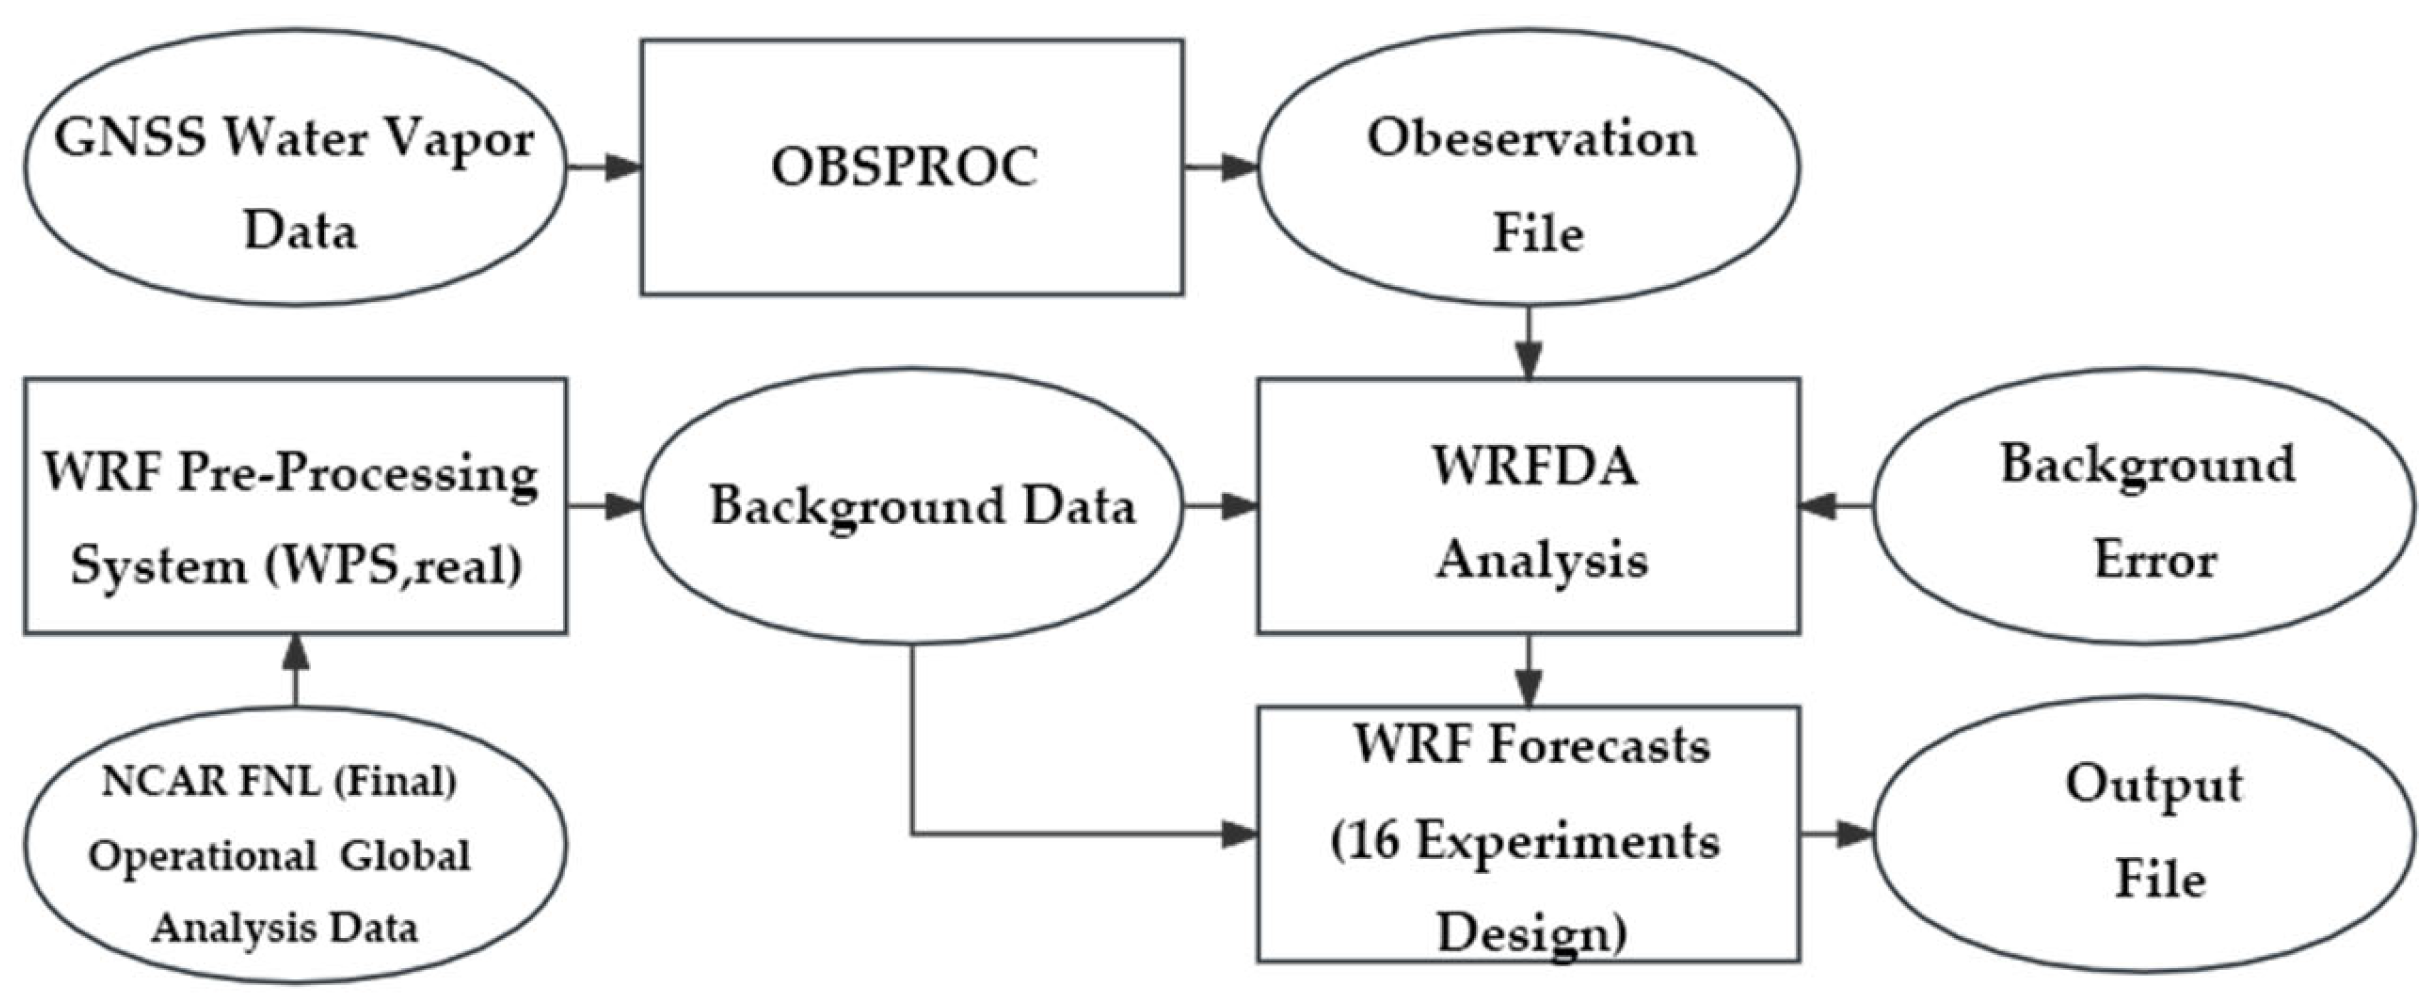
Figure 3.
The comparison of typhoon track from different parameterization combination schemes with the observed track of Typhoon Rumbia for the KF_Y (a), the KF_M (b), the GF_Y (c), and GF_M (d).
Figure 3.
The comparison of typhoon track from different parameterization combination schemes with the observed track of Typhoon Rumbia for the KF_Y (a), the KF_M (b), the GF_Y (c), and GF_M (d).


Figure 4.
The comparison of typhoon intensity from different parameterization combination schemes with the observed intensity of Typhoon Rumbia for the KF_Y (a), the KF_M (b), the GF_Y (c), and GF_M (d) combination schemes.
Figure 4.
The comparison of typhoon intensity from different parameterization combination schemes with the observed intensity of Typhoon Rumbia for the KF_Y (a), the KF_M (b), the GF_Y (c), and GF_M (d) combination schemes.

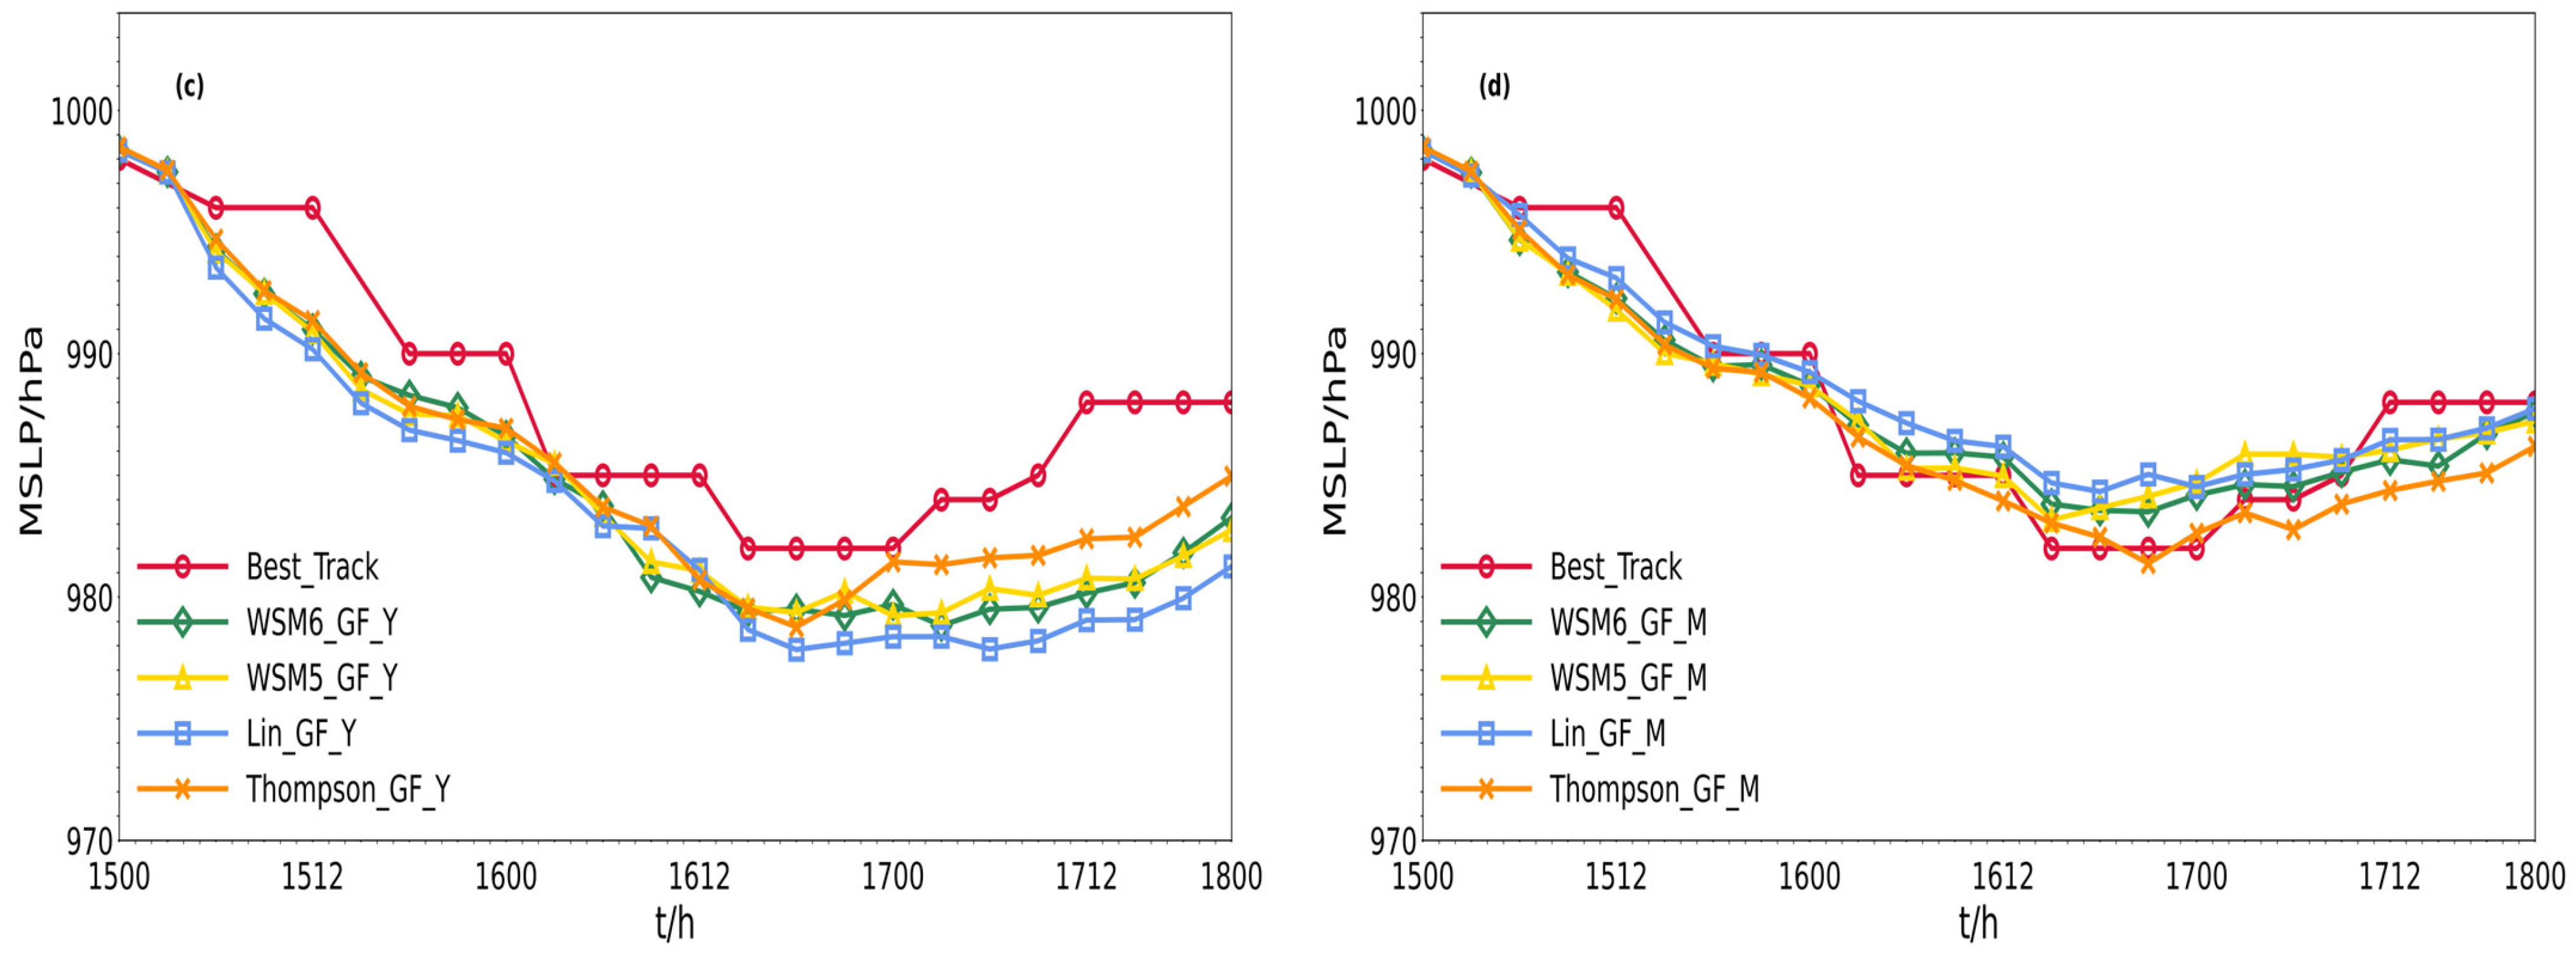
Figure 5.
Comparison of simulated typhoon tracks (a) and track errors (b) after data assimilation for the selected parameterization combination schemes.
Figure 5.
Comparison of simulated typhoon tracks (a) and track errors (b) after data assimilation for the selected parameterization combination schemes.

Figure 6.
Comparison of simulated typhoon intensity (a) and intensity error (b) after GNSS water vapor data assimilation for the selected parameterization combination schemes (hPa).
Figure 6.
Comparison of simulated typhoon intensity (a) and intensity error (b) after GNSS water vapor data assimilation for the selected parameterization combination schemes (hPa).

Table 1.
Overview of WRF model configuration for Typhoon Rumbia.
| WRF Model | Configurations |
|---|---|
| WRF Version | WRF 4.4.1 |
| Horizontal resolution/km | 27:9 |
| Mode integration time/h | 72 |
| Microphysical scheme | WSM6, WSM5, Lin, Thompson |
| Cumulus convection scheme | Kain-Fritsch (KF), Grell-Freitas (GF) |
| Boundary layer scheme | YSU (Y), MYJ (M) |
| Long wave radiation scheme | RRTM |
| Short wave radiation scheme | Dudhia |
| Land layer scheme | Noah |
Table 2.
The parameterization combination schemes of WRF model.
| Group No. | Name | Microphysics | Cumulus | Boundary Layer |
|---|---|---|---|---|
| 1 | WSM6_KF_Y | WSM6 | Kain-Fritsch | YSU |
| 2 | WSM5_KF_Y | WSM5 | Kain-Fritsch | YSU |
| 3 | Lin_KF_Y | Lin | Kain-Fritsch | YSU |
| 4 | Thompson_KF_Y | Thompson | Kain-Fritsch | YSU |
| 5 | WSM6_KF_M | WSM6 | Kain-Fritsch | MYJ |
| 6 | WSM5_KF_M | WSM5 | Kain-Fritsch | MYJ |
| 7 | Lin_KF_M | Lin | Kain-Fritsch | MYJ |
| 8 | Thompson_KF_M | Thompson | Kain-Fritsch | MYJ |
| 9 | WSM6_GF_Y | WSM6 | Grell-Freitas | YSU |
| 10 | WSM5_GF_Y | WSM5 | Grell-Freitas | YSU |
| 11 | Lin_GF_Y | Lin | Grell-Freitas | YSU |
| 12 | Thompson_GF_Y | Thompson | Grell-Freitas | YSU |
| 13 | WSM6_GF_M | WSM6 | Grell-Freitas | MYJ |
| 14 | WSM5_GF_M | WSM5 | Grell-Freitas | MYJ |
| 15 | Lin_GF_M | Lin | Grell-Freitas | MYJ |
| 16 | Thompson_GF_M | Thompson | Grell-Freitas | MYJ |
Table 3.
The track errors of different parameterization combination schemes (km).
| Name | 0–24 h | 24–48 h | 48–72 h | 0–72 h |
|---|---|---|---|---|
| WSM6_KF_Y | 50.45 | 72.49 | 211.69 | 117.10 |
| WSM5_KF_Y | 52.41 | 71.11 | 207.68 | 115.67 |
| Lin_KF_Y | 49.18 | 61.38 | 189.74 | 104.73 |
| Thompson_KF_Y | 55.77 | 69.96 | 234.82 | 126.04 |
| WSM6_KF_M | 52.39 | 72.69 | 240.03 | 128.01 |
| WSM5_KF_M | 53.70 | 70.96 | 221.11 | 120.85 |
| Lin_KF_M | 53.75 | 69.24 | 223.64 | 121.16 |
| Thompson_KF_M | 56.27 | 73.91 | 242.14 | 130.27 |
| WSM6_GF_Y | 70.03 | 129.73 | 238.55 | 153.02 |
| WSM5_GF_Y | 57.07 | 154.42 | 270.27 | 170.00 |
| Lin_GF_Y | 56.01 | 129.23 | 228.52 | 145.37 |
| Thompson_GF_Y | 51.65 | 116.40 | 247.37 | 146.37 |
| WSM6_GF_M | 56.06 | 102.83 | 181.85 | 118.81 |
| WSM5_GF_M | 53.26 | 83.45 | 165.30 | 104.98 |
| Lin_GF_M | 55.76 | 83.17 | 228.55 | 128.56 |
| Thompson_GF_M | 40.90 | 90.12 | 182.66 | 110.35 |
Table 4.
The intensity errors of different parameterization combination schemes (hPa).
| Name | 0–24 h | 24–48 h | 48–72 h | 0–72 h |
|---|---|---|---|---|
| WSM6_KF_Y | 3.14 | 7.09 | 11.15 | 7.49 |
| WSM5_KF_Y | 3.10 | 6.50 | 10.87 | 7.16 |
| Lin_KF_Y | 3.35 | 5.47 | 9.63 | 6.41 |
| Thompson_KF_Y | 2.95 | 6.95 | 11.20 | 7.40 |
| WSM6_KF_M | 2.16 | 2.16 | 7.80 | 4.22 |
| WSM5_KF_M | 2.19 | 2.25 | 6.77 | 3.87 |
| Lin_KF_M | 2.35 | 2.83 | 7.40 | 4.36 |
| Thompson_KF_M | 2.24 | 3.75 | 9.67 | 5.49 |
| WSM6_GF_Y | 2.28 | 2.59 | 5.81 | 3.68 |
| WSM5_GF_Y | 2.55 | 2.22 | 5.51 | 3.51 |
| Lin_GF_Y | 3.20 | 2.56 | 7.21 | 4.42 |
| Thompson_GF_Y | 2.32 | 1.94 | 3.78 | 2.71 |
| WSM6_GF_M | 1.46 | 1.64 | 1.13 | 1.41 |
| WSM5_GF_M | 1.61 | 1.40 | 1.42 | 1.46 |
| Lin_GF_M | 1.89 | 2.37 | 1.11 | 1.78 |
| Thompson_GF_M | 1.40 | 0.64 | 2.06 | 1.36 |
Table 5.
Track errors and improvement rate after the GNSS water vapor data assimilation (km).
| Name | 0–24 h | 24–48 h | 48–72 h | 0–72 h | ||||
|---|---|---|---|---|---|---|---|---|
| Before | After | Before | After | Before | After | Before | After | |
| WSM6_GF_M_DA | 56.06 | 59.55 (−6%) | 102.83 | 37.02 (64%) | 181.85 | 74.03 (59%) | 118.81 | 56.62 (52%) |
| WSM5_GF_M_DA | 53.26 | 52.36 (2%) | 83.45 | 39.27 (53%) | 165.30 | 67.47 (59%) | 104.98 | 53.10 (49%) |
| Lin_GF_M_DA | 55.76 | 48.05 (14%) | 83.17 | 40.79 (51%) | 228.55 | 49.43 (78%) | 128.56 | 45.91 (64%) |
| Thompson_GF_M_DA | 40.90 | 45.05 (−10%) | 90.12 | 39.35 (56%) | 182.66 | 54.04 (70%) | 110.35 | 46.25 (58%) |
| Lin_KF_M_DA | 53.75 | 50.76 (6%) | 69.24 | 43.84 (37%) | 223.64 | 29.76 (87%) | 121.16 | 40.60 (66%) |
| Lin_KF_Y_DA | 49.18 | 49.28 (0%) | 61.38 | 32.17 (48%) | 189.74 | 28.03 (85%) | 104.73 | 35.33 (66%) |
Table 6.
The typhoon intensity errors and improvement rate after GNSS water vapor data assimilation (hPa).
Table 6.
The typhoon intensity errors and improvement rate after GNSS water vapor data assimilation (hPa).
| Name | 0–24 h | 24–48 h | 48–72 h | 0–72 h | ||||
|---|---|---|---|---|---|---|---|---|
| Before | After | Before | After | Before | After | Before | After | |
| WSM6_GF_M_DA | 1.46 | 1.41 (3%) | 1.64 | 4.69 (−186%) | 1.13 | 1.67 (−48%) | 1.41 | 2.70 (−91%) |
| WSM5_GF_M_DA | 1.61 | 1.56 (3%) | 1.4 | 4.77 (−241%) | 1.42 | 1.78 (−25%) | 1.46 | 2.81 (−92%) |
| Lin_GF_M_DA | 1.89 | 2.00 (−6%) | 2.37 | 4.23 (−78%) | 1.11 | 1.47 (−32%) | 1.78 | 2.62 (−47%) |
| Thompson_GF_M_DA | 1.40 | 1.45 (-3%) | 0.64 | 4.74 (−641%) | 2.06 | 1.65 (20%) | 1.36 | 2.72 (−100%) |
| Lin_KF_M_DA | 2.35 | 2.04 (13%) | 2.83 | 3.48 (−23%) | 7.40 | 2.72 (63%) | 4.36 | 2.81 (36%) |
| Lin_KF_Y_DA | 3.35 | 2.75 (18%) | 5.47 | 2.34 (57%) | 9.36 | 4.44 (53%) | 6.41 | 3.22 (50%) |
Disclaimer/Publisher’s Note: The statements, opinions and data contained in all publications are solely those of the individual author(s) and contributor(s) and not of MDPI and/or the editor(s). MDPI and/or the editor(s) disclaim responsibility for any injury to people or property resulting from any ideas, methods, instructions or products referred to in the content. |
© 2024 by the authors. Licensee MDPI, Basel, Switzerland. This article is an open access article distributed under the terms and conditions of the Creative Commons Attribution (CC BY) license (https://creativecommons.org/licenses/by/4.0/).
Share and Cite
MDPI and ACS Style
Li, L.; Ma, Y.; Li, K.; Pan, J.; Zhang, M. The WRF Simulation Influence of Assimilating GNSS Water Vapor and Parameterization Schemes on Typhoon Rumbia. Atmosphere 2024, 15, 255. https://doi.org/10.3390/atmos15030255
AMA Style
Li L, Ma Y, Li K, Pan J, Zhang M. The WRF Simulation Influence of Assimilating GNSS Water Vapor and Parameterization Schemes on Typhoon Rumbia. Atmosphere. 2024; 15(3):255. https://doi.org/10.3390/atmos15030255
Chicago/Turabian StyleLi, Li, Yixiang Ma, Kai Li, Jianping Pan, and Mingsong Zhang. 2024. "The WRF Simulation Influence of Assimilating GNSS Water Vapor and Parameterization Schemes on Typhoon Rumbia" Atmosphere 15, no. 3: 255. https://doi.org/10.3390/atmos15030255
Note that from the first issue of 2016, this journal uses article numbers instead of page numbers. See further details here.