
Assessing the Performance of Water Vapor Products from ERA5 and MERRA-2 during Heavy Rainfall in the Guangxi Region of China

1
School of Geosciences and Info-Physics, Central South University, Changsha 410000, China
2
Laboratory of GeoHazards Perception, Cognition and Predication, Central South University, Changsha 410000, China
3
Hunan Engineering Research Center of BDS High Precision Satellite Navigation and Location Based Service, Changsha 410000, China
4
School of Land Science and Technology, China University of Geosciences, Beijing 100083, China
5
College of Geomatics and Geoinformation, Guilin University of Technology, Guilin 541006, China
6
Hunan Province Mapping and Science and Technology Investigation Institute, Changsha 410000, China
*
Author to whom correspondence should be addressed.
Atmosphere 2024, 15(3), 306; https://doi.org/10.3390/atmos15030306
Submission received: 21 January 2024
/
Revised: 27 February 2024
/
Accepted: 27 February 2024
/
Published: 29 February 2024
(This article belongs to the Special Issue GNSS Remote Sensing in Atmosphere and Environment)
Abstract
:Precipitable water vapor (PWV) is a crucial factor in regulating the Earth’s climate. Moreover, it demonstrates a robust correlation with precipitation. Situated in a region known for the generation and development of tropical cyclones, Guangxi in China is highly susceptible to floods triggered via intense rainfall. The atmospheric water vapor in this area displays prominent spatiotemporal features, thus posing challenges for precipitation forecasting. The water vapor products within the MERRA-2 and ERA5 reanalysis datasets present an opportunity to overcome constraints associated with low spatiotemporal resolution. In this study, the PWV data derived from GNSS and meteorological measurements in Guangxi from 2016 to 2018 were used to evaluate the accuracy of MERRA-2 and ERA5 water vapor products and their relationship with water vapor variations during extreme rainfall. Using GNSS PWV as a reference, the average bias of MERRA-2 PWV and ERA5 PWV for heavy rainfall was −0.22 mm and 1.84 mm, respectively, with average RMSE values of 3.72 mm and 3.31 mm. For severe rainfall, the average bias of MERRA-2 PWV and ERA5 PWV was −0.14 mm and 2.92 mm, respectively, with average RMSE values of 4.28 mm and 4.01 mm. During heavy rainfall days from Days 178 to 184 in 2017, the average bias of MERRA-2 PWV and ERA5 PWV was 0.92 mm and 2.42 mm, respectively, with average RMSE values of 4.04 mm and 3.40 mm. The accuracy was highest at the Guiping and Hechi stations and lowest at the Hezhou and Rongshui stations. Furthermore, when comparing MERRA-2/ERA5 PWV with GNSS PWV and actual precipitation, the trends in the variations of MERRA-2/ERA5 PWV were generally consistent with GNSS PWV and aligned with the increasing or decreasing trends of actual precipitation. In addition, ERA5 PWV exhibited high accuracy. Before the onset of heavy rainfall, PWV has a sharp surge. During heavy rainfall, PWV reaches its peak value. Subsequently, after the cessation of heavy rainfall, PWV tends to stabilize. Therefore, the reanalysis data of PWV can effectively reveal significant changes in water vapor and actual precipitation during periods of heavy rainfall in the Guangxi region.
1. Introduction
Over the past decades, the rapid advancement of modern urbanization has led to a significant surge in greenhouse gas emissions attributed to human activities. This upsurge has resulted in global climate warming, which has triggered abnormal variations in climatic parameters, such as temperature and precipitation, and subsequently impacted the entire climate system [1]. Particularly intense thunderstorms, violent winds, and other extreme weather conditions during heavy rainfall events pose an increased risk of disasters, such as floods and landslides, with profound implications for agricultural production, transportation, and urban drainage systems [1]. Consequently, the measurement and analysis of the spatiotemporal distribution of water vapor during extreme rainfall have critical significance in predicting and mitigating urban extreme weather conditions.
Precipitable water vapor (PWV) is a fundamental measurement for quantifying the moisture content within the atmosphere [2,3,4]. Its condensation or energy release, mechanisms contribute to the formation of clouds, rain, snow, and other weather phenomena, thus serving as a crucial energy source for extreme weather events, such as heavy rainfall and typhoons [5,6,7,8,9]. Empirical research has consistently demonstrated a robust correlation between atmospheric PWV and rainfall because the occurrence of precipitation relies on an ample supply of water vapor [10,11,12]. Therefore, the accurate detection and characterization of water vapor content and its spatial distribution play a crucial role in forecasting the evolution, intensity, and spatial distribution of intense rainfall events.
The continuous advancement of technology has ushered in highly comprehensive methods for water vapor detection. However, meteorological satellite data suffer from limited temporal resolution [13]. While radiosondes have partially enhanced the availability of PWV, their launch frequency of merely two to four times per day hampers spatiotemporal resolution [14]. The scarcity and exorbitant cost of water vapor radiometers hinder their widespread application [15]. With the continuous advancement of global navigation satellite systems (GNSSs), the utilization of the GNSS-based PWV inversion technique [16] has garnered significant attention because of its advantages, including cost-effectiveness, high precision, and all-weather operability [17,18,19,20,21]. This technique entails the precise measurement of the zenith total delay (ZTD) using GNSS satellites, and it determines the zenith wet delay (ZWD) by removing the zenith hydrostatic delay (ZHD). Then, by utilizing a high-precision atmospheric weighted mean temperature model, the ZWD can be transformed into PWV [22,23,24].
The latest released water vapor products from the ERA5 and MERRA-2 reanalysis datasets provide an opportunity to overcome limitations such as low spatiotemporal resolution. ERA5 represents the fifth-generation global climate reanalysis released by the ECMWF [25], while MERRA-2 is the latest atmospheric reanalysis from NASA [26,27]. Both datasets have been proven to have high spatiotemporal resolution, thus making them a research hotspot for weather analysis [28,29]. Therefore, in the context of extreme rainfall events, evaluating the accuracy of MERRA-2 and ERA5 PWV through GNSS PWV is significant in exploring their applicability in specific regions and under various weather conditions.
The GNSS PWV contains vital information for studying weather conditions, and it has been assimilated into numerical weather prediction systems [30]. Puviarasan et al. [31] compared GPS PWV with hourly rainfall variations and observed an increase in PWV before rainfall and a decrease after rainfall, thus demonstrating the dominant role of water vapor during the rainfall process. Cucurull et al. [32] showed that combining GPS data with water vapor reanalysis products enables an accurate estimation of water vapor content and humidity distribution. Huang et al. [33] utilized the observed data from 11 GNSS stations in Guilin, China, from June to July 2017 to study the spatiotemporal variations in GNSS PWV under heavy rainfall. They revealed the changes in atmospheric water vapor in multiple regions of Guilin during a strong precipitation event. Chen et al. [34] investigated the water vapor characteristics during three heavy rainfall periods in Hong Kong using the CORS network, thus revealing the variations, accumulation, saturation, and condensation processes of moisture during heavy rainfall events. Furthermore, Wu et al. [35] inverted PWV in the Guilin region using MERRA-2 and ERA5 data and analyzed the spatiotemporal distribution characteristics of water vapor during heavy rainfall in the Guilin region.
Guangxi is located in southern China and has a typical subtropical monsoon climate. Additionally, it is situated in a region known for the generation and development of tropical cyclones, which cause substantial precipitation and pose a high risk of heavy rainfall events and floods [36,37]. Although some studies [38,39] have evaluated the accuracy of MERRA-2 and ERA5 reanalysis data, their accuracy in specific regions and under specific weather conditions has not been validated. Furthermore, GNSS PWV has higher accuracy than these datasets and has not yet been assimilated into the reanalysis data, thus often serving as an evaluation standard to assess the accuracy of water vapor products generated using reanalysis data. Therefore, a thorough analysis of the performance of reanalysis water vapor products and the spatiotemporal characteristics of PWV in extreme rainfall events in Guangxi is of great significance, given its importance for improving the prediction and prevention capabilities of extreme precipitation events.
In this study, we used GNSS PWV in Guangxi to evaluate the accuracy of MERRA-2 and ERA5 water vapor products under extreme rainfall conditions. Then, we examined the relationship between the evolution of heavy rainfall and changes in water vapor. The method of GNSS PWV retrieval is described in Section 2. Then, Section 3 presents the accuracy analysis of MERRA-2 and ERA5 water vapor products at different rainfall levels and compares them with ground-based precipitation time series. Conclusions are presented in Section 4.
2. Data and Methodology
2.1. Data Description
The data used in this study were obtained from the ERA5 atmospheric reanalysis dataset provided by the ECMWF, the MERRA-2 reanalysis dataset from NASA, surface meteorological parameters measured at meteorological stations in Guangxi provided by the China Meteorological Data Service Center, radio sounding data obtained from the University of Wyoming website, and GNSS data in Guangxi obtained from the GNSS Data Product Service Platform of the China Earthquake Administration from 2016 to 2018. Detailed information is presented in the following sections.
2.1.1. Reanalysis Dataset
The ERA5 dataset (https://www.ecmwf.int/en/forecasts/datasets/reanalysis-datasets/era5, accessed on 1 June 2022) is the latest release of the fifth-generation global climate reanalysis dataset from the ECMWF. It is generated using the 4D-Var data assimilation scheme in the ECMWF IFS CY41R2 model [38,40,41]. The surface data in the ERA5 dataset provide a horizontal resolution of 0.25° × 0.25° and a temporal resolution of 1 h [25]. They include various water-vapor-related variables, such as total precipitable water and specific humidity, thus making it suitable for climate research, weather forecasting, and other fields.
The MERRA-2 dataset (https://goldsmr4.gesdisc.eosdis.nasa.gov/data/MERRA2, accessed on 1 June 2022) is the latest generation of atmospheric reanalysis dataset released by NASA. The surface data in the MERRA-2 dataset provide a horizontal resolution of 0.5° × 0.625° and a temporal resolution of 1 h. The layer-specific temporal resolution is 6 h. The MERRA-2 dataset has been widely applied in various fields, such as global climate research, weather forecasting, and hydrological modeling [26]. Compared with ERA5, the MERRA-2 dataset has a slightly lower spatial resolution. However, it performs favorably in weather forecasting and climate analysis in extremely high-latitude regions.
2.1.2. Meteorological Data
The China Meteorological Data Service Center (https://data.cma.cn/) is a sharing platform for open meteorological data provided by the China Meteorological Administration. It can provide meteorological observational data, such as hourly temperature, air pressure, humidity, and precipitation. In this study, the meteorological parameters measured at 14 ground meteorological stations closest to the GNSS stations in the Guangxi region from 2016 to 2018 were utilized.
2.1.3. Radiosonde Data
Radiosonde data (http://weather.uwyo.edu/upperair/sounding.html, accessed on 1 June 2022) include meteorological parameters, such as air pressure and temperature measured via radiosondes attached to weather balloons from the surface up to approximately 30 km in altitude. These data are of high accuracy and high vertical resolution [42,43,44]. In this study, the PWV data from the Wuzhou, Guilin, and Baise radiosonde stations located in the Guangxi region from 2016 to 2018 were selected for the accuracy verification of GNSS PWV.
2.1.4. GNSS Data
Land-based GNSS ZTD data can be obtained for free through the China Earthquake Administration GNSS Data Product Service Platform (http://www.cgps.ac.cn, accessed on 1 June 2022). In this study, data from 14 GNSS reference stations located in the Guangxi region from 2016 to 2018 were selected. The stations are as follows: Bobai Station (GXBB), Beihai Station (GXBH), Baise Station (GXBS), Binyang Station (GXBY), Chongzuo Station (GXCZ), Guigang Station (GXGG), Guilin Station (GXGL), Guiping Station (GXGP), Hechi Station (GXHC), Hezhou Station (GXHZ), Rongshui Station (GXRS), Rongxian Station (GXRX), Tian’e Station (GXTE), and Wuzhou Station (GXWZ). Figure 1 shows the distribution of the 14 GNSS reference stations, 14 ground meteorological stations, and 3 radiosonde stations in the Guangxi region.
2.2. Methods
2.2.1. GNSS PWV Inversion Method
In this study, the GAMIT/GLOBK high-precision processing software was employed to process the raw data from 14 GNSS observation stations in the Guangxi region from 2016 to 2018. The output of the processing yielded the ZTD data from 2016 to 2018. Given the use of different vertical reference systems, namely ellipsoidal height for GNSS stations, orthometric height for ground meteorological stations, and geopotential height for atmospheric reanalysis data, the differences among these systems can affect the accuracy of meteorological parameters [45]. Therefore, the EGM2008 model was utilized to convert WGS-84 ellipsoidal height to geopotential height, unifying the vertical reference between GNSS stations and atmospheric reanalysis data.
Given that GNSS and ground meteorological stations have different elevations, a vertical interpolation correction using the temperature and pressure lapse rate model [46] was applied to the observed temperature and pressure data from the meteorological stations. Given that the horizontal distance between GNSS stations and ground meteorological stations is relatively close, no horizontal interpolation was performed. The interpolation formula is as follows:
where and (in Kelvin, K) represent the temperature values at heights and (in meters, m). is the temperature lapse rate, which is an average constant of 0.0065 K/m. and (in hectopascals, hPa) represent the pressure values at heights and , respectively. is the acceleration due to gravity, is the molar mass of dry air (with a value of 0.0289644 kg/mol), and is the ideal gas constant (with a value of 8.314462618 N·m/[mol·K]). represents the latitude of the observation station.
Using the interpolation formulas mentioned above, the temperature and pressure data at the GNSS station can be obtained. According to the Saastamoinen model [47], the is calculated.
where represents the surface pressure of the station (hPa), interpolated from the nearby meteorological stations. represents the latitude of the observation station, and represents the altitude in kilometers (km). is expressed in millimeters (mm).
By subtracting the from the , we can obtain the .
The formula for GNSS inversion [48] is as follows:
where represents the tropospheric zenith wet delay and is the dimensionless water vapor conversion factor. The calculation formula for is as follows:
where represents the density of liquid water with a value of 1 × 10³ kg/m3. is the specific gas constant for water vapor with a value of 461.495 J·kg−1·K−1. and are atmospheric physical parameters taking the values of (3.739 ± 0.012) × 105 K/hPa and 22.13 ± 2.20 K/hPa, respectively. denotes the atmospheric weighted average temperature, which is measured in Kelvin (K). Considering the pronounced seasonal variations in Tm and Ts, this study selected the Tm model [49] that incorporates both annual and semiannual periodic changes to calculate the atmospheric weighted mean temperature. The formula is as follows:
where represents the interpolated surface temperature, denotes the altitude (km), represents the latitude of the observation station (in degrees), and refers to the day of the year. The coefficients for the respective models are shown in Table 1.
2.2.2. Preprocessing of MERRA-2 and ERA5 Data to Be Evaluated
Given the different vertical reference systems used for PWV in reanalysis data (geopotential height) and GNSS PWV (ellipsoidal height), a discrepancy exists in their vertical reference frames. Therefore, a PWV vertical correction model was applied to interpolate the water vapor products from MERRA-2 and ERA5 to the GNSS stations vertically. The model calculates the difference between geopotential height and ellipsoidal height to obtain PWV products with consistent vertical reference frames. The formula for the PWV vertical correction model [50] is as follows:
where represents the altitude of the reanalysis data (in kilometers, km), represents the altitude of the GNSS station (in kilometers, km), and and represent the PWV values at and , respectively. denotes the PWV decay factor with units of mm/km. The calculation formula is as follows:
where refers to the day of the year. The coefficients for the respective model can be found in Table 2.
2.2.3. Accuracy Assessment
The PWV values inverted from 14 GNSS stations in the Guangxi region from 2016 to 2018 were used as reference values. The accuracy of the MERRA-2 and ERA5 water vapor products under heavy rainfall conditions in the Guangxi region was evaluated using the and metrics. We removed observations in cases in which the bias with respect to the average value exceeded three times the standard deviation (). The , , , and correlation coefficient () were calculated using the following formulas:
where represents the number of data samples, refers to the PWV values from ERA5 or MERRA-2, and represents the PWV values inverted from GNSS stations. and denote the population mean values of the observed samples and reference objects.
2.2.4. Rainfall Intensity Levels Defined by the China Meteorological Administration
Rainfall intensity refers to the average amount of rainfall within a certain period, such as 12 h or 24 h. It is an important indicator for describing rainfall characteristics. The classification of rainfall intensity according to the Chinese meteorological department can be found in Table 3.
3. Results and Discussion
3.1. Comparison of PWV between Radiosonde and GNSS
To verify the accuracy of GNSS PWV, three radiosonde stations in Guangxi (Wuzhou, Guilin, and Baise) were selected for accuracy validation using data from 2016 to 2018. The radiosonde PWV had to be vertically interpolated to the GNSS stations, and the interpolation formulas were the same as Equations (9) and (10) in Section 2.2.2; the results are shown in Table 4.
According to Table 4, the larger bias between the GNSS and radiosonde PWV values in Guangxi was observed at the Baise station with a value of −2.92 mm. The smaller bias occurred at the Wuzhou station with a value of −0.81 mm. The minimum RMSE of the inverted PWV values was observed at the Wuzhou station with a value of 3.48 mm, while the maximum RMSE occurred at the Baise station with a value of 4.50 mm. The GNSS PWV values showed good consistency with the radiosonde PWV values, thus meeting the accuracy requirements for atmospheric research. Furthermore, the three radiosonde stations in Guangxi showed a strong correlation with the GNSS PWV values with annual average correlation coefficients exceeding 0.97 over the three-year period. This result indicates a high reliability of GNSS PWV values compared with radiosonde PWV values, thus making them suitable as reference values for evaluating the accuracy and spatiotemporal characteristics of atmospheric reanalysis data water vapor products.
3.2. Accuracy Analysis of MERRA-2 and ERA5 PWV during Heavy and Severe Rainfall
According to the rainfall classification defined by the China Meteorological Administration, this study analyzed the accuracy of GNSS PWV and MERRA-2/ERA5 PWV in the Guangxi region from 2016 to 2018 under heavy and severe rainfall conditions. The spatial distribution of the average bias and average RMSE for MERRA-2 and ERA5 PWV is presented in Figure 2.
Figure 2(I) demonstrates that, under heavy rainfall conditions, MERRA-2 PWV showed a bias range of −2.20 mm to 1.90 mm. MERRA-2 PWV exhibited negative biases in the southern part of Guangxi (except the Beihai station) and the northern part of Guangxi (except the Guilin station and the Rongshui station), thus indicating that the MERRA-2 PWV values were lower than the GNSS PWV values. The bias values were generally small, with a range of 0 mm to 2 mm. The Baise station in the southwestern part of Guangxi showed the smallest bias with only 0.03 mm. ERA5 PWV showed a bias range of 0.11 mm to 4.10 mm. It exhibited positive biases throughout the entire Guangxi region with significant variations between different stations. The southern part of Guangxi showed smaller overall biases, and Hechi Station in the northwest direction exhibited the smallest bias with only 0.11 mm. In terms of RMSE, MERRA-2 PWV showed a range of 2.66 mm to 4.79 mm. The RMSE values were smaller in the northwest and southeast parts of Guangxi. ERA5 PWV exhibited a range of 2.54 mm to 4.90 mm. Not much difference existed among most of the stations except for the Hezhou station in the northeast direction, which showed an RMSE close to 5 mm. However, the values in general were smaller than those of MERRA-2 PWV, and both datasets showed smaller RMSE values at the Tian’e, Wuzhou, and Hechi stations. Overall, the accuracy is quite stable over the whole Guangxi region for both datasets. However, based on the range of RMSE, individual station comparisons, and average RMSE, ERA5 exhibited slightly higher accuracy than MERRA-2.
Figure 2(II) shows that, under severe rainfall conditions, MERRA-2 PWV exhibited mostly negative biases ranging from −4.19 mm to 2.85 mm. The accuracy of MERRA-2 PWV was best in the southeastern part of Guangxi with stations such as Bobai showing a bias of 0.56 mm and Wuzhou showing a bias of −0.79 mm. ERA5 PWV showed positive biases ranging from 1.39 mm to 4.65 mm. The biases in the northern part of Guangxi were significantly smaller than those in the southern part. For example, the Hechi station in the northern part exhibited a bias of 1.93 mm, and the Rongshui station showed a bias of 1.94 mm. However, the Bobai station in the southern part of Guangxi had a bias of only 1.39 mm. This indicates that the Guangxi region experiences a complex climatic characteristic with elusive patterns. Overall, the biases are significantly larger than those under heavy rainfall conditions. In terms of RMSE, both reanalysis datasets showed smaller values at the Hechi and Rongshui stations in the northern part of Guangxi, the Baise station in the western part of Guangxi, and the Guiping station in the eastern part of Guangxi. Among them, the RMSE of MERRA-2 PWV ranged between 3.00 mm and 6.79 mm, with the Hezhou station reaching 7 mm. The RMSE of ERA5 PWV ranged between 2.58 mm and 4.86 mm, with the Chongzuo station, the Guigang station, and the Hezhou station all showing an RMSE close to 5 mm.
Overall, in the 14 GNSS stations in Guangxi, the bias and RMSE of MERRA-2 PWV and ERA5 PWV were significantly larger under severe rainfall conditions compared with heavy rainfall conditions. During severe rainfall, precipitation significantly increases, thus resulting in increased moisture content and pronounced variations in water vapor.
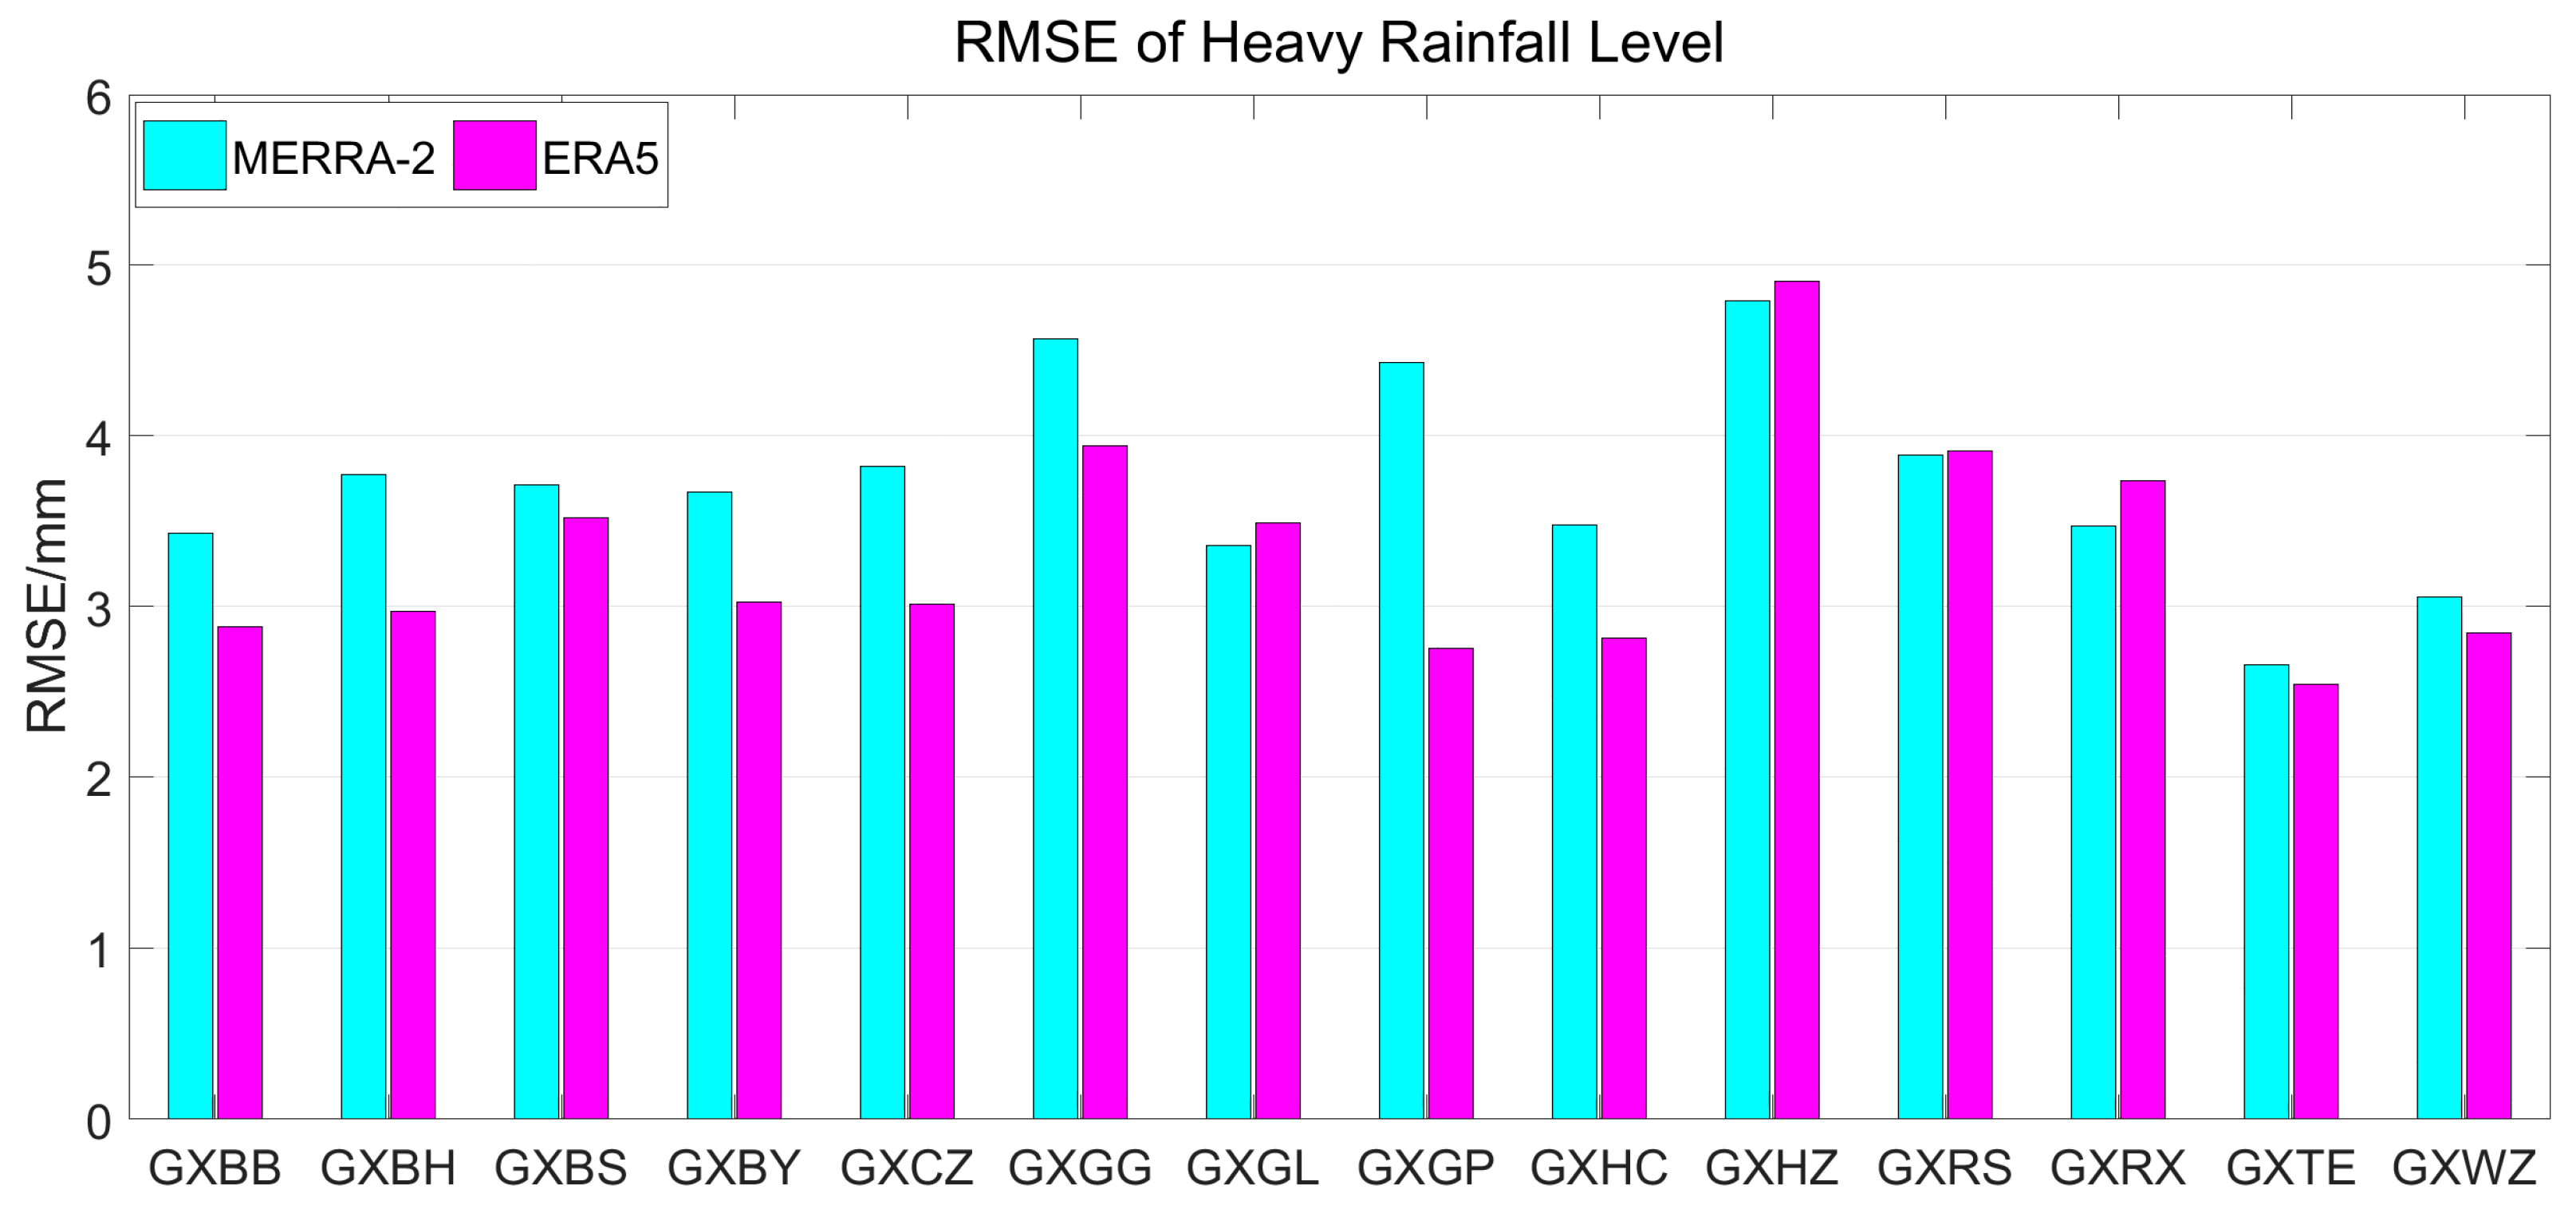
Figure 3 and Figure 4 provide an intuitive comparison of the applicability of different water vapor products under heavy rainfall conditions. In terms of bias, the range of variation for MERRA-2 PWV was significantly smaller than that of ERA5 PWV. MERRA-2 exhibited smaller biases than ERA5 at the Bobai, Beihai, Baise, Binyang, Chongzuo, Guigang, Guilin, Hezhou, Rongshui, Rongxian, and Wuzhou stations, with values ranging from 0 mm to 1 mm. Regarding RMSE, both reanalysis datasets showed relatively large values at around 3 mm. However, at most stations, the RMSE of MERRA-2 PWV was higher than that of ERA5 PWV except for the Guilin, Hezhou, and Rongxian stations, where MERRA-2 PWV had slightly lower RMSE than ERA5 PWV. The subsequent analysis will further examine whether the accuracy under severe rainfall conditions aligned with the performance under heavy rainfall conditions.
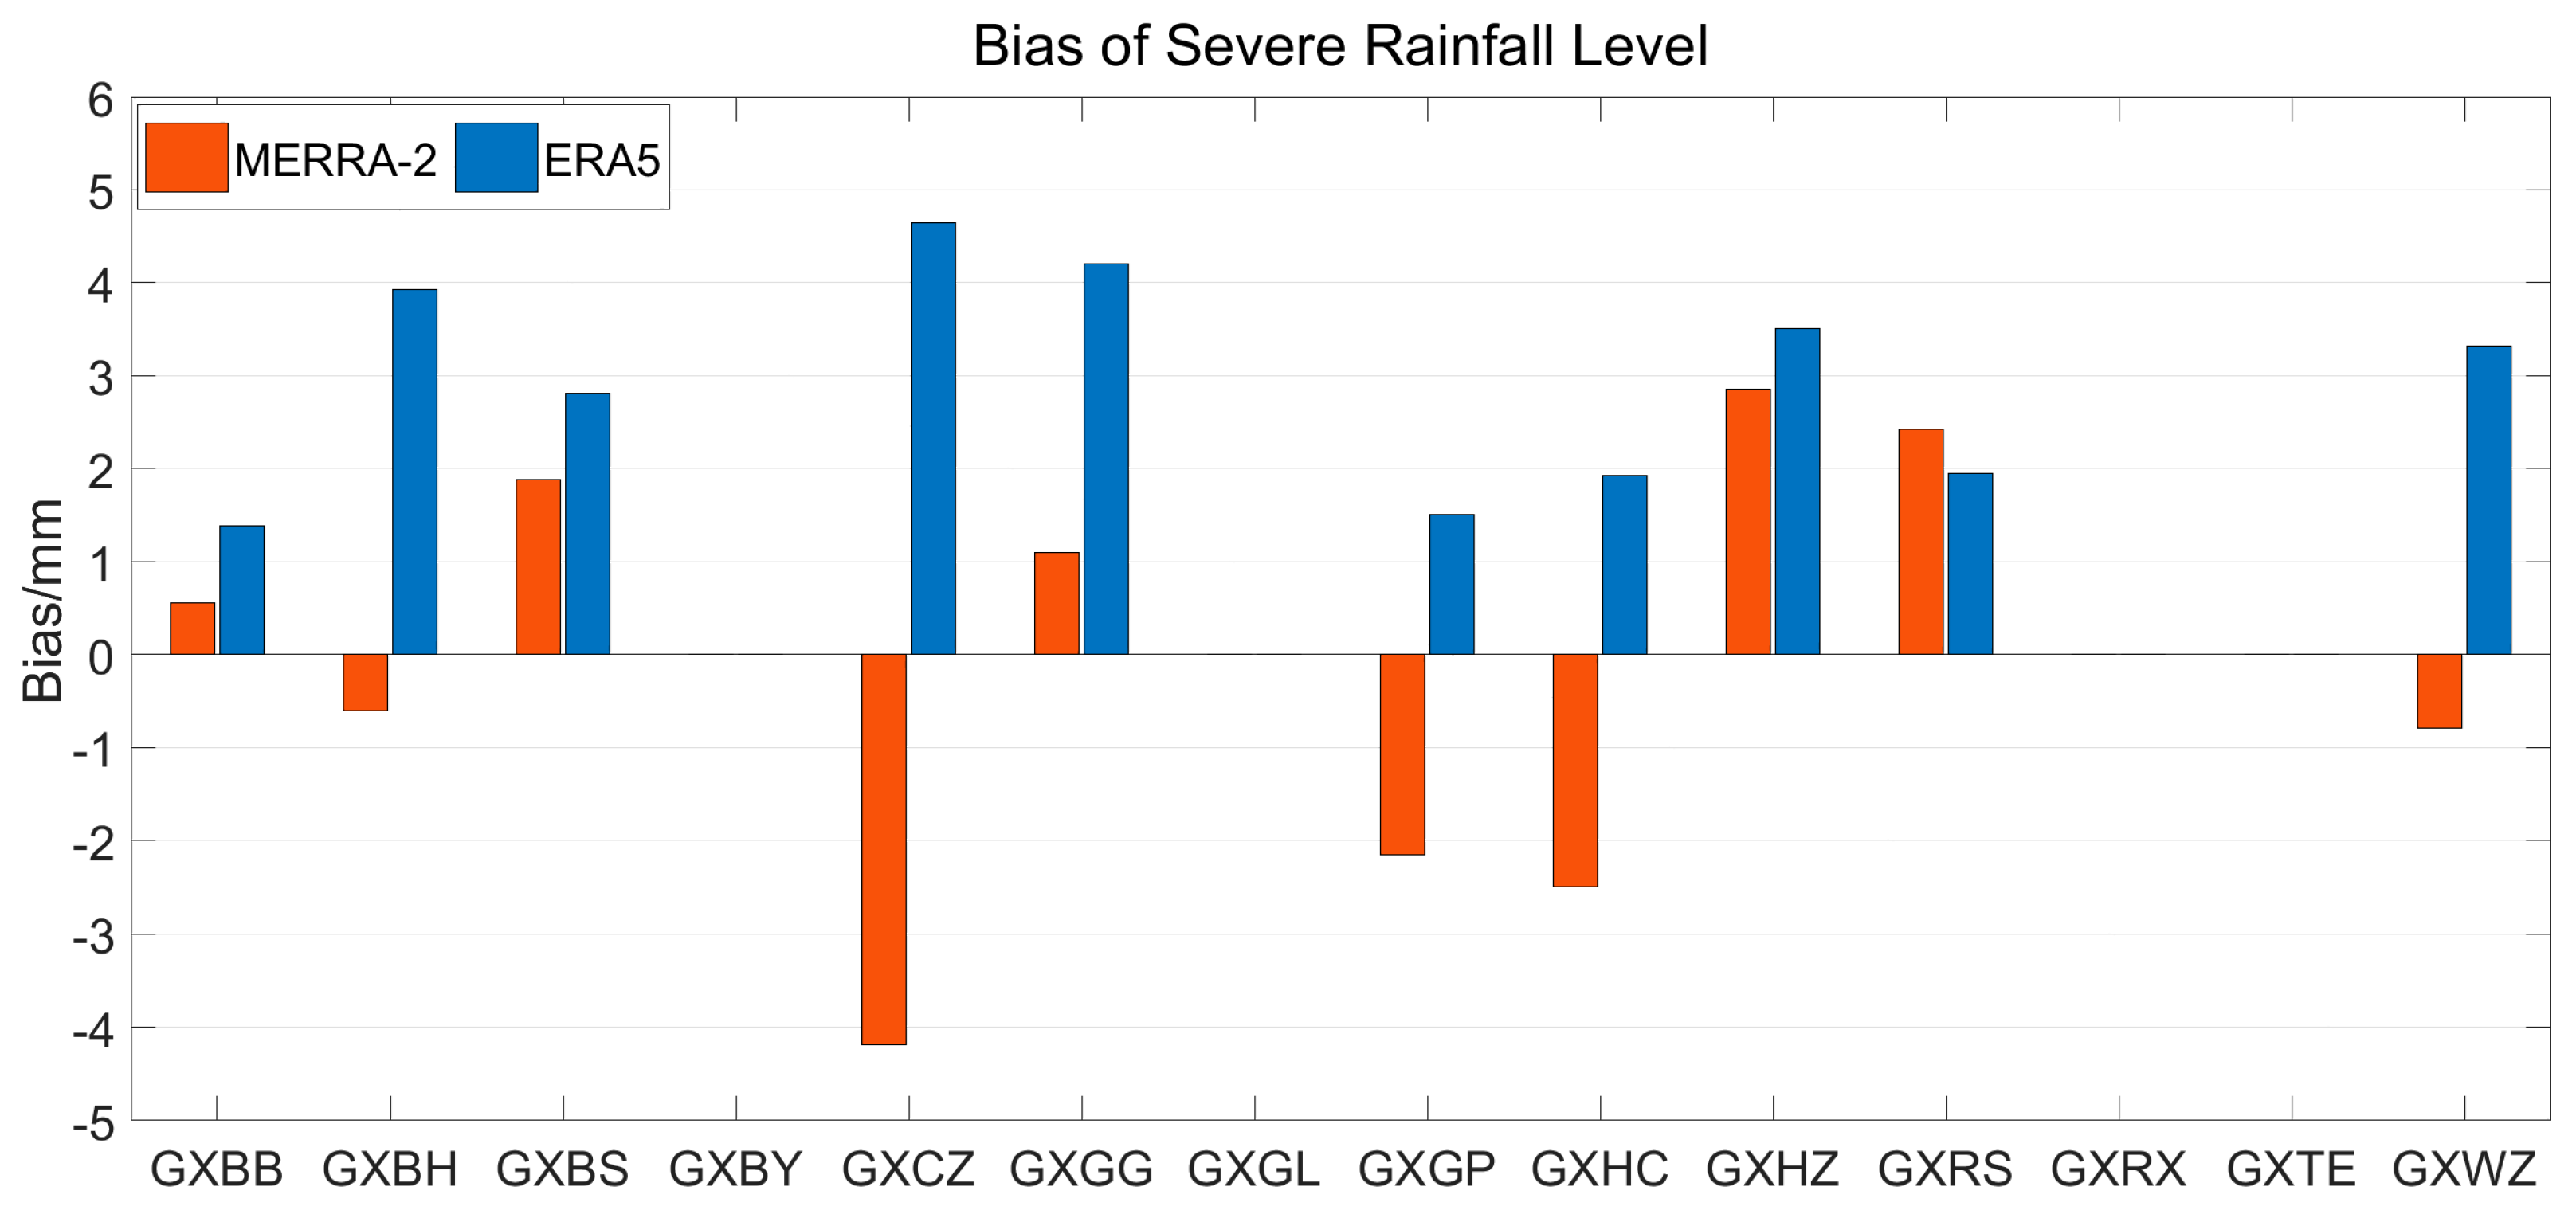
Figure 5 and Figure 6 show that data were missing for the Binyang, Guilin, Rongxian, and Tian’e stations, thus indicating that no severe rainfall had been observed at these locations. In terms of bias, MERRA-2 PWV showed smaller biases than ERA5 PWV at the Bobai, Beihai, Baise, Guigang, Hezhou, and Wuzhou stations. However, the biases of ERA5 were always positive, and those of MERRA-2 were positive as often as negative. This difference in biases could be due to the distinct model configurations, data processing techniques, and data assimilation methods employed for ERA5 and MERRA-2. These variations ultimately resulted in disparities in the precision of the outcomes. Regarding RMSE, both reanalysis datasets exhibited relatively large values. The Hezhou station stands out with a significantly larger RMSE, which is consistent with its performance under heavy rainfall conditions. This may be attributed to the fact that Hezhou is located at the border between mountains and plains, leading to turbulent variations in water vapor. For most stations, the RMSE of MERRA-2 PWV was higher than that of ERA5 PWV. Overall, the two datasets revealed similar accuracy. However, ERA5 PWV demonstrated slightly higher accuracy than MERRA-2, as indicated by with its lower RMSE values in the average and variation ranges. Therefore, ERA5 PWV exhibited better consistency with GNSS PWV.
The analysis of Figure 2, Figure 3, Figure 4, Figure 5 and Figure 6 reveals that MERRA-2 PWV and ERA5 PWV exhibited high accuracy and stability under heavy rainfall and severe rainfall conditions in Guangxi. However, in terms of RMSE, ERA5 PWV consistently showed lower values compared to MERRA-2 PWV in individual station comparisons and average values. This could be attributed to the higher horizontal spatial resolution of ERA5 (0.25° × 0.25°) compared with MERRA-2 (0.5° × 0.625°), thus it can capture water vapor variations in more detail. When analyzing the spatial distribution of accuracy, the stations with higher accuracy under heavy rainfall conditions were Tiane and Hechi in northwest Guangxi and Wuzhou and Guiping in eastern Guangxi. Meanwhile, the accuracy was lower at Guigang in eastern Guangxi and Hezhou and Rongshui in northern Guangxi. Under severe rainfall conditions, the stations with higher accuracy were Baise in western Guangxi, Guiping in eastern Guangxi, and Hechi in northwest Guangxi, while the accuracy was lower at Beihai in southern Guangxi and Chongzuo and Hezhou in eastern Guangxi. Therefore, both datasets showed the highest accuracy at the Guiping and Hechi stations and the lowest accuracy at the Hezhou and Rongshui stations.
To optimize the analysis of the applicability of water vapor products under heavy rainfall and severe rainfall conditions, this study compiled the maximum, minimum, and average values of bias and RMSE for the water vapor products of the two reanalysis datasets for heavy rainfall and severe rainfall levels.
The comparison of Table 5 and Table 6 indicates that MERRA-2 and ERA5 PWV showed a noticeable increase in the maximum, minimum, and average values of bias and RMSE under severe rainfall conditions compared to heavy rainfall conditions. Except for the average bias of MERRA-2 (−0.22 mm and −0.14 mm) and the maximum RMSE of ERA5 (4.90 mm and 4.86 mm), which remained almost unchanged between the two rainfall levels, overall, the values under severe rainfall conditions were larger and exhibited more significant variations. Furthermore, when comparing the average RMSE between the two rainfall levels, ERA5 PWV aligns better with GNSS PWV and exhibits a higher consistency.
3.3. Performance of MERRA-2 and ERA5 PWV during a Heavy Rainfall Event
Section 3.2 analyzed the accuracy of GNSS PWV and MERRA-2/ERA5 PWV in the Guangxi region from 2016 to 2018 under heavy and severe rainfall conditions. Furthermore, in order to explore the hourly variation relationship between PWV and precipitation, Section 3.3 conducted a time series analysis of GNSS/MERRA-2/ERA5 PWV and the actual precipitation observed at ground meteorological stations on Days 178 to 184 in 2017.
3.3.1. Analysis of the Daily Average Error during Heavy Rain Days
During the rainfall days from Day 178 to Day 184 of 2017, the majority of the stations recorded precipitation within the “Heavy rain” range. Therefore, only an accuracy analysis for the heavy rain level could be conducted. For detailed data, please refer to Table 7.
According to Table 7, in terms of bias, the minimum bias for MERRA-2 was observed at the Guiping station with a value of −1.32 mm, while the maximum bias was observed at the Guilin station with a value of 3.02 mm. The average bias for MERRA-2 was 0.92 mm. For ERA5, the minimum bias was observed at the Guiping station with a value of 1.21 mm, while the maximum bias was observed at the Rongshui station with a value of 3.89 mm. The average bias for ERA5 was 2.42 mm. MERRA-2 and ERA5 showed their minimum biases at the Guiping station, thus indicating relatively small water vapor variations at this station during heavy rainfall. In terms of RMSE, the minimum RMSE for MERRA-2 was observed at the Guiping station with a value of 3.47 mm, while the maximum RMSE was observed at the Rongshui station, thus reaching 5.09 mm. The average RMSE for MERRA-2 was 4.04 mm. For ERA5, the minimum RMSE was observed at the Guiping station with a value of 2.33 mm, while the maximum RMSE was observed at the Rongshui station with a value of 4.36 mm. This is consistent with the stations showing the minimum and maximum biases for ERA5. The average RMSE for ERA5 was 3.40 mm. The water vapor variations at the Guiping station showed a smaller magnitude, while the Rongshui station is located in a region where mountainous and plain terrains meet, thereby resulting in complex climate conditions with abundant rainfall and leading to drastic water vapor variations. Furthermore, ERA5 PWV showed lower RMSE than MERRA-2 PWV for most of the GNSS stations (except for the Binyang station). This consistency in performance was observed under both heavy and severe rainfall conditions.
According to Figure 7, in terms of bias, MERRA-2 PWV exhibited smaller deviations in the western and southern parts of Guangxi with values fluctuating within the range of 0 mm to 1 mm. For example, the Bobai station had a bias of 0.61 mm. ERA5 PWV generally showed larger biases compared with MERRA-2 with values ranging from 1 mm to 4 mm. The deviations were smaller in the western and southeastern regions of Guangxi, such as the Chongzuo station with a bias of 1.82 mm. In terms of RMSE, MERRA-2 PWV exhibited lower values in the central region of Guangxi. The station with the best accuracy was the Guiping station in the central region, which had an RMSE value of 3.47 mm. The Guilin station in the northern part and the Rongshui station had RMSE values of 4.54 mm and 5.09 mm, respectively, thus indicating the poorest accuracy. Meanwhile, ERA5 PWV demonstrated higher accuracy in the western and central regions of Guangxi. For example, the Guiping station in the central region had the highest accuracy with an RMSE value of 2.33 mm, while the Baise and Chongzuo stations in the western region had RMSE values of 2.84 mm and 2.95 mm, respectively, thus indicating relatively high accuracy.
The accuracy of two types of atmospheric reanalysis data was highest in the central region of Guangxi, followed by the southern region. The accuracy was the poorest in the northern region of Guangxi.
According to Figure 8 and Figure 9, in terms of bias, MERRA-2 PWV exhibited significant positive biases at most stations with a few negative biases. The bias of ERA5 PWV ranged from 2 mm to 4 mm, while MERRA-2 PWV exhibited both positive and negative biases, thus indicating that the bias of MERRA-2 PWV varied more. In terms of RMSE, both types of reanalysis data had relatively large values that mostly ranged from 3 mm to 5 mm. The range of variation between the two was not significant, and the accuracy was relatively close overall. However, upon closer analysis, among the 14 stations (except for the Binyang and Hezhou stations), the RMSE of MERRA-2 PWV was larger than the RMSE of ERA5 PWV, thus indicating that the accuracy of ERA5 PWV was slightly higher than that of MERRA-2 PWV.
3.3.2. Temporal Variations of PWV and Hourly Precipitation during Heavy Rain Days
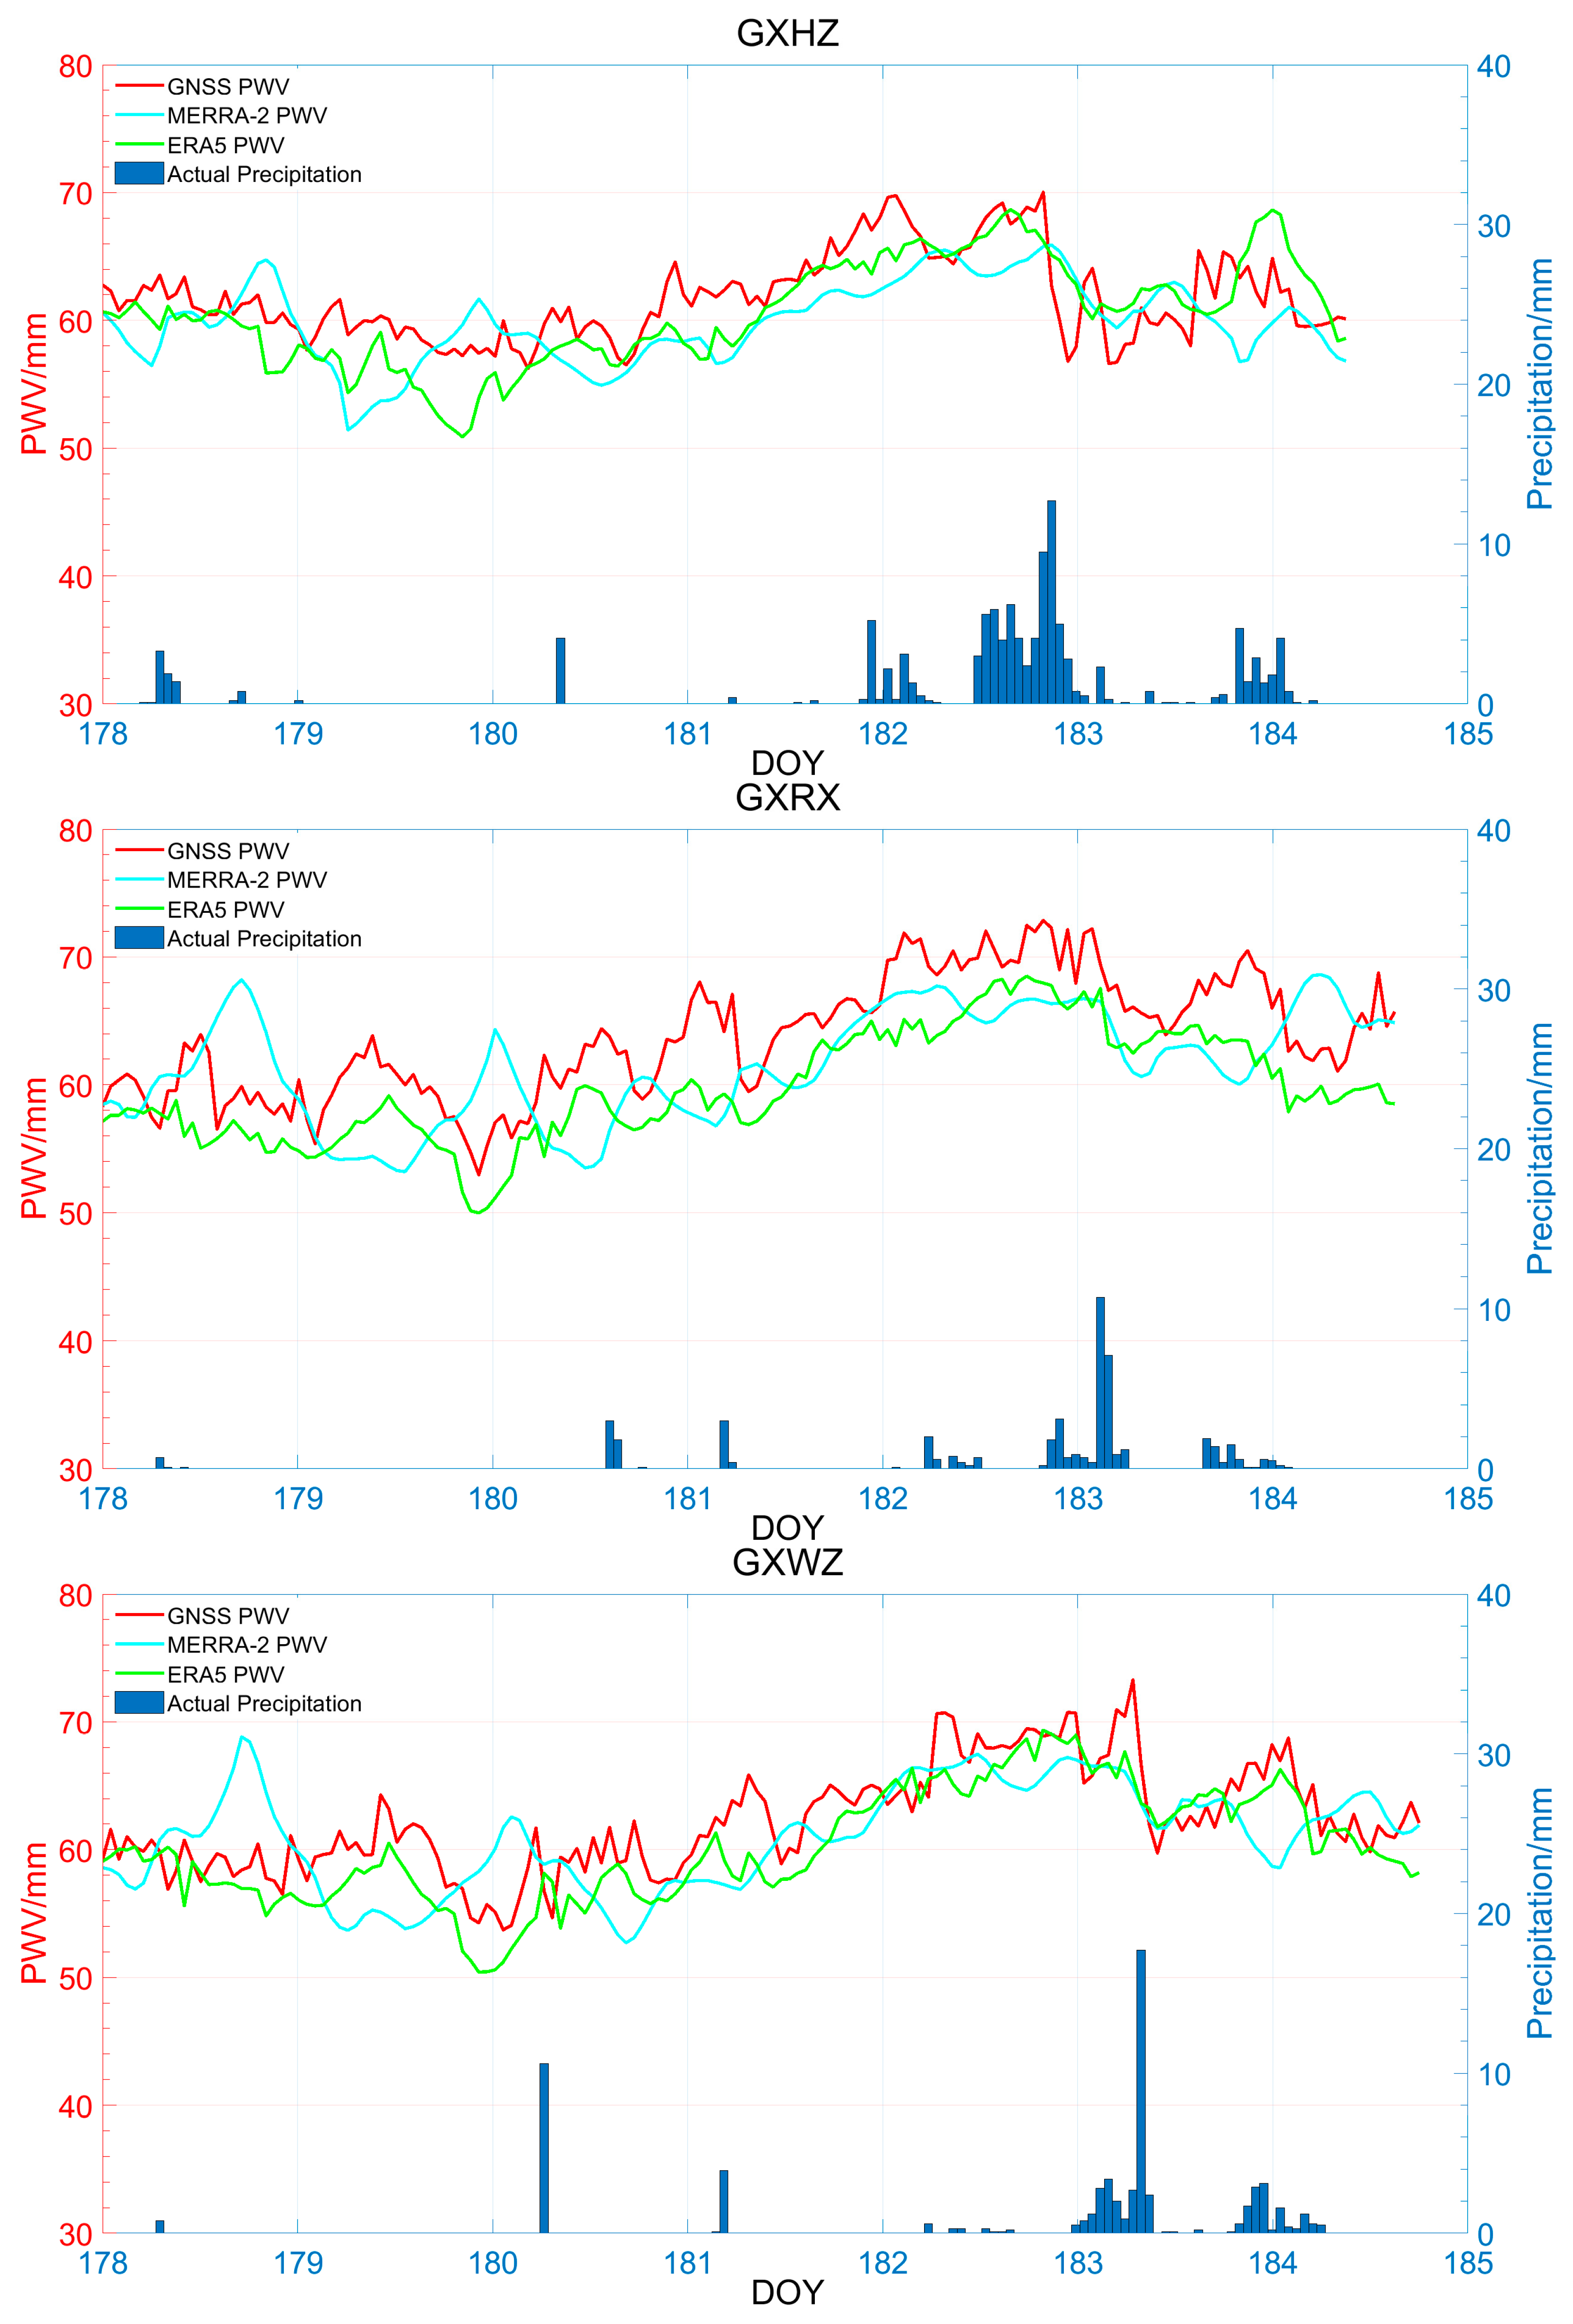
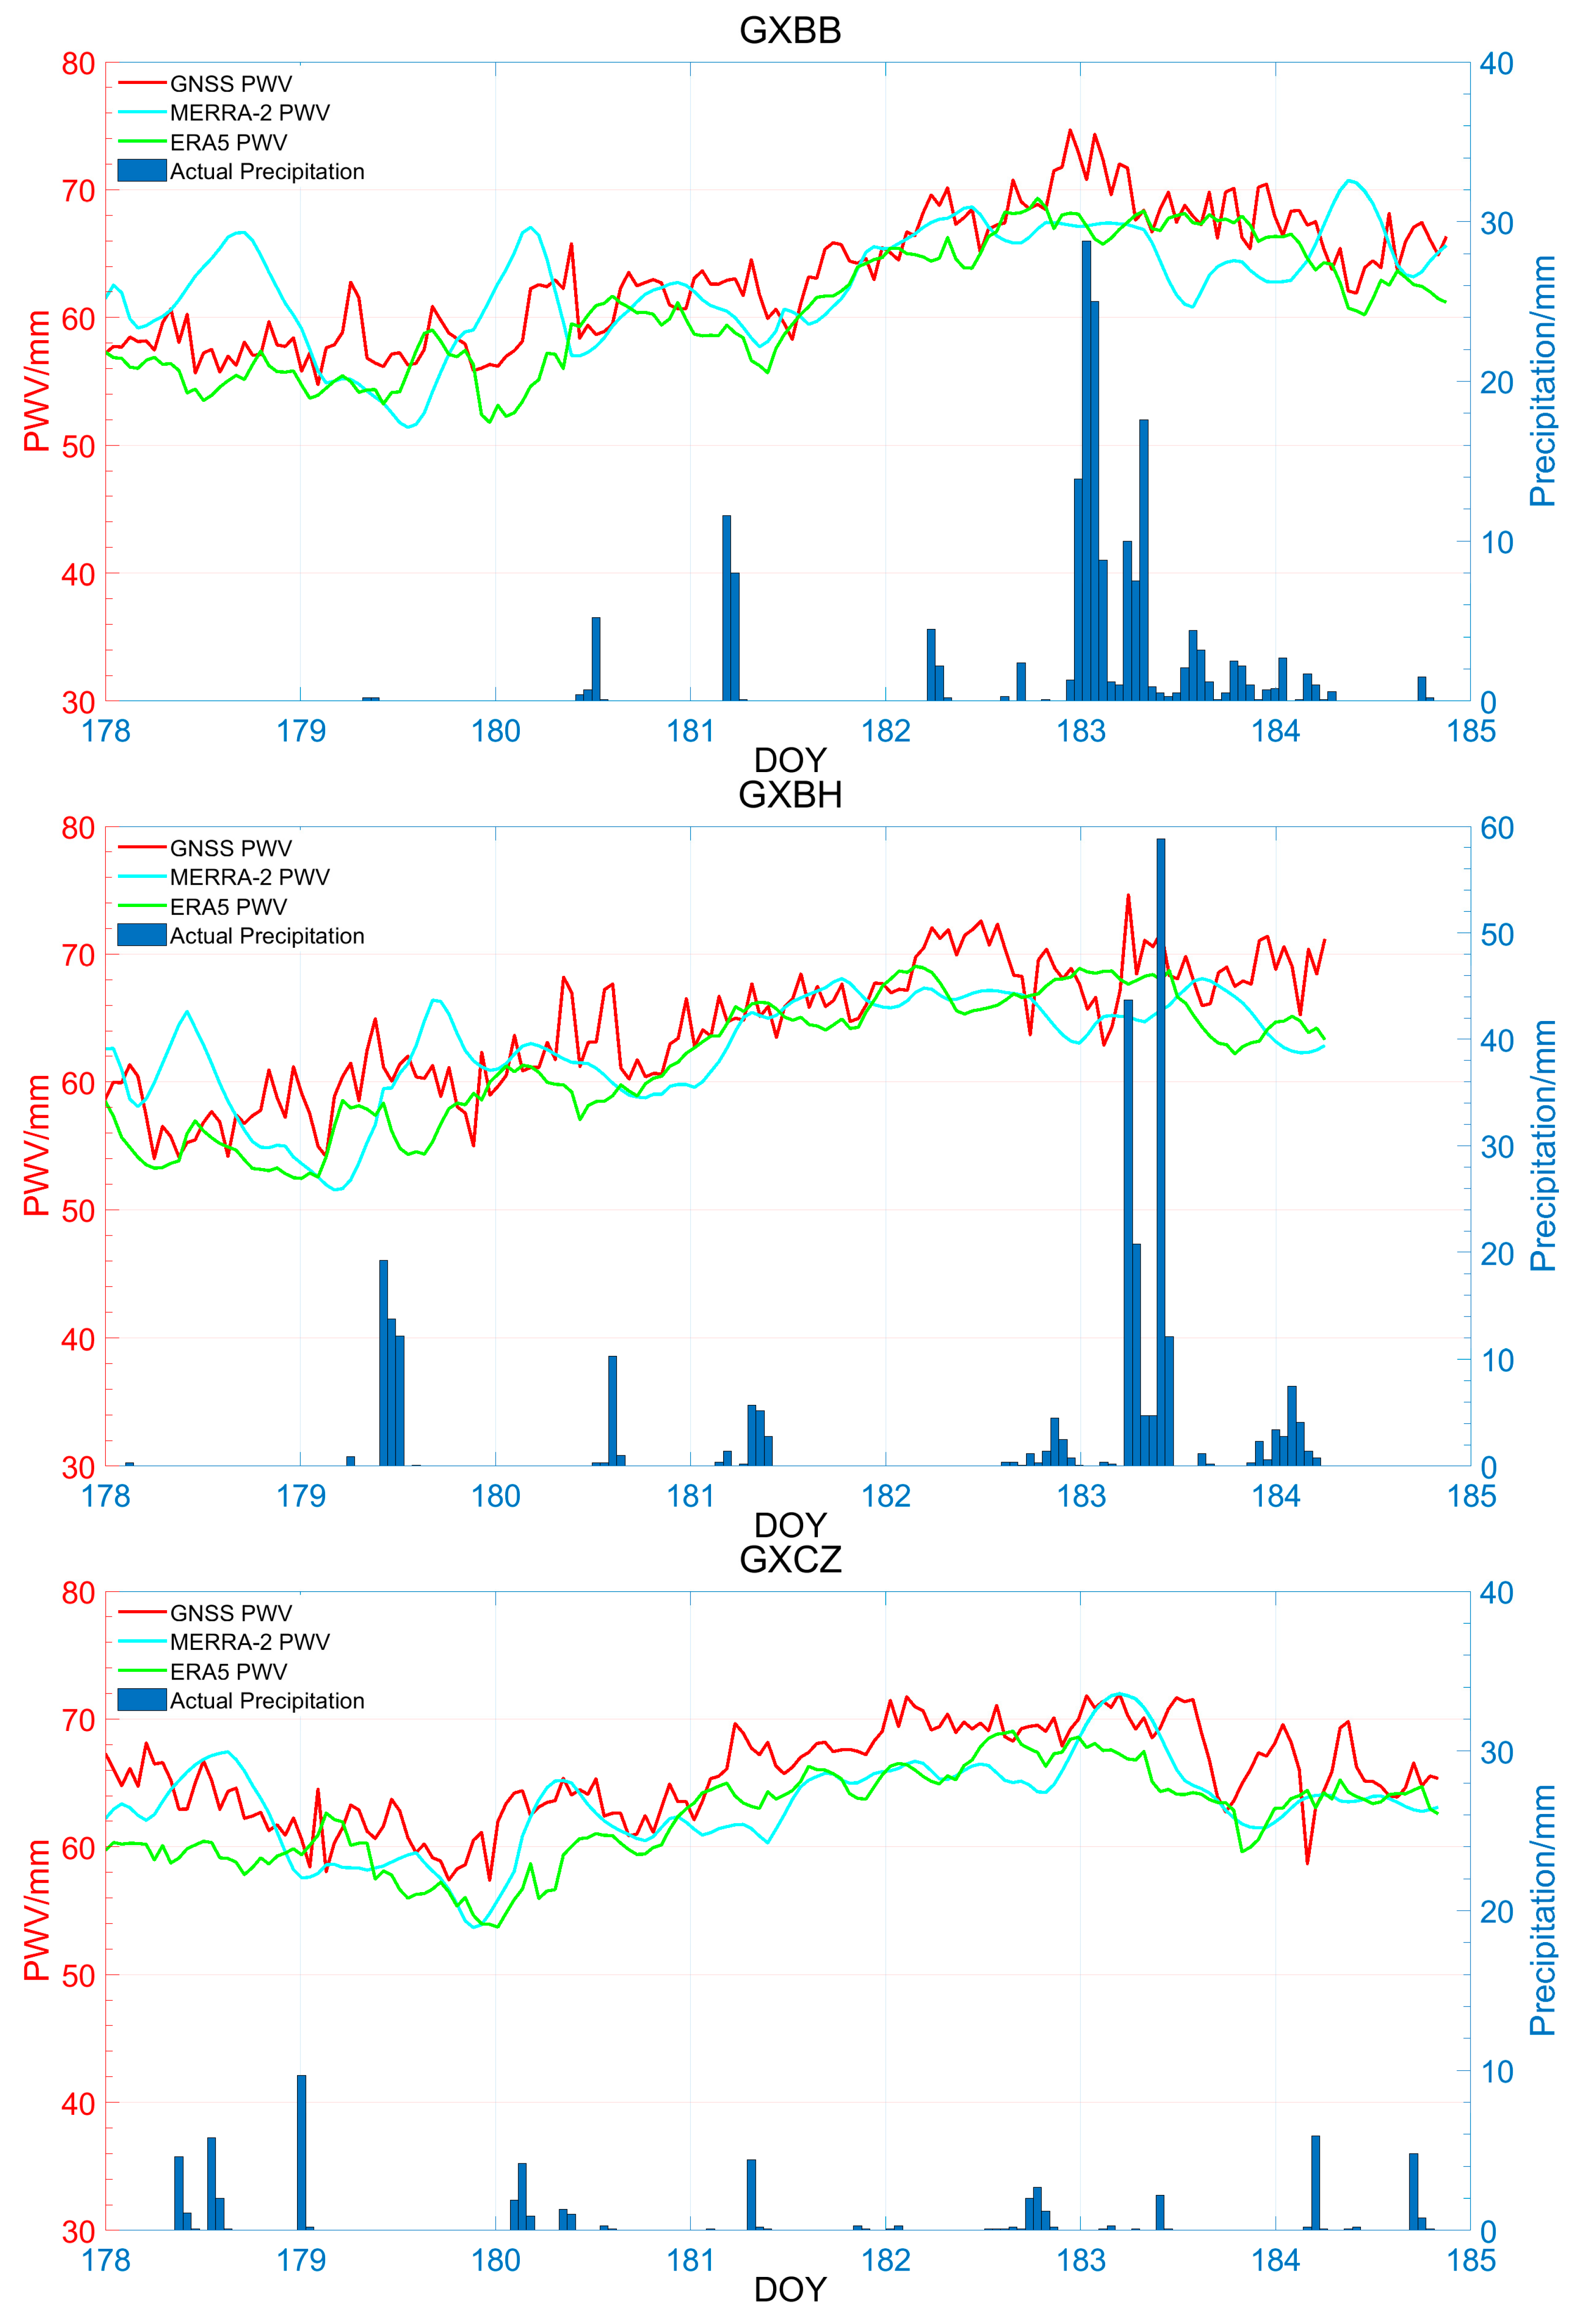
The study selected the 14 ground meteorological stations in the Guangxi region that are closest to the GNSS stations, ensuring more reliable data results. Notably, not all 14 ground meteorological stations recorded significant rainfall during the investigated short period. Therefore, we only selected the nine stations with significant rainfall for experimental analysis: GXBB, GXBH, GXCZ, GXGL, GXGP, GXHC, GXHZ, GXRX, and GXWZ. The results are presented in Figure 10.
Figure 10 shows that the trends in PWV for both reanalysis datasets generally agreed with GNSS PWV. Overall, they were lower than GNSS PWV, and the increasing or decreasing trends were consistent with the changes in surface precipitation. Among different stations, the fluctuation range of MERRA-2 PWV was larger, thus making it less stable compared with ERA5 PWV. Therefore, ERA5 PWV is more capable of reflecting the changing characteristics of rainfall.
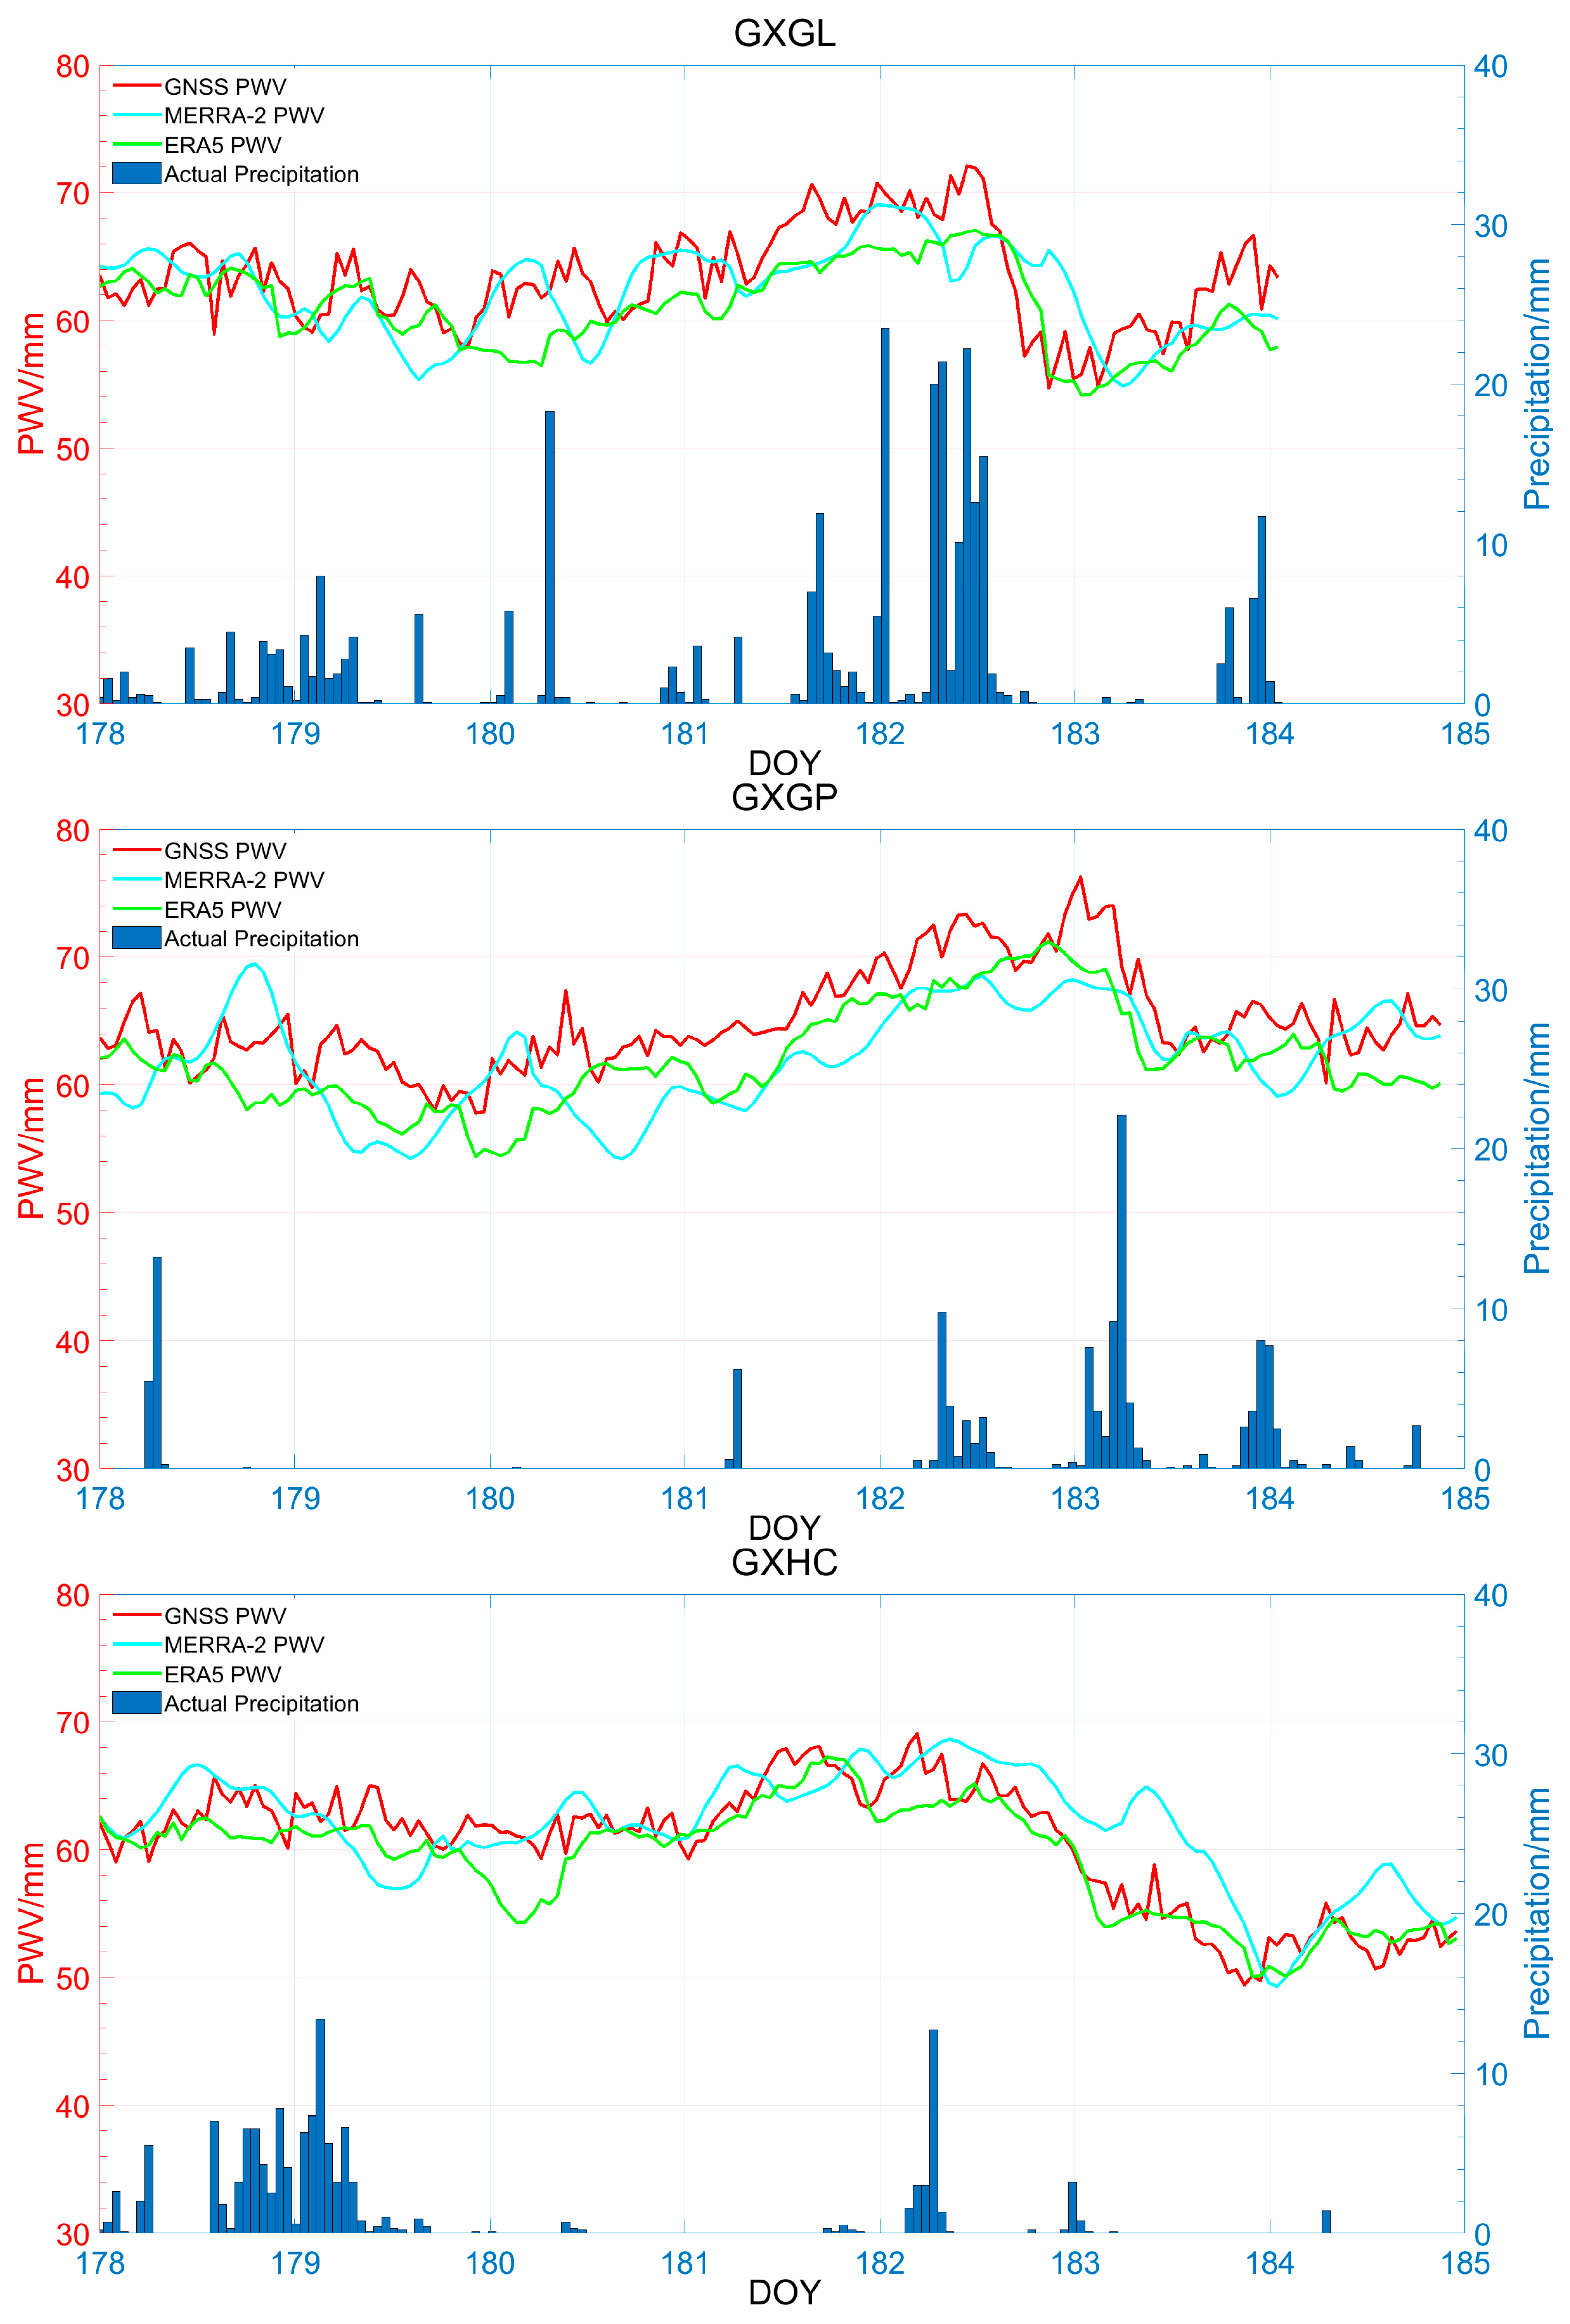
When no heavy rainfall occurred, GNSS PWV, ERA5 PWV, and MERRA-2 PWV remained in a stable state. However, due to possible data errors and differences in the assimilation methods of MERRA-2, significant outliers were observed in MERRA-2 PWV at almost all stations on DOY 178; MERRA-2 PWV has larger values and is more unstable compared to ERA5 PWV. At most stations, such as GXBB on DOY 183, GXBH on DOY 179 and DOY 183 and GXGL on DOY 182, GXGP on DOY 183, GXHC on DOY 182, GXHZ on DOY 182, and GXWZ on DOY 183, prior to the arrival of heavy rainfall, GNSS PWV experienced a rapid increase, and ERA5 PWV and MERRA-2 PWV also rose quickly. However, GNSS PWV reached its peak value before ERA5 and MERRA-2 PWV did; ERA5 PWV and MERRA-2 PWV were slightly smaller than the GNSS PWV. Once PWV reached its maximum value, heavy rainfall began, such as shown for stations GXBB on DOY 183, GXBH on DOY 183, GXGP on DOY 183, GXHZ on DOY 182, and GXWZ on DOY 183. At this point, the fluctuation in MERRA-2 PWV became more pronounced compared with GNSS PWV and ERA5 PWV. Specifically, for GXGP on DOY 183, the peak values for each PWV are approximately 75 mm for GNSS PWV, 72 mm for ERA5 PWV, and 68 mm for MERRA-2 PWV, indicating that ERA5 PWV is more consistent with GNSS PWV in terms of accuracy. As the heavy rainfall rapidly subsided, such as for GXGP on DOY 183, GXHZ on DOY 183, and GXWZ on DOY 183, GNSS/ERA5/MERRA-2 PWV sharply decreased. When the rainfall gradually diminished, as seen in GXBB on DOY 183, GNSS PWV and ERA5 PWV exhibited a gradual fluctuation and decrease. In contrast, for GXGL on DOY 182 and GXBH on DOY 183, GNSS PWV and ERA5 PWV showed nearly simultaneous frequency-dependent decreases, while MERRA-2 PWV displayed a delayed response. From DOY 183 to DOY 184, for GXWZ, GXHZ, and GXGP, when GNSS PWV reached its minimum value, ERA5 and MERRA-2 PWV began to increase gradually. As GNSS PWV slowly rose from its minimum, ERA5 PWV showed a similar upward trend, while MERRA-2 PWV exhibited a decreasing trend. This apparent contrast may be due to the differences in the assimilation methods used for MERRA-2 data. Finally, after GNSS PWV stabilized, ERA5 and MERRA-2 PWV slowly returned to a stable state. However, ERA5 PWV exhibited smaller fluctuations and a more stable pattern of change, thus indicating that it has higher accuracy in capturing the variability of rainfall during heavy rainfall events in the Guangxi region, similar to GNSS PWV.
Based on the above analysis, to some extent, the rapid increase in PWV can serve as a warning sign of an upcoming rainfall event because a sufficient water vapor supply is a prerequisite for rainfall occurrence. Although not all high PWV values indicate the onset of rainfall, the increase in water vapor is one of the prerequisites for precipitation. Most precipitation occurs around the peak PWV values. Prior to the arrival of heavy rainfall, water vapor accumulates, thus leading to an increase in PWV. During heavy rainfall, PWV shows relatively small fluctuations. The continuous and intense precipitation results in significant water loss. After the heavy rainfall event, PWV rapidly decreases to its minimum value, followed by a slow rise as the depleted water vapor is replenished. Then, PWV gradually stabilizes.
4. Conclusions
This study utilized PWV calculated at 14 GNSS stations in Guangxi from 2016 to 2018 to evaluate the accuracy of the latest released MERRA-2 and ERA5 water vapor products during heavy rainfall weather. The average bias of MERRA-2 PWV and ERA5 PWV in heavy rainfall were −0.22 mm and 1.84 mm, respectively, with average RMSE of 3.72 mm and 3.31 mm. For extremely severe rainfall, the average bias of MERRA-2 PWV and ERA5 PWV was −0.14 mm and 2.92 mm, respectively, with average RMSEs of 4.28 mm and 4.01 mm. On Days 178 to 184 in 2017 with heavy rainfall, the average bias of MERRA-2 PWV and ERA5 PWV was 0.92 mm and 2.42 mm, respectively, with average RMSEs of 4.04 mm and 3.40 mm. The results indicate that the RMSE of ERA5 PWV is lower than that of MERRA-2 PWV, thus indicating higher accuracy of ERA5 PWV. Both datasets show increased average bias and RMSE in extremely severe rainfall events. In terms of spatial distribution accuracy, slight differences exist between the two datasets. However, both datasets performed best at the Guiping and Hechi stations and worst at the Hezhou and Rongshui stations.
A time series analysis was conducted for GNSS/MERRA-2/ERA5 PWV and the actual precipitation observed at ground meteorological stations on Days 178 to 184 in 2017. The results indicate that MERRA-2/ERA5 PWV exhibits a consistent overall trend with GNSS PWV, and it also closely matches the actual precipitation recorded at the ground meteorological stations. However, the trend of ERA5 PWV agrees more closely with GNSS PWV. These findings demonstrate a direct relationship between PWV variations and rainfall. Prior to the onset of heavy rainfall, PWV increases sharply. When heavy rainfall arrives, PWV reaches its peak. After the rainfall ceases, PWV rapidly decreases to its minimum value and eventually stabilizes. Therefore, ERA5 demonstrates better suitability compared to MERRA-2 during heavy rainfall in the Guangxi region. This assessment effectively demonstrates significant changes in the water vapor and actual precipitation in the Guangxi region, which holds important implications for predicting heavy rainfall events.
Author Contributions
Conceptualization, N.H., B.C. and L.H.; methodology, N.H., B.C. and L.H.; software, N.H., S.F., L.H. and B.C.; validation, N.H., S.F., L.H. and B.C.; formal analysis, N.H., B.C. and L.H.; investigation, N.H., B.C., L.H. and S.F.; resources, N.H., L.H., B.C. and S.F.; data curation, N.H., S.F., B.C. and L.H.; writing—original draft preparation, N.H., L.H. and B.C.; writing—review and editing, B.C., N.H. and L.H.; visualization, N.H., B.C., L.H., S.F. and W.J.; supervision, B.C., L.H. and W.J.; project administration, B.C., L.H. and W.J.; funding acquisition, B.C. and L.H. All authors have read and agreed to the published version of the manuscript.
Funding
This work was supported by the National Key R&D Program of China (grant no. 2023YFE0208000), the National Natural Science Foundation of China (grant no. 42274042, 42388102), the Natural Science Foundation of Hunan Province, China (grant no. 2023JJ20060, 2022JJ30697), the Research Foundation of the Department of Natural Resources of Hunan Province (grant no. 20230167CH, HNGTCH-2023-05), and the Guangxi Natural Science Foundation of China (grant no. 2023GXNSFAA026434).
Institutional Review Board Statement
Not applicable.
Informed Consent Statement
Not applicable.
Data Availability Statement
The MERRA-2 data were obtained from NASA (https://goldsmr4.gesdisc.eosdis.nasa.gov/data/MERRA2) (accessed on 1 June 2022). The ERA5 data were obtained from ECMWF (https://www.ecmwf.int/en/forecasts/datasets/reanalysis-datasets/era5) (accessed on 1 June 2022). The GNSS data were obtained from the China Earthquake Administration GNSS Data Product Service Platform (http://www.cgps.ac.cn). The meteorological data were obtained from the China Meteorological Administration (https://data.cma.cn/), and the radiosonde data were obtained from the website of the University of Wyoming (http://weather.uwyo.edu/upperair/sounding.html) (accessed on 1 June 2022).
Acknowledgments
The authors would like to extend their sincere gratitude to NASA, ECMWF, the China Earthquake Administration GNSS Data Product Service Platform, the China Meteorological Administration, and the University of Wyoming for providing the relevant data.
Conflicts of Interest
The authors declare no conflicts of interest.
References
- Lee, H.; Calvin, K.; Dasgupta, D.; Krinner, G.; Mukherji, A.; Thorne, P.; Trisos, C.; Romero, J.; Aldunce, P.; Barret, K.; et al. IPCC, 2023: Climate Change 2023: Synthesis Report, Summary for Policymakers. Contribution of Working Groups I, II and III to the Sixth Assessment Report of the Intergovernmental Panel on Climate Change; Core Writing Team, Lee, H., Romero, J., Eds.; IPCC: Geneva, Switzerland, 2023. [Google Scholar] [CrossRef]
- Alshawaf, F.; Balidakis, K.; Dick, G.; Heise, S.; Wickert, J. Estimating Trends in Atmospheric Water Vapor and Temperature Time Series over Germany. Atmos. Meas. Tech. 2017, 10, 3117–3132. [Google Scholar] [CrossRef]
- Jadala, N.B.; Sridhar, M.; Dutta, G.; Yousuf, M.; Reddy, Y.K. Integrated Water Vapor during Active and Break Spells of Monsoon and Its Relationship with Temperature, Precipitation and Precipitation Efficiency over a Tropical Site. Geod. Geodyn. 2022, 13, 238–246. [Google Scholar] [CrossRef]
- Zhao, Q.; Zhang, X.; Wu, K.; Liu, Y.; Li, Z.; Shi, Y. Comprehensive Precipitable Water Vapor Retrieval and Application Platform Based on Various Water Vapor Detection Techniques. Remote Sens. 2022, 14, 2507. [Google Scholar] [CrossRef]
- Wang, H.; Liu, Y.; Liu, Y.; Cao, Y.; Liang, H.; Hu, H.; Liang, J.; Tu, M. Assimilation of GNSS PWV with NCAR-RTFDDA to Improve Prediction of a Landfall Typhoon. Remote Sens. 2022, 14, 178. [Google Scholar] [CrossRef]
- Manandhar, S.; Lee, Y.H.; Meng, Y.S.; Yuan, F.; Ong, J.T. GPS-Derived PWV for Rainfall Nowcasting in Tropical Region. IEEE Trans. Geosci. Remote Sens. 2018, 56, 4835–4844. [Google Scholar] [CrossRef]
- Li, X.; Dick, G.; Ge, M.; Heise, S.; Wickert, J.; Bender, M. Real-time GPS Sensing of Atmospheric Water Vapor: Precise Point Positioning with Orbit, Clock, and Phase Delay Corrections. Geophys. Res. Lett. 2014, 41, 3615–3621. [Google Scholar] [CrossRef]
- Liang, H.; Cao, Y.; Wan, X.; Xu, Z.; Wang, H.; Hu, H. Meteorological Applications of Precipitable Water Vapor Measurements Retrieved by the National GNSS Network of China. Geod. Geodyn. 2015, 6, 135–142. [Google Scholar] [CrossRef]
- Zhao, Q.; Ma, X.; Yao, W.; Liu, Y.; Yao, Y. A Drought Monitoring Method Based on Precipitable Water Vapor and Precipitation. J. Clim. 2020, 33, 10727–10741. [Google Scholar] [CrossRef]
- Holloway, C.E.; Neelin, J.D. Temporal Relations of Column Water Vapor and Tropical Precipitation. J. Atmos. Sci. 2010, 67, 1091–1105. [Google Scholar] [CrossRef]
- Holloway, C.E.; Neelin, J.D. Moisture Vertical Structure, Column Water Vapor, and Tropical Deep Convection. J. Atmos. Sci. 2009, 66, 1665–1683. [Google Scholar] [CrossRef]
- Stott, P. How Climate Change Affects Extreme Weather Events. Science 2016, 352, 1517–1518. [Google Scholar] [CrossRef]
- Wang, J.; Zhang, L.; Dai, A. Global Estimates of Water-vapor-weighted Mean Temperature of the Atmosphere for GPS Applications. J. Geophys. Res. Atmos. 2005, 110, 2005JD006215. [Google Scholar] [CrossRef]
- Chen, B.; Liu, Z. Global Water Vapor Variability and Trend from the Latest 36 Year (1979 to 2014) Data of ECMWF and NCEP Reanalyses, Radiosonde, GPS, and Microwave Satellite. J. Geophys. Res. Atmos. 2016, 121, 11,442–11,462. [Google Scholar] [CrossRef]
- Gui, K.; Che, H.; Chen, Q.; Zeng, Z.; Liu, H.; Wang, Y.; Zheng, Y.; Sun, T.; Liao, T.; Wang, H.; et al. Evaluation of Radiosonde, MODIS-NIR-Clear, and AERONET Precipitable Water Vapor Using IGS Ground-Based GPS Measurements over China. Atmos. Res. 2017, 197, 461–473. [Google Scholar] [CrossRef]
- Yuan, P.; Van Malderen, R.; Yin, X.; Vogelmann, H.; Jiang, W.; Awange, J.; Heck, B.; Kutterer, H. Characterisations of Europe’s Integrated Water Vapour and Assessments of Atmospheric Reanalyses Using More than 2 Decades of Ground-Based GPS. Atmos. Chem. Phys. 2023, 23, 3517–3541. [Google Scholar] [CrossRef]
- Adams, D.K.; Fernandes, R.M.S.; Holub, K.L.; Gutman, S.I.; Barbosa, H.M.J.; Machado, L.A.T.; Calheiros, A.J.P.; Bennett, R.A.; Kursinski, E.R.; Sapucci, L.F.; et al. The Amazon Dense GNSS Meteorological Network: A New Approach for Examining Water Vapor and Deep Convection Interactions in the Tropics. Bull. Am. Meteorol. Soc. 2015, 96, 2151–2165. [Google Scholar] [CrossRef]
- Adams, D.K.; Fernandes, R.M.S.; Kursinski, E.R.; Maia, J.M.; Sapucci, L.F.; Machado, L.A.T.; Vitorello, I.; Monico, J.F.G.; Holub, K.L.; Gutman, S.I.; et al. A Dense GNSS Meteorological Network for Observing Deep Convection in the Amazon. Atmos. Sci. Lett. 2011, 12, 207–212. [Google Scholar] [CrossRef]
- Bevis, M.; Businger, S.; Chiswell, S.; Herring, T.A.; Anthes, R.A.; Rocken, C.; Ware, R.H. GPS Meteorology: Mapping Zenith Wet Delays onto Precipitable Water. J. Appl. Meteorol. 1988–2005 1994, 33, 379–386. [Google Scholar] [CrossRef]
- Serra, Y.L.; Adams, D.K.; Minjarez-Sosa, C.; Moker, J.M.; Arellano, A.F.; Castro, C.L.; Quintanar, A.I.; Alatorre, L.; Granados, A.; Vazquez, G.E.; et al. The North American Monsoon GPS Transect Experiment 2013. Bull. Am. Meteorol. Soc. 2016, 97, 2103–2115. [Google Scholar] [CrossRef]
- Wolfe, D.E.; Gutman, S.I. Developing an Operational, Surface-Based, GPS, Water Vapor Observing System for NOAA: Network Design and Results. J. Atmos. Ocean. Technol. 2000, 17, 426–440. [Google Scholar] [CrossRef]
- Gutman, S.I.; Sahm, S.R.; Benjamin, S.G.; Schwartz, B.E.; Holub, K.L.; Stewart, J.Q.; Smith, T.L. Rapid Retrieval and Assimilation of Ground Based GPS Precipitable Water Observations at the NOAA Forecast Systems Laboratory: Impact on Weather Forecasts. J. Meteorol. Soc. Jpn. Ser. II 2004, 82, 351–360. [Google Scholar] [CrossRef]
- Gutman, S.I.; Benjamin, S.G. The Role of Ground-Based GPS Meteorological Observations in Numerical Weather Prediction. GPS Solut. 2001, 4, 16–24. [Google Scholar] [CrossRef]
- Kursinski, E.R.; Adams, D.K.; Leuthold, M. GPS Observations of Precipitable Water and Implications for the Predictability of Precipitation during the North American Monsoon. CLIVAR Exch. 2008, 45, 13–21. [Google Scholar]
- Hersbach, H.; de Rosnay, P.; Bell, B.; Schepers, D.; Simmons, A.; Soci, C.; Abdalla, S.; Alonso-Balmaseda, M.; Balsamo, G.; Bechtold, P.; et al. Operational Global Reanalysis: Progress, Future Directions and Synergies with NWP; ECMWF: Reading, UK, 2018. [Google Scholar]
- Gelaro, R.; McCarty, W.; Suárez, M.J.; Todling, R.; Molod, A.; Takacs, L.; Randles, C.A.; Darmenov, A.; Bosilovich, M.G.; Reichle, R.; et al. The Modern-Era Retrospective Analysis for Research and Applications, Version 2 (MERRA-2). J. Clim. 2017, 30, 5419–5454. [Google Scholar] [CrossRef]
- Molod, A.; Takacs, L.; Suarez, M.; Bacmeister, J. Development of the GEOS-5 Atmospheric General Circulation Model: Evolution from MERRA to MERRA2. Geosci. Model Dev. 2015, 8, 1339–1356. [Google Scholar] [CrossRef]
- Li, J.; Zhang, B.; Yao, Y.; Liu, L.; Sun, Z.; Yan, X. A Refined Regional Model for Estimating Pressure, Temperature, and Water Vapor Pressure for Geodetic Applications in China. Remote Sens. 2020, 12, 1713. [Google Scholar] [CrossRef]
- Wang, S.; Xu, T.; Nie, W.; Jiang, C.; Yang, Y.; Fang, Z.; Li, M.; Zhang, Z. Evaluation of Precipitable Water Vapor from Five Reanalysis Products with Ground-Based GNSS Observations. Remote Sens. 2020, 12, 1817. [Google Scholar] [CrossRef]
- Park, S. Water Vapor Estimation Using Near-Surface Radar Refractivity during IHOP_2002; Library and Archives Canada = Bibliothèque et Archives Canada: Ottawa, ON, Canada, 2006; ISBN 978-0-494-06439-9. [Google Scholar]
- Puviarasan, N.; Giri, R.K.; Ranalkar, M. Precipitable Water Vapour Monitoring Using Ground Based GPS System. Mausam 2010, 61, 203–212. [Google Scholar] [CrossRef]
- Cucurull, L.; Navascues, B.; Ruffini, G.; Elósegui, P.; Rius, A.; Vilà, J. The Use of GPS to Validate NWP Systems: The HIRLAM Model. J. Atmos. Ocean. Technol. 2000, 17, 773–787. [Google Scholar] [CrossRef]
- Huang, L.; Mo, Z.; Xie, S.; Liu, L.; Chen, J.; Kang, C.; Wang, S. Spatiotemporal Characteristics of GNSS-Derived Precipitable Water Vapor during Heavy Rainfall Events in Guilin, China. Satell. Navig. 2021, 2, 13. [Google Scholar] [CrossRef]
- Chen, B.; Liu, Z.; Wong, W.-K.; Woo, W.-C. Detecting Water Vapor Variability during Heavy Precipitation Events in Hong Kong Using the GPS Tomographic Technique. J. Atmos. Ocean. Technol. 2017, 34, 1001–1019. [Google Scholar] [CrossRef]
- Wu, Y.; Xie, S.; Zhang, J.; Zeng, Y. Precision analysis of PWV calculated from ERA5/MERRA-2 data during a rainstorm process in Guilin. China Sci. 2023, 18, 103–108. [Google Scholar]
- Liu, W.; Zhang, L.; Xiong, S.; Huang, L.; Xie, S.; Liu, L. Investigating the ERA5-Based PWV Products and Identifying the Monsoon Active and Break Spells with Dense GNSS Sites in Guangxi, China. Remote Sens. 2023, 15, 4710. [Google Scholar] [CrossRef]
- Qin, N.X.; Wang, J.N.; Gao, L.; Hong, Y.; Huang, J.L.; Lu, Q.Q. Observed Trends of Different Rainfall Intensities and the Associated Spatiotemporal Variations during 1958–2016 in Guangxi, China. Int. J. Climatol. 2021, 41, E2880–E2895. [Google Scholar] [CrossRef]
- Zhang, Y.; Cai, C.; Chen, B.; Dai, W. Consistency Evaluation of Precipitable Water Vapor Derived from ERA5, ERA-Interim, GNSS, and Radiosondes over China. Radio Sci. 2019, 54, 561–571. [Google Scholar] [CrossRef]
- Chen, B.; Yu, W.; Wang, W.; Zhang, Z.; Dai, W. A Global Assessment of Precipitable Water Vapor Derived From GNSS Zenith Tropospheric Delays With ERA5, NCEP FNL, and NCEP GFS Products. Earth Space Sci. 2021, 8, e2021EA001796. [Google Scholar] [CrossRef]
- Hersbach, H.; Bell, B.; Berrisford, P.; Hirahara, S.; Horányi, A.; Muñoz-Sabater, J.; Nicolas, J.; Peubey, C.; Radu, R.; Schepers, D.; et al. The ERA5 Global Reanalysis. Q. J. R. Meteorol. Soc. 2020, 146, 1999–2049. [Google Scholar] [CrossRef]
- Zhu, D.; Zhang, K.; Yang, L.; Wu, S.; Li, L. Evaluation and Calibration of MODIS Near-Infrared Precipitable Water Vapor over China Using GNSS Observations and ERA-5 Reanalysis Dataset. Remote Sens. 2021, 13, 2761. [Google Scholar] [CrossRef]
- Wang, J.; Zhang, L. Climate Applications of a Global, 2-Hourly Atmospheric Precipitable Water Dataset Derived from IGS Tropospheric Products. J. Geod. 2009, 83, 209–217. [Google Scholar] [CrossRef]
- Yao, Y.; Xu, C.; Zhang, B.; Cao, N. GTm-III: A New Global Empirical Model for Mapping Zenith Wet Delays onto Precipitable Water Vapour. Geophys. J. Int. 2014, 197, 202–212. [Google Scholar] [CrossRef]
- Zhang, H.; Yuan, Y.; Li, W.; Zhang, B. A Real-Time Precipitable Water Vapor Monitoring System Using the National GNSS Network of China: Method and Preliminary Results. IEEE J. Sel. Top. Appl. Earth Obs. Remote Sens. 2019, 12, 1587–1598. [Google Scholar] [CrossRef]
- Chen, Q.; Song, S.; Heise, S.; Liou, Y.-A.; Zhu, W.; Zhao, J. Assessment of ZTD Derived from ECMWF/NCEP Data with GPS ZTD over China. GPS Solut. 2011, 15, 415–425. [Google Scholar] [CrossRef]
- Wang, X.; Zhang, K.; Wu, S.; Fan, S.; Cheng, Y. Water Vapor-Weighted Mean Temperature and Its Impact on the Determination of Precipitable Water Vapor and Its Linear Trend. J. Geophys. Res. Atmos. 2016, 121, 833–852. [Google Scholar] [CrossRef]
- Saastamoinen, J. Contributions to the Theory of Atmospheric Refraction. Bull. Géod. 1946–1975 1972, 105, 279–298. [Google Scholar] [CrossRef]
- Askne, J.; Nordius, H. Estimation of Tropospheric Delay for Microwaves from Surface Weather Data. Radio Sci. 1987, 22, 379–386. [Google Scholar] [CrossRef]
- Huang, L.; Jiang, W.; Liu, L.; Chen, H.; Ye, S. A New Global Grid Model for the Determination of Atmospheric Weighted Mean Temperature in GPS Precipitable Water Vapor. J. Geod. 2019, 93, 159–176. [Google Scholar] [CrossRef]
- Huang, L.; Mo, Z.; Liu, L.; Xie, S. An Empirical Model for the Vertical Correction of Precipitable Water Vapor Considering the Time-Varying Lapse Rate for Mainland China. Acta Geod. Cartogr. Sin. 2021, 50, 1320. [Google Scholar] [CrossRef]
Figure 1.
Distribution of GNSS stations, meteorological stations, and radiosonde stations in the Guangxi region of China.
Figure 1.
Distribution of GNSS stations, meteorological stations, and radiosonde stations in the Guangxi region of China.
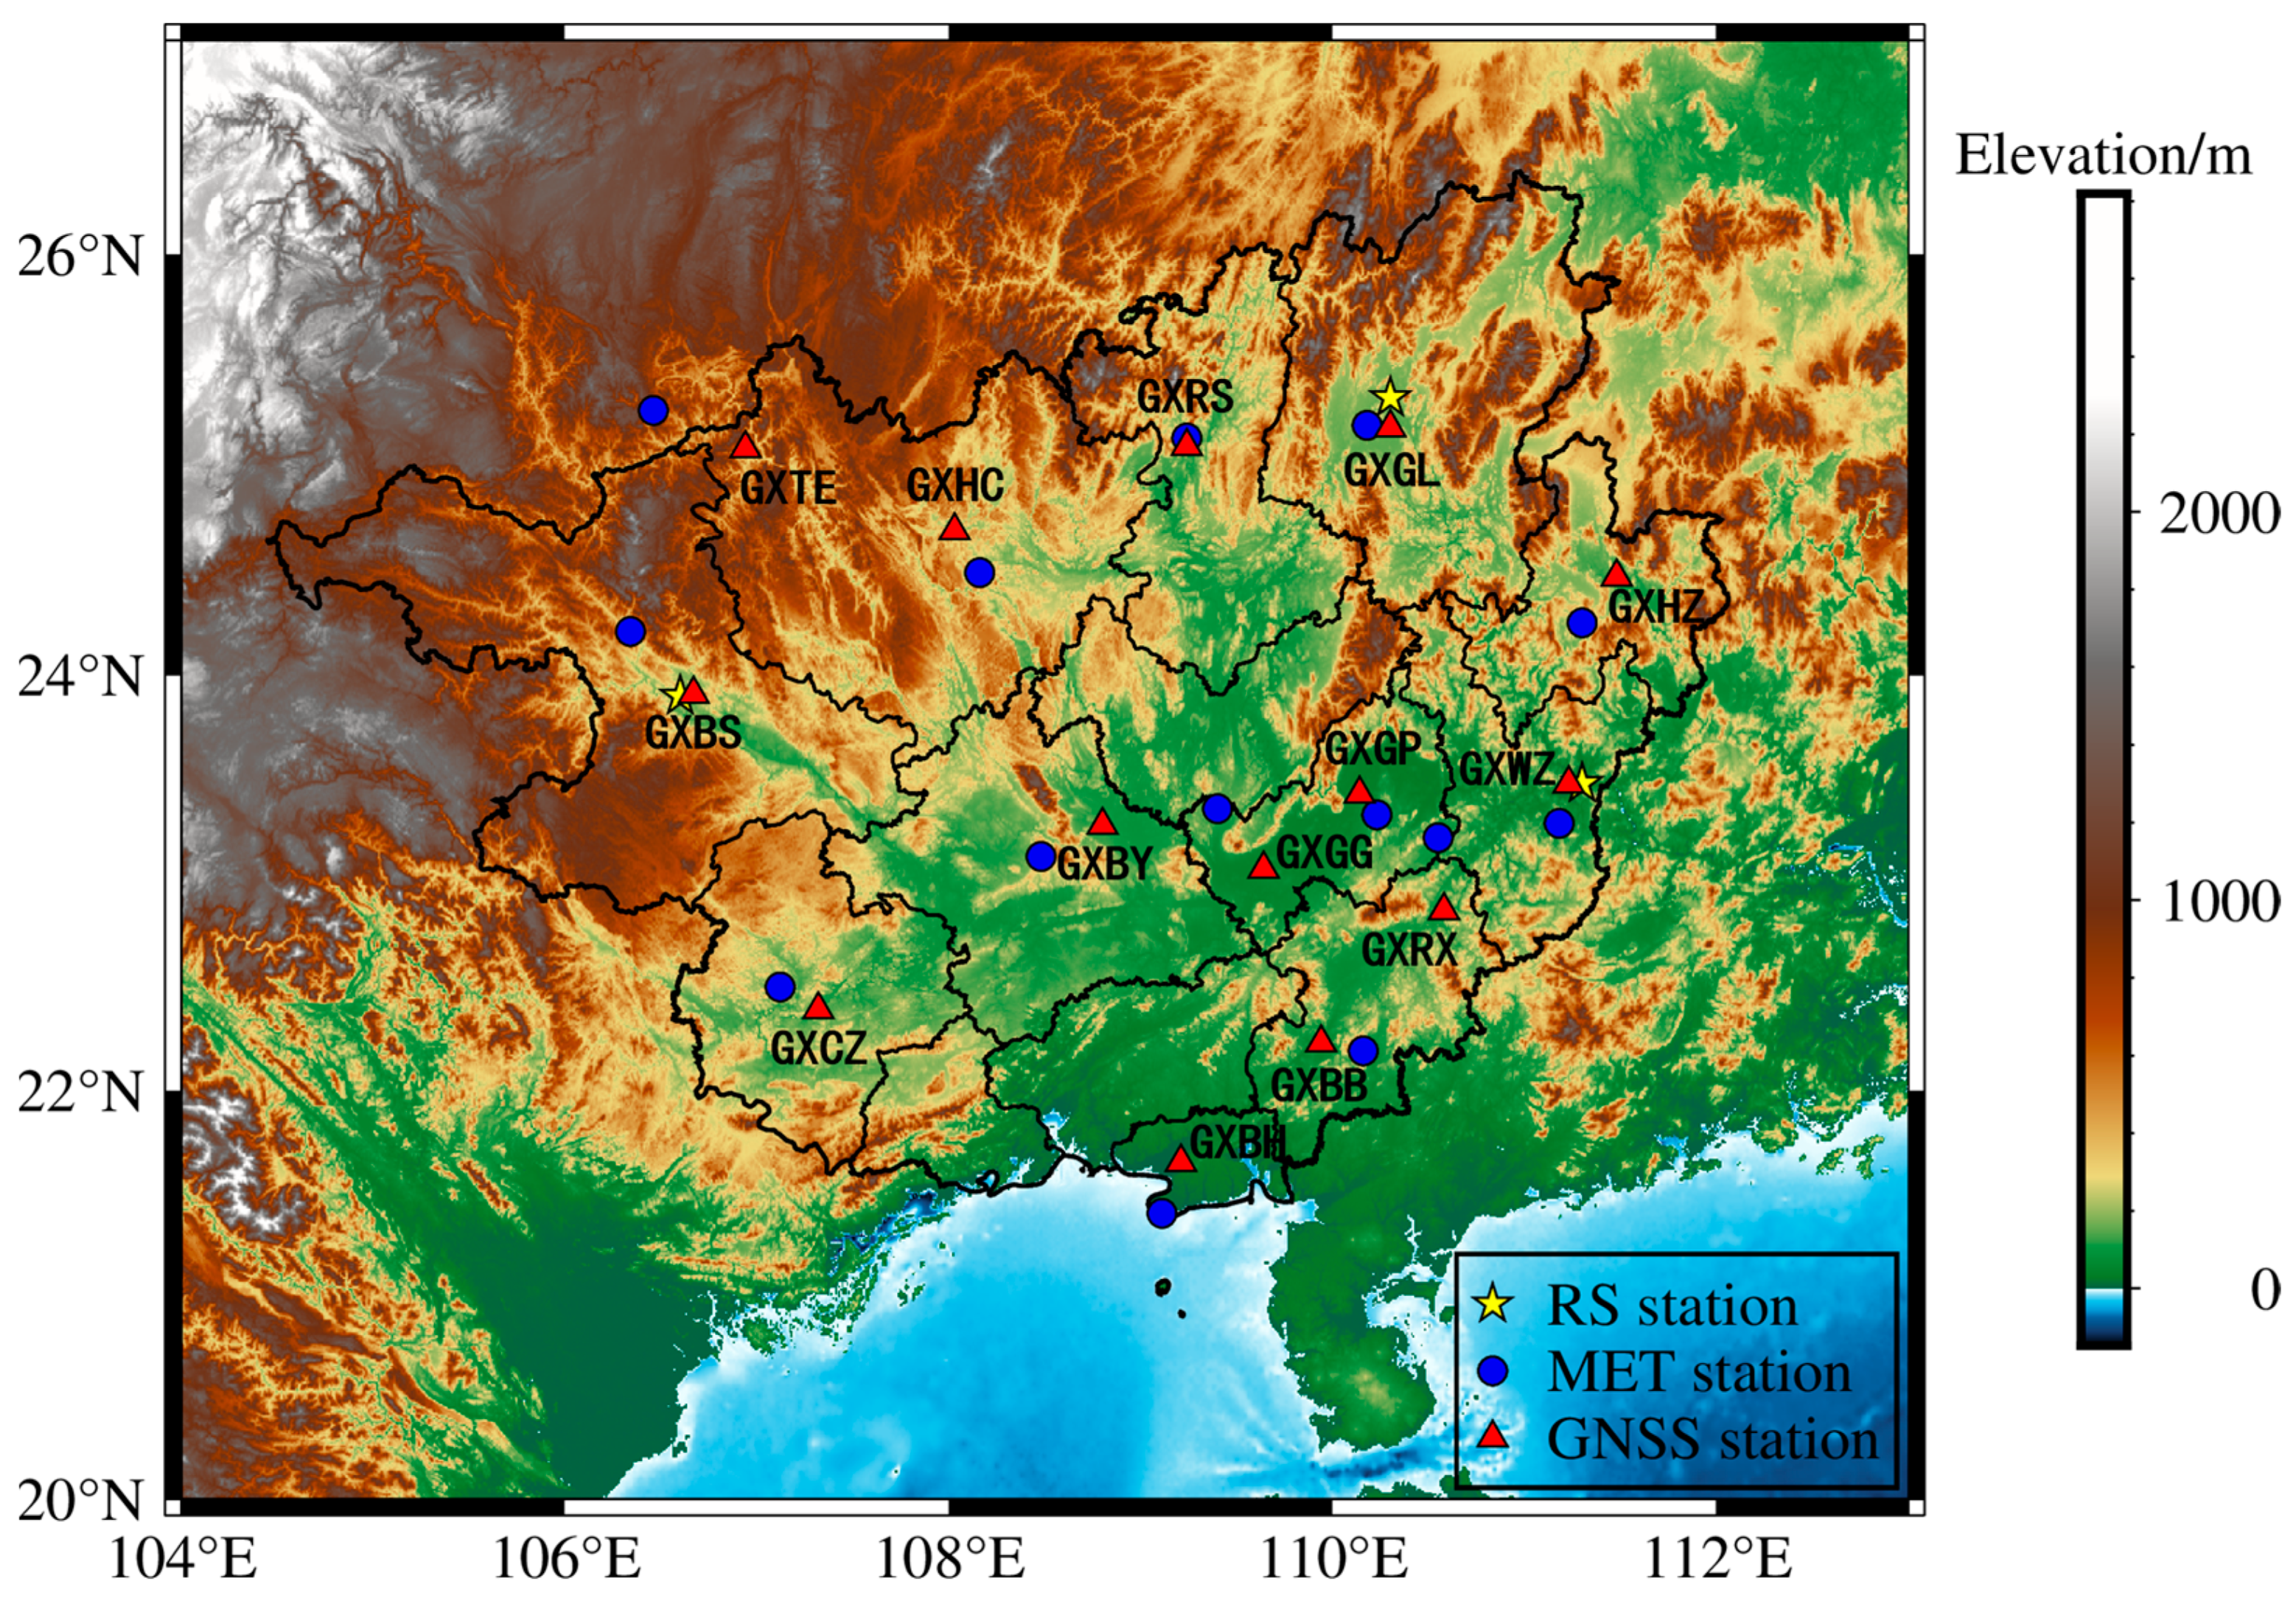
Figure 2.
Distribution of average bias and average RMSE between GNSS PWV and MERRA-2/ERA5 PWV under heavy and severe rainfall conditions in the Guangxi region ((I) represents the spatial distribution of accuracy for heavy rainfall. (II) represents the spatial distribution of accuracy for severe rainfall. (a) represents the Bias of MERRA-2, (b) represents the Bias of ERA5, (c) represents the RMSE of MERRA-2, and (d) represents the RMSE of ERA5).
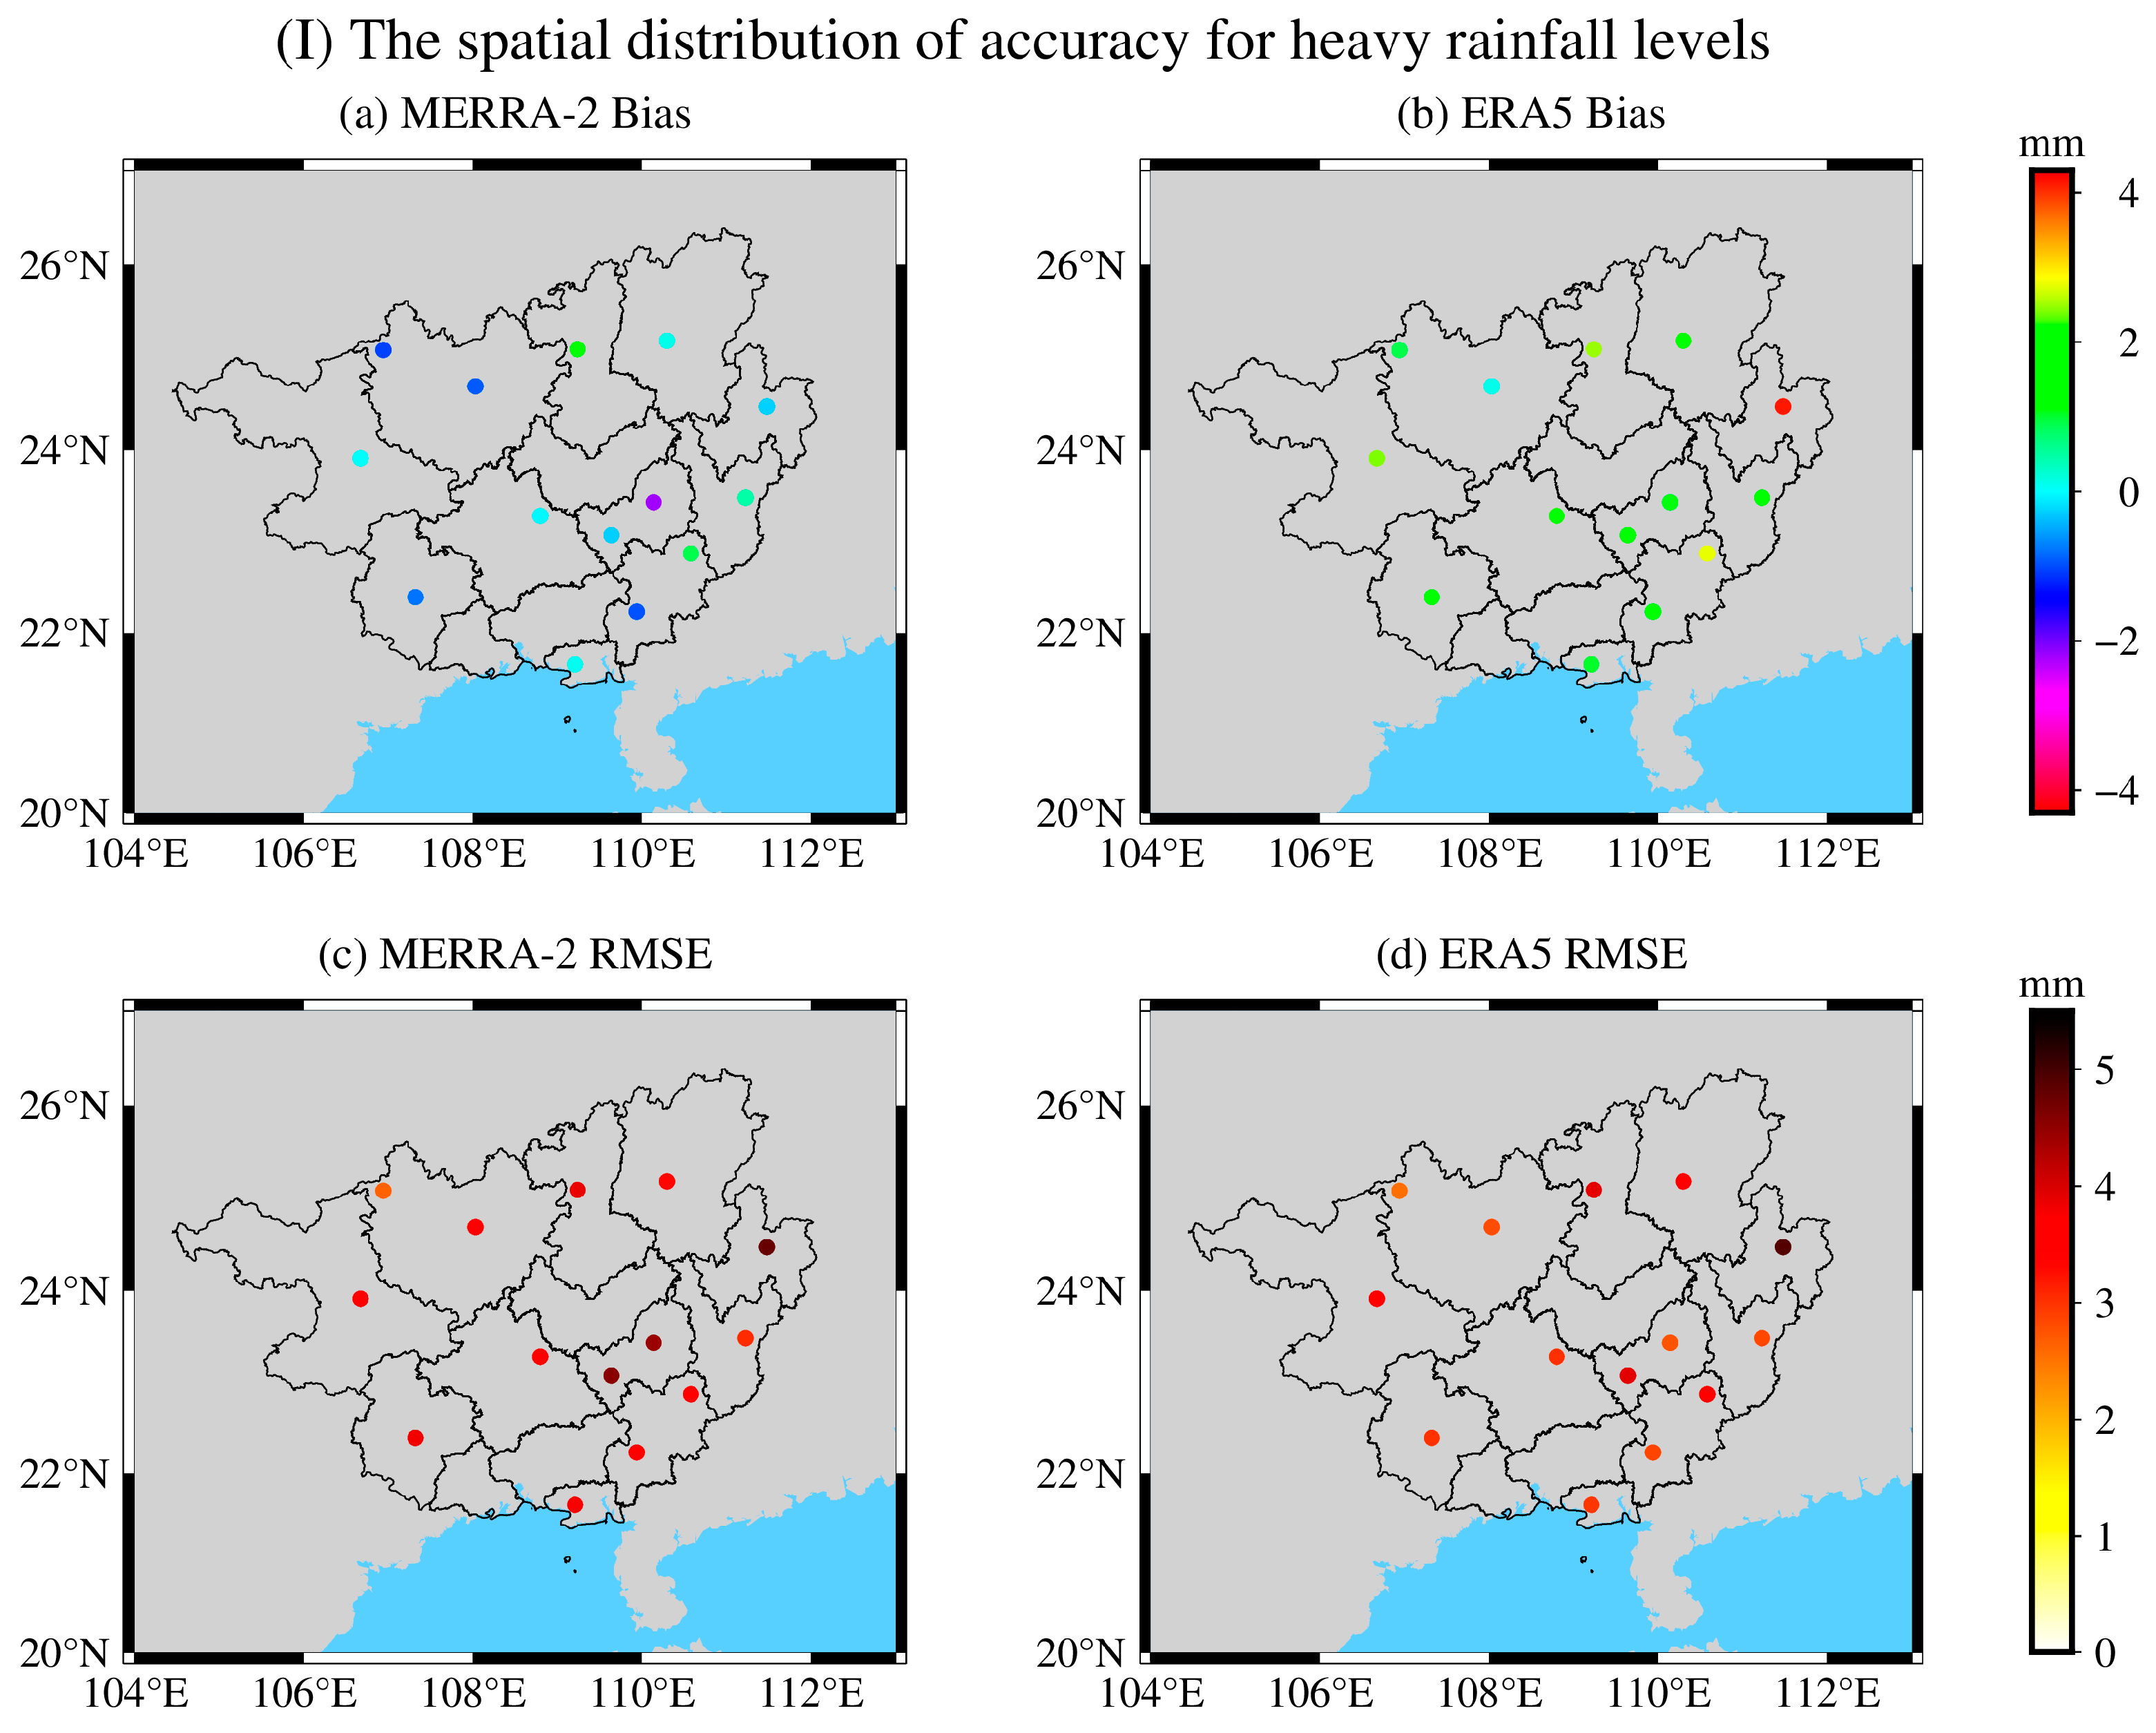
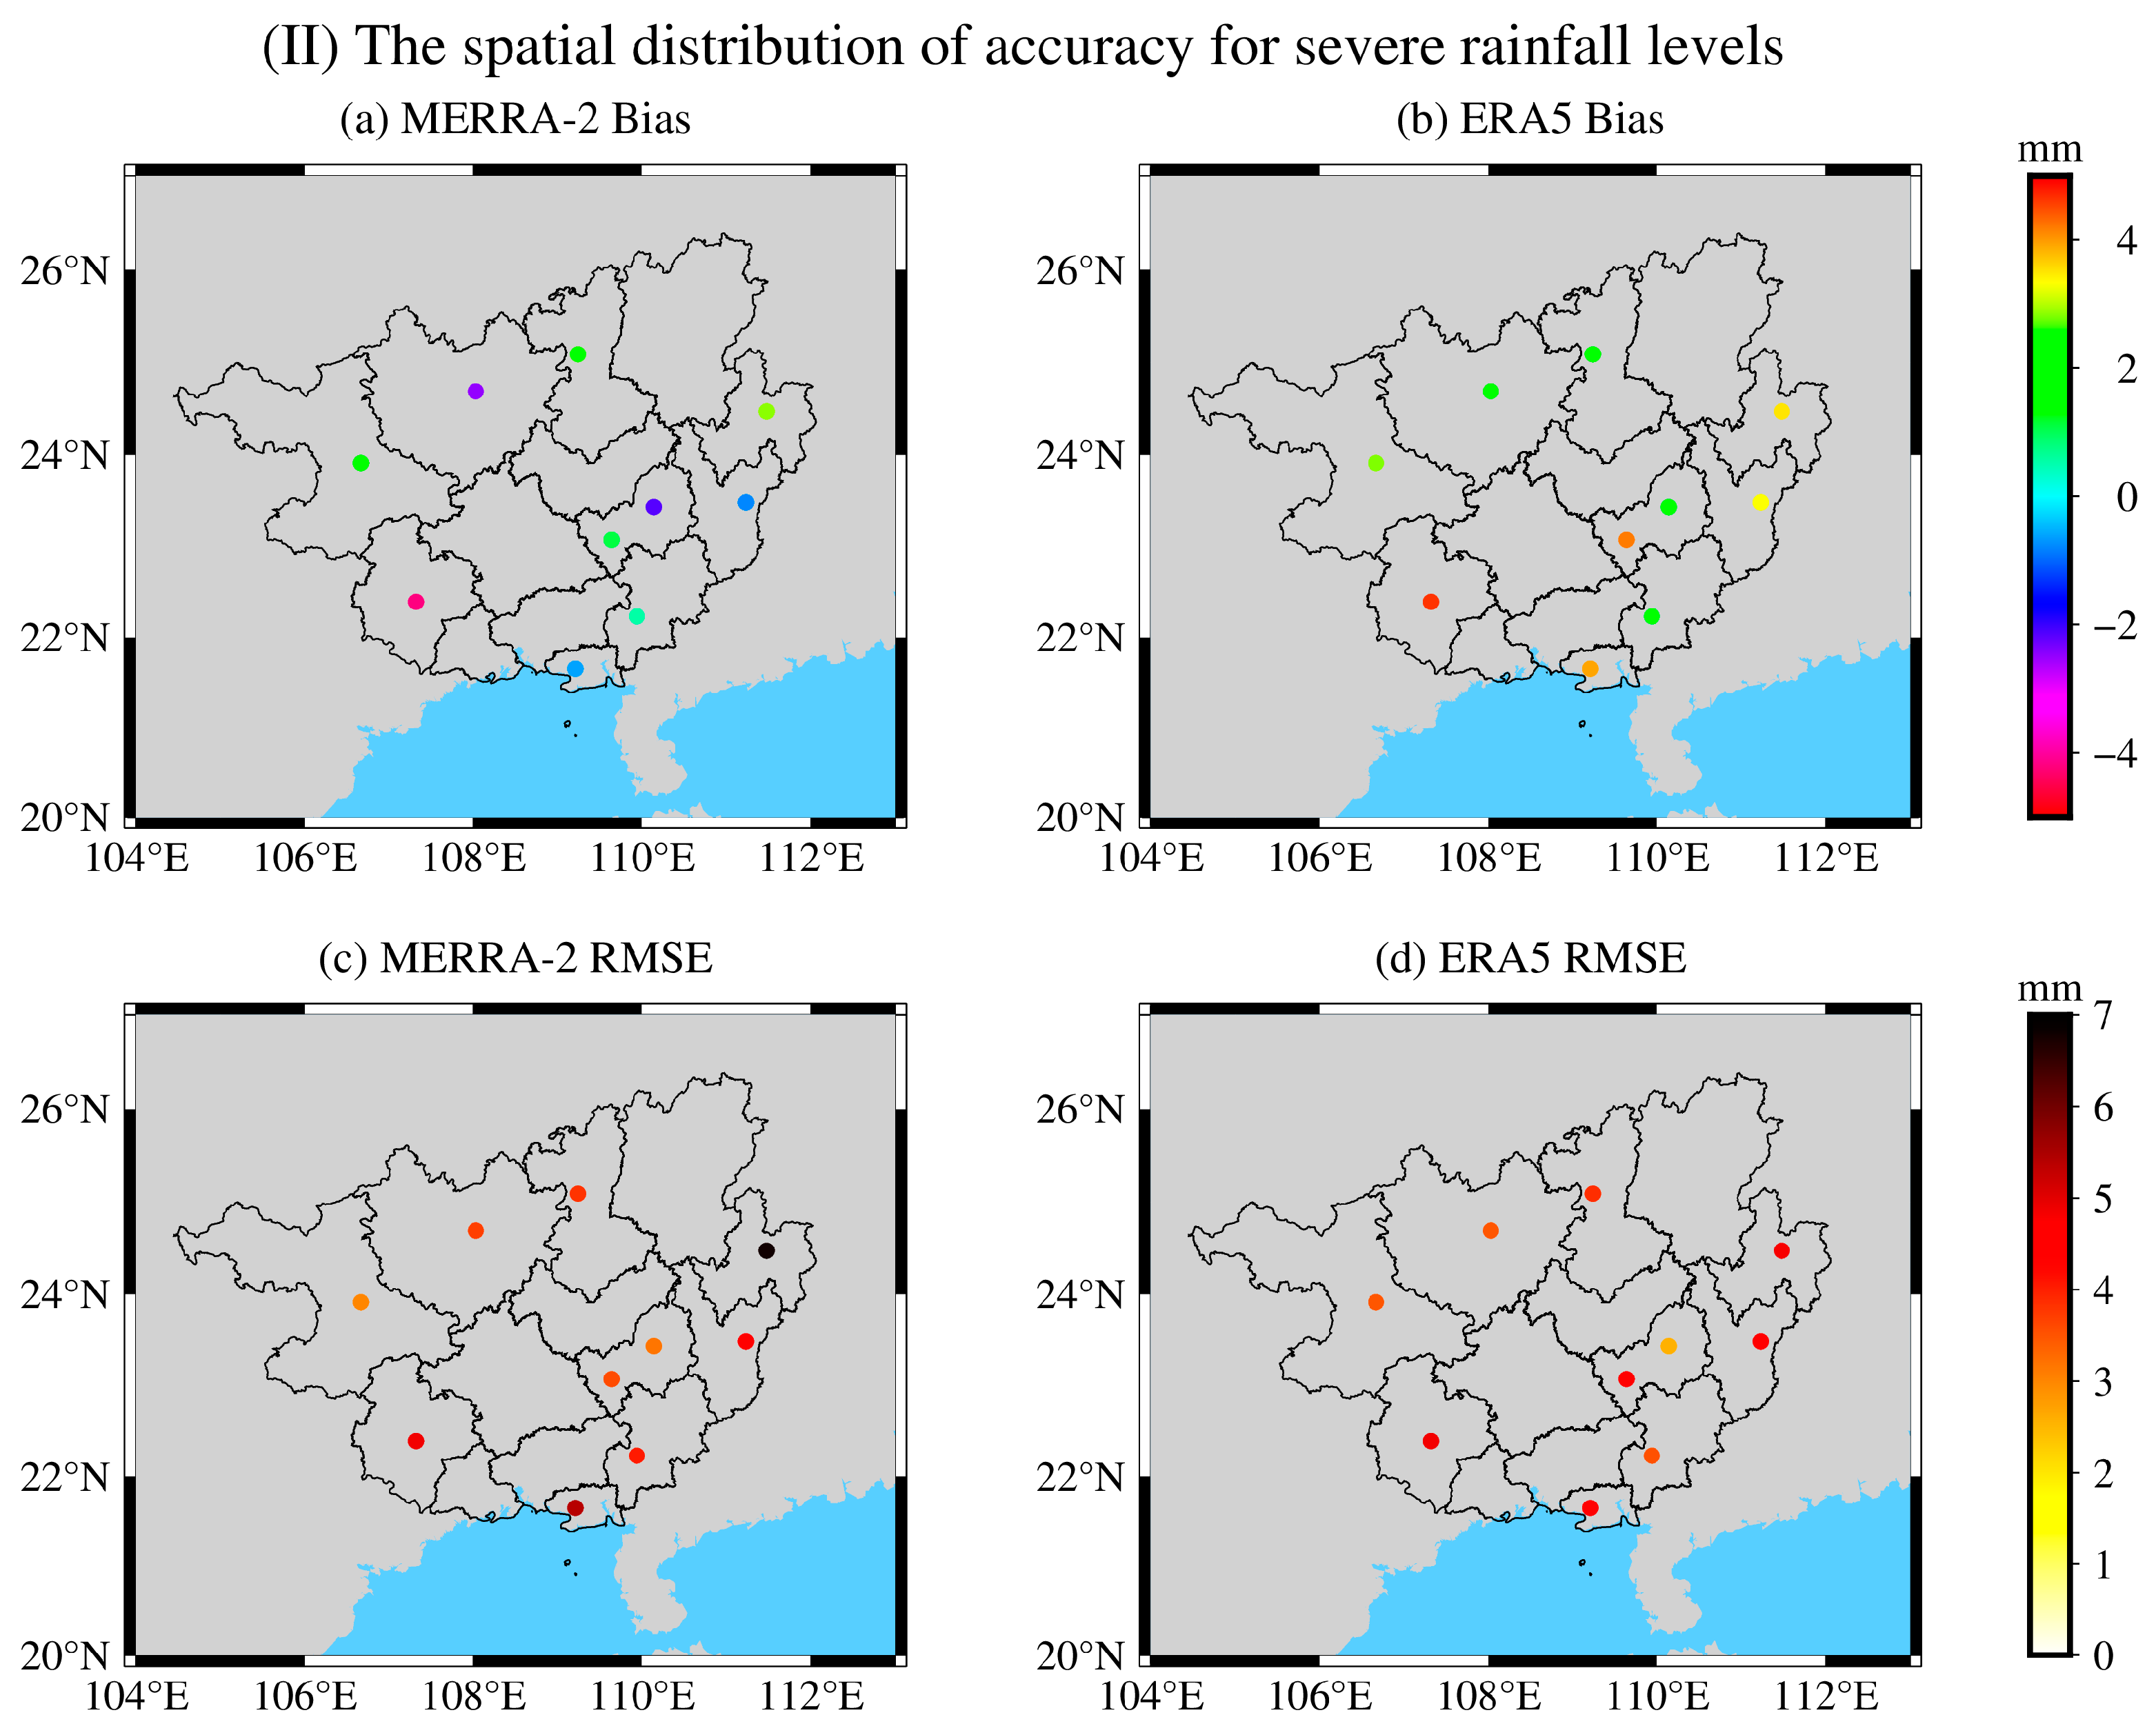
Figure 3.
Biases between GNSS PWV and MERRA-2/ERA5 PWV at different stations for the heavy rainfall level.
Figure 3.
Biases between GNSS PWV and MERRA-2/ERA5 PWV at different stations for the heavy rainfall level.

Figure 4.
RMSEs between GNSS PWV and MERRA-2/ERA5 PWV at different stations for the heavy rainfall level.
Figure 4.
RMSEs between GNSS PWV and MERRA-2/ERA5 PWV at different stations for the heavy rainfall level.

Figure 5.
Biases between GNSS PWV and MERRA-2/ERA5 PWV at different stations for the severe rainfall level.
Figure 5.
Biases between GNSS PWV and MERRA-2/ERA5 PWV at different stations for the severe rainfall level.
Figure 6.
RMSEs between GNSS PWV and MERRA-2/ERA5 PWV at different stations for the severe rainfall level.
Figure 6.
RMSEs between GNSS PWV and MERRA-2/ERA5 PWV at different stations for the severe rainfall level.
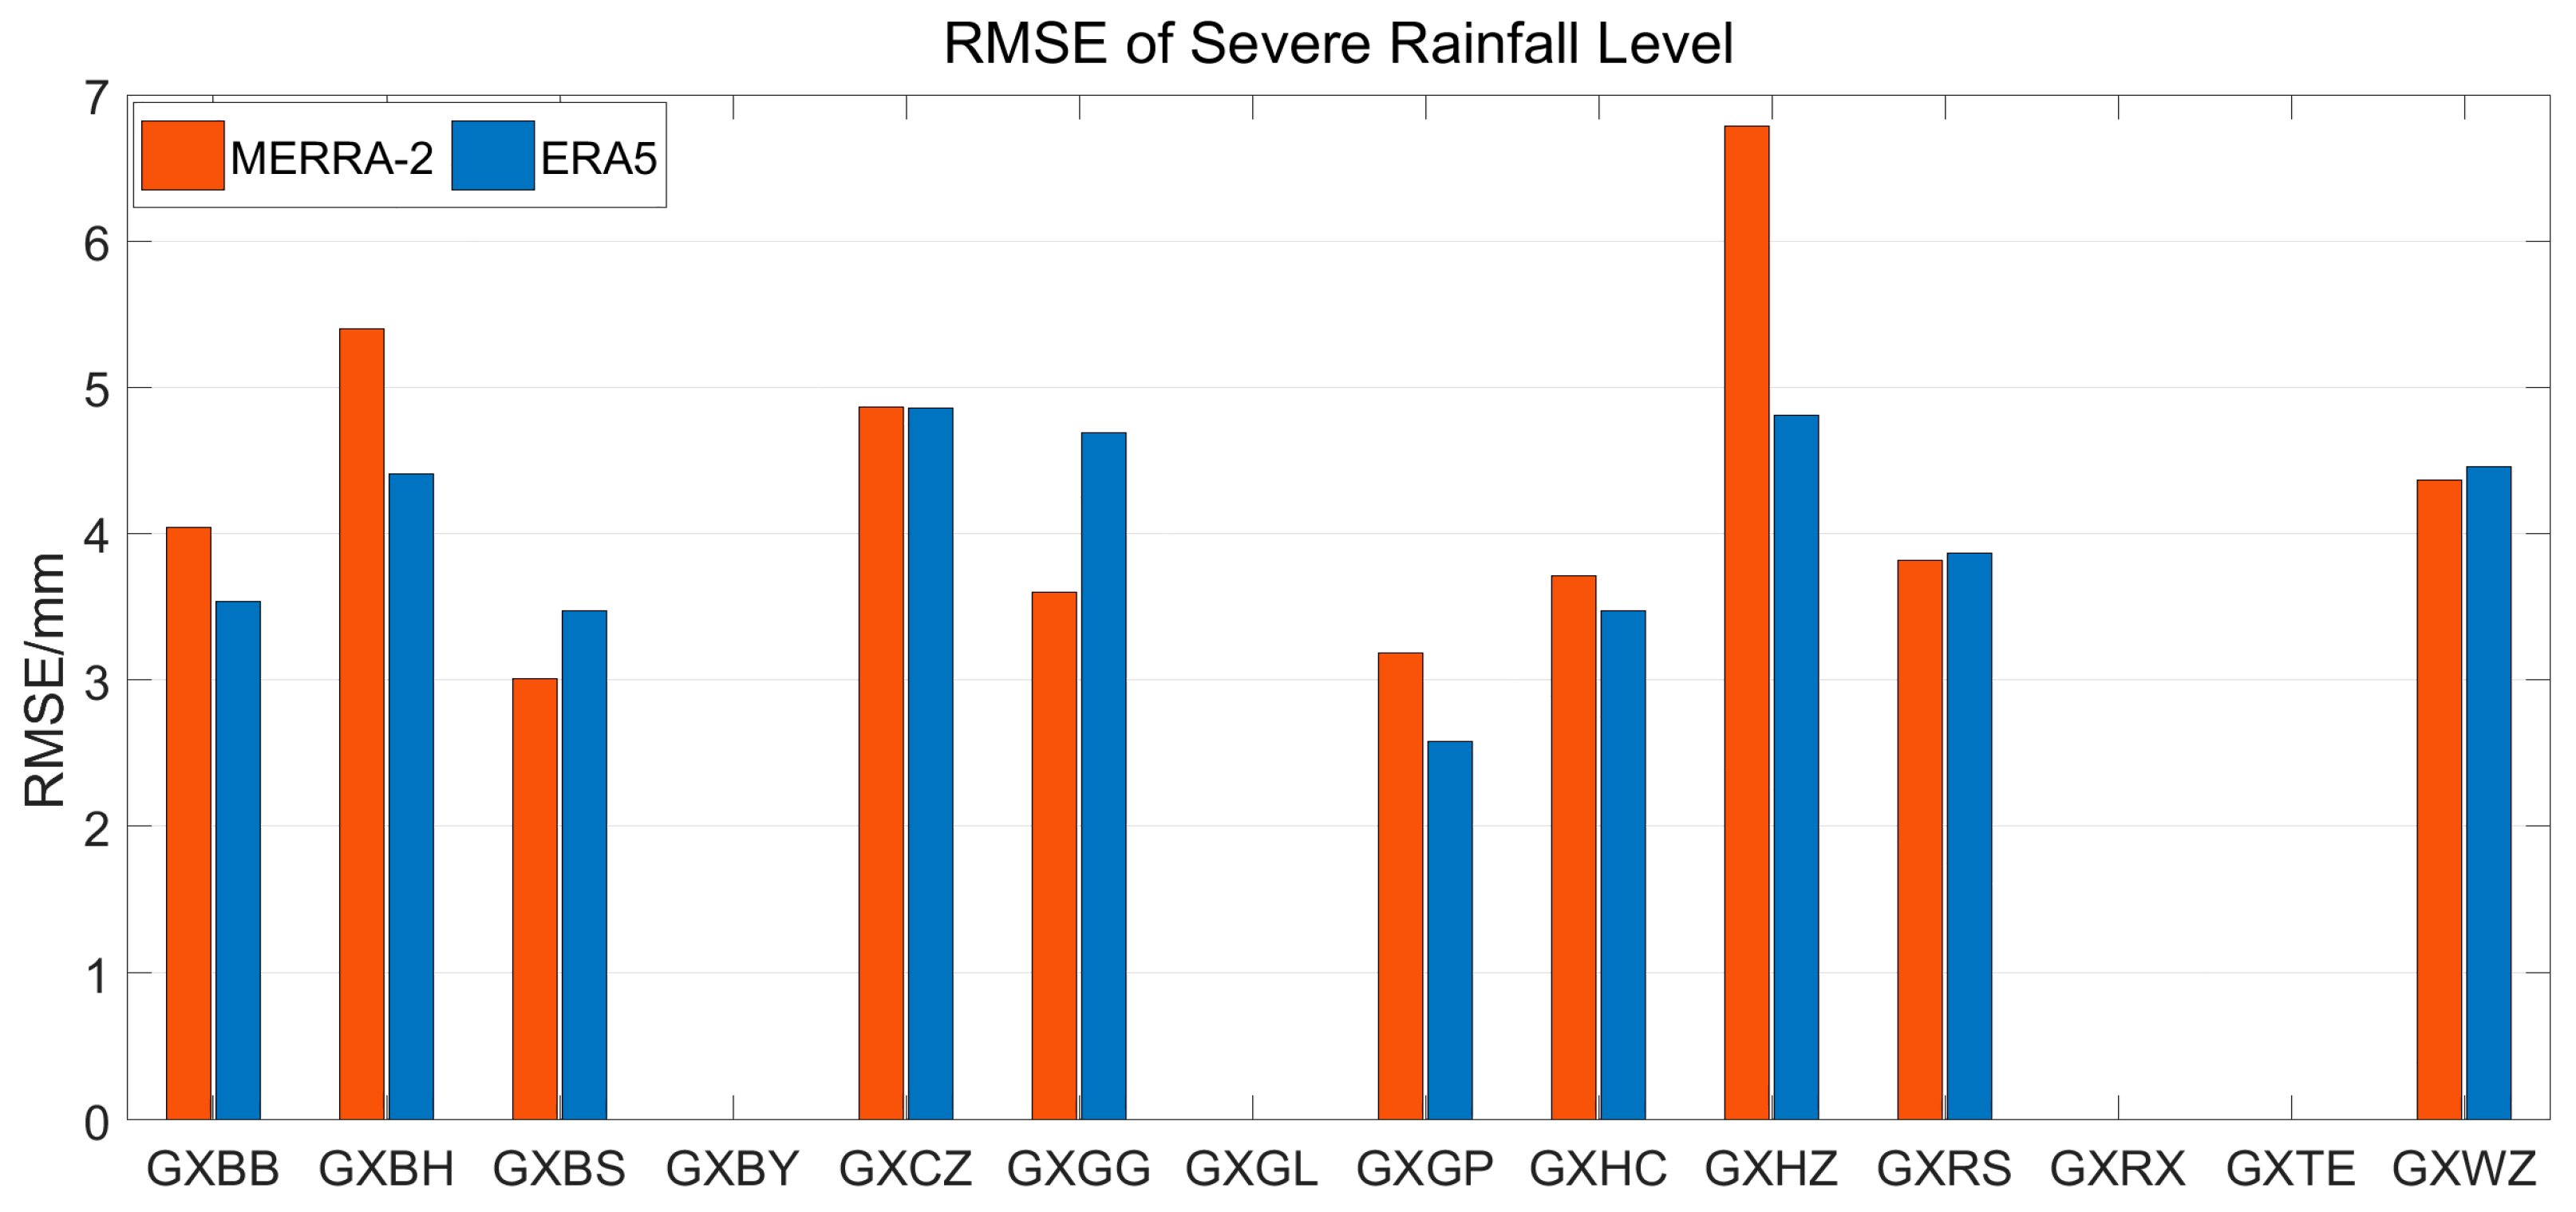
Figure 7.
Distribution of daily average bias and RMSE between GNSS PWV and MERRA-2/ERA5 PWV during heavy rain days in the Guangxi region ((a) represents the Bias of MERRA-2, (b) represents the Bias of ERA5, (c) represents the RMSE of MERRA-2, and (d) represents the RMSE of ERA5).
Figure 7.
Distribution of daily average bias and RMSE between GNSS PWV and MERRA-2/ERA5 PWV during heavy rain days in the Guangxi region ((a) represents the Bias of MERRA-2, (b) represents the Bias of ERA5, (c) represents the RMSE of MERRA-2, and (d) represents the RMSE of ERA5).

Figure 8.
Comparison of bias between GNSS PWV and MERRA-2/ERA5 PWV during heavy rain days.

Figure 9.
Comparison of RMSE between GNSS PWV and MERRA-2/ERA5 PWV during heavy rain days.
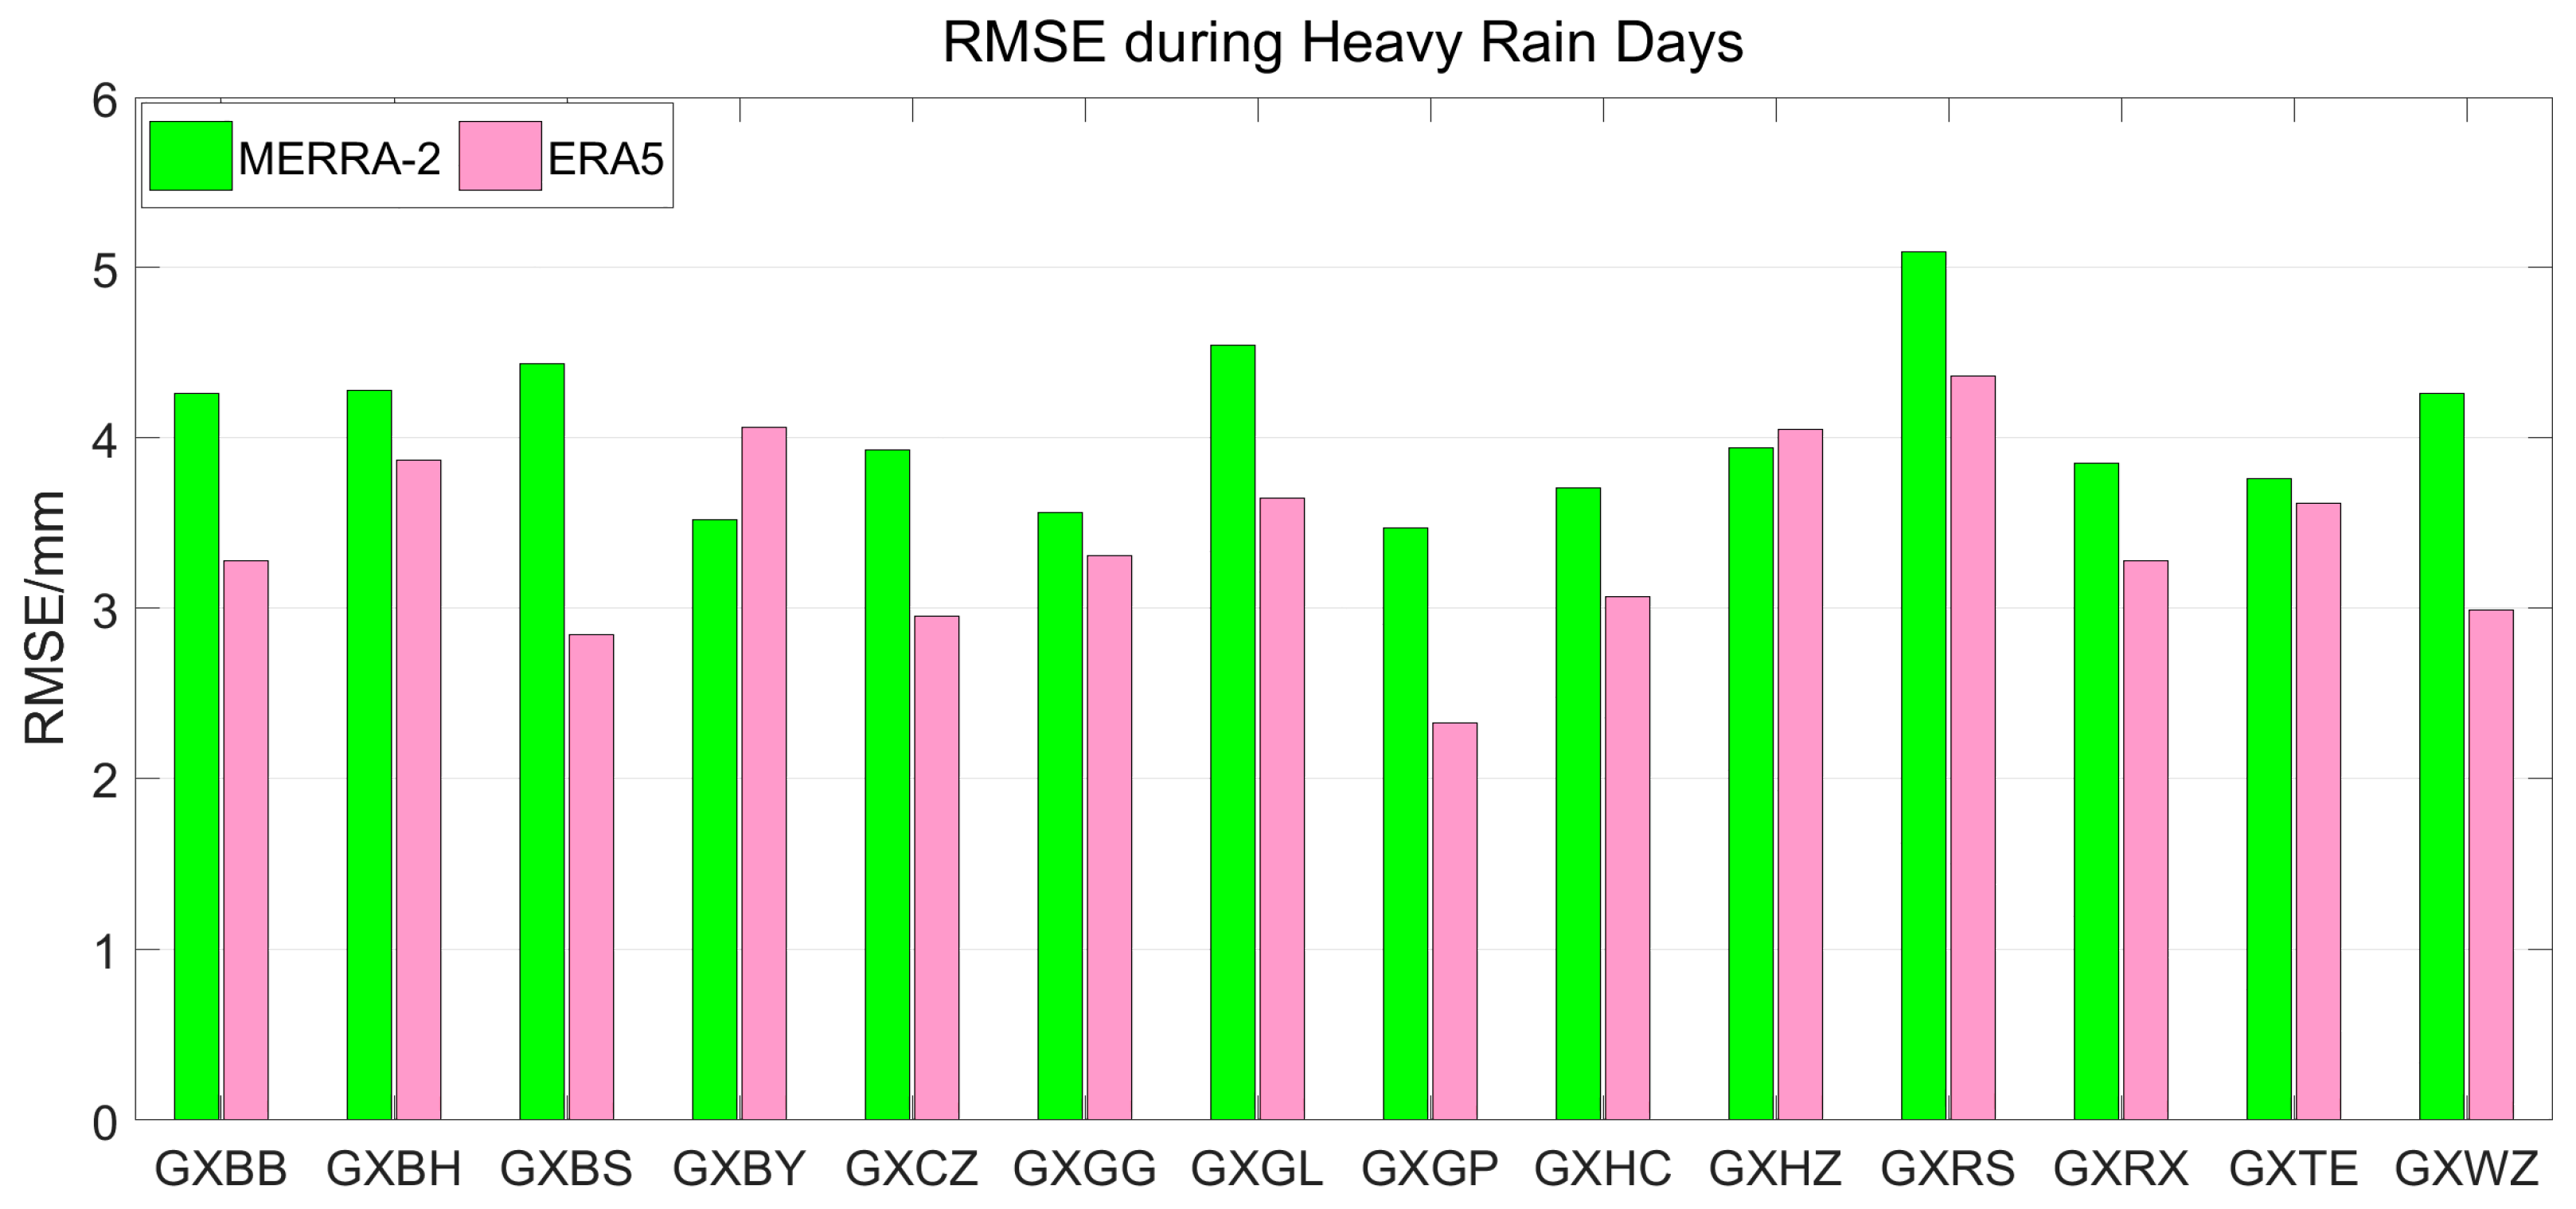
Figure 10.
Analysis of the temporal variations of GNSS/MERRA-2/ERA5 PWV compared with actual precipitation (The nine stations in order are GXBB, GXBH, GXCZ, GXGL, GXGP, GXHC, GXHZ, GXRX, and GXWZ).
Figure 10.
Analysis of the temporal variations of GNSS/MERRA-2/ERA5 PWV compared with actual precipitation (The nine stations in order are GXBB, GXBH, GXCZ, GXGL, GXGP, GXHC, GXHZ, GXRX, and GXWZ).

Table 1.
Model coefficients of the Tm model used in this study.
| Model Coefficients | A0 | A1 | A2 | A3 | B1 | B2 | B3 | B4 |
|---|---|---|---|---|---|---|---|---|
| value | 72.367 | 0.732 | −0.001 | −0.145 | 0.452 | −0.235 | −0.060 | −0.263 |
Table 2.
Coefficients of the vertical correction model for PWV.
| Model Coefficients | A0 | A1 | A2 | A3 | A4 |
|---|---|---|---|---|---|
| value | −0.350 | −0.026 | −0.015 | 0.008 | 0.026 |
Table 3.
Rainfall intensity classification by the Chinese meteorological department.
| Rainfall Intensity | Total Precipitation in 24 h (mm) |
|---|---|
| Light rain | 0.1–9.9 |
| Moderate rain | 10–24.9 |
| Heavy rain | 25–49.9 |
| Severe rain | 50–99.9 |
| Heavy torrential rain | 100–249.9 |
| Severe torrential rain | ≥250 |
Table 4.
Comparison between GNSS PWV and radiosonde PWV in Guangxi from 2016 to 2018.
| GNSS Station | Bias (mm) | RMSE (mm) | Correlation Coefficient (R) |
|---|---|---|---|
| GXWZ | −0.81 | 3.48 | 0.97 |
| GXGL | −0.88 | 4.12 | 0.97 |
| GXBS | −2.92 | 4.50 | 0.98 |
Table 5.
Maximum, minimum, and average values of MERRA-2/ERA5 PWV bias.
| Rainfall Level | MERRA-2 Bias/mm | ERA5 Bias/mm | ||||
|---|---|---|---|---|---|---|
| Max | Min | Mean | Max | Min | Mean | |
| Heavy rain | 1.89 | −2.20 | −0.22 | 4.13 | 0.11 | 1.84 |
| Severe rain | 2.85 | −4.19 | −0.14 | 4.65 | 1.39 | 2.92 |
Table 6.
Maximum, minimum, and average values of MERRA-2/ERA5 PWV RMSE.
| Rainfall Level | MERRA-2 RMSE/mm | ERA5 RMSE/mm | ||||
|---|---|---|---|---|---|---|
| Max | Min | Mean | Max | Min | Mean | |
| Heavy rain | 4.79 | 2.66 | 3.72 | 4.90 | 2.54 | 3.31 |
| Severe rain | 6.79 | 3.00 | 4.28 | 4.86 | 2.58 | 4.01 |
Table 7.
Daily average bias and RMSE of MERRA-2/ERA5 PWV during heavy rain days.
| GNSS Station | Bias/mm | RMSE/mm | ||
|---|---|---|---|---|
| MERRA-2 | ERA5 | MERRA-2 | ERA5 | |
| GXBB | 0.61 | 2.37 | 4.26 | 3.28 |
| GXBH | 1.52 | 2.52 | 4.28 | 3.87 |
| GXBS | 0.47 | 2.09 | 4.43 | 2.84 |
| GXBY | 2.36 | 3.25 | 3.52 | 4.06 |
| GXCZ | 0.51 | 1.82 | 3.93 | 2.95 |
| GXGG | 1.03 | 2.21 | 3.56 | 3.31 |
| GXGL | 3.02 | 2.98 | 4.54 | 3.64 |
| GXGP | −1.32 | 1.21 | 3.47 | 2.33 |
| GXHC | 1.92 | 1.25 | 3.71 | 3.06 |
| GXHZ | −0.07 | 2.88 | 3.94 | 4.05 |
| GXRS | 2.22 | 3.89 | 5.09 | 4.36 |
| GXRX | −0.37 | 2.53 | 3.85 | 3.28 |
| GXTE | −0.28 | 2.83 | 3.76 | 3.61 |
| GXWZ | 1.28 | 2.00 | 4.26 | 2.99 |
Disclaimer/Publisher’s Note: The statements, opinions and data contained in all publications are solely those of the individual author(s) and contributor(s) and not of MDPI and/or the editor(s). MDPI and/or the editor(s) disclaim responsibility for any injury to people or property resulting from any ideas, methods, instructions or products referred to in the content. |
© 2024 by the authors. Licensee MDPI, Basel, Switzerland. This article is an open access article distributed under the terms and conditions of the Creative Commons Attribution (CC BY) license (https://creativecommons.org/licenses/by/4.0/).
Share and Cite
MDPI and ACS Style
Huang, N.; Fu, S.; Chen, B.; Huang, L.; Jin, W. Assessing the Performance of Water Vapor Products from ERA5 and MERRA-2 during Heavy Rainfall in the Guangxi Region of China. Atmosphere 2024, 15, 306. https://doi.org/10.3390/atmos15030306
AMA Style
Huang N, Fu S, Chen B, Huang L, Jin W. Assessing the Performance of Water Vapor Products from ERA5 and MERRA-2 during Heavy Rainfall in the Guangxi Region of China. Atmosphere. 2024; 15(3):306. https://doi.org/10.3390/atmos15030306
Chicago/Turabian StyleHuang, Ning, Shiyang Fu, Biyan Chen, Liangke Huang, and Wenping Jin. 2024. "Assessing the Performance of Water Vapor Products from ERA5 and MERRA-2 during Heavy Rainfall in the Guangxi Region of China" Atmosphere 15, no. 3: 306. https://doi.org/10.3390/atmos15030306
Note that from the first issue of 2016, this journal uses article numbers instead of page numbers. See further details here.