Article

Estimation and Analysis of Glacier Mass Balance in the Southeastern Tibetan Plateau Using TanDEM-X Bi-Static InSAR during 2000–2014

1
School of Surveying and Urban Spatial Information, Henan University of Urban Construction, Pingdingshan 467041, China
2
State Key Laboratory of Geodesy and Earth’s Dynamics, Innovation Academy for Precision Measurement Science and Technology, CAS, Wuhan 430077, China
*
Authors to whom correspondence should be addressed.
Atmosphere 2024, 15(3), 364; https://doi.org/10.3390/atmos15030364
Submission received: 23 January 2024 / Revised: 7 March 2024 / Accepted: 13 March 2024 / Published: 17 March 2024
(This article belongs to the Special Issue Analysis of Global Glacier Mass Balance Changes and Their Impacts)

Abstract

:
In recent decades, glaciers in the southeastern Tibetan Plateau (SETP) have been rapidly melting and showing a large scale of glacier mass loss. Due to the lack of large-scale, high-resolution, and high-precision observations, knowledge on the spatial distribution of the glacier mass balance and the response to climate change is limited in this region. We propose a TanDEM-X bi-static InSAR (Interferometric Synthetic Aperture Radar) algorithm with a non-local mean filter method and difference strategy, to improve the precision of glacier surface elevation change detection. Moreover, we improved the glacier mass balance estimation algorithm with a correction method for multi-source system errors and an uncertainty evaluation method based on error propagation theory to reduce the uncertainty of estimations. We used 13 pairs of TanDEM-X bi-static InSAR images to obtain the glacier mass balance data for the entire SETP. The total area of glaciers monitored was 5821 km2 and the total number of glaciers monitored was 2321; the glacier surface elevation change rate was −0.505 ± 0.005 m/yr, and the glacier mass balance estimation was −454.5 ± 13.1 mm w.eq. during 2000–2014. Additionally, we analyzed the spatial distribution of the glacier mass balance within the SETP using the sub-watershed analysis method. The results showed that the mass loss rate had a decreasing trend from the southeast to the northwest. Furthermore, the temperature change and the glacier mass loss rate showed a positive correlation from the southeast to the northwest in this region. This study greatly advances our understanding of the regularities of glacier dynamics in this region, and can provide scientific support for major national goals such as the rational utilization of surrounding water resources and construction of important transportation projects.

1. Introduction

Glacier mass balance plays a critical role in changes in the surrounding water resources, sea level rise, atmospheric circulation, etc., and is closely related to regional economic development and social stability [1,2,3,4]. The glaciers of the southeastern Tibetan Plateau (SETP) are located in the southeastern part of the Qinghai–Tibet Plateau, known as the “roof of the world”, and are an important water source for the Yarlung Zangbo River, Nujiang River, Ganges River, and Lancangjiang River. In recent decades, with the increase in global temperatures, coupled with the influence of the hot and humid Indian Ocean monsoon, SETP glaciers have been rapidly melting which has resulted in large-scale glacier mass loss [3,4,5,6]. Due to the lack of large-scale, high-resolution, and high-precision observations, the knowledge on the spatial distribution of the glacier mass balance and the response to climate change in this region is limited.
Glacier mass balance in the SETP has been a hotspot of glaciological research. The methods for glacier mass balance monitoring in the published literature include direct field surveys, modeling (e.g., energy balance), indirect estimations (e.g., from length and area surveys), and estimations using satellite altimetry or gravimetry. For the field surveys and modeling method, Yao et al. and Yang et al. used the energy mass balance method to obtain the mass balance of several glaciers, including the 24K glacier and Parlung No. 94 glacier in this region; the results showed that the glaciers were in a state of rapid melting [7,8]. For the indirect estimation method, measuring changes in glacier area and/or length can indicate changes in its mass balance. Pan et al., Liu et al., Wu et al., Ke et al., Fu et al., and Liu et al. monitored the glacier area changes of Hailuogou glacier, Buga Gangri Icefield, and Yalong glacier in the SETP using optical remote sensing data. According to their results, most glaciers have been in retreat in the recent decades [9,10,11,12,13,14]. However, all of the aforementioned methods, either through modeling or observations, can only indirectly indicate the changes in glacier mass balance. For the method of estimations using satellite altimetry, Gardner et al., Neckel et al., and Kääb et al. directly estimated glacier mass balance in the SETP by using ICESat satellite altimetry data from 2003 to 2009, and found that the rate of glacier surface elevation change was −0.30 ± 0.13 m/yr, −0.81 ± 0.32 m/yr, and −1.34 ± 0.29 m/yr, respectively [15,16,17]. For the method of estimations using optical remote sensing, Gardelle et al. estimated the mass balance of glaciers in the SETP using SPOT-5 optical remote sensing stereo pairs from 2000 to 2011, yielding a glacier surface elevation change rate of −0.39 ± 0.16 m/yr [5]. Brun et al. used ASTER optical stereo pairs data from 2000 to 2016 to estimate the glacier mass balance, obtaining a value of −0.73 ± 0.23 m/yr [18]. Recently, Zhao et al. used ASTER stereo image pairs to obtain the mass balance of glaciers in the SETP during 2000–2020, yielding a glacier surface elevation change rate of −0.66 ± 0.02 m/yr [19]. For the method of estimations using DEM products, Ke et al. used the 90 m resolution TanDEM-X DEM product released by the German Aerospace Center (DLR) to obtain glacier mass balance results from 2000 to 2013 for the central and eastern Nyainqentanglha, located in the SETP, and found a glacier mass balance rate of −4.11 ± 1.52 Gt/yr [20]. Although satellite altimetry provides direct measurements about the changes in ice volume, several approximations are necessary to translate these observations into changes in glacier mass balance. Gravimetric surveys, on the other hand, measure changes in mass directly. Thus, after filtering for confounding factors, they can provide direct information on glacier mass balance. Song et al. estimated that the mass loss over the entire SETP was −5.99 ± 2.78 Gt/yr using GRACE satellite gravity data from 2003 to 2009 [3].
The published results show that glaciers in the SETP have been in a state of strong ablation and retreat in recent decades. However, there are large differences between different satellite geodetic observations. Gardner et al., Neckel et al., and Kääb et al. all used ICESat satellite altimetry data, and their glacier mass balance estimates were significantly different [15,16,17]. Although Gardelle et al. [5] and Brun et al. [18] both used optical remote sensing stereo image pairs, their estimated glacier mass balance results also exhibit some discrepancies. The glacier mass balance obtained by Ke et al. [20] using the 90 m resolution TanDEM-X DEM product is also different from the above results. Due to the limitations of the traditional glaciological method and the large spread of estimations obtained by satellite geodetic monitoring technology, the results of the existing glacier mass balance estimations are highly controversial and uncertain.
Satellite InSAR (Interferometric Synthetic Aperture Radar) is one of the most effective earth observation technologies for large-scale topographic mapping, with high-resolution, all-day, and all-weather earth observation capabilities and large imaging area [21]. The German Aerospace Center (DLR) and Astrium GmbH jointly implemented the TanDEM-X science program, and on 21 June 2010, DLR successfully launched the TanDEM-X (TDX) satellite, which operates in a two-satellite constellation mode with the previous TerraSAR-X (TSX) satellite, constituting a bi-static interferometry system [22]. Because the bi-static observation model can effectively eliminate the effects of atmospheric disturbance and temporal incoherence, this technology has great advantages and broad application prospects in the field of high-resolution and high-precision DEM mapping on a global scale [23,24]. The bi-static InSAR technique has successfully obtained glacier mass balance data in the Tien Shan, Nyainqentanglha Mountains, Karakoram, Himalayas, Puruogangri Icefield, western Qilian Mountains, Geladandong Glacier, Patagonia Icefield, and Alpine Mountain Range, demonstrating its effectiveness in monitoring valley glaciers [25,26,27,28,29,30,31,32,33,34,35,36,37].
In this paper, we investigate the mass balance of glaciers in the SETP, using bi-static InSAR detection and inversion methods. We also investigate non-local mean filter and the multi-source systematic error correction methods to enhance the accuracy of our observations. Using TanDEM-X bi-static InSAR data and historical topographic data, we obtained glacier mass balance results for the SETP. The spatial distribution of the glacier mass balance in relation to climatic data was also investigated to reveal the response of glaciers to climate change in this region.

2. Materials and Methods

2.1. Study Area

The geographic location (29°–31° N, 93°–98° E) and glacier distribution of the study area are shown in Figure 1. This region includes the central and eastern part of the Nyainqentanglha Mountains, the western part of the Hengduan Mountains, and the southeastern part of the Himalaya Mountains, with a glacier area of about 5800 km2, accounting for 20% to 25% of the glacier area in China [3,4,5]. Due to the collision and compression of the Eurasian plate and the Indian Ocean plate, the topography and geology in this region are relatively complex, and the elevation difference within individual glaciers can be as high as 4000 m [3,4,5,6]. The glaciers are strongly ablated by the strengthening of the Indian Ocean monsoon in summer, and the mass balance of most glaciers is in deficit, which has important implications for changes in the water resources of the Yarlung Zangbo River, Nujiang River, Ganges River, and Lancangjiang River [3,4,5].

2.2. Data Source

2.2.1. TanDEM-X Bi-Static InSAR Data

In this study, 13 pairs of TanDEM-X bi-static SAR images, acquired from 2011 to 2014 in strip-map mode, were used to generate high-resolution and high-precision TDX DEMs. Of the 13 pairs, one pair of bi-static InSAR images was used for seasonal correction. Six pairs of these bi-static InSAR images were acquired in the descending track and seven pairs in the ascending track (Table 1). The spatial resolution in the range and azimuth direction for all the above bi-static data are about 3.2 and 3.3 m, respectively. These data were able to cover 70.5% of the glacier areas in the southeastern Tibetan Plateau (SETP) (Figure 1).

2.2.2. External Elevation Data

The SRTM (Shuttle Radar Topography Mission) project employed two SAR sensors, one C band sensor (wavelength of 5.6 cm, SRTM-C radar) and another X band sensor (wavelength of 3.1 cm, SRTM-X radar). We used the SRTM-C DEM with 1 arc second spatial resolution (about 30 m) acquired in February 2000 to generate a simulated topographic phase, which was used together with TanDEM-X bi-static InSAR data in a differential interferometric scheme to estimate glacier elevation changes [30]. Since SRTM-X radar only acquired DEMs along discrete swaths 50 km wide, an SRTM-X DEM was used to estimate radar penetration between the C band and the X band in glaciated regions. In addition, since ICESat satellite altimeter data have an accuracy on an order of 0.1 m (1 σ) in flat and smooth regions, ICESat elevation data were used as a height reference to correct the other DEMs in flat off-glacier areas [38].

2.2.3. Meteorological Data

We used the China meteorological forcing dataset (https://poles.tpdc.ac.cn/zh-hans/data/7a35329c-c53f-4267-aa07-e0037d913a21/, accessed on 29 January 2023), which was developed by the Institute of Tibetan Plateau Research, Chinese Academy of Sciences [39], to analyze climate change and its impact on glacier mass balance in this region. This dataset is based on the internationally available Princeton reanalysis data, GLDAS (Global Land Data Assimilation System) data, GEWEX-SRB (Global Energy and Water Cycle Experiment—Surface Radiation Budget) radiation data, and TRMM (Tropical Rainfall Measuring Mission) precipitation data, and integrates the conventional meteorological observation data of the China Meteorological Administration (CMA), which contains seven elements such as near-surface air temperature and surface precipitation rate [39]. Two meteorological elements with a spatial resolution of 0.1°×0.1°, near-surface air temperature, and surface precipitation rate, were utilized to analyze the climate change in the region from 2000 to 2014. In the results of near-surface air temperature, there were large anomalies from 2002 to 2004, and an anomaly removal process was carried out.

2.3. Research Methods

2.3.1. Generation of Glacier Surface Elevation Change

In this paper, 13 pairs of bi-static InSAR images, captured in 2011–2014, and the SRTM DEM developed in 2000 were used to obtain the glacier topography and surface elevation changes in the SETP. The TanDEM-X bi-static InSAR data processing method is basically the same as the traditional InSAR processing techniques, including data focusing, interferogram generation, coherence estimation, filtering, phase unwrapping, phase elevation conversion, etc., which will not be repeated in this paper; please see the literature for details [21,30]. Phase noise is unusually high in this region due to the complex terrain. Thus, to overcome the difficulty of phase unwrapping, different from the traditional InSAR data processing methods, this study utilized two methods: non-local mean filtering and generation of glacier surface elevation changes from differential interferometry (Figure 2).
The non-local mean filter breaks the spatial adjacency constraints usually assumed by conventional filter methods. This filter sets weights based on how similar the area to be filtered is to the surrounding area. The non-local mean filter efficiently reduce noise while preserving structures by performing the weighted averaging of similar pixels [30,40].
The interferometric phase, measured by the TanDEM-X in bi-static mode, is differentiated from the simulated topographic phase, obtained from the STRM-C DEM, to generate residual topographic phase for each TanDEM-X image pair. After the steps of non-local mean filtering and phase unwrapping, the unwrapped residual topographic phase ( Δ φ u n w ) directly generates the glacier surface elevation change ( Δ H ) between the TanDEM-X image acquisition date and the external DEM epoch (Equation (1)) [30].
Δ H = λ 2 π R sin ( θ i ) B Δ φ u n w
where λ is the radar wavelength, B is the perpendicular baseline for the bi-static InSAR data, R is the slant range, and θ i is the incidence angle for each pixel. This method helps solve the problems of unwrapping phase jump and discontinuity dense interferometric fringes when processed by the traditional InSAR method, especially in the region of large elevation changes. Thus, the accuracy and reliability of the data on glacier topography and glacier surface elevation changes are improved.

2.3.2. Correction of Multi-Source Systematic Errors

The glacier surface elevation change data obtained in the previous step still contain systematic errors due to seasonal cycles and different radar bands of the input data.
Since the TanDEM-X bi-static InSAR data used in this study use X-band radar and the external DEM is based on C-band radar data, it is necessary to estimate the penetration difference between X-band and C-band radar. Differences in radar penetration are the largest source of uncertainty in the geodetic estimation of glacier mass balance [5]. Instead of using a set value for this difference, which is a common practice in the literature, in this study, we used a more rigorous approach:
Step 1: We select test sites where the X-band SRTM DEM of the ascending and descending tracks overlap, and the DEM is the fused product of both the ascending and descending SRTM DEM without the influence of the three major radar geometric distortions, such as foreshortening, layover, and shadowing.
Step 2: We examine the C-band and X-band SRTM DEMs for horizontal offsets. The co-registration algorithms of remote sensing images are very mature, but DEM co-registration is still relatively ambiguous. We used the relationship between the DEM elevation difference (dh) and the slope (α) and slope orientation (Ψ) to generate a two-dimensional scatterplot. The horizontal offset value (a), horizontal offset direction (b), and elevation deviation (c) between the two DEMs were calculated based on the shift vector that are presented in the scatter plot, where a, b, and c are the magnitude, direction, and offset of this shift vector, respectively (Equation (2)) [41].
d h tan ( α ) = a cos ( b ψ ) + c
Step 3: The C-band and X-band SRTM DEMs for elevation deviation are reconfirmed in the vertical direction. In addition to the elevation deviation obtained in the previous step, we calculate the difference between the two DEMs and reconfirm the elevation deviation.
Step 4: The radar penetration difference values are calculated and corrected. After the above three steps, we determine whether there is a horizontal offset and an elevation bias between the two DEMs. If there is an offset, we carry out the corresponding offset correction, and if there is no offset, we generated radar penetration differences for each test site by averaging the elevation differences of the glacier regions in the two DEMs. The final radar penetration difference is then averaged by calculating the radar penetration difference for the two test sites.
Unlike glaciers in other regions of the Tibetan Plateau, most of the glaciers in the SETP are spring-accumulating, with the maximum ablation occurring in summer. A total of 6 of the 12 pairs of TanDEM-X bi-static InSAR images were acquired at around the end of August, but the external DEM was acquired in February 2000. Therefore, six pairs of TanDEM-X bi-static InSAR images contain a seasonal signal that is not present in the reference DEM. To correct for this seasonal bias, we selected two pairs of TanDEM-X bi-static InSAR images that cover the same glacier (Parlung No. 4) in winter (18 February 2014) and summer (14 August 2014). The main reason for selecting this particular glacier is that there are field measurements of this glacier, such as glaciometeorological measurements and mass balance stake records. The glacier mass balance obtained from the field measurements can be used to verify the glacial mass balance in this study. After the comparison of the elevation changes derived from these two image pairs, followed by additional verification using field measurement data, satellite altimetry ICESat, and satellite gravity GRACE, a seasonal correction factor was applied to all of the TanDEM-X-derived elevation change data.

2.3.3. Estimation of Glacier Mass Balance

There are several steps in the glacier mass balance estimation process: (1) First, the glacier elevation change data were post-processed. Off-glacier areas were masked using a glacier boundary dataset (Second Glacier Inventory Dataset of China). We also removed SRTM DEM voids, singular values of elevation change, low coherence area, and large slope in the glacier area, to obtain reliable results of glacier surface elevation change. (2) Based on the maximum and minimum values of the SRTM-C DEM, the glacier surface elevation changes were segmented at 100 m elevation intervals, and the number of segments Num was calculated. The number of pixels in each elevation segment was counted as Mi, as well as the mean value of elevation change dh_single(i) and the standard deviation STDEV(i) [5]; pixels with greater than 3 STDEV(i) distance from the mean elevation change dh_single(i) in each of the elevation segments were eliminated. Statistics were then re-calculated for each of the segments. Finally, the overall elevation change of the entire image pair was calculated using an area-weighted method (Equation (3)), i.e., the weight P(i) was determined according to the area or the number of pixels in each segment (Equation (4)).
d h = i = 1 N u m d h i P i
P i = M i i = 1 N u m M i
(3) We combined the glacier surface elevation change (dh) with ice density ( ρ = 900 ± 17 kg m−3) to estimate the glacier mass balance (MB) (Equation (5)) for single pair of bi-static InSAR images or the entire SETP region [29].
M B = ρ d h

2.3.4. Assessment of Uncertainty Based on Error Propagation Theory

Uncertainty assessment is a very important component of glacier mass balance estimation. Overall, the total uncertainty ( σ U n c e r t a i n t y ) can be divided into the following three components: uncertainty in glacier surface elevation changes ( σ d h ), uncertainty due to seasonal bias ( σ S e a s o n ), and uncertainty due to radar penetration differences ( σ P e n e t r a t i o n ) (Equation (6)).
σ U n c e r t a i n t y 2 = σ d h 2 + σ S e a s o n 2 + σ P e n e t r a t i o n 2
The uncertainty assessment method proposed by Bolch et al. was used for the uncertainty assessment of the above three components ( σ X ) (Equations (7) and (8)) [42].
σ X = m i 2 + S T D V i 2 N e f f i
N e f f i = N i P S 2 D
where mi is the mean, STDEVi is the standard deviation, N e f f i is the number of effective pixels, Ni is the total number of pixels, PS is the pixel resolution, and D is the distance of spatial correlation, which Bolch et al. considered to be about 1/20 of the pixel resolution [42].

3. Results

3.1. Results of Glacier Surface Elevation Change

In the bi-static InSAR data processing, the non-local mean filtering is an important method that facilitates phase noise suppression and high terrain texture detail retention. Figure 3a,b show glacier DEMs obtained by the conventional Goldstein filter and non-local mean filter, respectively. In Figure 3a, there is more speckle noise in both glacial and non-glacial areas, whereas in Figure 3b, there is almost no such speckle noise. In addition, the terrain in Figure 3b can still maintain clear texture details at the end of the glacier, the channel features can especially be clearly displayed. The comparison of two DEMs shows that the non-local mean filter has the advantages of phase noise suppression and terrain texture detail preservation.
We directly calculated glacier surface elevation changes using a differential phase. After obtaining the glacier surface elevation change results of each pair of bi-static InSAR images, the overlapping bi-static InSAR data were fused, for example, the Jiali_1 area, the Jiali_2 area, and the Jiali_3 area were merged into the Jiali area, etc., to reasonably estimate the overall glacier mass balance results in this region (Figure 4, Figure 5 and Figure 6). In the process of merging, we used ArcGIS software 10.2 to mosaic the overlapping areas.
Almost all glaciers in the SETP were in a state of melting from 2000 to 2014, and the maximum change in glacier surface elevation was −120 m. At the top of some glaciers, there were also small areas of accumulation, with a maximum accumulation of 20 m. Additionally, we select a glacier (GLIMS_ID: G094528E30583N) (blue line in Figure 4b) to profile the glacier surface elevation change (Figure 7). We found that most of the glacier surface elevation changes were between 0 and −30 m for this glacier.

3.2. Correction of Radar Penetration Differences between X-Band and C-Band

We selected two test sites within the study area where the X-band SRTM DEM of the ascending and descending tracks overlap to inspect the bias due to the different penetration depths of X and C band radar. According to the results of our co-registration exercise, the X-band and C-band SRTM DEMs had almost no offset in the horizontal direction (Figure 8). Additionally, there was almost no offset in the vertical direction.
We calculated the mean values of the X-band and C-band SRTM DEM differences for the glaciated areas within our two test sites, which were 2.81 m and 1.78 m, respectively. Therefore, by calculating the average value of the radar penetration difference for the two test sites, the value of the radar penetration difference in the SETP was −2.295 m. The main reason for the radar penetration error correction is that the TanDEM-X bi-static InSAR data in this paper are X-band data, while the external DEM data are C-band data. There is a large difference in the penetration depth of ice and snow between these two bands, which has become a large source of uncertainty in estimating glacier mass balance using satellite geodetic methods. Therefore, it is necessary to use this rigorously calculated radar penetration difference value to correct the glacier surface elevation change results. This correction was applied to our regional average glacier elevation changes (Table 2).

3.3. Correction of Seasonal Systematic Error

For a more precise comparison, we selected the seasonal glacier surface elevation changes in this region from 4790 m to 4810 m above sea level and calculated the mean value of glacier surface elevation change in this region to be −1.908 m (Figure 9). The glacier mass balance was estimated using an ice density of 900 ± 17 kg m−3, which resulted in −1717.2 mm w.eq. Yang et al. conducted field measurements at 4800 m above sea level on the Parlung No. 4 glacier. According to these field measurements, the surface mass balance was −3900 mm w.eq. between 25 May 2009 and 14 August 2009 [6]. The main reason for the discrepancy between these two results is that the bi-static InSAR results are the sum of spring accumulation and summer ablation, whereas the field measurements only captured summer ablation. To further validate the accuracy of the seasonal correction, we combined our results with satellite altimetry ICESat and satellite gravity GARCE data from Xiang et al. [43]. These results indicate the strong seasonality of the overall annual mass balance signal of glaciers in the SETP between 2003 and 2009, with 2000 mm w.eq. winter accumulation (February–May) and 4000 mm w.eq. summer ablation (May–September). These independent measurements are consistent with the seasonal glacier mass balance estimated by the TanDEM-X bi-static InSAR, so we adopted 1.908 m as the seasonal systematic error correction value. The main reason for the seasonal error correction is that most glaciers in the SETP region are spring-accumulating glaciers, and the maximum ablation occurs in summer, with seasonal fluctuations in glacier mass balance estimation. Therefore, it is necessary to correct the glacier surface elevation results of the above six pairs of bi-static InSAR images with this seasonal error correction value, and corrected our elevation change results that were obtained at the end of the melt season accordingly (Table 3).

3.4. Glacier Mass Balance and Uncertainty

We used the uncertainty assessment method in Section 2.3.4 to calculate the uncertainty of the glacier surface elevation change, the uncertainty of the seasonal correction, and the uncertainty of the radar penetration difference correction for the six regions (Table 4).
Altogether the 12 image pair were merged to produce results for six areas: Jiali, Bianba, Luolong, Bomi, Basu, and Chayu. Based on the rate of glacier surface elevation change and the weight of the glacier area covered by bi-static InSAR data in these six areas, the overall glacier surface elevation changes in the entire SETP was calculated, which was −0.505 m/yr. According to an assumed overall ice density of 900 ± 17 kg m−3 adopted by Gardelle et al. [5], the glacier mass balance in the entire SETP from 2000 to 2014 was −454.5 mm w.eq.
We combined glacier mass balance with the uncertainty assessment for the six regions based on glacier area weights to provide the glacier mass balance covering 70.5% of the entire SETP region (Table 5).

3.5. Spatial Distribution Characteristics of Glacier Mass Balance

High temperatures due to the influence of the Indian Ocean monsoon lead to strong glacier mass loss in this region. The influence of the Indian Ocean monsoon gradually becomes weaker at the southeast edge of the SETP towards the continental interior, and thus the strength of glacier mass loss in the SETP also becomes weaker. The spatial distribution of glacier mass loss in the southeastern part of the SETP was shown to be in strong melting state, while a slightly melting state was found for the northwestern part of the SETP.
Using the sub-watershed analysis method, we divided the glacier mass balance results into 17 sub-watersheds according to the level-5 watershed data released by the Second Glacier Inventory Dataset of China. We then calculated glacier surface elevation change rates for each of the sub-watersheds, and analyzed the spatial distribution of the watershed-specific data (Table 6, Figure 10).
The 17 sub-watersheds in this paper were categorized into two main groups, namely the 5N Nujiang River watershed and the 5O Ganges River watershed. The Unknown region was not assigned to these sub-watersheds, though it only contains a very small glacierized area of 14.765 km2. Hence, any changes in glacier mass balance will exert a limited effect on the watershed hydrology.
Compared with glaciers in other regions of the Tibetan Plateau, glaciers of the SETP are melting more rapidly, mainly due to the influence of the Indian Ocean monsoon. In addition, from southeast to northwest, the ablation rate of the glacier surface elevation changes in the SETP presented a decreasing trend.

4. Discussion

The study area is mainly affected by the Indian Ocean monsoon, and most of the glaciers belong to marine-type glaciers. Compared with continental-type glaciers, these glaciers are characterized by high accumulation and high melting, and are very sensitive to climate change. In recent decades, due to global warming, the glaciers in this region have rapidly retreated. However, the precise interaction of the glaciers and the changing monsoon patterns is still unclear.
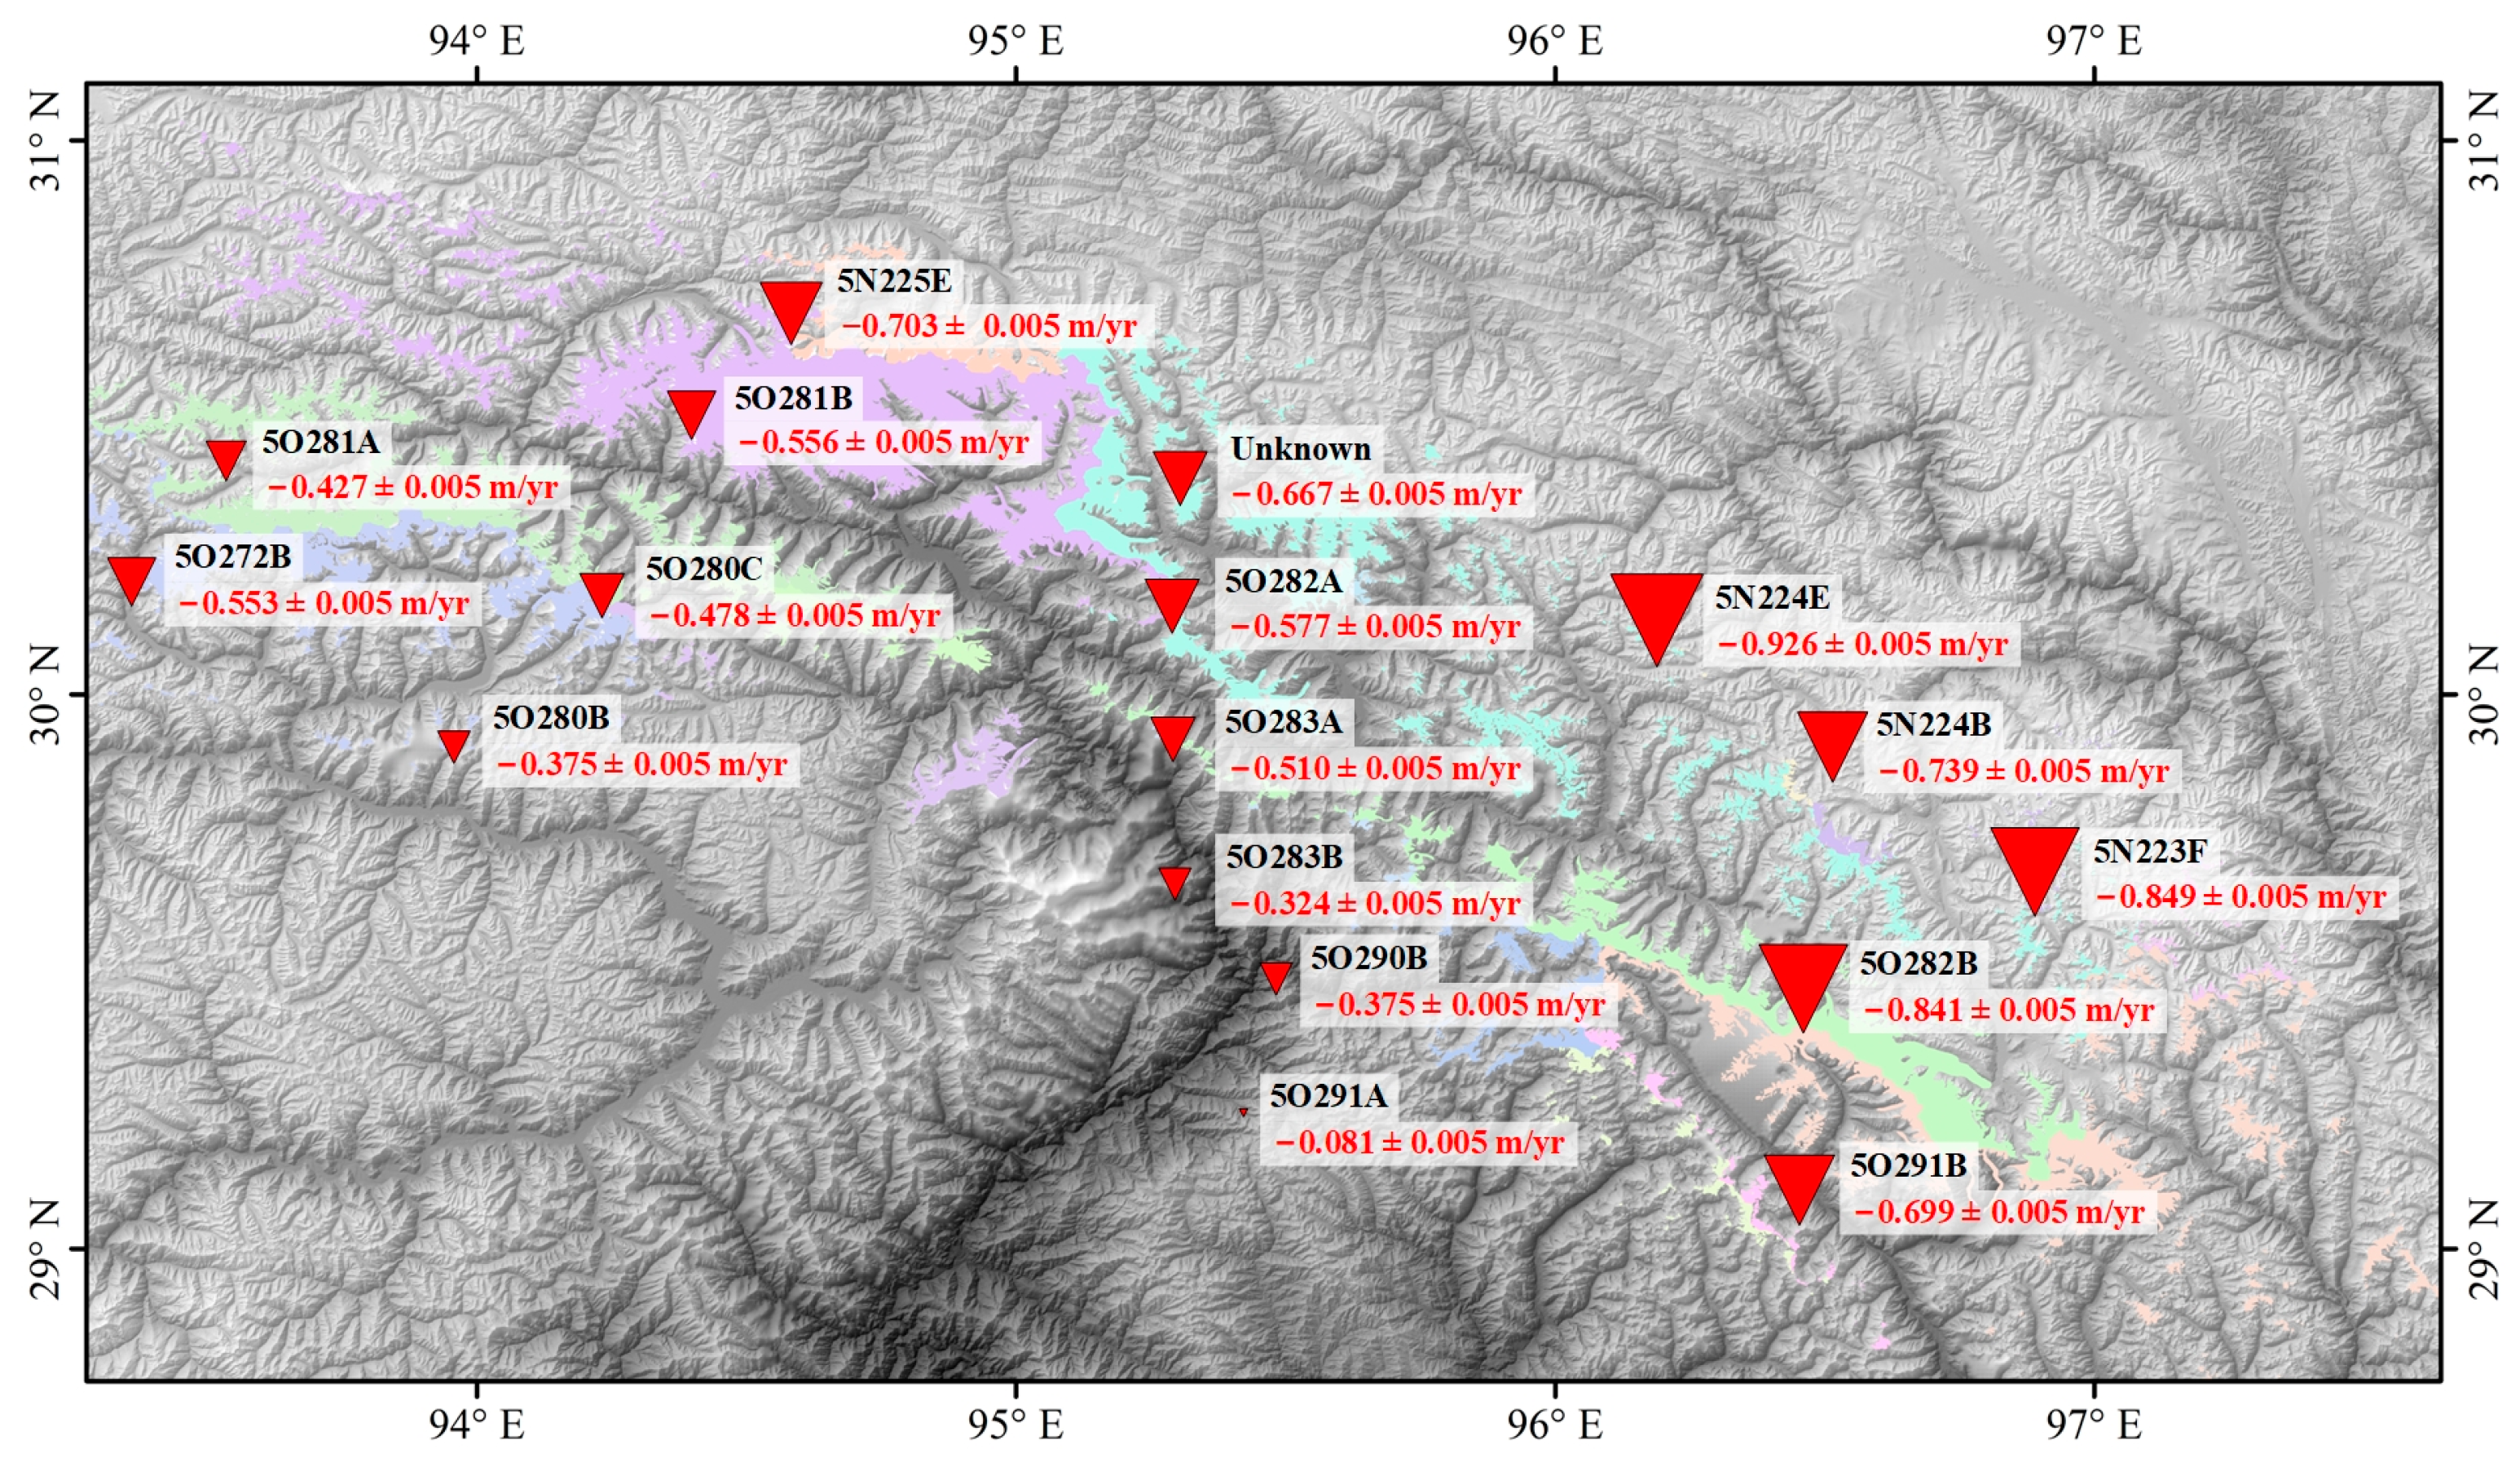
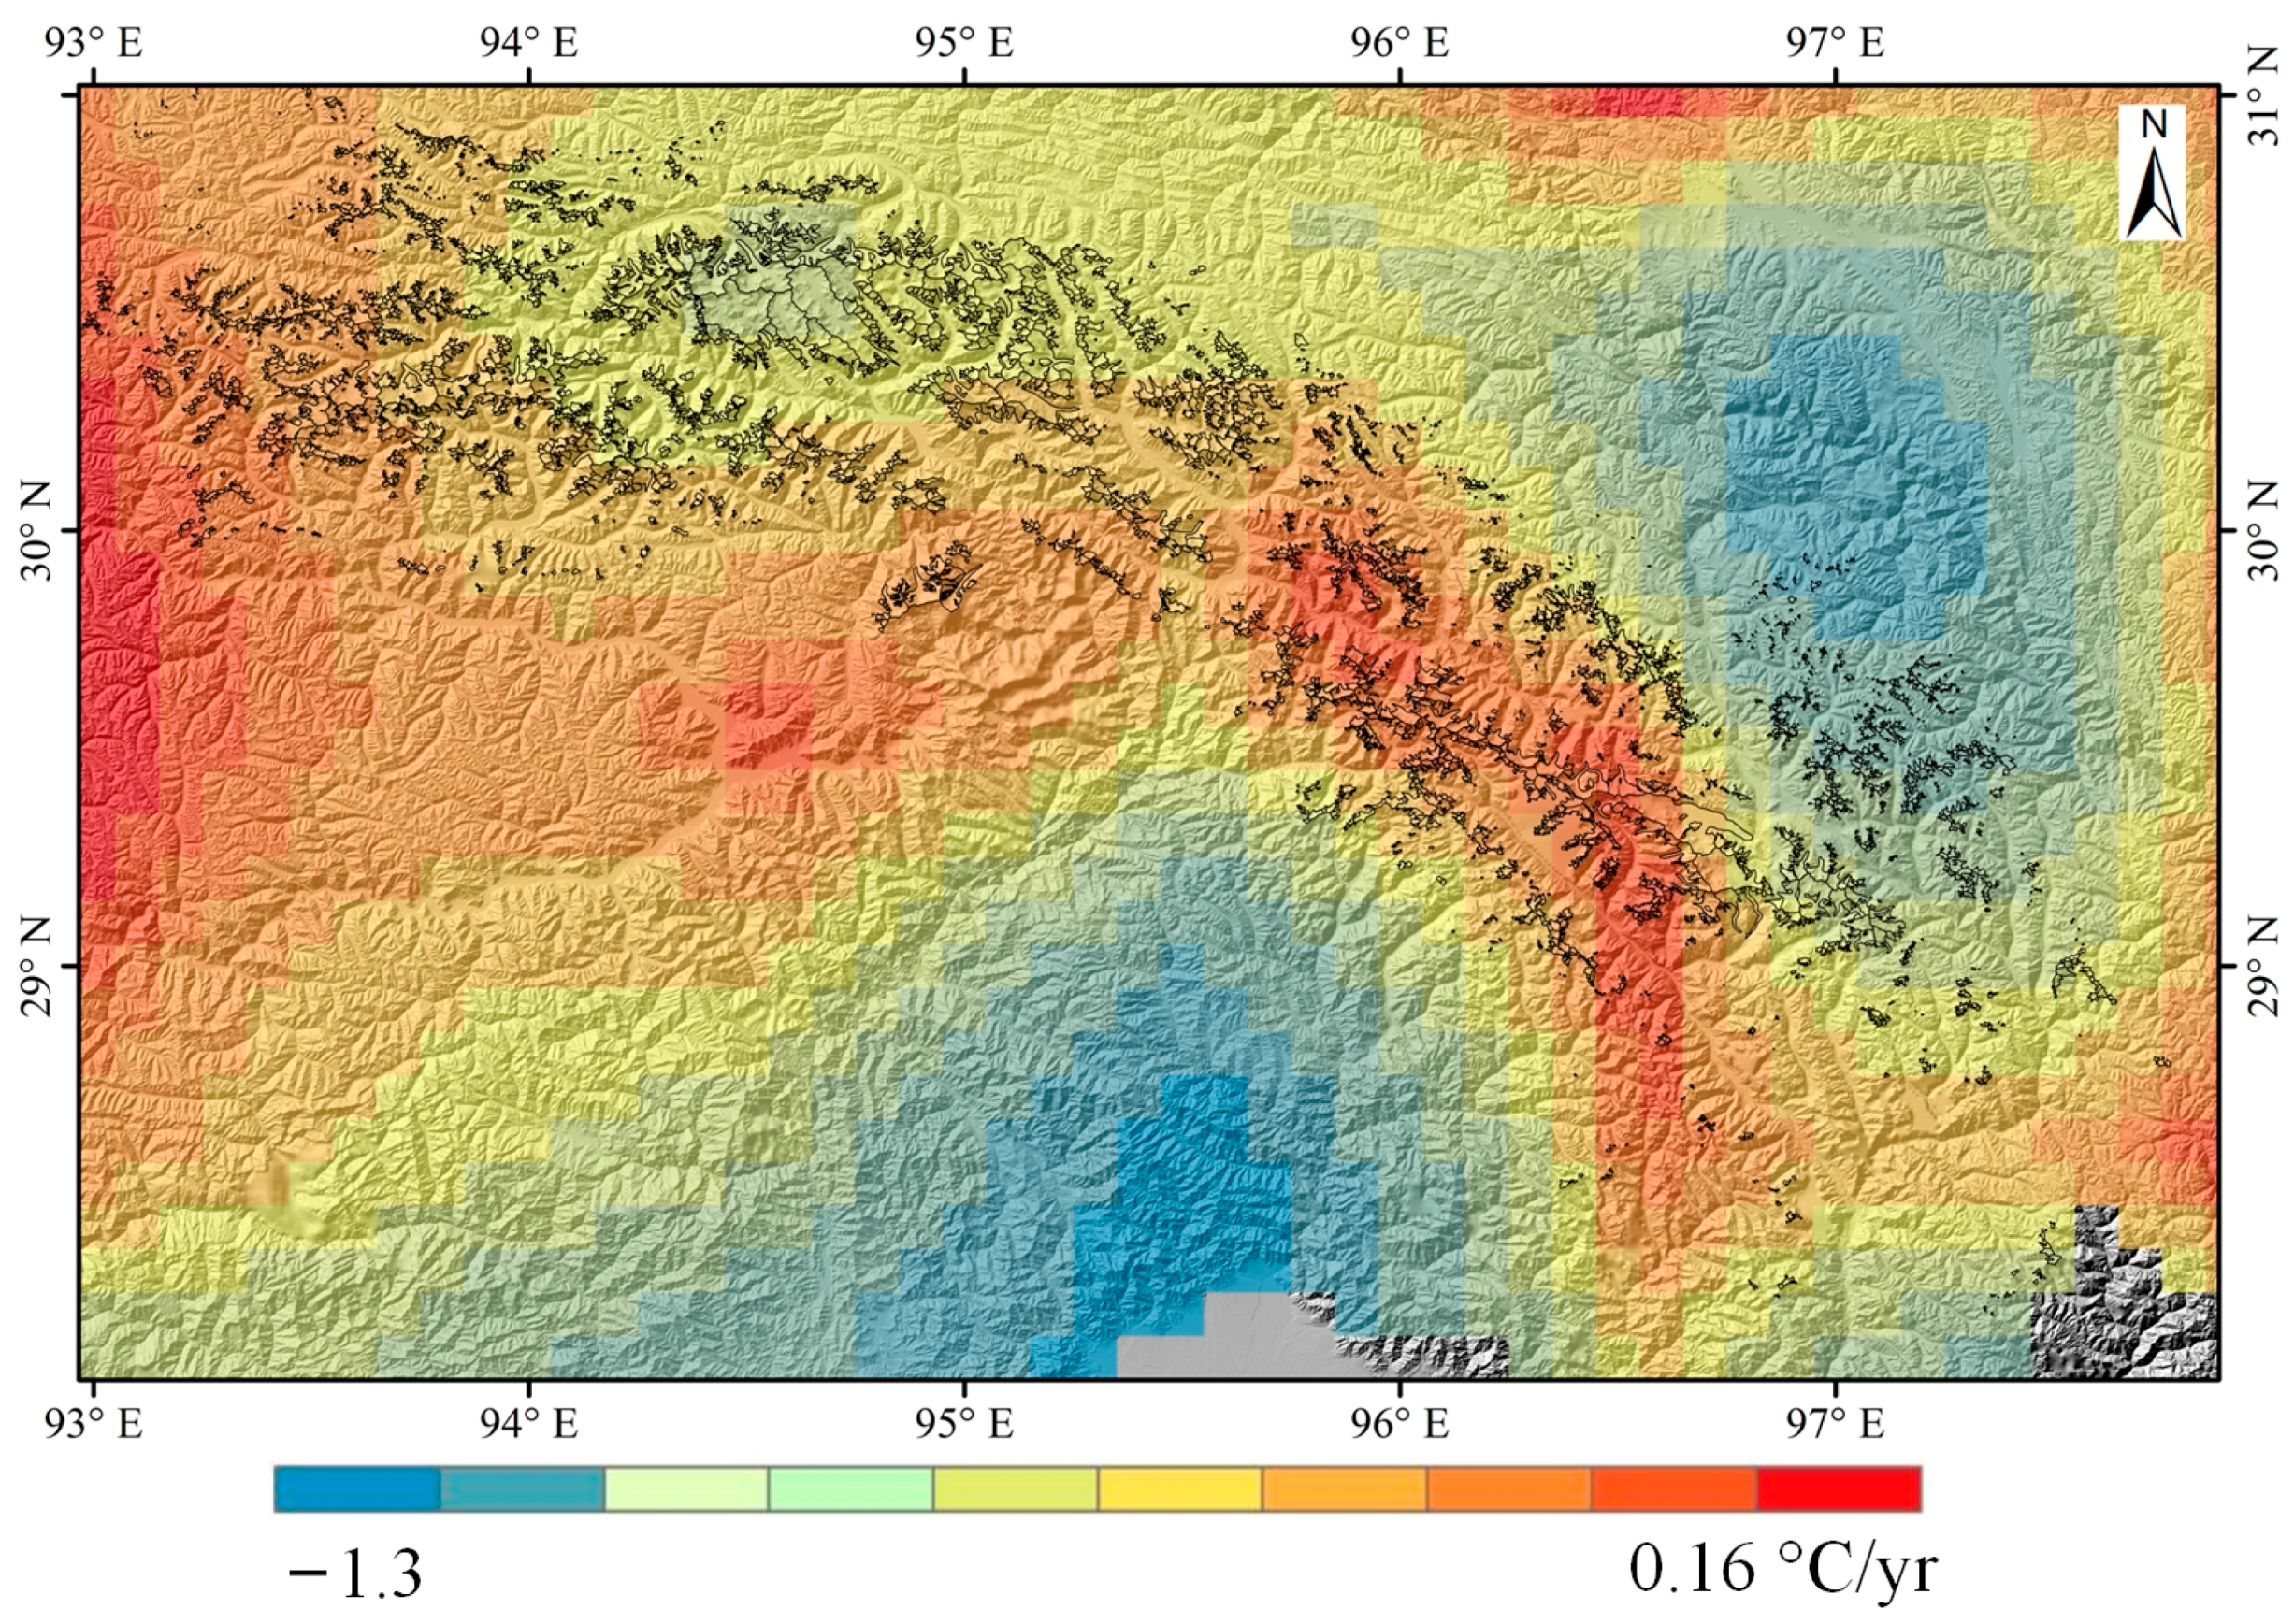
Figure 11 shows the spatial distribution of near-surface temperature changes in the SETP from 2000 to 2014; the annual rate of temperature change in the southeastern part of the SETP showed a strong increasing trend, while the northwestern part of the SETP had a smaller increasing trend. Some lower-lying regions even exhibited a cooling trend. This pattern is consistent with the spatial distribution of the glacier mass loss rate in the study area which increased towards the SE. In addition, we selected three watersheds, 5O282B, 5O282A, and 5O281B, in the southeast–northwest direction with glacier surface elevation change rates of −0.841 ± 0.005 m/yr, −0.577 ± 0.005 m/yr, and −0.556 ± 0.005 m/yr, respectively, for quantitative comparison. Through the above comparison and analysis, we found that there was a positive correlation between temperature change and glacier mass loss rate in the SETP region.
The spatial distribution of surface precipitation changes shows that precipitation in the southeastern part of the SETP was increasing, while precipitation in the northwestern part of SETP was decreasing (Figure 12). This is contrary to the observed spatial distribution of glacier mass balance and suggests that the key climatic factor behind glacier retreat in this region is the changing temperature.
According to the spatial distribution of temperature and precipitation changes, glaciers of the SETP are melting more rapidly as a seasonal trend, i.e., strong summer ablation due to the monsoon influence, which, in normal (i.e., equilibrium) circumstances, is counterbalanced by heavy accumulation in the winter. This seasonal equilibrium is broken and glaciers lose mass all over the region. This appears to be more pronounced in the SE, which means that ablation was increasing and/or accumulation was decreasing more here compared to other regions of the SETP.
Kääb et al., Neckel et al., and Gardner et al. estimated the glacier mass balance in the SETP using satellite altimetry ICESat; their estimated annual glacier elevation change rates were −1.34 ± 0.29 m/yr, −0.81 ± 0.32 m/yr, and −0.30 ± 0.13 m/yr, respectively [15,16,17] (Table 7). The estimate in this paper was −0.505 ± 0.005 m/yr, which is consistent with the results of Neckel et al. [16] and Gardner et al. [17] Some of this discrepancy might be attributed to the different observational periods, i.e., ICESat covers the period between 2003 and 2009, while our results were obtained for 2000–2014. We also used a different methodology from these authors. Although the accuracy of satellite altimetry is high (±0.2 m in flat areas), these measurements are point-like, with a low resolution for a few or single glaciers.
Gardelle et al. estimated a mass balance of −0.39 ± 0.16 m/yr for the glaciers in the SETP between 2000 and 2011 using SPOT-5 optical stereo pairs data and a C-band SRTM DEM [5]. This estimation aligns with our calculations fairly well, though a slight discrepancy still persists. We propose that the different spatial coverage of the Gardelle et al. [5], which only covered about 1/3 of the SETP, could explain this. Brun et al. estimated an average mass balance of −0.73 ± 0.23 m/yr for the SETP using ASTER optical stereo image pair data from 2000 and 2016 [18]. Recently, Zhao et al. also used ASTER stereo image pairs and satellite altimetry data to obtain a similar estimation: −0.66 ± 0.02 m/yr [19]. ASTER optical data are affected by “light saturation”, which prevents us from obtaining glacier elevation change data within the accumulation area, which could contribute to the higher mass loss estimations of these studies.
Neckel et al. used TanDEM-X bi-static InSAR and a C-band SRTM DEM to obtain the surface elevation changes from 2000 to 2014 for five glaciers in Unknown I, Zepu, Unknown II, Maguolong, and Guanxing in the SETP, which were −0.50 ± 0.57 m/yr, −0.58 ± 0.57 m/yr, −0.67 ± 0.57 m/yr, −1.19 ± 0.57 m/yr, and −1.40 ± 0.57 m/yr, respectively [44]. The results for the first three glaciers are similar to our regional average mass balance estimations, while the last two results are relatively large. However, Neckel et al. provided data for individual glacier which might deviate significantly from the regional average. Wu et al. and Li et al. also utilized bi-static InSAR data to obtain glacier mass balance results for certain sub-regions within the SETP such as the Kangri Karpo Range and the Nyainqentanglha [27,35,36,45].

5. Conclusions

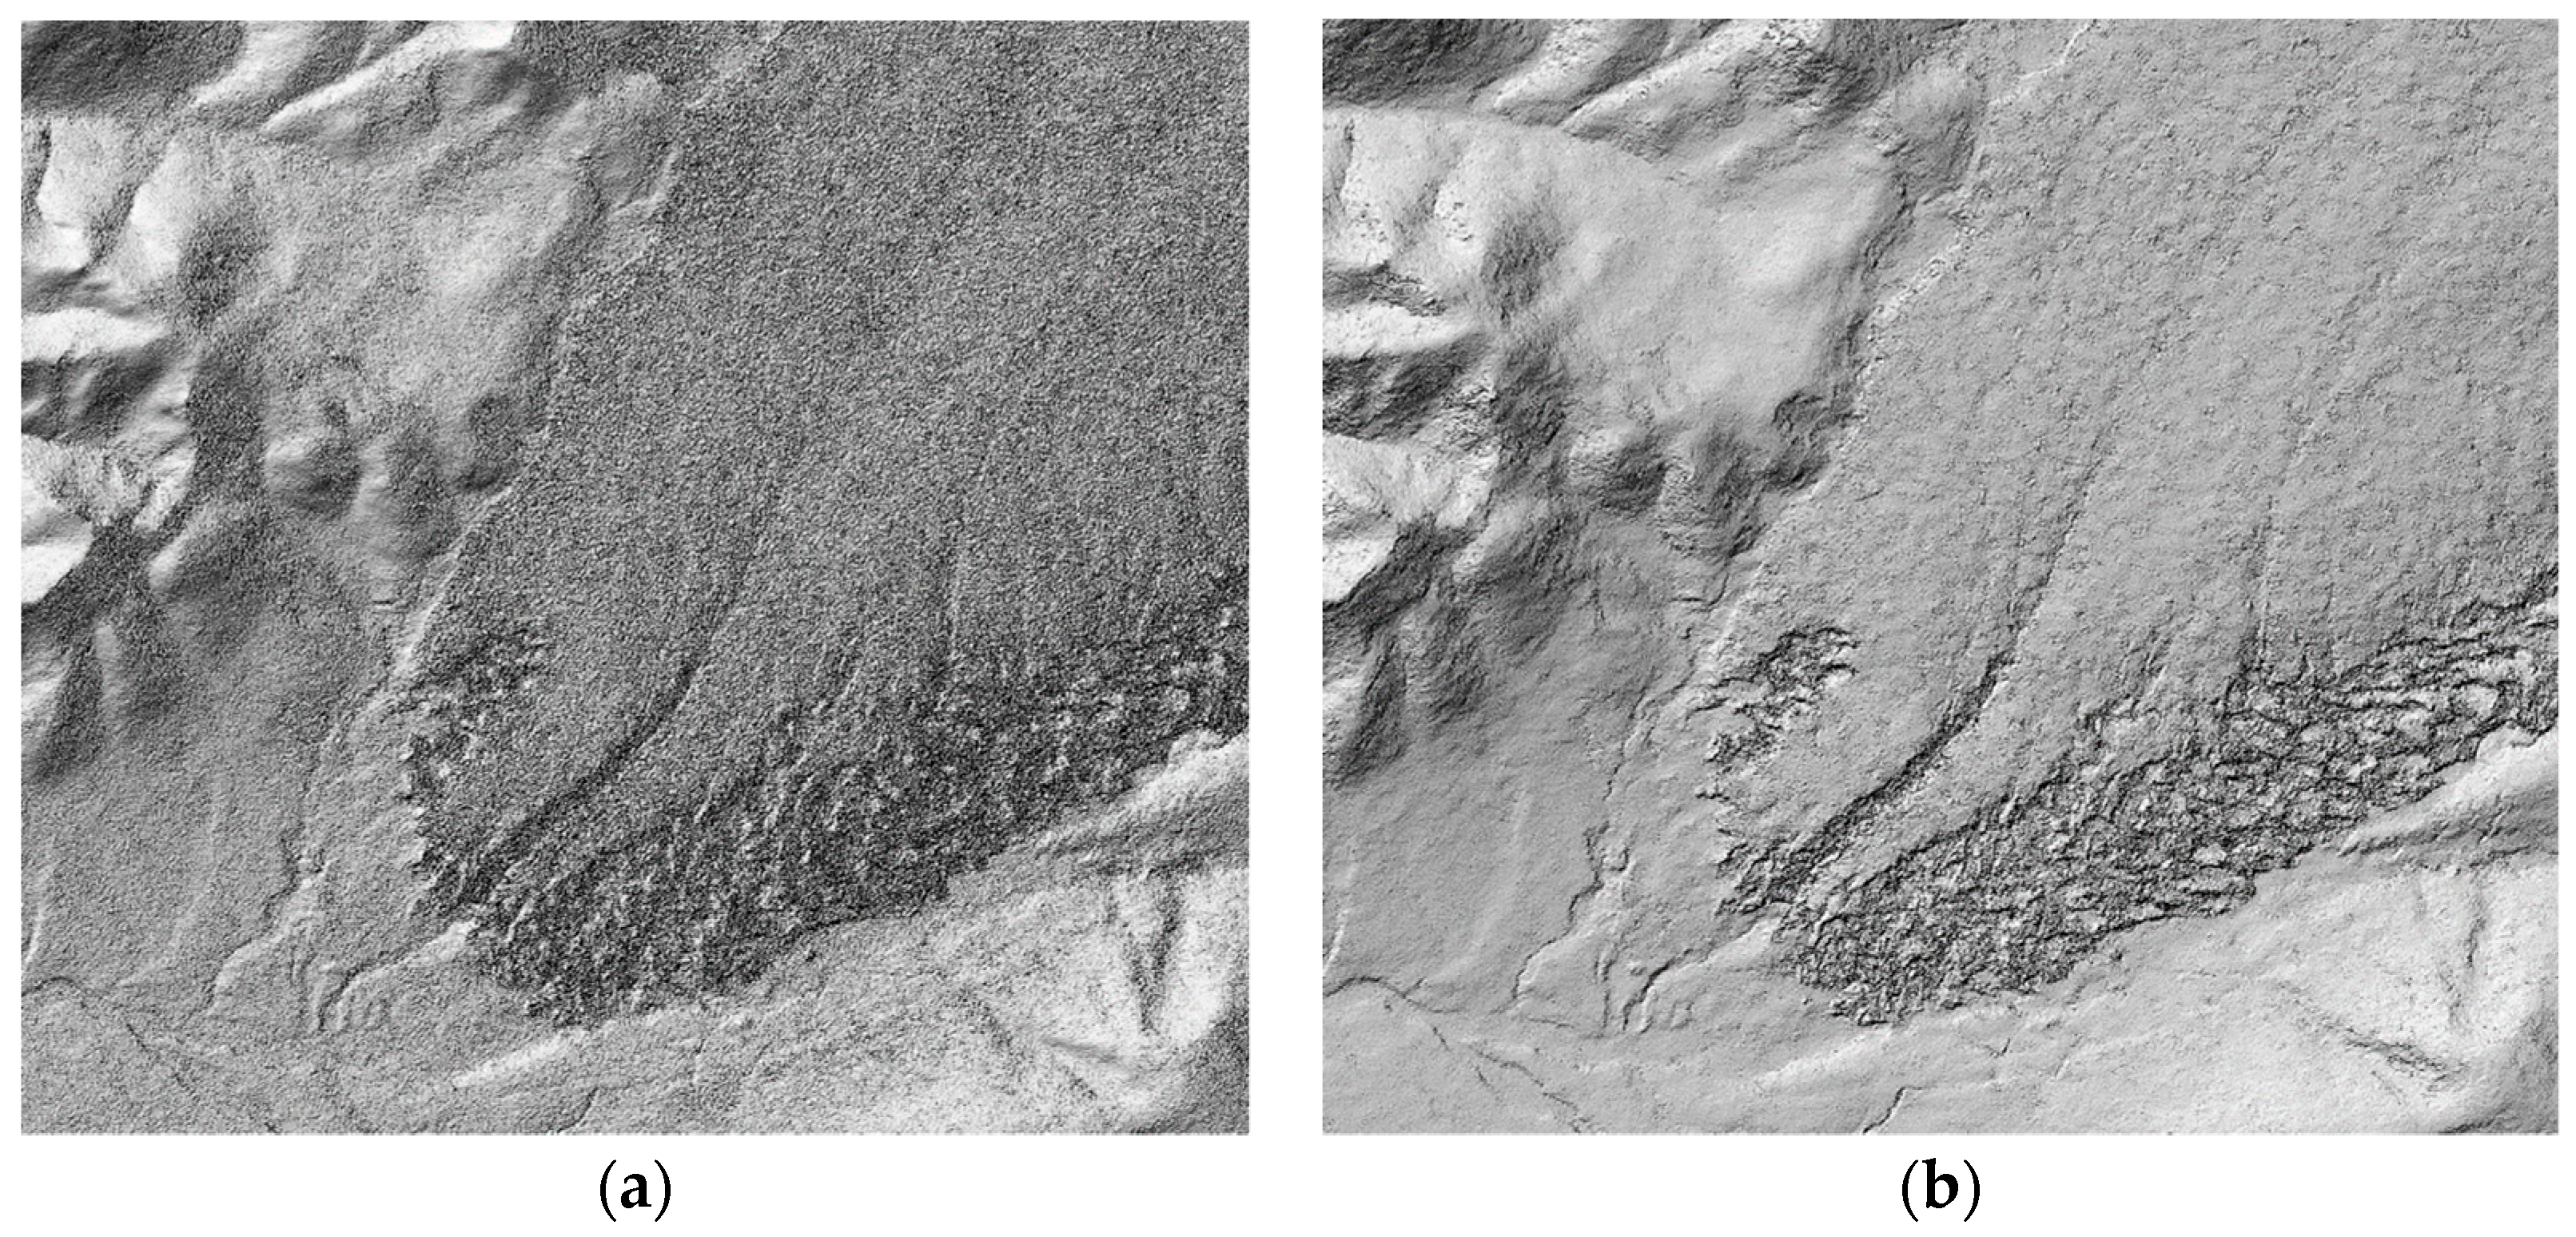
In this paper, a TanDEM-X bi-static InSAR algorithm was proposed to calculate glacier surface elevation changes, and we used the algorithm of glacier mass balance estimation to obtain the glacier mass loss in the SETP. We added the non-local mean filtering method and phase difference strategy to the TanDEM-X bi-static InSAR algorithm to facilitate the suppression of phase noise and to preserve texture details, and to solve the problems of unwrapping phase jump and discontinuity, and the presence of dense interferometric fringes which all hinder the traditional InSAR method. The approach followed by this study improves the accuracy and reliability of glacier topography and glacier surface elevation change data. The correction of systematic errors such as seasonality and radar penetration differences were carried out, which improved the accuracy of the glacier mass balance estimation. In addition, the uncertainty of the glacier surface elevation change, the uncertainty of the seasonal systematic error, and the uncertainty of the radar penetration difference error were evaluated.
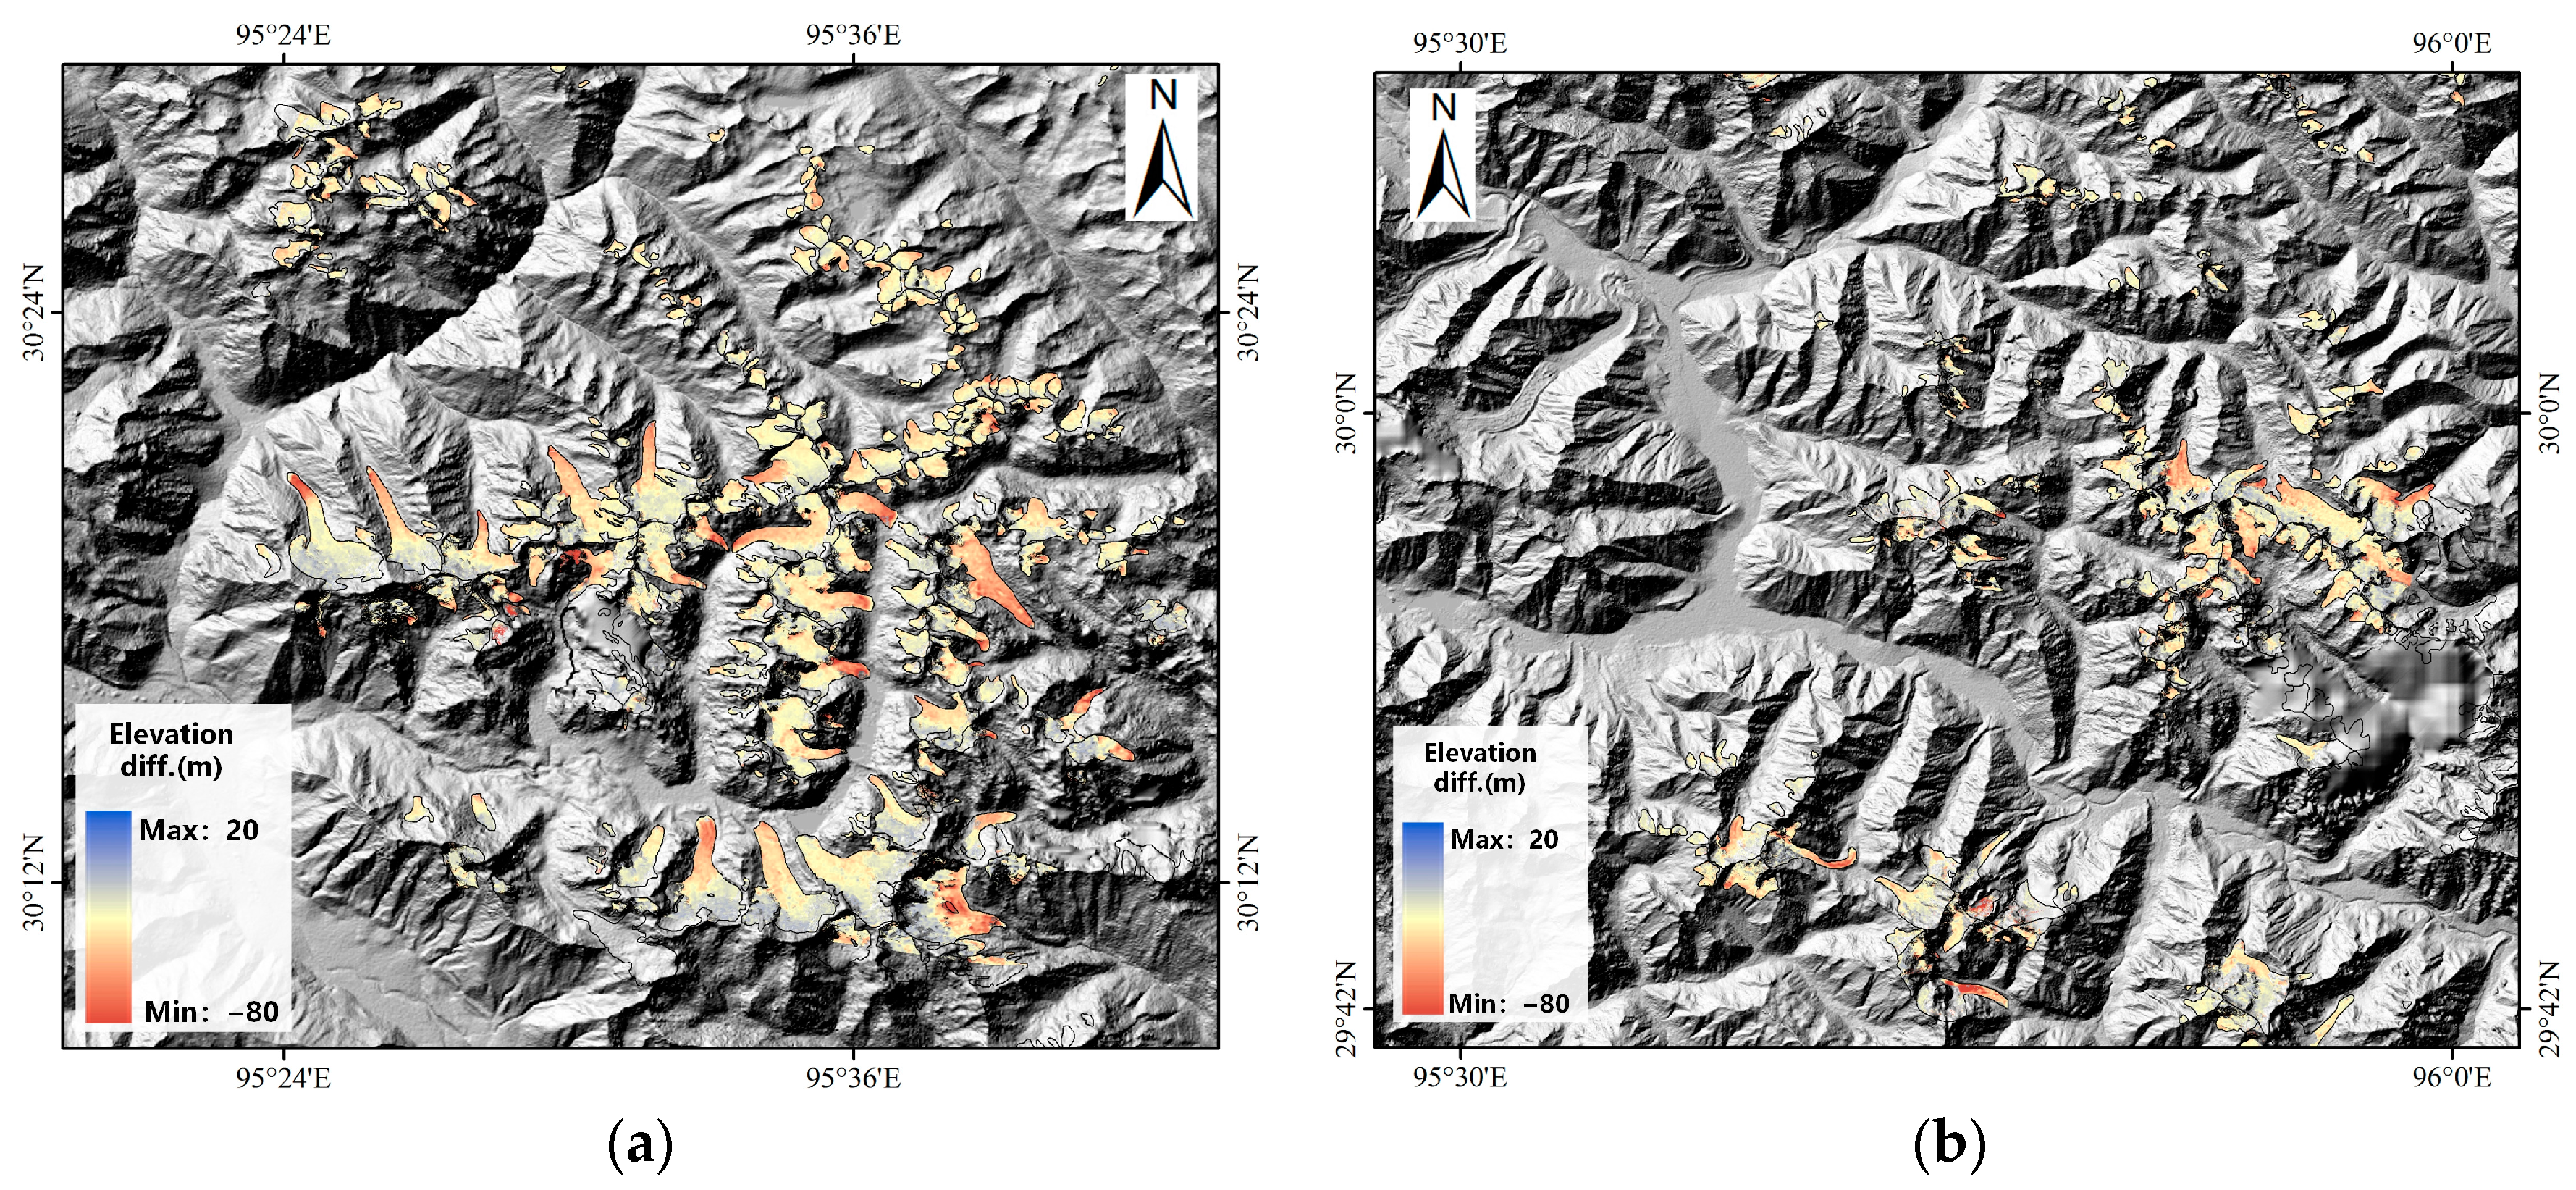
We used 13 pairs of TanDEM-X bi-static InSAR images to estimate the glacier surface elevation change for the entire SETP, where two pairs of bi-static InSAR images covering the Parlung No. 4 glacier were used for seasonal systematic error correction, and the X-band and C-band SRTM DEMs covering the study area were used for radar penetration difference systematic error correction; the values were −2.295 m and 1.908 m, respectively. A regional average glacier surface elevation change of −0.505 ± 0.005 m/yr was obtained. Based on this, the regional average net mass balance was −454.5 ± 13.1 mm w.eq. during the observational period. Compared with published results obtained by satellite altimetry, optical stereo image pairing, and bi-static InSAR, the glacier mass balance estimation reported in this paper is moderate. We also analyzed the spatial distribution of the glacier mass balance within the SETP using the sub-watershed analysis method. The results showed that the mass loss rate of glaciers in the SETP was larger in the southeast than in the northwest. We used temperature and precipitation data to analyze the climatic factors affecting the glacier mass balance. The results showed that the spatial distribution of glacier mass balance was consistent with the spatial distribution of temperature, i.e., increased temperature in the southeastern part of the study area, and a slight decrease in temperature in the northwestern part of the study area. The results from this study contribute to our understanding of glacier dynamics in this region and can also provide scientific support for major national goals such as the rational utilization of water resources and construction of important infrastructure projects.

Author Contributions

Conceptualization, Y.S. and L.J.; methodology, Y.S. and L.J.; software, N.G. and S.G.; validation, Y.S., L.J. and J.L.; formal analysis, Y.S. and L.J.; investigation, Y.S.; resources, S.G.; data curation, N.G. and S.G.; writing—original draft preparation, Y.S.; writing—review and editing, Y.S. and L.J.; visualization, N.G. and S.G.; supervision, S.G.; project administration, S.G.; funding acquisition, N.G. and J.L. All authors have read and agreed to the published version of the manuscript.

Funding

This work was supported in part by the Henan Science and Technology Research Fund Program under Grant 222102320414, in part by the Research and Development and Application of Key Technologies of Urban Flood Control and Emergency Management Based on Beidou under Grant 221111321600, and in part by Research Funds for the Henan University of Urban Construction under Grants 990/R-X2020014 and 990/K-H2023099.

Institutional Review Board Statement

Not applicable.

Informed Consent Statement

Not applicable.

Data Availability Statement

The TanDEM-X bi-static InSAR data presented in this study are openly available from the German Aerospace Agency (DLR) at https://eoweb.dlr.de/egp/ (accessed on 11 January 2023). The SRTM DEM data presented in this study are openly available from the National Aeronautics and Space Administration (NASA) at https://search.earthdata.nasa.gov/search (accessed on 13 January 2023). The ICESat-1/GLA14 data presented in this study are openly available from the National Snow & Ice Data Center (NSIDC) at https://nsidc.org/data/glah14/versions/34/. (accessed on 17 January 2023) The Meteorological Data presented in this study are openly available from the Big Earth Data Platform for Three Poles at https://poles.tpdc.ac.cn/zh-hans/data/7a35329c-c53f-4267-aa07-e0037d913a21/ (accessed on 29 January 2023).

Acknowledgments

The authors would like to thank the German Aerospace Agency (DLR) for providing the TanDEM-X bi-static InSAR data and the Big Earth Data Platform for Three Poles for providing the meteorological data. We would also like to thank the anonymous reviewers for their valuable comments and suggestions.

Conflicts of Interest

The authors declare no conflicts of interest.

References

  1. Yao, T.D.; Thompson, L.; Yang, W.; Yu, W.S.; Gao, Y.; Guo, X.J.; Yang, X.X.; Duan, K.Q.; Zhao, H.B.; Xu, B.Q.; et al. Different glacier status with atmospheric circulations in Tibetan Plateau and surroundings. Nat. Clim. Chang. 2012, 2, 663–667. [Google Scholar] [CrossRef]
  2. Zhang, Z.M.; Jiang, L.M.; Sun, Y.F.; Sirguey, P.; Dumont, M.; Liu, L.; Gao, N.; Gao, S.F. Reconstruction of annual glacier mass balance from remote sensing-derived average glacier-wide albedo. Remote Sens. 2023, 15, 31. [Google Scholar] [CrossRef]
  3. Song, C.Q.; Ke, L.H.; Huang, B.; Richards, K.S. Can mountain glacier melting explains the GRACE-observed mass loss in the southeast Tibetan Plateau: From a climate perspective? Glob. Planet. Chang. 2015, 124, 1–9. [Google Scholar] [CrossRef]
  4. Vishwakarma, B.D.; Ramsankaran, R.; Azam, M.F.; Azam, M.F.; Bolch, T.; Mandal, A.; Srivastava, S.; Kumar, P.; Sahu, R.; Navinkumar, P.J.; et al. Challenges in understanding the variability of the cryosphere in the Himalaya and its impact on regional water resources. Front. Water 2022, 4, 909246. [Google Scholar] [CrossRef]
  5. Gardelle, J.; Berthier, E.; Arnaud, Y.; Kääb, A. Region-wide glacier mass balances over the Pamir-Karakoram-Himalaya during 1999–2011. Cryosphere 2013, 7, 1885–1886. [Google Scholar] [CrossRef]
  6. Yang, W.; Yao, T.D.; Guo, X.F.; Zhu, M.L.; Li, S.H.; Kattel, D.B. Mass balance of a maritime glacier on the southeast Tibetan Plateau and its climatic sensitivity. J. Geophys. Res. Atmos. 2013, 118, 9579–9594. [Google Scholar] [CrossRef]
  7. Yao, T.D.; Li, Z.G.; Yang, W.; Guo, X.J.; Zhu, L.P.; Kang, S.C.; Wu, Y.H.; Yu, S. Glacial distribution and mass balance in the Yarlung Zangbo River and its influence on lakes. Chin. Sci. Bull. 2010, 55, 2072–2078. [Google Scholar] [CrossRef]
  8. Yang, W.; Guo, X.F.; Yao, T.D.; Zhu, M.L.; Wang, Y.J. Recent accelerating mass loss of southeast Tibetan glaciers and the relationship with changes in macroscale atmospheric circulations. Clim. Dyn. 2016, 47, 805–815. [Google Scholar] [CrossRef]
  9. Pan, B.T.; Zhang, G.L.; Wang, J.; Cao, B.; Geng, H.P.; Wang, J.; Zhang, C.; Ji, Y.P. Glacier changes from 1966–2009 in the Gongga Mountains, on the south-eastern margin of the Qinghai-Tibetan Plateau and their climatic forcing. Cryosphere 2012, 6, 1087–1101. [Google Scholar] [CrossRef]
  10. Liu, Q.; Guo, W.Q.; Nie, Y.; Liu, S.Y.; Xu, J.L. Recent glacier and glacial lake changes and their interactions in the Bugyai Kangri, southeast Tibet. Ann. Glaciol. 2016, 57, 61–69. [Google Scholar] [CrossRef]
  11. Wu, K.P.; Liu, S.Y.; Jiang, Z.L.; Xu, J.L.; Wei, J.F.; Guo, W.Q. Recent glacier mass balance and area changes in the Kangri Karpo Mountains from DEMs and glacier inventories. Cryosphere 2018, 12, 103–121. [Google Scholar] [CrossRef]
  12. Ke, C.Q.; Lee, H.; Han, Y.F. Glacier Change in the Yigong Zangbo Basin, Tibetan Plateau, China. Korean J. Remote Sens. 2019, 35, 491–502. [Google Scholar]
  13. Fu, X.Y.; Zhou, J.M. Long-Term Deceleration of Glaciers in the Eastern Nyainqentanglha Mountains, Southeastern Tibetan Plateau, Revealed from Landsat Images. Water 2019, 11, 2387. [Google Scholar] [CrossRef]
  14. Liu, J.; Yao, X.J.; Liu, S.Y.; Guo, W.Q.; Xu, J.L. Glacial changes in the Gangdisê Mountains from 1970 to 2016. J. Geogr. Sci. 2020, 30, 131–144. [Google Scholar] [CrossRef]
  15. Gardner, A.S.; Moholdt, G.; Cogley, J.G.; Wouters, B.; Arendt, A.A.; Wahr, J.; Berthier, E.; Hock, R.; Pfeffer, W.T.; Kaser, G.; et al. A reconciled estimate of glacier contributions to sea level rise: 2003 to 2009. Science 2013, 340, 852–857. [Google Scholar] [CrossRef]
  16. Neckel, N.; Kropáček, J.; Bolch, T.; Hochschild, V. Glacier mass changes on the Tibetan Plateau 2003–2009 derived from ICESat laser altimetry measurements. Environ. Res. Lett. 2014, 9, 014009. [Google Scholar] [CrossRef]
  17. Kääb, A.; Treichler, D.; Nuth, C.; Berthier, E. Brief Communication: Contending estimates of 2003–2008 glacier mass balance over the Pamir–Karakoram–Himalaya. Cryosphere 2015, 9, 557–564. [Google Scholar] [CrossRef]
  18. Brun, F.; Berthier, E.; Wagnon, P.; Kääb, A.; Treichler, D. A spatially resolved estimate of High Mountain Asia glacier mass balances from 2000 to 2016. Nat. Geosci. 2017, 10, 668–673. [Google Scholar] [CrossRef]
  19. Zhao, F.Y.; Long, D.; Li, X.D.; Huang, Q.; Han, P.F. Rapid glacier mass loss in the Southeastern Tibetan Plateau since the year 2000 from satellite observations. Remote Sens. Environ. 2022, 270, 112853. [Google Scholar] [CrossRef]
  20. Ke, L.H.; Song, C.Q.; Yong, B.; Lei, Y.B.; Ding, X.L. Which heterogeneous glacier melting patterns can be robustly observed from space? A multi-scale assessment in southeastern Tibetan Plateau. Remote Sens. Environ. 2020, 242, 111777. [Google Scholar] [CrossRef]
  21. Farr, T.G.; Rosen, P.A.; Caro, E.; Crippen, R.; Duren, R.; Hensley, S.; Kobrick, M.; Paller, M.; Rodriguez, E.; Roth, L.; et al. The shuttle radar topography mission. Rev. Geophys. 2007, 45, 1–33. [Google Scholar] [CrossRef]
  22. González, J.H.; Antony, J.M.W.; Bachmann, M.; Krieger, G.; Zink, M.; Schrank, D.; Schwerdt, M. Bistatic system and baseline calibration in TanDEM-X to ensure the global digital elevation model quality. ISPRS J. Photogramm. Remote Sens. 2012, 73, 3–11. [Google Scholar] [CrossRef]
  23. Rossi, C.; Gonzalez, F.R.; Fritz, T.; Yague-Martinez, N.; Eineder, M. TanDEM-X calibrated raw DEM generation. ISPRS J. Photogramm. Remote Sens. 2012, 73, 12–20. [Google Scholar] [CrossRef]
  24. Gruber, A.; Wessel, B.; Huber, M.; Roth, A. Operational TanDEM-X DEM calibration and first validation result. ISPRS J. Photogramm. Remote Sens. 2012, 73, 39–49. [Google Scholar] [CrossRef]
  25. Li, J.; Li, Z.W.; Zhu, J.J.; Li, X.; Xu, B.; Wang, Q.J.; Huang, C.L.; Hu, J. Early 21st century glacier thickness changes in the Central Tien Shan. Remote Sens. Environ. 2017, 192, 12–29. [Google Scholar] [CrossRef]
  26. Zhang, Q.B.; Zhang, G.S. Glacier elevation changes in the western Nyainqentanglha Range of the Tibetan Plateau as observed by TerraSAR-X/TanDEM-X images. Remote Sens. Lett. 2017, 8, 1142–1151. [Google Scholar] [CrossRef]
  27. Li, G.; Lin, H. Recent decadal glacier mass balances over the Western Nyainqentanglha Mountains and the increase in their melting contribution to Nam Co Lake measured by differential bistatic SAR interferometry. Glob. Planet. Chang. 2017, 149, 177–190. [Google Scholar] [CrossRef]
  28. Lin, H.; Li, G.; Cuo, L.; Hooper, A.; Ye, Q.H. A decreasing glacier mass balance gradient from the edge of the Upper Tarim Basin to the Karakoram during 2000–2014. Sci. Rep. 2017, 7, 6712. [Google Scholar] [CrossRef] [PubMed]
  29. Neckel, N.; Braun, A.; Kropácek, J.; Hochschild, V. Recent mass balance of the Purogangri Ice Cap, central Tibetan Plateau, by means of differential X-band SAR interferometry. Cryosphere 2013, 7, 1623. [Google Scholar] [CrossRef]
  30. Sun, Y.F.; Jiang, L.M.; Liu, L.; Sun, Q.S.; Wang, H.S.; Hsu, H. Mapping Glacier Elevations and Their Changes in the Western Qilian Mountains, Northern Tibetan Plateau, by Bistatic InSAR. IEEE J. Sel. Top. Appl. Earth Obs. Remote Sens. 2018, 11, 68–78. [Google Scholar] [CrossRef]
  31. Liu, G.; Fan, J.H.; Zhao, F.; Mao, K.B.; Dou, C.Y. Monitoring elevation change of glaciers on Geladandong Mountain using TanDEM-X SAR interferometry. J. Mt. Sci. 2017, 14, 859–869. [Google Scholar] [CrossRef]
  32. Malz, P.; Meier, W.; Casassa, G.; Jana, R.; Skvarca, P.; Braun, M.H. Elevation and mass changes of the southern patagonia icefield derived from TanDEM-X and SRTM data. Remote Sens. 2018, 10, 188. [Google Scholar] [CrossRef]
  33. Liu, L.; Jiang, L.M.; Jiang, H.J.; Wang, H.S.; Ma, N.; Xu, H.Z. Accelerated glacier mass loss (2011–2016) over the Puruogangri ice field in the inner Tibetan Plateau revealed by bistatic InSAR measurements. Remote Sens. Environ. 2019, 231, 111–241. [Google Scholar] [CrossRef]
  34. Liu, L.; Jiang, L.M.; Zhang, Z.M.; Wang, H.S.; Ding, X.L. Recent Accelerating Glacier Mass Loss of the Geladandong Mountain, Inner Tibetan Plateau, Estimated from ZiYuan-3 and TanDEM-X Measurements. Remote Sens. 2020, 12, 472. [Google Scholar] [CrossRef]
  35. Wu, K.P.; Liu, S.Y.; Jiang, Z.L.; Xu, J.L.; Wei, J.F. Glacier mass balance over the central Nyainqentanglha Range during recent decades derived from remote-sensing data. J. Glaciol. 2019, 65, 422–439. [Google Scholar] [CrossRef]
  36. Wu, K.P.; Liu, S.Y.; Zhu, Y.; Liu, Q.; Jiang, Z.L. Dynamics of glacier surface velocity and ice thickness for maritime glaciers in the southeastern Tibetan Plateau. J. Hydrol. 2020, 590, 125527. [Google Scholar] [CrossRef]
  37. Zhou, Y.S.; Li, X.; Zheng, D.H.; Zhang, X.L.; Wang, Y.Z.; Ren, S.S.; Guo, Y.L. Decadal Changes in Glacier Area, Surface Elevation and Mass Balance for 2000–2020 in the Eastern Tanggula Mountains Using Optical Images and TanDEM-X Radar Data. Remote Sens. 2022, 14, 506. [Google Scholar] [CrossRef]
  38. González, J.H.; Bachmann, M.; Scheiber, R.; Krieger, G. Definition of ICESat selection criteria for their use as height references for TanDEM-X. IEEE Trans. Geosci. Remote Sens. 2010, 48, 2750–2757. [Google Scholar] [CrossRef]
  39. Yang, K.; He, J. China Meteorological Forcing Dataset (1979–2015); A Big Earth Data Platform for Three Poles: Beijing, China, 2016. [Google Scholar]
  40. Deledalle, C.A.; Denis, L.; Tupin, F. NL-InSAR: Nonlocal interferogram estimation. IEEE Trans. Geosci. Remote Sens. 2011, 49, 1441–1452. [Google Scholar] [CrossRef]
  41. Nuth, C.; Kääb, A. Co-registration and bias corrections of satellite elevation data sets for quantifying glacier thickness change. Cryosphere 2011, 5, 271. [Google Scholar] [CrossRef]
  42. Bolch, T.; Pieczonka, T.; Benn, D. Multi-decadal mass loss of glaciers in the Everest area (Nepal Himalaya) derived from stereo imagery. Cryosphere 2011, 5, 349–358. [Google Scholar] [CrossRef]
  43. Xiang, L.W.; Wang, H.S.; Steffen, H.; Wu, P.; Jia, L.L.; Jiang, L.M.; Shen, Q. Groundwater storage changes in the Tibetan Plateau and adjacent areas revealed from GRACE satellite gravity data. Earth Planet. Sci. Lett. 2016, 449, 228–239. [Google Scholar] [CrossRef]
  44. Neckel, N.; Loibl, D.; Rankl, M. Recent slowdown and thinning of debris-covered glaciers in south-eastern Tibet. Earth Planet. Sci. Lett. 2017, 464, 95–102. [Google Scholar] [CrossRef]
  45. Li, G.; Li, Y.; Lin, H.; Ye, Q.H.; Jiang, L.M. Two periods of geodetic glacier mass balance at Eastern Nyainqentanglha derived from multi-platform bistatic SAR interferometry. Int. J. Appl. Earth Obs. Geoinf. 2021, 104, 102541. [Google Scholar] [CrossRef]
Figure 1. The spatial location of the study area (Test site I and Test site II are the two sites selected for radar penetration difference correction).
Atmosphere 15 00364 g001
Figure 2. Flowchart of TanDEM-X bi-static InSAR algorithm and glacier mass balance estimation algorithm.
Atmosphere 15 00364 g002
Figure 3. (a) Glacier DEM using traditional Goldstein filter; (b) glacier DEM by non-local mean filter.
Atmosphere 15 00364 g003
Figure 4. (a) Glacier elevation changes in the Jiali region from 2000 to 2014, (b) and the Bianba region from 2000 to 2014.
Atmosphere 15 00364 g004
Figure 5. (a) Glacier elevation changes in the Luolong region from 2000 to 2014, (b) and the Bomi region from 2000 to 2014.
Atmosphere 15 00364 g005
Figure 6. (a) Glacier elevation changes in the Basu region from 2000 to 2014, (b) and the Chayu region from 2000 to 2014.
Atmosphere 15 00364 g006
Figure 7. Profile of glacier surface elevation changes (GLIMS_ID: G094528E30583N).
Atmosphere 15 00364 g007
Figure 8. Scatterplot of the relationship between DEM elevation difference and slope before co-registration ((a) Test site I; (b) Test site II, as shown in Figure 1).
Atmosphere 15 00364 g008
Figure 9. Seasonal glacier surface elevation changes (17 February 2014~14 August 2014).
Atmosphere 15 00364 g009
Figure 10. Glacier mass balance with in level-5 watersheds covering our study area.
Atmosphere 15 00364 g010
Figure 11. Spatial distribution of near-surface air temperature change rate in the SETP from 2000 to 2014.
Atmosphere 15 00364 g011
Figure 12. Spatial distribution of surface precipitation change rate in the SETP from 2000 to 2014.
Atmosphere 15 00364 g012
Table 1. Main parameters of the TanDEM-X bi-static InSAR data pairs used.
Acquisition DateCovered AreaIncidence Angle (°)Orbit DirectionOrbital Number
15 January 2014Jiali_137.11Descending135
17 February 2014Jiali_239.30Descending135
6 February 2014Jiali_341.38Descending135
20 December 2011Bianba_133.78Ascending158
4 February 2011Bianba_246.76Ascending67
20 December 2011Bianba_333.78Ascending158
20 August 2011Luolong40.32Descending135
22 September 2011Bomi42.52Descending135
16 September 2014Basu_144.56Ascending158
5 September 2014Basu_242.60Ascending158
14 August 2014Chayu_147.70Ascending158
25 August 2014Chayu_246.20Ascending158
17 February 2014Chayu_346.70Descending150
Table 2. Radar penetration difference value and corrected glacier surface elevation changes.
Acquisition DateCovered AreaGlacier Surface Elevation Change (m)Radar Penetration Correction Value (m)Corrected Glacier Surface Elevation Change (m)
15 January 2014Jiali_1−7.695−2.295−9.990
17 February 2014Jiali_2−3.449−2.295−5.744
6 February 2014Jiali_3−5.037−2.295−7.332
20 December 2011Bianba_1−3.545−2.295−5.840
4 February 2011Bianba_2−4.630−2.295−6.925
20 December 2011Bianba_3−5.196−2.295−7.491
20 August 2011Luolong−5.953−2.295−8.248
22 September 2011Bomi−6.462−2.295−8.757
16 September 2014Basu_1−7.830−2.295−10.125
5 September 2014Basu_2−9.537−2.295−11.832
14 August 2014Chayu_1−7.177−2.295−9.472
25 August 2014Chayu_2−12.113−2.295−14.408
Table 3. Seasonal correction values and corrected glacier surface elevation change rate.
Acquisition DateCovered AreaGlacier Surface Elevation Change (m)Seasonal Correction Value (m)Corrected Glacier Surface Elevation Change (m)YearsCorrected Glacier Surface Elevation Change Rate (m/yr)
15 January 2014Jiali_1−9.9900−9.99014−0.714
17 February 2014Jiali_2−5.7440−5.74414−0.410
6 February 2014Jiali_3−7.3320−7.33214−0.524
20 December 2011Bianba_1−5.8400−5.84012−0.487
4 February 2011Bianba_2−6.9250−6.92513−0.533
20 December 2011Bianba_3−7.4910−7.49112−0.624
20 August 2011Luolong−8.2481.908−6.34013−0.488
22 September 2011Bomi−8.7571.908−6.84913−0.527
16 September 2014Basu_1−10.1251.908−8.21714−0.587
5 September 2014Basu_2−11.8321.908−9.92414−0.709
14 August 2014Chayu_1−9.4721.908−7.56414−0.540
25 August 2014Chayu_2−14.4081.908−12.50014−0.893
Table 4. Total uncertainty and the three components of uncertainty.
Covered AreaUncertainty in the Glacier Surface Elevation Change (m/yr)Uncertainty in Radar Penetration Difference Correction (m/yr)Uncertainty in the Seasonal Correction (m/yr)Total Uncertainty (m/yr)
Jiali±0.0014±0.00800±0.0081
Bianba±0.0014±0.00750±0.0076
Luolong±0.0039±0.0129±0.0142±0.0196
Bomi±0.0046±0.0129±0.0142±0.0198
Basu±0.0024±0.0091±0.0101±0.0138
Chayu±0.0021±0.0094±0.0103±0.0141
Table 5. Glacier surface elevation change rate and glacier mass balance.
Covered AreaGlacier Surface Elevation Change Rate (m/yr)Area WeightGlacier Surface Elevation Change Rate in the Entire SETP (m/yr)Glacier Mass Balance in the Entire SETP (mm w.eq.)
Jiali−0.5030.253−0.505 ± 0.005−454.5 ± 13.1
Bianba−0.5400.287
Luolong−0.4880.053
Bomi−0.5270.049
Basu−0.6450.165
Chayu−0.7570.193
Table 6. Results of glacier surface elevation changes with the level-5 watershed in the SETP.
Watershed IDGlacier Surface Elevation Change (m)Watershed Area (km2)Glacier Surface Elevation Change Rate (m/yr)
5N223F−11.89269.284−0.849 ± 0.005
5N224B−10.35263.735−0.739 ± 0.005
5N224E−12.96014.628−0.926 ± 0.005
5N225E−9.840250.750−0.703 ± 0.005
5O272B−7.738853.094−0.553 ± 0.005
5O280B−5.24519.057−0.375 ± 0.005
5O280C−6.686150.581−0.478 ± 0.005
5O281A−5.9821043.811−0.427 ± 0.005
5O281B−7.7842219.314−0.556 ± 0.005
5O282A−8.0781456.392−0.577 ± 0.005
5O282B−11.767886.034−0.841 ± 0.005
5O283A−7.13828.450−0.510 ± 0.005
5O283B−4.539185.395−0.324 ± 0.005
5O290B−5.24997.952−0.375 ± 0.005
5O291A−1.130109.706−0.081 ± 0.005
5O291B−9.792999.400−0.699 ± 0.005
Unknown−9.33214.765−0.667 ± 0.005
Table 7. Comparison of the estimates of glacier mass balances in in our study and previous studies over the SETP.
Glacier Surface Elevation Change (m/yr)Data SourceTime PeriodCoverage AreaStudy
−0.505 ± 0.005Bi-static InSAR data (3 m)2000–2014Entire SETP This study
−0.30 ± 0.13ICESat 2003–2009Entire SETPGardner et al. [15]
−0.81 ± 0.32ICESat 2003–2009Entire SETPNeckel et al. [16]
−1.34 ± 0.29ICESat 2003–2009Entire SETPKääb et al. [17]
−0.39 ± 0.16SPOT-5 optical stereo pairs 2000–2011About 1/3 of the SETP Gardelle et al. [5]
−0.73 ± 0.23ASTER optical data2000–2016Entire SETPBrun et al. [18]
−0.66 ± 0.02ASTER stereo image pairs 2000–2020Entire SETPZhao et al. [19]
−0.50 ± 0.57~−1.40 ± 0.57Bi-static InSAR data (3 m)2000–2014Five glaciers in the SETPNeckel et al. [44]
−0.54 ± 0.05Bi-static InSAR data (3 m)2000–2013Part of the SETPWu et al. [35,36]
−0.69 ± 0.14TanDEM-X DEM product (90 m)2000–2013Entire SETP Ke et al. [12]
−0.649 ± 0.059~−0.849 ± 0.056Bi-static InSAR data (3 m)2000–2012
2012–2017
Part of the SETP Li et al. [27,45]
Disclaimer/Publisher’s Note: The statements, opinions and data contained in all publications are solely those of the individual author(s) and contributor(s) and not of MDPI and/or the editor(s). MDPI and/or the editor(s) disclaim responsibility for any injury to people or property resulting from any ideas, methods, instructions or products referred to in the content.

