
The Application of Aluminium Powder as an Accumulation Medium of Mercury from Air

Department of Chemistry, Tshwane University of Technology, Pretoria 0001, South Africa
*
Author to whom correspondence should be addressed.
†
Deceased.
Atmosphere 2024, 15(3), 368; https://doi.org/10.3390/atmos15030368
Submission received: 6 February 2024
/
Revised: 6 March 2024
/
Accepted: 13 March 2024
/
Published: 18 March 2024
(This article belongs to the Topic Accessing and Analyzing Air Quality and Atmospheric Environment)
Abstract
:A gaseous elemental mercury (Hg0) sampler was developed for the assessment of mercury (Hg) pollution from the air and utilised aluminium (Al) powder as the accumulation medium. The Hg sampler is presented as an alternative cost-effective sorbent that can be used for the assessment of Hg pollution in atmospheric air in areas where natural bio-indicators such as lichens and moss do not grow, including the urban environments. The chemical treatment of Al materials was necessary to weaken the aluminium oxide (Al2O3) layer to increase the adsorption capability of Al material. Treated Al samples were exposed to Hg vapours for one hour to two weeks in a Hg atmosphere chamber. Other Al powder samples were exposed to the ambient air at areas of the Tshwane Metropolitan Municipality for six to ten months. The analysis of samples by an RA-915+ Zeeman mercury analyser showed that the limit of detection (LOD) and limit of quantification (LOQ) for the determination of Hg in Al powder with a mass of 100 mg were found to be 0.31 ng g−1 and 1.0 ng g−1, respectively. The content of Hg that accumulated on Al powder was linear from 0.1 to 25 ng g−1, thus enabling the measurement of Hg accumulation from air at the global average concentration level. Mercury from air that accumulated on Al powder in the Tshwane Metropolitan Municipality ranged between 70 ng g−1 and 155 ng g−1.
1. Introduction
Mercury (Hg) is a metal of great environmental concern due to its high toxicity and volatility, long residence time and capacity to bio-accumulate in fish in the form of toxic methyl mercury (MeHg) [1,2,3]. It is ranked the third-most-hazardous substance of major public health concern [4,5]. Methylated mercury compounds are considered to be more toxic than inorganic mercury compounds because of their ability to cross biological membranes such as the blood–brain barrier and the placental membrane [6].
Once Hg is released into the environment, it enters the food web, accumulates in the body and can harm the brain, heart, kidneys, lungs and immune system of people of all ages [7,8,9]. Hg is particularly harmful to unborn children and infants whose nervous systems are under development as the damage to their brain cannot be reversed [10].
The history of Hg poisoning is well known from ancient times; for example, workers in Europe suffered from symptoms of mental disability after being exposed to mercuric nitrate (Hg(NO3)2) vapours during the manufacturing of hats in the 19th to 20th century [11,12]. The hats were made from animal fur and Hg(NO3)2 was used in felting to make the outer stiff fur on the pelt soft and limp, and to twist and roughen the furs so that they packed together more easily [12]. During the 1950s, methylmercury emerged as an industrial pollutant around Japan’s Minamata Bay, where people who consumed contaminated seafood suffered from induced neurologic symptoms that included seizures and impaired motor development [13,14]. In 1971, hundreds of people in Iraq died and others suffered from mental illness after the consumption of “pink bread”. The bread was made from ground wheat which was coated with a mercury-based fungicide to protect it against fungal infestation before planting [15,16]. Another mercury poisoning incident was reported in 1997: the death of Professor Karen Wetterhahn of Dartmouth College, who accidentally spilt two drops of dimethyl mercury on her latex gloves in the laboratory [17].
The United Nations Environment Programme (UNEP) has implemented an agreement with countries in an attempt to eradicate the spread of mercury pollution. South Africa is a signatory to the UNEP, a legally binding global body on mercury release that requires countries to reduce their anthropogenic emissions of mercury into the atmosphere [18]. Owing to that, environmental scientists have become more and more interested in mercury in the atmosphere and numerous studies have been conducted for the assessment of mercury concentrations in atmospheric air [19,20,21,22,23].
The direct determination of mercury in atmospheric air can be performed using dedicated analysers which are easy to operate and reliable, but instrumentations are expensive [24,25,26]. Alternative methods that can be employed that are easy and cost-effective include Hg collection through biomonitoring with lichens, which allows the detection of Hg pollution of natural and anthropogenic emissions [27,28,29,30]. The major drawback of these methods is that the natural distribution of lichens in the environment is limited because lichens grow on the bark of trees. This shortcoming makes it difficult to monitor Hg pollution in urban atmospheric environments of cities, as trees with suitable bark for lichens to grow are limited.
Lichens and mosses have also been transplanted from their original habitats to the areas of study for mercury monitoring; however, some these areas’ environments were not lichen-friendly, as they could not acclimate to the substantial climatic variability across the environmental range [31]. The use of transplanted lichens and mosses into areas where they do not grow is therefore not an answer to monitoring atmospheric Hg in the environment. Therefore, these limitations present a need to develop an alternative analytical technique that can be used for the assessment of Hg in atmospheric air in areas where lichens and mosses are completely not available, including urban environments. One such tool is an abiotic passive sampler, which collects analytes from the air by exposing the sampler to ambient air; the analyte can then reach the collecting medium, such as a metal and/or molecular adsorbents (activated carbon, molecules, and minerals) [32]. These passive samplers are economical alternatives to automated samplers since they require no electrical power and tend to be simpler and cheaper to deploy [33].
Thus, the aim of this study is to evaluate the applicability of aluminium (Al) foil and Al powder as an indicators of atmospheric Hg pollution in the environment as these materials are easily available, cost-effective, and easy to deploy.
2. Materials and Methods
2.1. Study Location
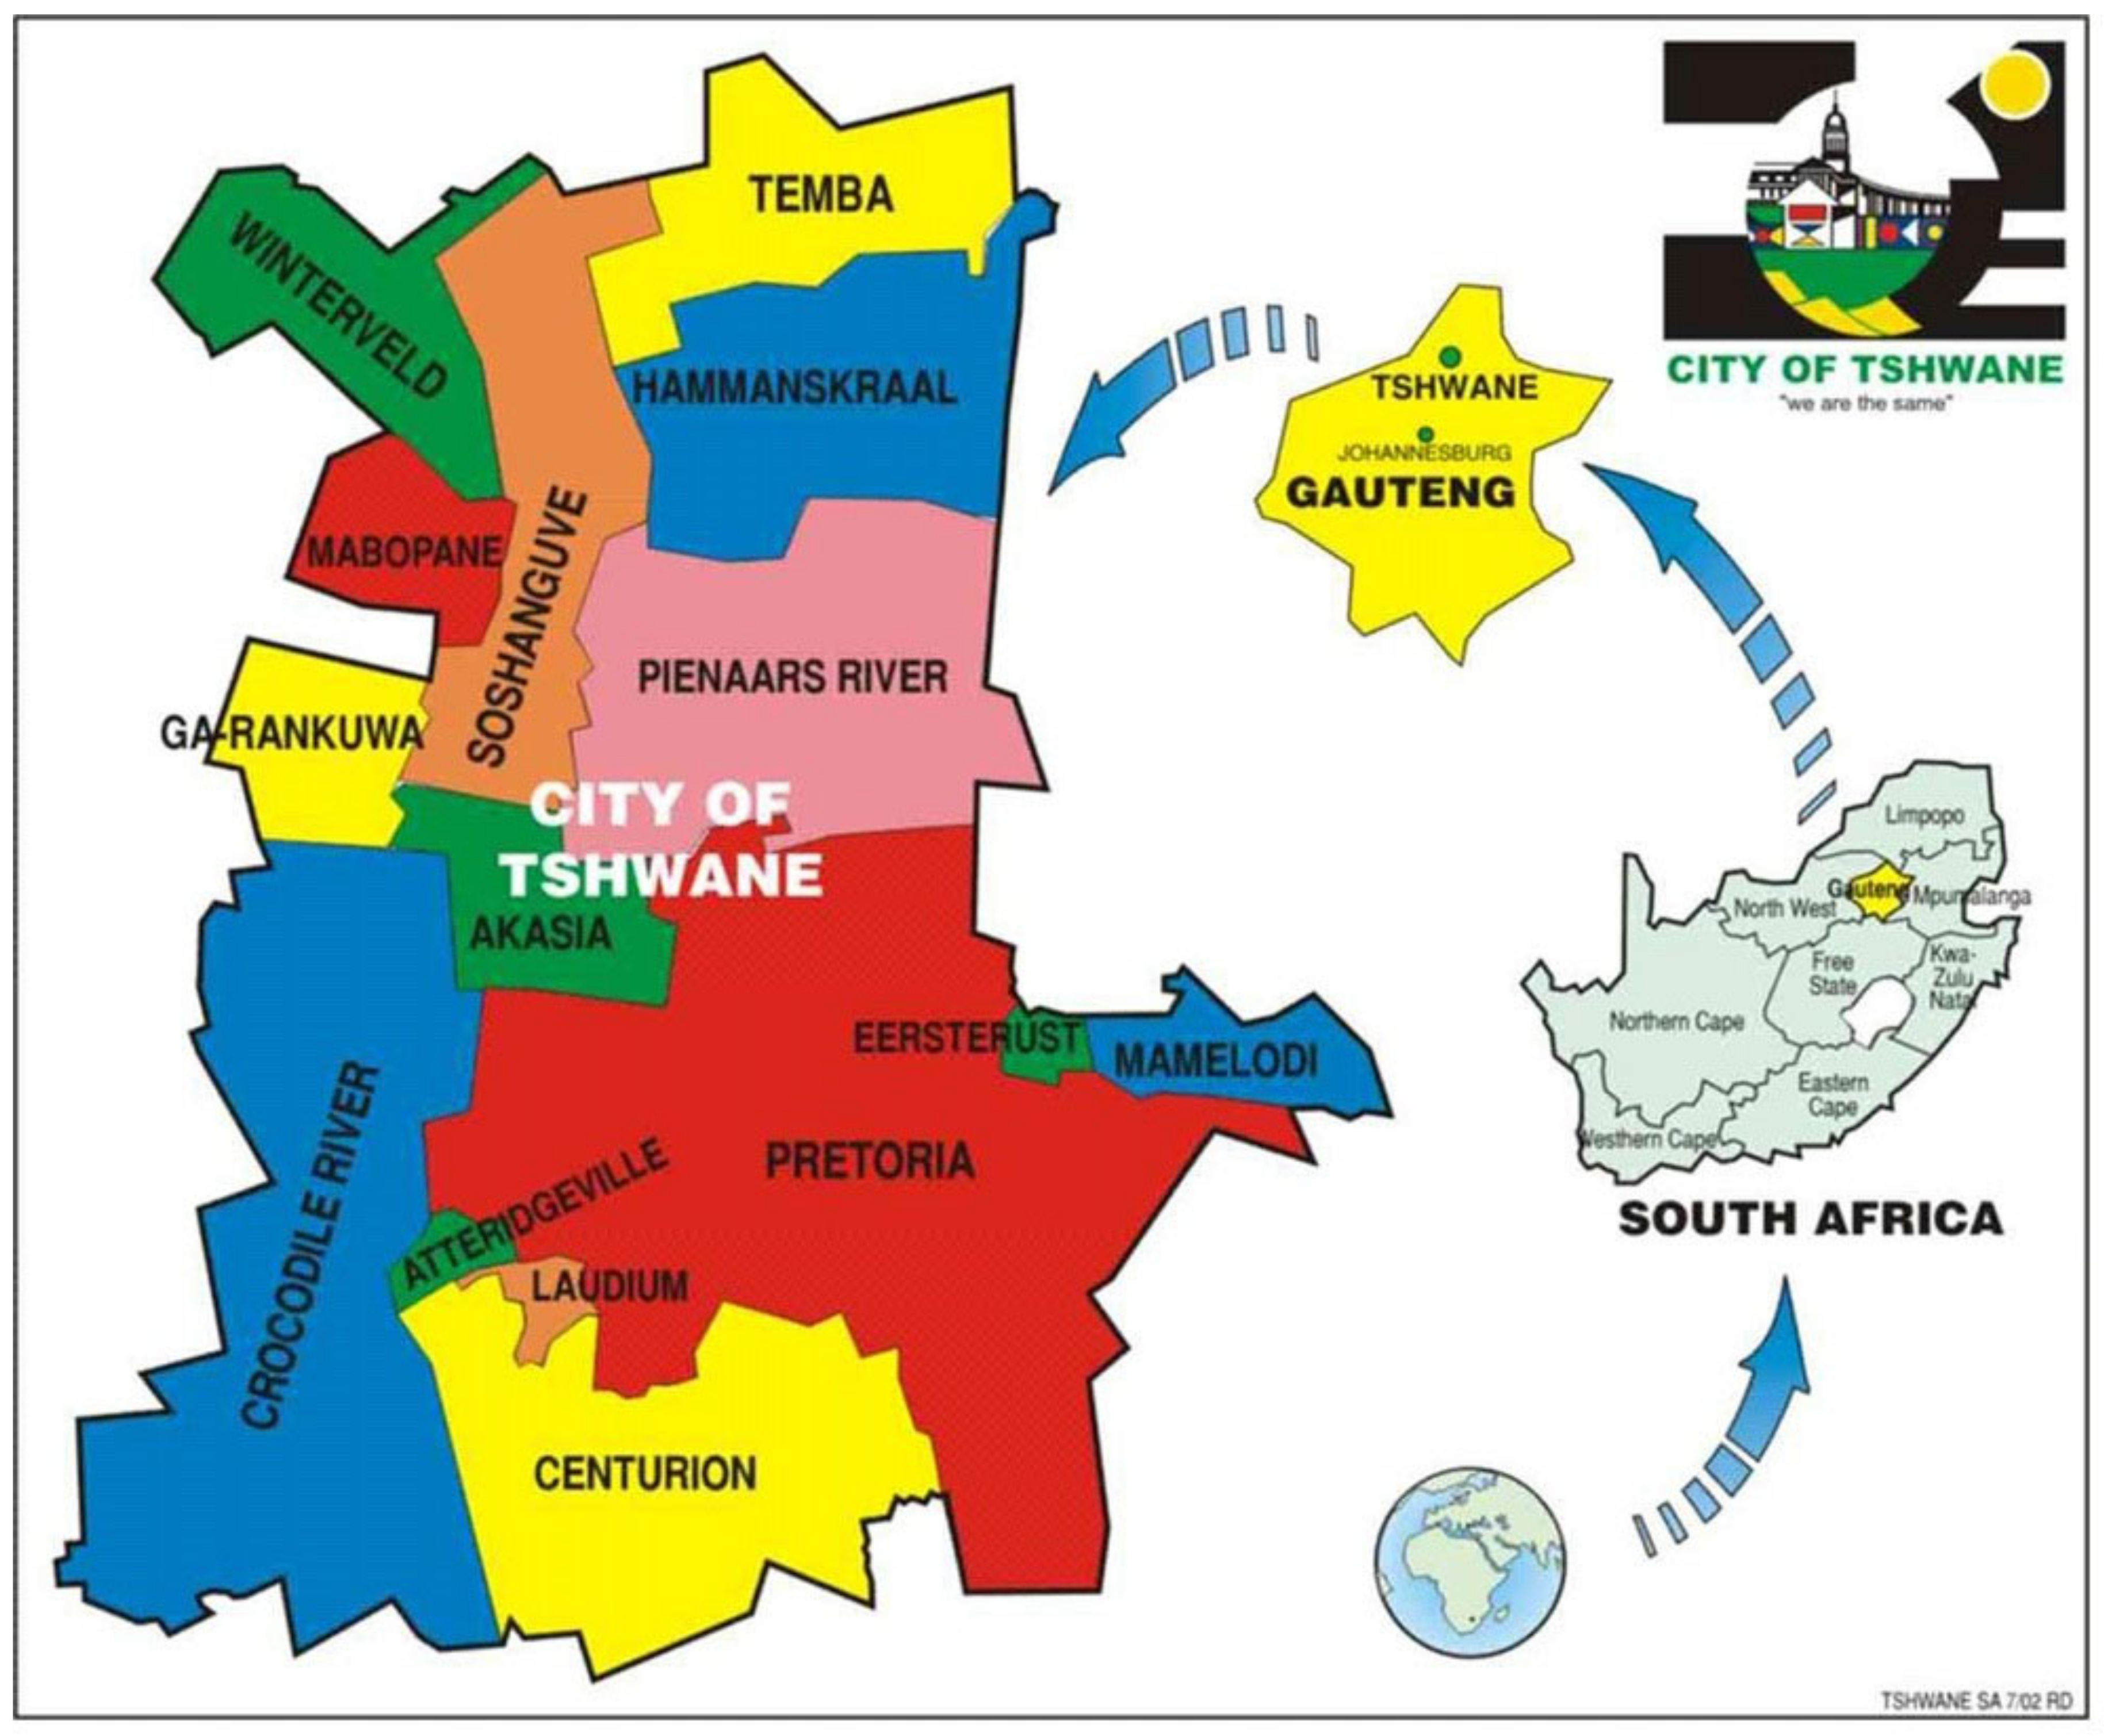
This research study was conducted in the City of Tshwane Metropolitan Municipality, also known as the City of Tshwane (25°39′59.99″ S, 28°09′60.00″ E), which forms part of the local government of the northern part of Gauteng Province, and includes Pretoria, the capital city of South Africa (Figure 1).
The areas chosen within the City of Tshwane to conduct the study were Hammanskraal, representing the township residential place; Gezina and Pretoria central, representing the capital city; and Centurion, representing the suburban area. The area is characterized by dry, sunny conditions, with light rain in the summer (December–February) season. Summers are hot with afternoon thunderstorms and winters are short and reasonably mild, with early morning frosts and sunny afternoons. Temperatures are fairly mild, with an average maximum daytime temperature of 21 °C in January, dropping to an average maximum of 11 °C in July [35].
2.2. Instrumentation
A Model RA-915+ Zeeman mercury analyser (Lumex, Saint Petersburg, Russia) with a PYRO-915 attachment was used for Hg measurements. The PYRO-915 attachment enables the determination of Hg in samples with complex matrices, such as soils, sediments, oil products and foodstuffs, by utilising the pyrolysis technique incorporated within the instrument [36,37]. The operation of the Hg analyser is based on the release of Hg from solid samples during their thermal decomposition. The concentration of Hg is measured by an atomic absorption spectrometer at 253.7 nm Hg resonance line and any background absorption is corrected using a Zeeman Effect correction system.
2.3. Reagents
Aluminium powder (type 2022, Aerontec, Cape Town, South Africa) and aluminium foil (heavy-duty, Shoprite, Pretoria, South Africa) were used for all testing and measurements. Reagents for the treatment of Al powder and foil included suprapur-grade hydrochloric acid (32%), HCl (Merck, Darmstadt, Germany); suprapur-grade nitric acid (65%), HNO3 (Merck, Darmstadt, Germany); chromium oxide (99% reagent grade), CrO3 (Merck, Germany); sodium hydroxide (≥98% reagent grade pellets), NaOH (Merck, Darmstadt, Germany); and ultrapure deionised water. Certified reference material (CRM) used for the validation of results was SARM 20 (South African coal, Mintek, Randburg, South Africa) with a certified value of 250 ± 30 ng g−1.
2.4. Calibration Standards
The calibration of the mercury analyser was performed using the following standard and certified reference material: SARM 20, South African coal with certified Hg concentration of 250 ng g−1 and PACS-2, marine sediment with certified Hg concentration of 3040 ± 200 ng g−1. The choice of these standards was because Al reference materials with known mercury content were not available on the market.
2.5. Mercury Experimental Set-Up
To create a hermitically sealed mercury atmosphere, a 20 L sealed box was used as the accumulation chamber (Figure 2). Then, 100 µL (130 mg) of metallic Hg was placed at the bottom of the chamber in a Petri dish to create high Hg0 atmosphere concentration. The treated Al samples were kept in the chamber for exposure to the mercury atmosphere. An operating fan was used in the chamber to enhance the even distribution of mercury in the chamber atmosphere [38].
2.6. Treatment of Aluminium Foil for the Removal of the Al Oxide Layer
The Al foil was cut into 5 × 30 cm strips. Three batches were prepared, with each batch having approximately 20 strips of Al foil. One batch of Al foil strips was wiped with cotton wool that had been kept in a solution of 10% of HCl for five (5) min. The second batch of Al foil strips was wiped with cotton wool that had been kept in a solution of 10% NaOH for five (5) min. A third batch was wiped with cotton wool that had been kept in a solution of 5% chromic acid for five (5) min. The treatment for all the batches was carried out under a fume cupboard. From all three batches, two strips of treated Al foil from each batch were set aside for surface morphology analysis using a Scanning Electron Microscope (SEM). Thereafter, all the remaining strips (56) from all batches were placed in the mercury-containing chamber by hanging them with strings that are attached to their ends of the box (Figure 2). The treated Al foil samples were also placed at different secure locations within Tshwane Metropolitan Municipality for a period from 6 to 10 months; they were exposed to ambient air by hanging them with a string under the roof, at a distance of 5 cm from each other.
2.7. Treatment of Al Powder with Chromic Acid
Approximately 40 g of Al powder (200 mesh) was added to a 100 mL beaker containing 60 mL of 5% (w/v) chromic acid (H2CrO4) solution at room temperature. Thereafter, when the bubbles were no longer being released in the beaker, Al powder was transferred to a flat tray to dry. Prior to being dried, the Al powder sample was washed three times with ultrapure water and was then expected to be free from chromic acid residues. Aluminium powder was treated only with chromic acid because it was found to be a better treatment solution, as explained in Section 4.
2.8. Exposure of Chemically Treated Al Samples to Hg Vapour
Samples of treated Al foil or powder were placed in a mercury-containing chamber for a period of time. In the beginning, samples in the first set were taken hourly, daily, weekly and monthly. The second set of samples of Al powder treated only with H2CrO4 were transferred into tea bag materials, sealed and exposed to the open air at different secure locations within Tshwane Metropolitan Municipality for a period from 6 to 10 months. This was achieved by hanging them with a string attached to the sample tea bag under a roof, at a distance of 5 cm from each other.
2.9. Analysis of Samples
The determination of total Hg in Al foil and Al powder samples after exposure was performed through the thermal decomposition of accurately weighted (to the nearest mg) sub-samples. The weighed sample was placed in a pre-cleaned quartz sampling boat and inserted into the furnace of the Hg analyser. The exact weight of the sample, ranging between 100 mg and 130 mg, was recorded using the RAPID software (1.00.442 version). The determination of total Hg was accomplished by heating the samples until the complete evaporation of Hg was ensured, usually within 60 to 100 s at 0.8 °C/s from ambient temperature to 720 °C. The RAPID software permits the temporal evolution of the analytical peak (Hg absorption) to be followed, with the area under the peak, the maximum absorbance value and calculated concentration to be displayed. Each sample was analysed in triplicate and results were reported as mean ± standard deviation of Hg concentration.
2.10. Scanning Electron Microscope Analysis for Surface Morphology
The scanning electron microscope (SEM) analysis for treated Al foil samples was outsourced to the Department of Chemistry of the University of Pretoria (UP) and the instrument used for the analysis was a ZEISS-Auriga Cobra SEM, which is a field emission SEM equipped with a focused-ion beam and energy dispersive X-ray (EDX). The SEM analysis was necessary to determine the effect of the different treatment solutions on the surface of the Al foil.
3. Results
3.1. Calibration of the Mercury Analyser
The mercury analyser was calibrated using certified reference materials (CRMs) containing Hg content in the range covered in the environment. Standard SARM 20 (MINTEK, South Africa, 250 ± 30 ng g−1) and PACS-2 (National Council of Canada, Canada, 3040 ± 99 ng g−1) were used for instrument calibration. The data obtained were stored in the PC memory and used for the automatic calculation of Hg measured results. The calibration curve of Hg determination was generated as the absolute mass of Hg (ng) versus atomic absorption peak area (peak area, arbitrary units). The absolute mass of Hg (mHg) was determined from the relationship between the certified value of Hg concentration (CHg) and the mass of the CRM (mCRM) subsamples taken for analysis:
A calibration curve defined by a typical regression equation, y = 354 − 6, was obtained and used for the quantification of Hg in atmospheric air. The calibration curve was linear (R2 = 0.9975) up to 26 ng of absolute mass of Hg. This absolute value of 26 ng Hg indicates that the relative Hg concentration that can be determined in the samples of Hg that accumulated in Al powder with acceptable precision and accuracy was up to 260 ng g−1, assuming that an Al subsample mass is 100 mg.
3.2. Validation and Reliability of the Hg Determination Results
Certified reference materials were analysed regularly to ensure the validity and reliability of the results. The accuracy of the applied method is confirmed when there is good agreement between the obtained and certified values. The assessment of the accuracy of the applied analytical method was achieved through the analysis of NIST SRM 1515 and SARM 20. The choice of these two CRMs was made to include a CRM which has a lower Hg content (NIST SRM 1515) and another CRM with a higher Hg content (SARM 20), so that a wider range of Hg values was represented. The SARM 20 was chosen for the validation of the method because of its stability and being contamination-free, as verified by the results of the analysis several times on different days to monitor the measured concentration against the certified value, which showed that Hg concentration was always found to be within the uncertainty limits. The results of the CRM analysis indicated that the measured values of Hg in these reference materials were in good agreement with the certified values (Table 1).
3.3. Limit of Detection and Limit of Quantification
For the determination of a limit of detection (LOD) and limit of quantification (LOQ), ten (10) replicate measurements of the original Al powder were used as the blank values, and therefore LOD and LOQ were calculated from the regression line of the calibration curve presented in a general form: y = a + bx and represented as y = 354x − 6. Numerical calculations were performed using the following formulae: and , where is the standard deviation of the blank and m is the slope of calibration curve [39]. The standard deviation was obtained from the measurements of the blank replicates presented in Table 2.
The LOD and LOQ were found to be 0.031 (3 × 3.66/354) ng and 0.10 (10 × 3.66/354) ng, respectively. These values indicate that for an Al sample of 100 mg, the relative LOD is 0.31 ng g−1 and the LOQ is 1.0 ng g−1. These concentration values are lower than the lowest concentrations of mercury found in Al samples (13–36 ng g−1), thus illustrating that the methodology has the potential to determine Hg content in Al powder of any commercial use.
3.4. Surface Morphology of Treated Al Samples
The surface morphology of the Al foil samples treated with different etch solutions (NaOH, HCl and H2CrO4) is presented in Figure 3. It was important to scan the surface morphology of these samples to identify the differences between the untreated Al foil and the treated Al foils, and also to pinpoint the possible active sites that may have been activated during the interactions of Al foil with different chemical treatment solutions. The chemical treatment of the Al materials was reported to increase the surface area of the Al material by creating uniformly distributed etch tunnels [40,41] and roughness on the surface of the Al material [42]. The etch tunnels that can be seen on the treated sample represent the active sites where Hg0 can adsorb.
The first SEM micrograph represents the smooth, untreated Al foil (blank sample), which has small white lines which are the reflections of its shininess (Figure 3a). The second micrograph of Al foil treated with NaOH shows surface roughness that looks like ‘tiny grains’ and bigger spots, indicating the new film (Figure 3b). The third micrograph of Al foil treatment with HCl shows microscopic cracks on the surface of the Al foil with new films formed that are bigger than the ones from the blank sample (Figure 3c). The last micrograph, which represents Al foil treated with H2CrO4, shows that almost the entire surface is covered by the newly formed film (Figure 3d). The tiny spots are also visible, which can be seen as the active sites for Hg adsorption.
3.5. Accumulation of Hg by Chemically Treated Al Foil as a Function of Time
To assess the Hg adsorption on Al, samples of treated Al foil were placed in a mercury chamber and allowed to stand in the chamber for a period of up to twenty-one (21) days. The zero (0) exposure time is associated with the treated Al foil that was not exposed to mercury, and thus taken as the blank Al foil. The results of the analysis of these samples are summarized in Table 3, and are represented as mean concentration values of three replications plus/minus standard deviation. The blank values were subtracted from these results.
Samples treated with H2CrO4 showed Hg concentrations ranging from 27 to 107 ng g−1; those treated with HCl had Hg concentrations ranging from 17 to 66 ng g−1; and samples treated with NaOH accumulated Hg that ranged from 13 to 36 ng g−1. The Hg content accumulated on Al-treated foil after 21 days of exposure showed that Al foil treated with NaOH, HCl and H2CrO4 accumulated 36 ± 0.38 ng g−1, 66 ± 1.2 ng g−1 and 107 ± 2.3 ng g−1, respectively. Therefore, these results indicated that the amount of Hg that accumulated on Al foil treated by H2CrO4 was the highest, whereas Hg that accumulated in samples treated with NaOH was the lowest (Table 3). The accumulation of Hg in Al foil treated with H2CrO4 increased linearly with time at a low accumulation rate, as it took 21 days to reach a level of approximately 100 ng g−1.
Analytical peaks of Hg determination in Al treated with HCl showed a single transient peak at each period of exposure, thus confirming that Hg in atmospheric air exists solely as Hg0. The integrated peak areas of Hg in Al-treated foils exposed to Hg vapour in the mercury chamber for 7, 14 and 21 days increased linearly with time (Figure 4).
3.6. Accumulation of Hg on Al Powder Treated with H2CrO4
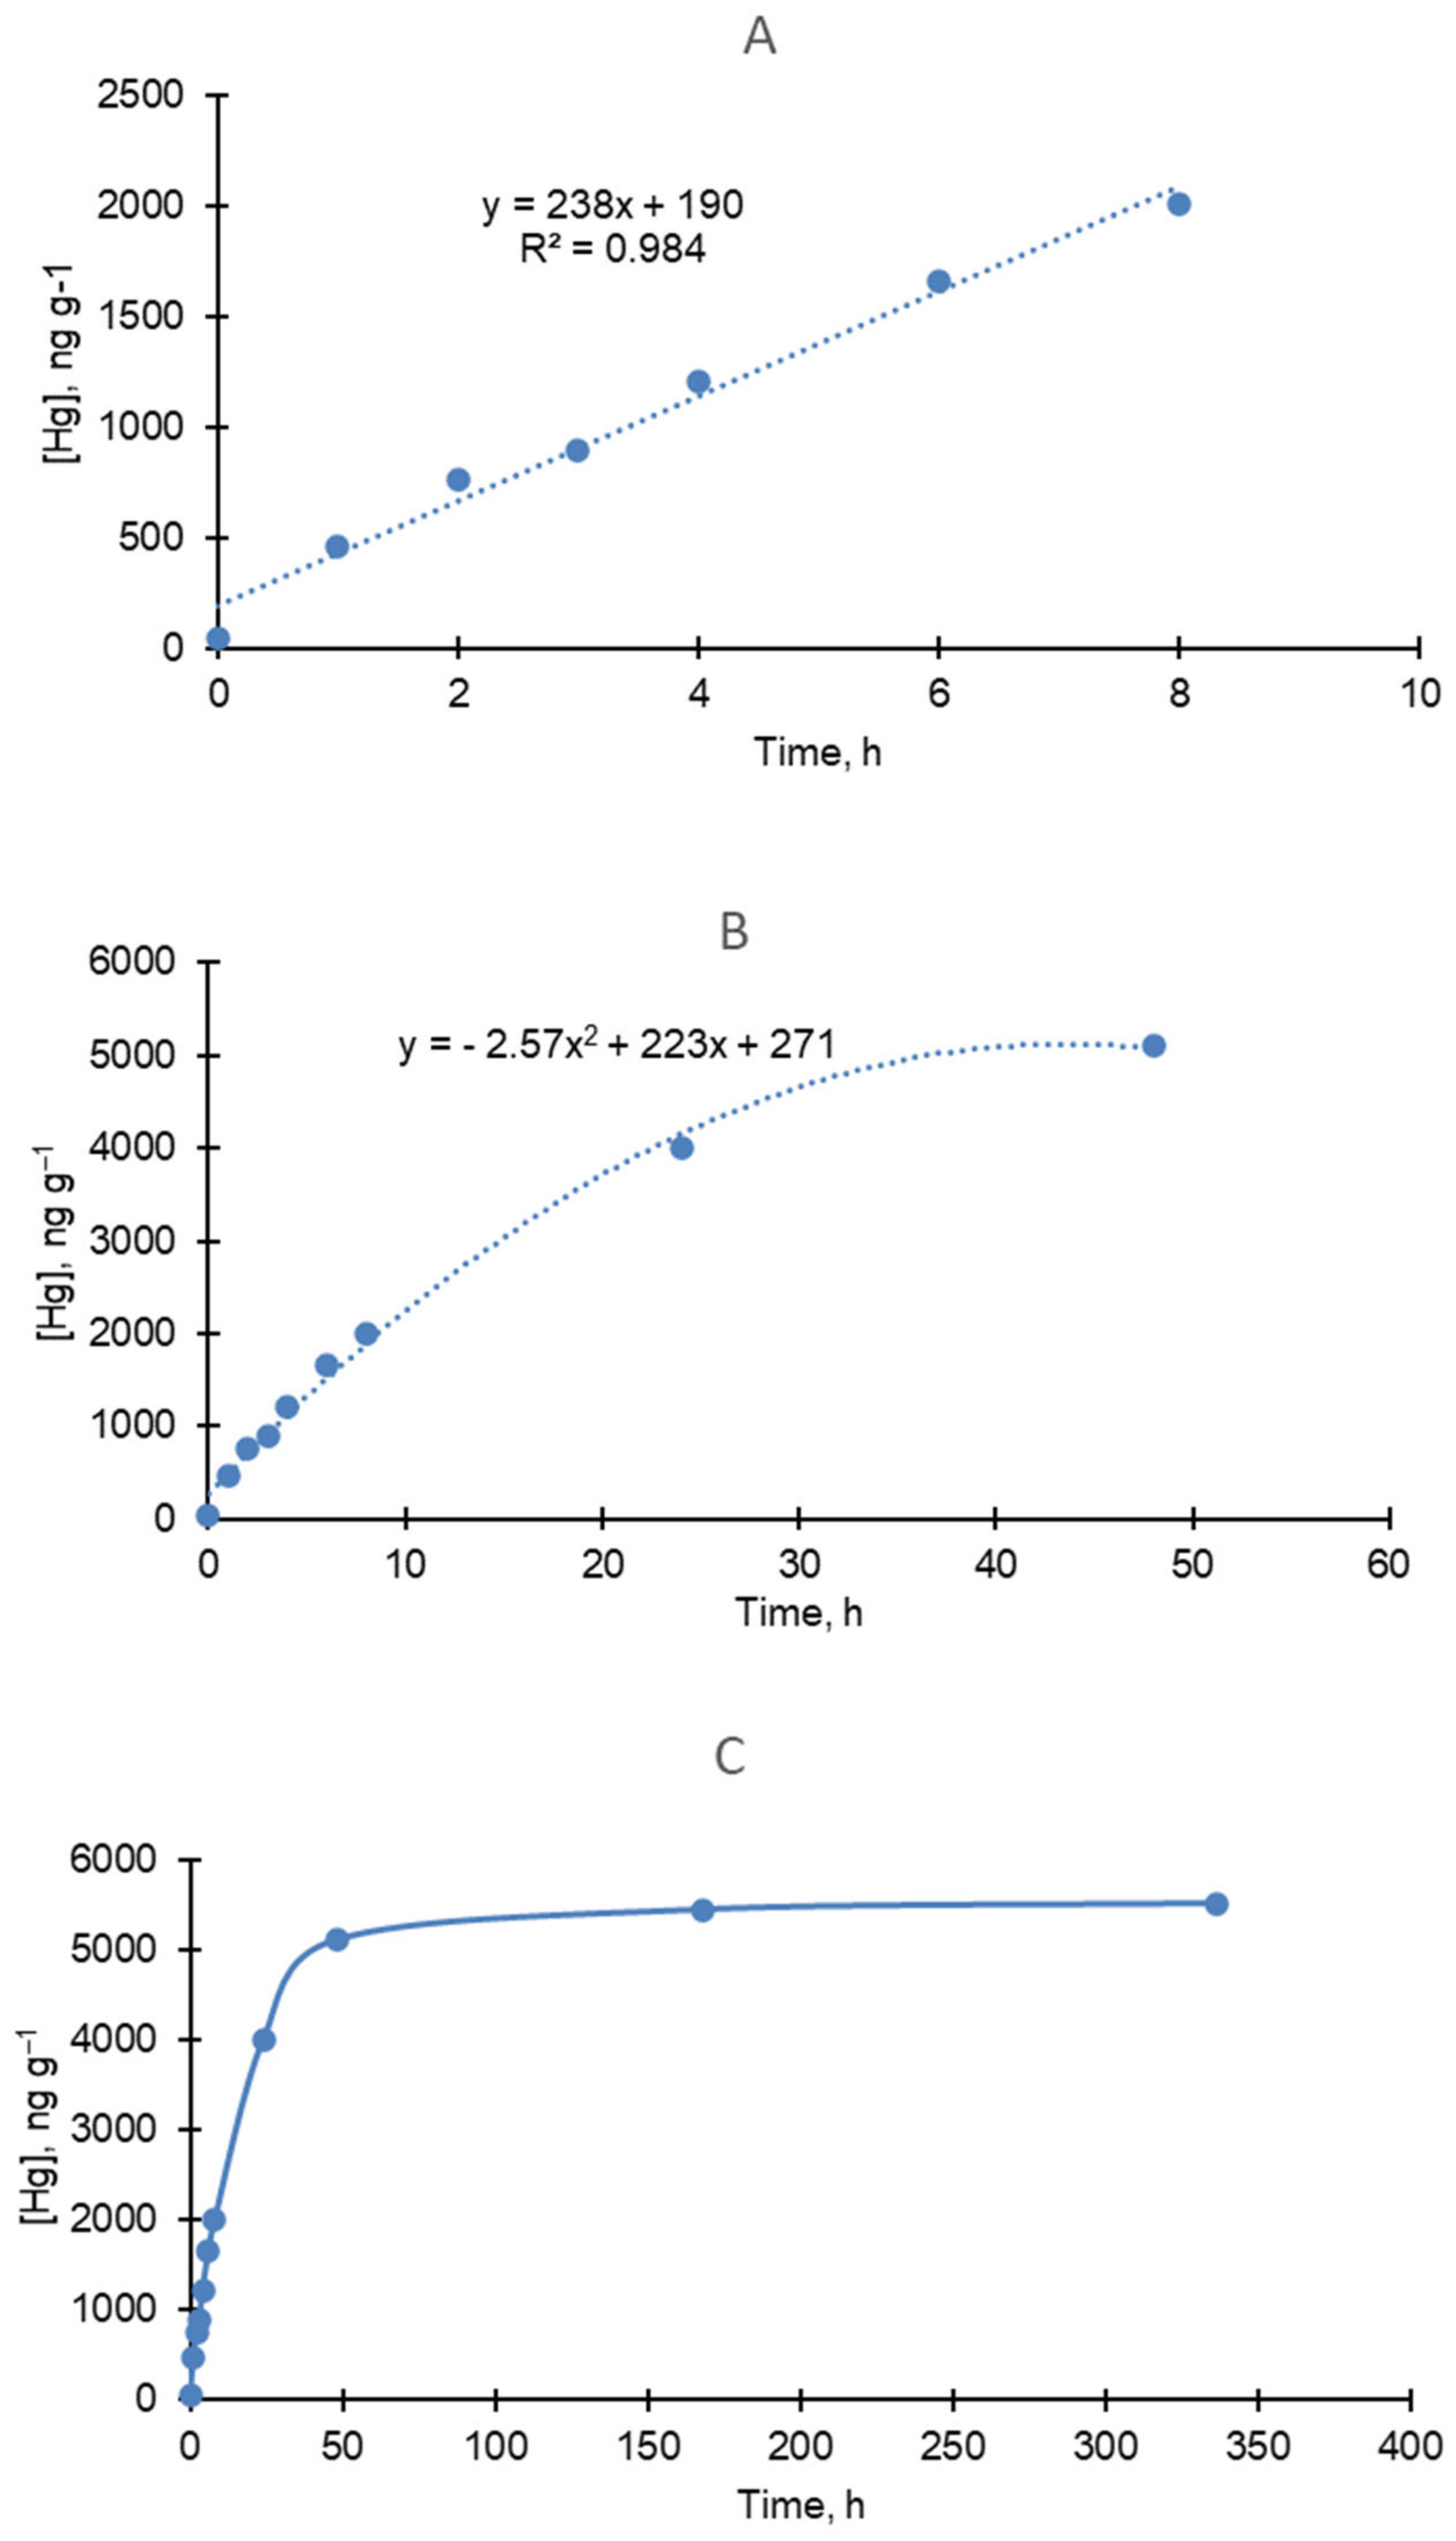
The accumulation of Hg0 on treated Al powder over periods ranging from one hour to two weeks is shown in Figure 5. Hg content that was adsorbed on Al powder treated with H2CrO4 for a period of 1 h to 336 h ranged between 465 ng g−1 and 5 506 ng g−1, but the rate of accumulation was highest from 1 h to 8 h, as indicated by the linear calibration curve (y = 238x + 190, R2 = 0.984), with no saturation during this period, and therefore this sorbent was optimally efficient for the deployment period (Figure 5A).
From 8 to 50 h, the rate of Hg adsorption decreased as the sorbent became saturated, as indicated by the graph represented by the quadratic equation y = −2.57x2 + 223x + 271, which becomes curved or loses its linearity (Figure 5B).
The Hg content that accumulated on Al-treated powder remained unchanged for a period between 50 h and 336 h, thus indicating that Al powder’s sorbent adsorption of Hg became saturated with Hg0 and that it could not be used to accumulate Hg in an artificially created Hg atmosphere for more than 50 h (Figure 5C). The equilibrium uptake capacity of the Al powder treated with H2CrO4 was reached at approximately 5000 ng g−1.
3.7. Analysis of the Hg Analytical Peak Signal Obtained in Hg Adsorbed on H2CrO4 Al−Treated Powder
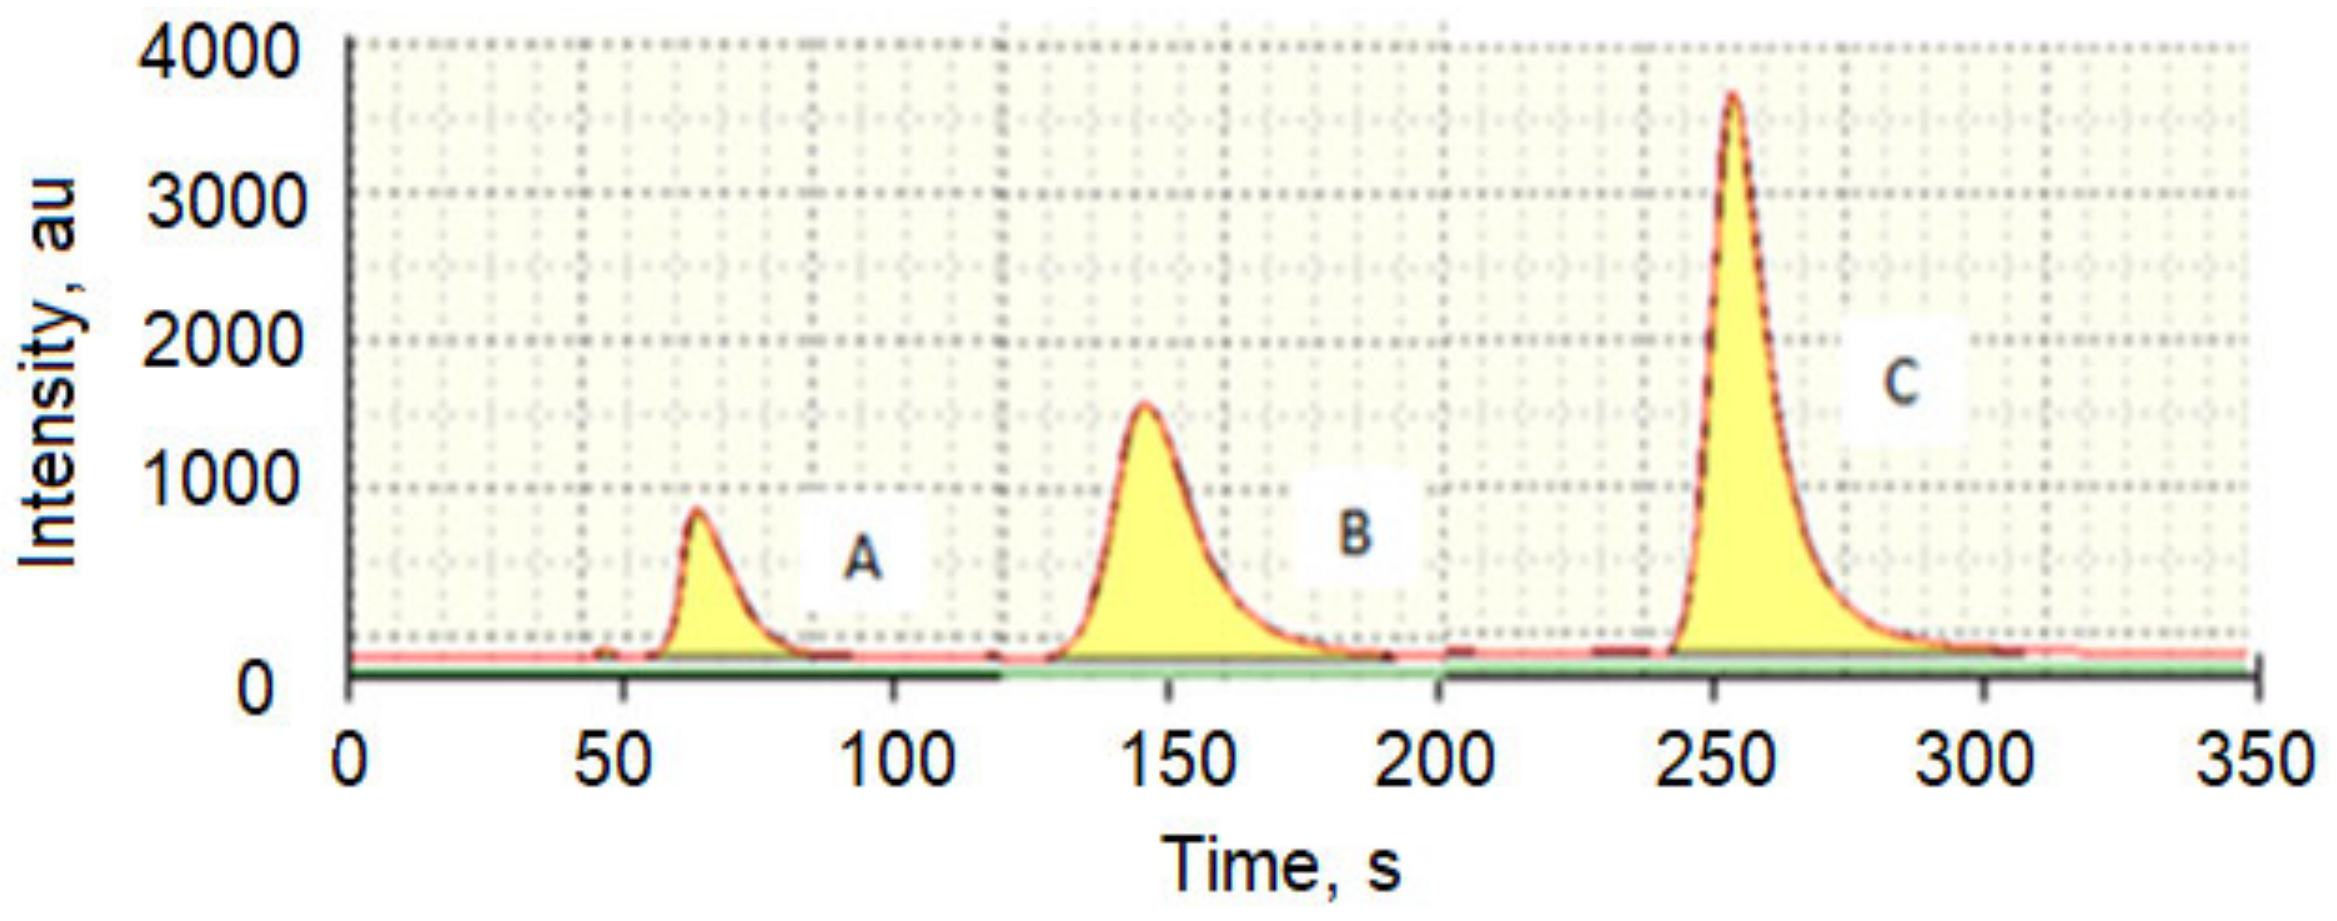
Figure 6 shows analytical signals for the desorption of Hg from samples of Al powder treated with H2CrO4 and exposed to Hg vapours in the Hg chamber for a period of one to four hours. The results showed that the signal integrated peak area of Hg increased with an increase in exposure time, but this was in contrast to samples treated with HCl, which displayed a single thermopeak for each sample; the Al powder samples treated with H2CrO4 displayed double thermopeaks (Figure 6).
3.8. Application of Al Powder as an Indicator of Hg Pollution in Atmospheric Air
The results of the application of Al powder in the monitoring of Hg pollution in Tshwane Metropolitan Municipality showed that Hg content adsorbed in Al powder samples increased proportionally with the period of Al exposure to atmospheric air (Table 4).
The average concentration of Hg from the air of Tshwane Metropolitan Municipality accumulated on Al powder ranged from 107 ng g−1 to 121 ng g−1 in six months, with Pretoria CBD accumulating the lowest average concentration of 107 ± 1.4 ng g−1 and increasing in the following order: Centurion (110 ± 1.2 ng g−1), Gezina (112 ± 1.4 ng g−1) and Hammanskraal (121 ± 1.4 ng g−1). A comparison of Hg concentrations that accumulated in Al powders continuously from 6 to 10 months indicated that Hg levels in Pretoria CBD increased by 5.6% (107 ± 1.4 to 113 ± 1.8 ng g−1) and that in Centurion, Gezina and Hammanskraal they increased by 25% (110 ± 1.2 to 138 ± 1.4 ng g−1), 26% (112 ± 1.4 to 141 ± 2.1 ng g−1) and 28% (121 ± 1.4 to 155 ± 3.9 ng g−1), respectively. These results are represented as the concentration mean of three replicates ± the standard deviation.
4. Discussion
4.1. Al Matrix Treatment Prior to Application as a Hg Pollution Monitor
Al possesses the ability to form a thin layer of inert and thermodynamically stable oxide, viz., aluminium oxide (Al2O3), which can serve as a protective barrier to limit the oxidation of the underlying Al metal, thus preventing it from reacting with Hg [42]. Therefore, the removal of the chemical Al2O3 is a necessary procedure to enhance the reaction of Al with Hg to form an amalgam [43]. This goal is accomplished by treating the foil with either an acid or a base, such as HCl or NaOH, as shown in the reactions below:
As a result, the surface layer of Al2O3 is replaced with AlCl3 or NaAl(OH)4, which permit Hg to react with Al to form an aluminium amalgam (AlHg). The chemical treatment also allows Al2O3 to defect, thus permitting Hg to penetrate, condensate and initiate amalgamation [44].
In some cases, the contact of Hg with bulk Al could take place after the mechanical removal of the oxide layer by a recent scratch, giving rise to the reaction illustrated in Equation (4). This process can continue well beyond the immediately exposed metal surface, potentially reacting with a large part of the bulk Al before the reaction comes to an end.
The treatment of the Al material with a dilute solution of H2CrO4 initiates the redox reaction between the Cr6+ and Al0, as shown in Equation (5).
Both products’ ions react with OH− in the presence of water to form hydroxides:
which may subsequently decompose and result in the formation of a new protective oxide layer [45], as shown in the reaction Equations (8) and (9):
The SEM analysis of Al foil was carried out to assess the properties of the Al surface after chemical treatment. The results indicated that H2CrO4 is the better treatment solution for Al foil to enhance Hg adsorption, as it modified the surface of the Al foil better than NaOH and HCl etching solutions. The Al foil treated with H2CrO4 showed a better-increased surface area, as the new film occupied almost the entire surface of the foil. Hence, Al powder was only treated with H2CrO4. The increased surface area of the metal surface had a better adsorption capability [45]. Al powder treated with H2CrO4 showed a much superior accumulation of Hg due to its higher homogeneity and particle size.
The analysis of Al powders that were exposed to a Hg atmosphere in a chamber showed double Hg thermopeaks. This phenomenon can be explained by considering the redox reactions of Hg with H2CrO4.
The overall net reaction can be summarised as follows:
As a result of the treatment with H2CrO4, Hg accumulated in Al powder in two chemical forms, one as AlHg and the other as HgCrO4. The two Al chemical forms had slightly different binding energies towards Hg, which is shown by the minor difference in the period of their detection, as indicated by the formation of the double thermopeaks. It is also possible that during the washing stage of the treated Al powder, not all the chromic acid was removed and thus the residues may have oxidized Hg (0) to Hg (II), resulting in two thermopeaks.
4.2. Application of Al Powder as a Sampler of Hg from Air
The application of Al-treated powder as accumulation medium of Hg from the air of Tshwane Metropolitan Municipality was implemented for a period of six to ten months because the areas in which the samples were placed were considered to be relatively free of Hg contamination. The results of the investigation showed that Hammanskraal has the highest mean concentration of accumulated Hg (155 ng g−1) as compared to the other areas of Tshwane Metropolitan Municipality. The major source of Hg in this area is probably emissions from Rooiwal coal power station, a 300 MW coal-fired power plant that is situated 23 km away from the sampling location, as it is known that coal combustion is a major source of Hg in the atmosphere. The other suspected contributor of Hg in Hammanskraal could be industrial activities in this area. The application of Al foil samples in the monitoring of Hg in air for outdoor locations failed as they tore easily; hence, no results are available for such applications.
The results of Hg determination in air accumulated onto Al powder demonstrate that Al powder is potential monitor of Hg pollution in atmospheric air, as its accumulation of Hg0 is comparable to that achieved by lichens in South Africa and other parts of the world [48,49,50,51,52,53,54]. The application of lichens in the monitoring of Hg in atmospheric air showed that the average of 129 ng g−1 of Hg0 was measured in Poland and Czech Republic by atomic absorption spectrometry technique [48]. In another study, Hg0 from the air was monitored with lichens in an area that was 20 km from a Hg-thermometer factory in India, and its concentrations ranged between 209 and 1 060 ng g−1 [49]. In South Africa, True et al. [50] determined Hg0 from air accumulated by lichens from Pretoria (CSIR, Pretoria West and Hatfield) using the cold vapour atomic absorption spectrometry technique (CVAAS), and found that the average Hg0 concentration in atmospheric air ranged from 74 to 193 ng g−1. A study by Panichev et al. [51] reported Hg0 concentration from air accumulated by lichens from Pretoria (Pretoria North, Pretoria West and Centurion) to be in the range between 109 ng g−1 and 144 ng g−1, and these results are comparable to the results found in the current study.
The use of Al powder as a sorbent for Hg accumulation from the air is simple, efficient and cheaper as compared to other abiotic passive air samplers (PASs) for Hg accumulation. In a critical review by McLagan et al. [52], it was stated that abiotic PASs were efficient and simple to use, but generally they are expensive, as they use expensive sorbent materials such as gold-based sorbents. In other PASs, the gold sorbents were substituted by inexpensive activated carbon; however, analytical methods utilizing activated carbon are destructive in nature [53]. Other PASs such as the one used by Brown et al. [54] require long deployment periods of at least a year or more to adsorb quantifiable amounts of Hg from the air. In contrast, the sampler for Hg for air monitoring proposed in this study could be a solution in reducing the cost of monitoring Hg pollution in urban environments.
5. Conclusions
A sampler for the determination of mercury from air that utilised Al powder as the medium of accumulation was developed. It was found that Al powder treated with an aqueous solution of H2Cr2O4 is a good accumulator of Hg from atmospheric air as it increases the active sites of Hg adsorption through the formation of AlHg and HgCrO4, whereas with other etching solutions, only AlHg was formed. The Al powder sampler was successfully applied for the accumulation of Hg from the air over the areas of Tshwane Metropolitan Municipality, and the accumulated concentration ranged between 70 ng g−1 and 155 ng g−1.
Al powder treated with H2CrO4 is a cost-effective monitor of Hg pollution from the air, particularly in urban environments where lichens cannot grow.
The application of Al foil as a sampler of Hg in the outdoor environment did not materialise as the foil could not withstand severe environmental weather conditions such as storms, and tearing of the foil was common. Therefore, Al foil could only be used indoors, whereas Al powder can used both in- and outdoors as an Hg monitor from the air.
Author Contributions
I.M.M.: Method development and analysis of coal samples; Writing—original draft; Revision of the manuscript. N.P.: Conception of the project; Co-supervision of the project; Visualization; Review and editing of the project. K.L.M.: Project administration; Resources; Supervision of the project; Review and editing of the project; Quality check and revision of the manuscript. All authors have read and agreed to the published version of the manuscript.
Funding
This research was funded by Tshwane University of Technology.
Institutional Review Board Statement
Not applicable.
Informed Consent Statement
Not applicable.
Data Availability Statement
The data presented in this study are available within the article.
Conflicts of Interest
The authors declare no conflict of interest.
References
- Lavoie, R.A.; Jardine, T.D.; Chumchal, M.M.; Kidd, K.A.; Campbell, L.M. Biomagnification of mercury in aquatic food webs: A worldwide meta-analysis. Environ. Sci. Technol. 2013, 47, 13385–13394. [Google Scholar] [CrossRef] [PubMed]
- Jia, Z.S.; Greco, R.L.; Grivell, R.; Louise, J.; Deussen, A.; Dodd, J.; Moran, L.T. Awareness of Listeriosis and Methylmercury toxicity public health recommendations and diet during pregnancy. Women Birth 2019, 32, 65–70. [Google Scholar]
- Lee, J.; Hwang, G.; Naganuma, A.; Satoh, M. Methylmercury toxic mechanism related to protein degradation and chemokine transcription. Environ. Health Prev. Med. 2020, 25, 30. [Google Scholar] [CrossRef] [PubMed]
- ATSDR, Agency for Toxic Substances and Disease Registry. Substance Priority List. 2019. Available online: https://www.atsdr.cdc.gov/spl/index.html (accessed on 6 January 2020).
- Tibau, A.V.; Grube, B.D. Dental amalgam and the Minamata Convention on mercury treaty: Make mercury history for all. J. Oral Dent. Health 2023, 7, 227–241. [Google Scholar]
- Bjorkman, L.; Lundekvam, B.F.; Laegreid, T.; Bertelsen, B.I.; Morild, I.; Lilleng, P.; Lind, B.; Palm, B.; Vahter, M. Mercury in human brain, blood, muscle and toenails in relation to exposure: An autopsy study. Environ. Health 2007, 6, 30. [Google Scholar] [CrossRef]
- Bjorklund, G.; Peana, M.; Dadar, M.; Chirumbolo, S.; Aaseth, J.; Martins, N. Mercury-induced autoimmunity: Drifting from micro to macro concerns on autoimmune disorders. Clin. Immunol. 2020, 213, 108352. [Google Scholar] [CrossRef]
- Yang, L.; Zhang, Y.; Wang, F.; Luo, Z.; Guo, S.; Strahle, U. Toxicity of mercury: Molecular evidence. Chemosphere 2020, 245, 125586. [Google Scholar] [CrossRef]
- Dong, T.; Li, H. Neurological risks arising from the bioaccumulation of heavy metal contaminants: A focus on mercury. Environ. Toxicol. 2024, early view. [Google Scholar] [CrossRef]
- UN Environment. Global Mercury Assessment 2018; UN Environment Programme, Chemicals and Health Branch: Geneva, Switzerland, 2019. [Google Scholar]
- Grant, N. Legacy of the mad hatter. Environment 1969, 11, 18–44. [Google Scholar] [CrossRef]
- Waldron, H.A. Did the Mad Hatter have mercury poisoning? Br. Med. J. 1984, 287, 324–325. [Google Scholar] [CrossRef]
- Barret, J.R. An uneven path forward: The history of methylmercury toxicity research. Environ. Health Perspect. 2010, 118, A352–A353. [Google Scholar] [CrossRef] [PubMed]
- Manstromonaco, M.N. Mercury Cycling in the Global Marine Environment. Ph.D. Thesis, Chalmers University of Technology, Göteborg, Sweden, 2016. [Google Scholar]
- Woolf, A.D. Three methylmercury poisoning disasters. In History of Morden Clinical Toxicology; Academic Press: London, UK, 2022; pp. 15–33. [Google Scholar]
- Manay, N. Mercury tragedies: Incidents and effects. Encycl. Toxicol. 2024, 6, 129–139. [Google Scholar]
- Bloom, J. Two Drops of Death: Dimethylmercury. American Council on Science and Health. 2016. Available online: www.acsh.org/news/2016/06/06/two-drops-of-death-dimethylmercury (accessed on 16 March 2020).
- Minamata Convention on Mercury. United Nations Environment Programme (UNEP). 2013. Available online: https://www.mercuryconvention.org/countires/parties (accessed on 16 March 2020).
- Pacyna, E.G.; Pacyna, J.M.; Fudala, J.; Strzelecka-Jastrzab, E.; Hlawiczka, S.; Panasiuk, D. Mercury emissions to the atmosphere from anthropogenic sources in Europe in 2000 and their scenarios until 2020. Sci. Total Environ. 2006, 370, 147–156. [Google Scholar] [CrossRef] [PubMed]
- Pacyna, E.G.; Pacyna, J.M.; Sundseth, K.; Munthe, J.; Kindbom, K.; Wilson, S.; Steenhuisen, F.; Maxon, P. Global emission of mercury to the atmosphere from anthropogenic sources in 2005 and projections to 2020. Atmos. Environ. 2010, 44, 2487–2499. [Google Scholar] [CrossRef]
- Driscoll, C.J.; Mason, R.P.; Chan, H.M.; Jacob, D.J.; Pirrone, N. Mercury as global pollutant: Sources, pathways and effects. Environ. Sci. Technol. 2013, 47, 4967–4983. [Google Scholar] [CrossRef] [PubMed]
- Gustin, M.S.; Dunham-Cheatham, S.M.; Huang, J. Development of an understanding of reactive mercury in ambient air: A review. Atmosphere 2021, 12, 73. [Google Scholar] [CrossRef]
- Li, X.; Zhang, R.; Tripathee, L.; Yu, F.; Guo, J.; Yang, W.; Guo, J.; Kang, S.; Cao, J. Characteristics, sources, and health risk assessment of atmospheric particulate mercury in Guanzhong Basin. Environ. Pollut. 2024, 342, 123071. [Google Scholar] [CrossRef] [PubMed]
- Pandey, S.K.; Kim, K.; Brown, R.J.C. Measurement techniques for mercury species in ambient air. Trends Anal. Chem. 2011, 30, 899–917. [Google Scholar] [CrossRef]
- Berdonces, M.A.; Higueras, P.L.; Fernandez-Pascual, M.; Borreguero, A.M.; Carmona, M. The role of native lichens in the biomonitoring of gaseous mercury at contaminated sites. J. Environ. Manag. 2017, 186, 207–213. [Google Scholar] [CrossRef]
- Svanberg, S. Monitoring atmospheric atomic mercury by optical techniques. Atmosphere 2023, 14, 1124. [Google Scholar] [CrossRef]
- Božič, D.; Horvat, M. Insights into seasonal variations in mercury isotope composition of lichens. Environ. Pollut. 2024, 340, 122740. [Google Scholar] [CrossRef]
- Vannini, A.; Nicolardi, V.; Bargagli, R.; Loppi, S. Estimating atmospheric mercury concentrations with lichens. Environ. Sci. Technol. 2014, 48, 8754–8759. [Google Scholar] [CrossRef]
- Bargagli, R. Moss and Lichen biomonitoring of atmospheric mercury: A review. Sci. Total Environ. 2016, 572, 216–231. [Google Scholar] [CrossRef]
- Popa, M.M.C.; Rusănescu, C.O. The Efficiency of lichens in air biomonitoring in Teleorman County. Atmosphere 2023, 14, 1287. [Google Scholar] [CrossRef]
- Williams, L.; Colesie, C.; Ullmann, A.; Westberg, M.; Wedin, M.; Büdel, B. Lichen acclimation to changing environments: Photobiont switching vs. climate-specific uniqueness in Psora decipiens. Ecol. Evol. 2017, 7, 2560–2574. [Google Scholar] [CrossRef] [PubMed]
- Huang, J.; Lyman, S.N.; Hartman, J.S.; Gustin, M.S. A review of passive sampling systems for ambient mercury measurements. Environ. Sci. Process. Impacts 2014, 16, 374–392. [Google Scholar] [CrossRef]
- Harper, M.; Purnell, C. Diffuse sampling-a review. Am. Ind. Hyg. Assoc. J. 1987, 48, 214–218. [Google Scholar] [CrossRef]
- Darkey, D.; Visagie, J. The more things change the more they remain the same: A study on the quality of life in an informal township in Tshwane. Habitat Int. 2013, 39, 302–309. [Google Scholar] [CrossRef]
- Sebeiwa, M.M. Characterisation of Dust Fallout around the City of Tshwane (COT), Gauteng, South Africa. Master’s Thesis, University of South Africa, Pretoria, South Africa, 2016. Available online: https://core.ac.uk/download/pdf/43178385.pdf (accessed on 5 February 2024).
- Sholupov, S.; Pogarev, S.; Ryzhov, V.; Mashyanov, N.; Stroganov, A. Zeeman atomic absorption spectrometer RA-915+ for direct determination of mercury in air and complex matrix samples. Fuel Process. Technol. 2004, 85, 473–485. [Google Scholar] [CrossRef]
- Huang, R.J.; Zhuang, Z.H.X.; Wang, Y.R.; Huang, Z.H.Y.; Wang, X.R.; Lee, F.S.C. An analytical study of bioaccumulation and the binding forms of mercury in rat body using thermolysis coupled with atomic absorption spectrometry. Anal. Chim. Acta 2005, 538, 313–321. [Google Scholar] [CrossRef]
- Lodenius, M.; Tulisalo, E.; Soltanpour-Gargari, A. Exchange of mercury between atmosphere and vegetation under contaminated conditions. Sci. Total Environ. 2003, 304, 169–174. [Google Scholar] [CrossRef]
- Shivastava, A.; Gupta, V. Methods for the determination of limit of detection and limit of quantification of analytical methods. Chron. Young Sci. 2011, 2, 21. [Google Scholar] [CrossRef]
- Post, W.; Worschischek, E. Method of Electrochemically Etching Aluminium. U.S. Patent 3,249,523, 1966. [Google Scholar]
- Louvis, E.; Fox, P.; Stcliffe, C.J. Selective laser melting of aluminium components. J. Mater. Process. Technol. 2011, 211, 275–284. [Google Scholar] [CrossRef]
- Rahimi, M.; Fojan, P.; Gurevich, L.; Afshari, A. Effects of aluminium surface morphology and chemical modification on wettability. Appl. Surf. Sci. 2014, 296, 124–132. [Google Scholar] [CrossRef]
- Coade, R.; Coldham, D. The interaction of mercury and aluminium in heat exchangers in a natural gas plants. Int. J. Press Vessel. Pip. 2006, 83, 336–342. [Google Scholar] [CrossRef]
- Bessone, J.B. The activation of aluminium by mercury ions in non-aggressive media. Corr. Sci. 2006, 48, 4243–4256. [Google Scholar] [CrossRef]
- Wegman, R.F.; Van Twisk, J. Surface Preparation Techniques for Adhesive Bonding, 2nd ed.; William Andrew: New York, NY, USA, 2013. [Google Scholar]
- Kendig, M.W.; Buchheit, R.G. Corrosion Inhibition of aluminum and aluminum alloys by soluble chromates, chromate coatings, and chromate-free coatings. Corrosion 2003, 59, 379–400. [Google Scholar] [CrossRef]
- Rimondi, V.; Benesperi, R.; Beutel, M.W.; Chiarantini, L.; Costagliola, P.; Lattanzi, P.; Medas, D.; Morelli, G. Monitoring of airborne mercury: Comparison of different techniques in the Monte Amiata District, Southern Tuscany, Italy. Int. J. Environ. Res. Public Health 2020, 17, 2353. [Google Scholar] [CrossRef] [PubMed]
- Klos, A.; Rajfur, M.; Sramek, I.; Waclawek, M. Mercury concentration in lichen, moss and soil samples collected from the forest areas of Poland and Glacensis Euroregions (Poland and Czech Republic). Environ. Monit. Assess. 2012, 184, 6765–6774. [Google Scholar] [CrossRef] [PubMed]
- Krishna, M.V.B.; Krarunasagar, D.; Arunachalam, J. Study of mercury pollution near a thermometer factory using lichens and mosses. Environ. Pollut. 2003, 24, 357–360. [Google Scholar] [CrossRef] [PubMed]
- True, A.; Panichev, N.; Okonkwo, J.; Forbes, P.B.C. Determination of the mercury contentment of lichens and comparison to atmospheric mercury levels in South African Highveld region. Clean Air J. 2012, 21, 19–21. [Google Scholar] [CrossRef]
- Panichev, N.; Mokgalaka, N.; Panicheva, S. Assessment of air pollution by mercury in South African provinces using lichens Parmelia caperata as bioindicators. Environ. Geochem. Health 2019, 41, 2239–2250. [Google Scholar] [CrossRef] [PubMed]
- Mclagan, D.S.; Mazur, M.E.E.; Mitchel, C.P.P.; Wania, F. Passive air sampling of gaseous elemental mercury: A critical review. Atmos. Chem. Phys. 2016, 16, 3061–3076. [Google Scholar] [CrossRef]
- Zhang, W.; Tong, Y.; Hu, D.; Ou, L.; Wang, X. Characterization of atmospheric mercury concentrations along an urban-rural gradient using a newly developed passive sampler. Atmos. Environ. 2012, 47, 26–32. [Google Scholar] [CrossRef]
- Brown, R.J.C.; Burdon, M.K.; Brown, A.S.; Kim, K.H. Assessment of pumped mercury vapour adsorption tubes as passive samplers using a micro-exposure chamber. J. Environ. Monit. 2012, 14, 2456–2463. [Google Scholar] [CrossRef]
Figure 1.
Map of the study location, City of Tshwane Metropolitan Municipality [34].
Figure 1.
Map of the study location, City of Tshwane Metropolitan Municipality [34].

Figure 2.
Labelled schematic diagram mercury chamber containing Al powder bags, Al foils, fan and Petri dish with Hg drop.
Figure 2.
Labelled schematic diagram mercury chamber containing Al powder bags, Al foils, fan and Petri dish with Hg drop.

Figure 3.
SEM micrographs of Al foil treated with different etch solutions: (A) blank, (B) NaOH, (C) HCl and (D) H2CrO4.
Figure 3.
SEM micrographs of Al foil treated with different etch solutions: (A) blank, (B) NaOH, (C) HCl and (D) H2CrO4.

Figure 4.
Analytical signal peak of Hg that was accumulated in Al foil after its treatment with HCl and exposed to Hg atmosphere in a mercury chamber for a period of 7 days (A), 14 days (B) and 21 days (C).
Figure 4.
Analytical signal peak of Hg that was accumulated in Al foil after its treatment with HCl and exposed to Hg atmosphere in a mercury chamber for a period of 7 days (A), 14 days (B) and 21 days (C).

Figure 5.
Hg accumulation by Al powder as a function of time: (A) 0 to 8 h, (B) 0 to 48 h and (C) 0 to 336 h.
Figure 5.
Hg accumulation by Al powder as a function of time: (A) 0 to 8 h, (B) 0 to 48 h and (C) 0 to 336 h.

Figure 6.
Thermopeaks of the accumulated Hg content in Al powder after its treatment with H2CrO4 and exposure to Hg atmosphere for a defined period: (A) 1 h, (B) 2 h, (C) 3 h and (D) 4 h.
Figure 6.
Thermopeaks of the accumulated Hg content in Al powder after its treatment with H2CrO4 and exposure to Hg atmosphere for a defined period: (A) 1 h, (B) 2 h, (C) 3 h and (D) 4 h.


Table 1.
Results of the determination of Hg in certified reference materials.
| Reference Material | Measured Value (ng g−1) | Certified Value (ng g−1) |
|---|---|---|
| SARM 20 | 247 ± 11 | 250 ± 30 |
| SRM 1515 | 44 ± 0.9 | 44 ± 4 |
Table 2.
The results of replicate Hg determinations in Al blank powder samples.
| Mass of Al Powder (mg) | Hg Concentration (ng g−1) |
|---|---|
| 128 | 58 ± 4 |
| 130 | 63 ± 8 |
| 129 | 55 ± 3 |
| 124 | 60 ± 5 |
| 130 | 62 ± 5 |
| 128 | 56 ± 3 |
| 132 | 55 ± 4 |
| 129 | 66 ± 4 |
| 143 | 58 ± 3 |
| 140 | 61 ± 4 |
| Mean ± SD | 59.4 ± 3.66 |
Table 3.
Mercury mass accumulation on treated Al foil.
| Exposure Time, Days | a [Hg], ng g−1 | b [Hg], ng g−1 | c [Hg], ng g−1 |
|---|---|---|---|
| 0 | 0.6 ± 0.01 | 0.6 ± 0.01 | 0.6 ± 0.01 |
| 7 | 13 ± 0.04 | 17 ± 0.06 | 27 ± 0.10 |
| 14 | 24 ± 0.09 | 36 ± 0.10 | 58 ± 0.64 |
| 21 | 36 ± 0.38 | 66 ± 1.2 | 107 ± 2.3 |
a Accumulation on Al foil treated with NaOH. b Accumulation on Al foil treated with HCl. c Accumulation on Al foil treated with H2CrO4.
Table 4.
Mercury in Al powder samples exposed to atmospheric air, Tshwane Metropolitan Municipality.
Table 4.
Mercury in Al powder samples exposed to atmospheric air, Tshwane Metropolitan Municipality.
| Location | Deployment Period, Months | Hg0 Concentration, ng g−1 | ||
|---|---|---|---|---|
| Pretoria CBD | 6 | 105 a | 109 b | 107 ± 1.4 c |
| 10 | 110 a | 115 b | 113 ± 1.8 c | |
| Centurion | 6 | 108 a | 111 b | 110 ± 1.2 c |
| 10 | 136 a | 140 b | 138 ± 1.4 c | |
| Gezina | 6 | 110 a | 113 b | 112 ± 1.4 c |
| 10 | 139 a | 145 b | 141 ± 2.1 c | |
| Hammanskraal | 6 | 119 a | 123 b | 121 ± 1.4 c |
| 10 | 148 a | 160 b | 155 ± 3.9 c | |
a Minimum, b maximum, c mean ± SD.
Disclaimer/Publisher’s Note: The statements, opinions and data contained in all publications are solely those of the individual author(s) and contributor(s) and not of MDPI and/or the editor(s). MDPI and/or the editor(s) disclaim responsibility for any injury to people or property resulting from any ideas, methods, instructions or products referred to in the content. |
© 2024 by the authors. Licensee MDPI, Basel, Switzerland. This article is an open access article distributed under the terms and conditions of the Creative Commons Attribution (CC BY) license (https://creativecommons.org/licenses/by/4.0/).
Share and Cite
MDPI and ACS Style
Modise, I.M.; Panichev, N.; Mandiwana, K.L. The Application of Aluminium Powder as an Accumulation Medium of Mercury from Air. Atmosphere 2024, 15, 368. https://doi.org/10.3390/atmos15030368
AMA Style
Modise IM, Panichev N, Mandiwana KL. The Application of Aluminium Powder as an Accumulation Medium of Mercury from Air. Atmosphere. 2024; 15(3):368. https://doi.org/10.3390/atmos15030368
Chicago/Turabian StyleModise, Innocentia M., Nikolai Panichev, and Khakhathi L. Mandiwana. 2024. "The Application of Aluminium Powder as an Accumulation Medium of Mercury from Air" Atmosphere 15, no. 3: 368. https://doi.org/10.3390/atmos15030368
Note that from the first issue of 2016, this journal uses article numbers instead of page numbers. See further details here.