Article

Regionalization of the Onset and Offset of the Rainy Season in Senegal Using Kohonen Self-Organizing Maps

1
Laboratoire de Physique de l’Atmosphère et de l’Océan-Siméon Fongang (LPAO-SF), École Supérieure Polytechnique, Université Cheikh Anta Diop, Dakar 10700, Senegal
2
Department of Computer Science, UFR of Sciences and Technologies, Université Iba Der THIAM de Thiès, Thies 21000, Senegal
3
Laboratoire d’Océanographie et du Climat: Expérimentations et Approches Numériques, Institut Pierre Simon Laplace, SU/IRD/CNRS/MNHN, UMR 7159, 75005 Paris, France
*
Authors to whom correspondence should be addressed.
Atmosphere 2024, 15(3), 378; https://doi.org/10.3390/atmos15030378
Submission received: 16 January 2024 / Revised: 27 February 2024 / Accepted: 1 March 2024 / Published: 20 March 2024
(This article belongs to the Special Issue Statistical Approaches in Climatic Parameters Prediction)

Abstract

:
This study explores the spatiotemporal variability of the onset, end, and duration of the rainy season in Senegal. These phenological parameters, crucial for agricultural planning in West Africa, exhibit high interannual and spatial variability linked to precipitation. The objective is to detect and spatially classify these indices across Senegal using different approaches. Daily precipitation data and ERA5 reanalyses from 1981 to 2018 were utilized. The employed method enables the detection of key dates. Subsequently, the Kohonen algorithm spatially classifies these indices on topological maps. The results indicate a meridional gradient of the onset, progressively later from the southeast to the northwest, whereas the end follows a north–south gradient. The duration varies from 45 days in the north to 150 days in the south. The use of self-organizing maps allows for classifying the onset, end, and duration of the season into four zones for the onset and end, and three zones for the duration of the season. They highlight the interannual irregularity of transitions, with both early and late years. The dynamic analysis underscores the complex influence of atmospheric circulation fields, notably emphasizing the importance of low-level monsoon flux. These findings have tangible implications for improving seasonal forecasts and agricultural activity planning in Senegal. They provide information on the onset, end, and duration classes for each specific zone, which can be valuable for planning crops adapted to each region.

1. Introduction

The West African Monsoon (WAM) plays a crucial role in the socio-economic landscape of the region, particularly in countries like Senegal, where rain-fed agriculture is a cornerstone of rural livelihoods. The variability of the WAM profoundly impacts agricultural productivity and food security, as highlighted in [1] and numerous other studies [2,3,4,5,6,7]. Approximately 60% of the Senegalese population depends on agriculture and livestock, making them highly vulnerable to the spatiotemporal dynamics of precipitation [8,9,10,11]. The erratic nature of precipitation, characterized by interannual variability, poses formidable challenges for farmers, especially in determining optimal planting times and navigating the growing season [12,13,14]. Even slight delays or “false starts” in precipitation patterns can have disastrous consequences for crop yields [14]. Therefore, precise delineation of the start and cessation dates of the rainy season is indispensable for agricultural planning and risk management [1,4,15]. Despite the importance of these events, the precise detection of the onset and end of the rainy season remains a daunting task, especially in regions characterized by spatial and temporal variability in precipitation [12,13]. Traditional methods relying on fixed precipitation thresholds are often insufficient due to the spatiotemporal complexity of the monsoon phenomenon, from its regional atmospheric dynamics to its highly localized effects [16]. Thus, these approaches heavily depend on the spatial and temporal scales of the meteorological processes considered and are summarized in three major approaches. At the climatologist’s scale (regional scale with a spatial extension of about 2500 to 10,000 km), the onset corresponds to the seasonal migration of the monsoon system from Guinean latitudes (5° N) to Sahelian latitudes (10 to 15° N). According to [16], the onset of the rainy season can be estimated using zonal indices based on either deep convection assessed through a threshold of outgoing longwave radiation (OLR) or observed precipitation [17]. From the hydrologist’s perspective, i.e., at the mesoscale, with a spatial extension on the order of 10 to 1000 km, the definition is based on the occurrence of the first organized convective system generating rainfall in the Sahelian region [18]. From the agronomist’s viewpoint, i.e., at the local scale, with a spatial extension ranging from 1 to 10 km, the definition of the onset is based on the first beneficial rains recorded at the scale of a station or a plot [12,13]. This agronomic definition of the onset at the local scale is the most relevant for agricultural management. It relies on daily local precipitation, using empirical precipitation thresholds that ensure sufficient soil moisture during planting and growing periods to avoid poor harvests [19,20]. Agronomic definitions vary considerably, with different thresholds for the duration of the first wet period, the amount of rainfall during this period, the duration of the subsequent dry period, and the subsequent search period for the dry season [20,21,22,23]. Moreover, other approaches explicitly rely on the water retention capacity of different soil types to determine precipitation requirements [14,24,25]. The definitions reflect the spatiotemporal complexity of the monsoon, from its regional atmospheric dynamics to its highly localized effects. However, traditional approaches based on predefined thresholds are limited, failing to account for the full spatial variability of precipitation. Improving our understanding of this variability is crucial for better predictability of the start and end dates. In response to these challenges, our study aims to detect and regionalize the onset and end dates of the rainy season in West Africa, with a particular focus on Senegal. By leveraging agronomic methods and machine learning techniques, we seek to overcome the limitations of conventional approaches and provide more precise characterizations of these critical meteorological events. Using Kohonen self-organizing maps (SOMs), we aim to offer an innovative framework for classifying and/or regionalizing rainy season events based on historical and spatial data. Kohonen self-organizing maps (SOMs) [26] offer a promising alternative for the classification of meteorological events [27]. In Section 2 of this article, we describe the datasets and methodology used. We then analyze and discuss the results in Section 3. In Section 4, a dynamic analysis is conducted to better characterize the start and end of the rainy season. Finally, we present the conclusions and perspectives of this study in Section 5.

2. Materials and Methods

2.1. Materials

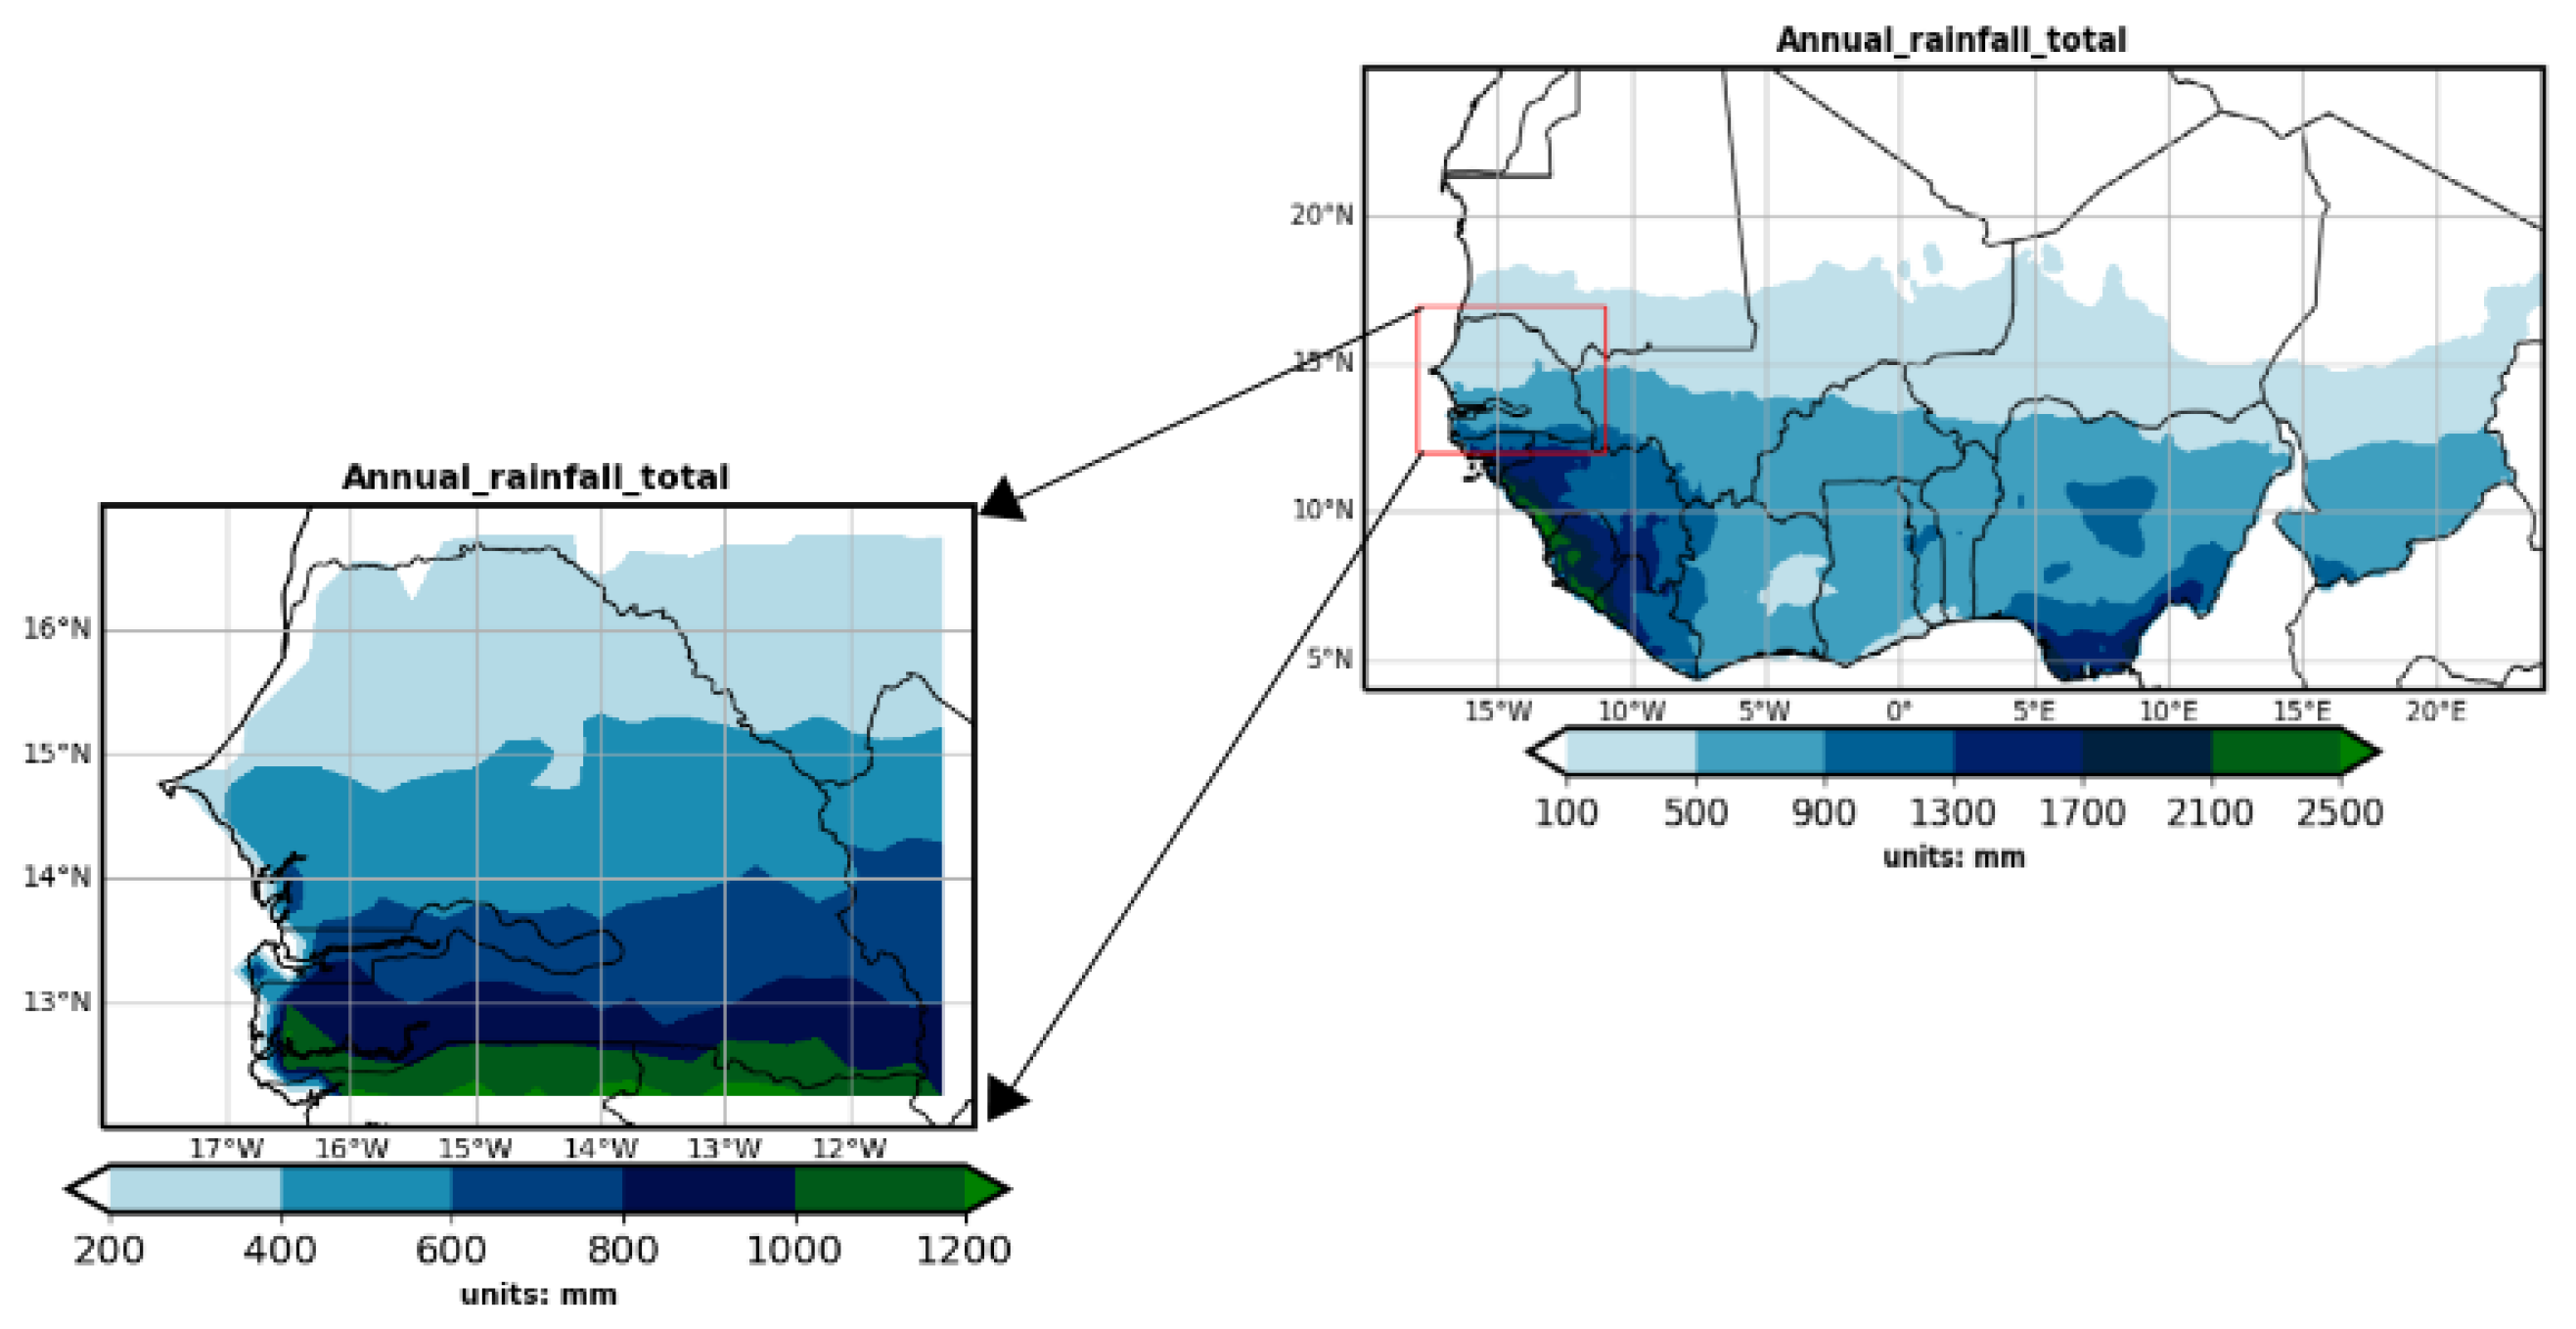
2.1.1. Geographical Information of Senegal

Senegal is located in the western part of West Africa between latitudes 12° 8 and 16° 41 north and longitudes 11° 21 and 17° 32 west (highlighted by the red square in Figure 1). It is characterized by two main seasons: a dry season from November to April/May, marked by the predominance of maritime trade winds in the west and continental trade winds in the interior, and a rainy season from May/June to October, dominated by the flow of the West African Monsoon [16,28,29]. The maximum rainfall is received in August and September, coinciding with the period during which the Intertropical Convergence Zone (ITCZ) reaches its northernmost position above Senegal [16,30]. Figure 1 illustrates the spatial distribution of the annual cumulative precipitation in West Africa, along with the area of interest (depicted by the rectangle encompassing Senegal). A north–south precipitation gradient can be observed, with higher values in the south that decrease as one moves northward.

2.1.2. Satellites and Reanalyses

Precipitation data from the Climate Hazards Group Infrared Precipitation with Stations (CHIRPS) are used with a spatial resolution of 0.05° × 0.05° in longitude and latitude [31] to calculate the onset and end dates of the rainy season. These data are provided by the USGS (United States Geological Survey) to FEWSNET (Famine Early Warning Systems Network) and used by the Regional AGRHYMET Center (Agronomy, Hydrology, Meteorology). CHIRPS is a dataset that combines ground observation data and satellite observations, and it has been used to produce daily and monthly rainfall estimates across the globe from 1981 to the present. CHIRPS data are freely available and provided in Network Common Data Form (NetCDF) format. CHIRPS data have been validated against various precipitation observation data, with the results indicating good performance for drought monitoring [18,32]. According to previous research [33], CHIRPS data show significant consistency with widely used satellite products, such as CMORPH [34], TMPA [35], PERSIANN [36], and TRMM [35], across different time scales, including decadal, monthly, and seasonal, in West Africa. The aforementioned studies found reasonable agreement in seasonal trends (1981-2015) for mean precipitation, number of rainy days, precipitation intensity, and mean length of dry spells when comparing CHIRPS data with daily rain gauge data from 18 stations across the Sahel and Guinea Coast, as documented in [37]. One exception was noted along the Guinea Coast, where, unlike the rain gauge data, the CHIRPS data indicated a trend toward more (or less) frequent and less (or more) intense rainfall over both rainy seasons (notably during the first rainy season). More recently, Ref. [2] used the CHIRPS data to determine the onset and cessation dates of the rainy season in Senegal. Their results showed strong spatiotemporal variability, with a south–north gradient of the onset and end dates of the season. To detect the atmospheric conditions associated with these events, the fifth generation of ERA5 atmospheric reanalyses from ECMWF, covering the global climate from 1940 to the present, were used. ERA5 is produced by the Copernicus Climate Change Service (C3S) of ECMWF. The data cover the Earth on a 25 km horizontal resolution. ERA5 includes uncertainty information for all variables at reduced spatial and temporal resolutions.

2.1.3. Daily Database for Senegal

The database of the National Hydrological and Meteorological Services (NHMS) consists of four national datasets (Burkina Faso, Ghana, Benin, and Senegal), covering the period from 1960 to 2010, with data availability between 1970 and 2010 reaching approximately 85% [38]. The largest subset of the NHMS database is Burkina Faso’s subset (NHMS-BF), which includes 142 chronological series of precipitation. This dataset includes information from synoptic (10), climatic (10), agrometeorological (17), and autonomous (105) rain gauges. The Senegalese subset (NHMS-SN) represents the most comprehensive database of NHMS-P, with data availability reaching nearly 100% for 20 stations over a 50-year period [38]. These findings, as presented in [38], corroborate our conclusions from the quality analysis depicted in Figure S2b supplementary Materials. Additionally, the 20 chronological series of precipitation from Senegalese rain gauges (NHMS-SN) were used to validate the CHIRPS data. To align with the CHIRPS data, we utilized NHMS data for the period from 1981 to 2010.

2.2. Methods

2.2.1. Determining the Onset and Offset of the Rainy Season

In this study, a day is classified as rainy if precipitation exceeding 1 mm is recorded, whereas it is considered a dry spell if it receives less than 1 mm of precipitation. This 1 mm threshold was deemed more relevant to avoid errors associated with light precipitation [39]. This criterion was also utilized for the Sahel in [6,40] and for Senegal in [4]. We adopted the method in [12] with the adjustments proposed in [13] to determine the onset and offset dates, as well as the length of the rainy season, for the period 1981–2018. According to [12], the onset date of rain is defined as the first day after May 1st when the cumulative precipitation over 3 consecutive days reaches at least 20 mm and no dry spell exceeds 7 days within the next 30 days. Based on this method, Ref. [13] defined the onset date of the season from May 1st as the first day of a wet sequence of 4 days accumulating at least 20 mm of rain, not followed by a dry spell of more than 10 consecutive days in the 20 days following the onset. Thus, the agronomic cessation date (offset) of the rainy season is determined as the last day (+1) of a wet sequence of 4 consecutive days receiving at least 20 mm, without being preceded by a dry spell of more than 10 consecutive days in the 20 days preceding it. The cumulative rainfall threshold of 20 mm was adopted following experimental studies conducted by the International Crops Research Institute for the Semi-Arid Tropics (ICRISAT) on millet cultivation in Niger [12,41]. This amount of rainfall appears to correspond to the water requirements for crop survival. The duration of the rainy season is calculated by taking the difference between the onset and cessation dates of the rainy season, as defined above.
The coefficient of variation ( C V ) serves as a statistical measure of the relative dispersion of a dataset concerning its mean. In the context of precipitation variables, it is defined as the statistical measure of the variation in seasonal cumulative precipitation based on climatology. A higher C V value indicates greater interannual variability. The variability of rainfall events is typically classified as low ( C V < 20 ) , moderate ( 20 < C V < 30 ) , or high ( C V > 30 ) according to the literature [2]. In this study, the CV is employed to assess the dispersion of the onset, offset, and rainy season duration dates concerning their respective means. It is defined as the ratio of the standard deviation to the mean, expressed as a percentage. The formula is as follows:
C V = Standard Deviation Mean × 100

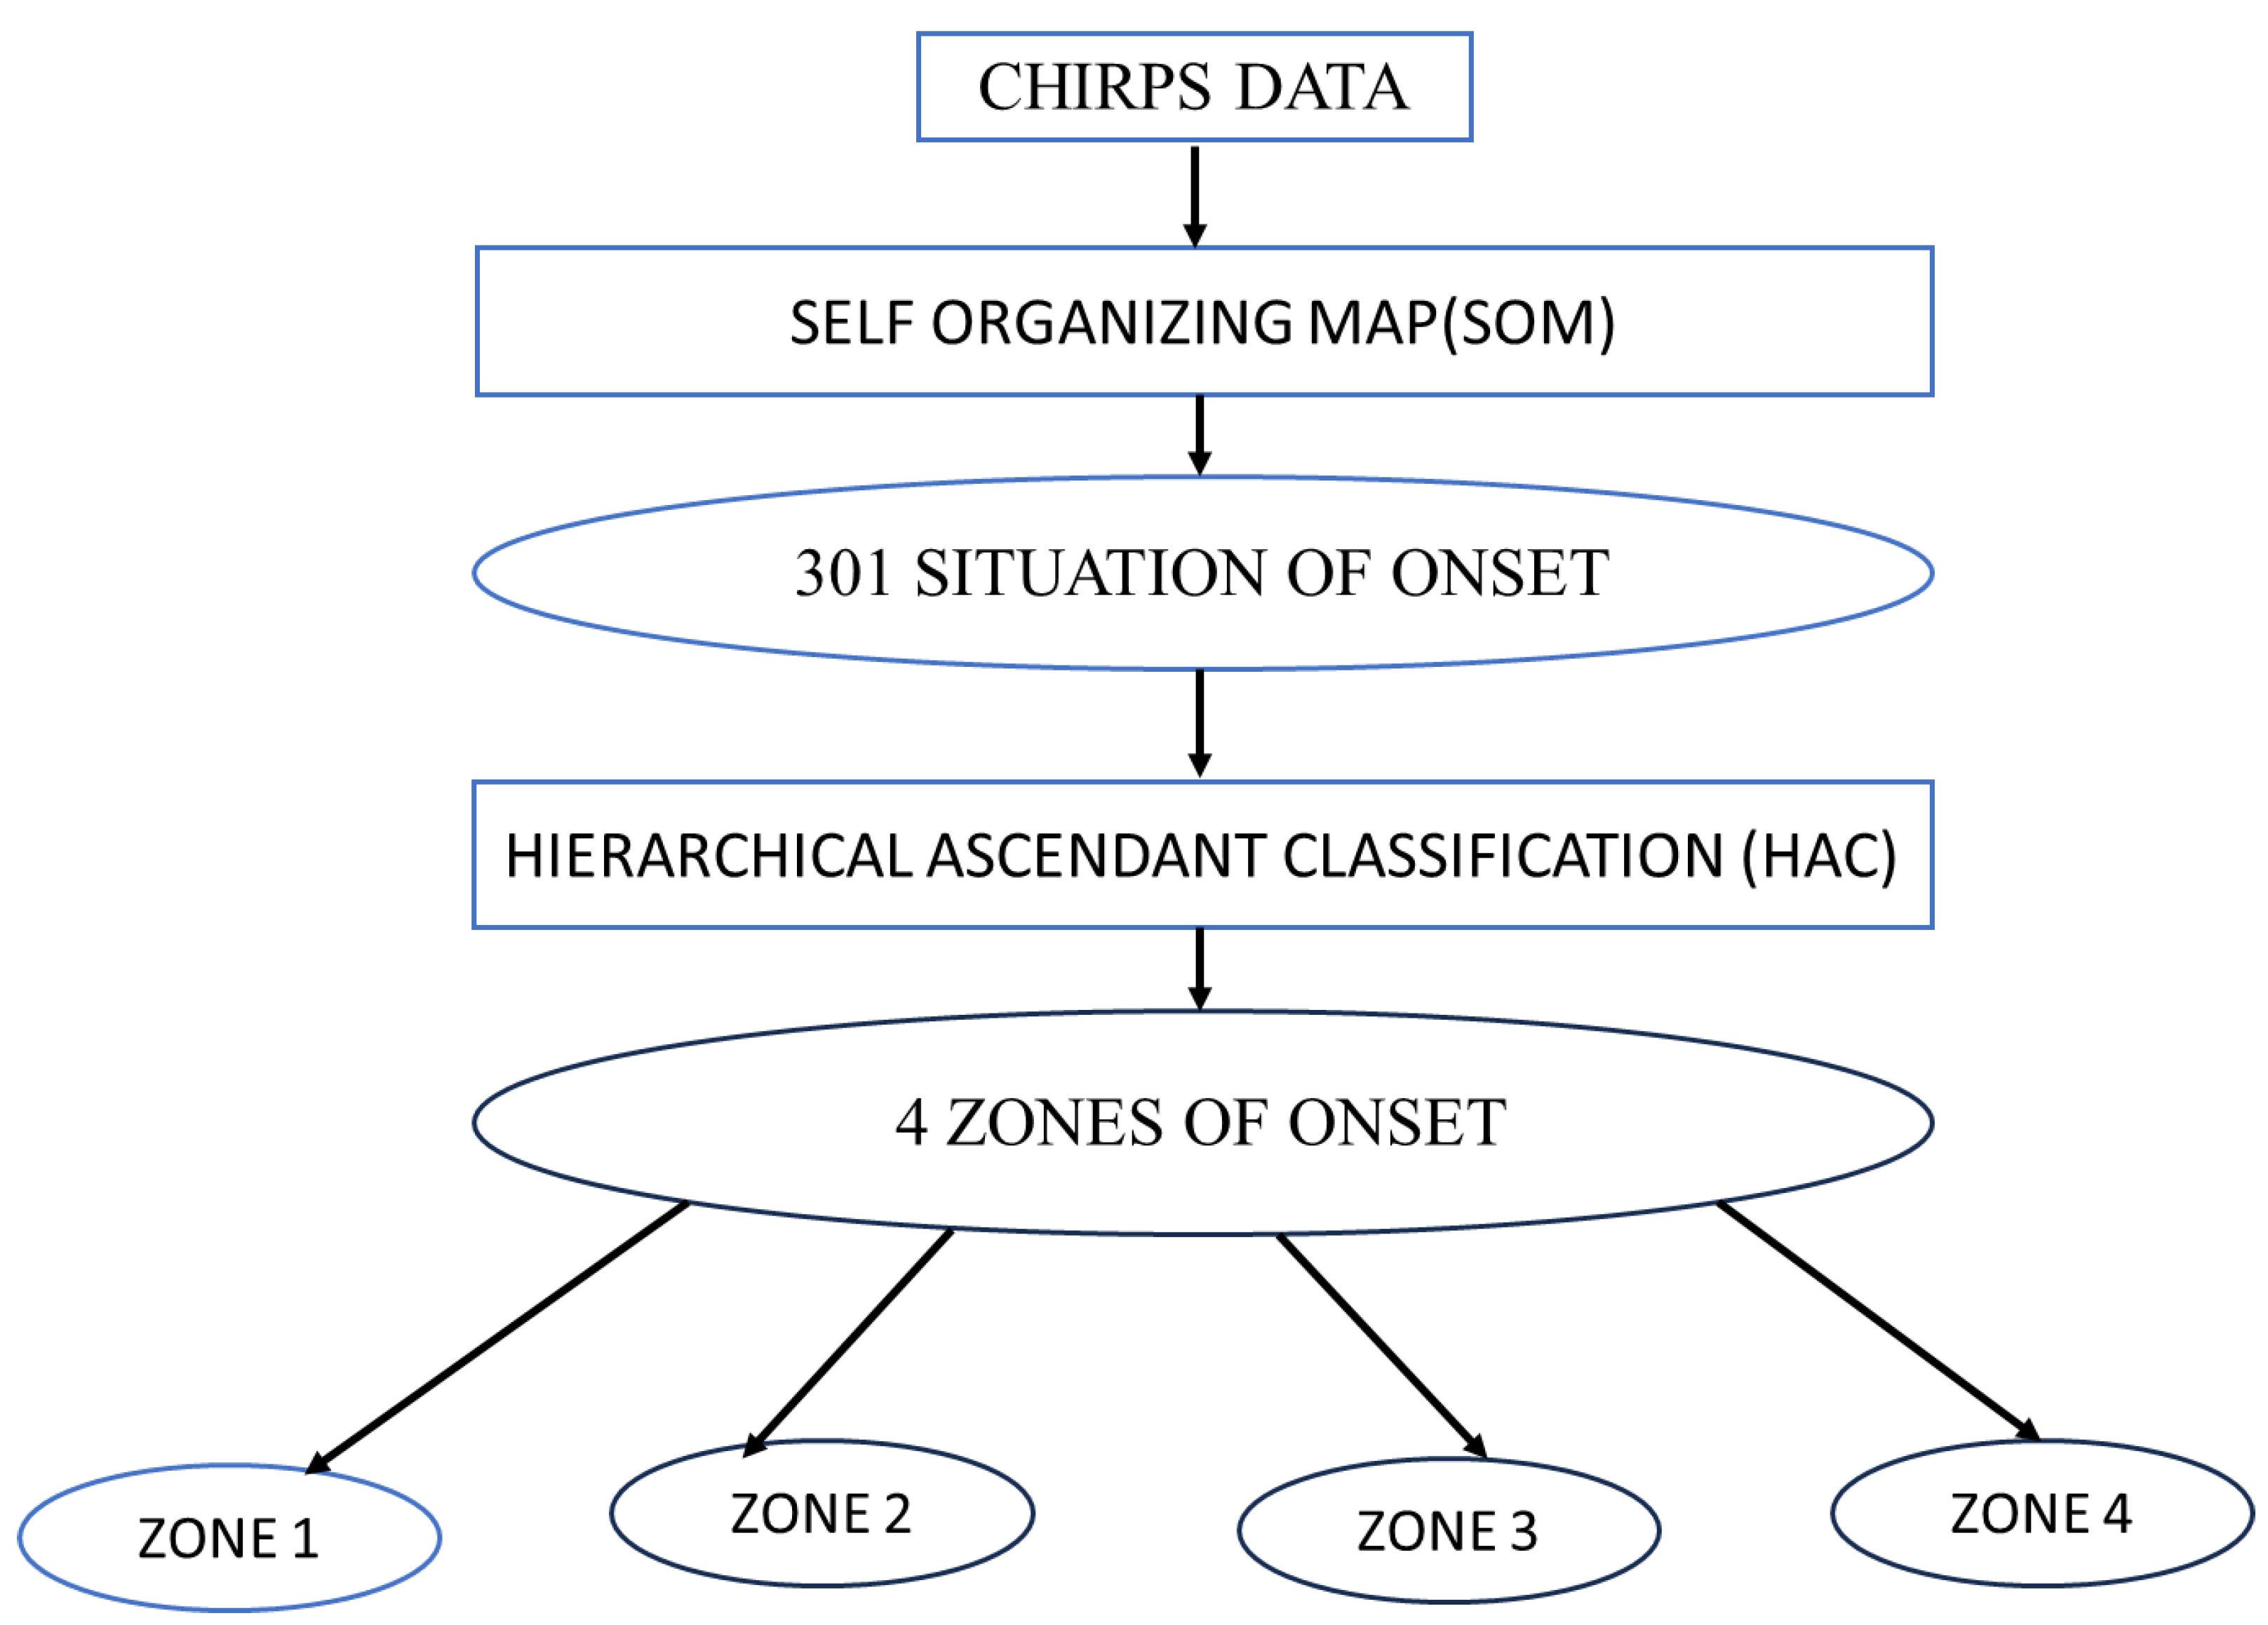
2.2.2. Self-Organizing Maps Method

Topological or self-organizing maps are part of the family of neural methods, falling under the category of “unsupervised learning”. This implies that initially, these methods are used for descriptive purposes. The data to be analyzed consist of observations for which the structure is sought: there is no specific goal to achieve, nor a desired response [26]. The purpose of these maps is to represent multidimensional observations Z in a discrete space of low dimension (usually 1D or 2D), commonly referred to as a topological map. In these methods, each class is represented by a neuron characterized by a so-called reference vector. The presentation of the Kohonen algorithm helps to understand the methodology employed in this work. A Kohonen network consists of 2 layers: the first, called the input layer, is used for presenting observations and contains exactly n cell(s), where n is the dimension of the observation space; the second, called the adaptation layer, is formed by the lattice of cells comprising the topological map. Note that the algorithm seeks a partition of the set z into κ subsets in such a way that each cell c of the map is connected to a cell (or observation) of the input layer j. This connection is quantified by a synaptic weight called w i j . Each subset, denoted as i C , is associated with a vector referred to as a reference or representative, defined in the same space as the data in set z. Let W = { w c ; c = 1 , , K } be the set of reference vectors. In the case of vector quantization methods, the partition C is often defined by an assignment function χ that determines the subsets c of the partition C such that c = { z i Ƶ / χ ( z i ) = c } . The set C consists of a set of interconnected neurons, and the connection between neurons is established through an underacted graph structure. The structure of the map C is induced by an often discrete distance α on C , defined as the length of the shortest path. For each neuron c C , the distance δ allows for defining the concept of a neighborhood d of order c:
V c ( d ) = { r C | δ ( c , r ) d }
More precisely, the connection between two neurons, r and c, in the map C is introduced by a positive and symmetric kernel function κ such that lim x κ ( x ) = 0 . This kernel function defines an influence zone around each neuron C on the map { r , κ ( δ ( c , r ) ) < α } , where α is the activation threshold of a neuron considered part of the neighborhood C . In the literature, there are several ways to define this function κ . The kernel function used is the threshold neighborhood function: cells within the neighborhood have the same influence, whereas outside the neighborhood, they have none: κ T ( δ ) = 1 if δ < T 0 else .
At the end of the learning process, each cell c of the topological map is characterized by a neuron defined by a set composed of the reference vector w c and the cluster of observations it represents. The topological maps algorithm aims to minimize the following generalized cost function:
J SOM T ( χ , W ) = z i Z c C κ T ( δ ( c , χ ( z i ) ) ) z i w c 2
The function J SOM T is an extension of the cost function in k-means, where the Euclidean distance between an observation z i and its reference w χ ( z i ) is replaced with a weighted distance d T representing the weighted sum of Euclidean distances z i from each of the reference vectors w c in the neighborhood of influence of the neuron χ ( z ) .
d T ( z i , w x ( z i ) ) = c C K T ( δ ( c , χ ( z i ) ) ) z i w c 2
In our study, we observed that self-organizing maps (SOMs) can be employed for various purposes, particularly in climate research [42], despite their initial application in statistical research. SOMs are well suited for the problem we are addressing, exhibiting a higher discriminative power for separating different classes compared to Empirical Orthogonal Functions (EOFs) [43] or the k-means algorithm [44]. This is attributed to the topological constraint between different classes. Additionally, SOMs can handle non-linear aspects of the phenomenon under analysis, unlike EOFs, which primarily address linear aspects of the phenomenon [45].
Further details regarding SOMs and their advantages over other classification methods such as k-means can be found in the literature (e.g., [44,46,47,48,49]). For instance, Ref. [45] compared the feature extraction performance of techniques such as SOMs and EOFs using representative artificial data from known models. It was demonstrated that SOMs could extract patterns from a linearly progressing sinusoidal wave, similar to EOFs, even in the presence of added noise. Thus, SOM applications are becoming increasingly valuable in the geosciences field and have proven to be an efficient feature extraction technique with numerous advantages over conventional data analysis methods [45,50]. In terms of rainfall variability, SOMs have already been utilized in [27]. SOMs have numerous adjustable parameters. Ref. [45] analyzed the impact of selecting these parameters through a sensitivity study on artificial data representing known patterns. We utilized the well-known SOFT toolbox developed at the Laboratory of Information and Computer Science, Helsinki University of Technology (Copyright (C) 2000 to 2005 by Esa Alhoniemi, Johan Himberg, Juha Parhankangas, and Juha Vesanto). The architectures of the SOMs were determined using the default parameters of the Kohonen package, namely batch learning, which is the fastest learning algorithm [51]; linear initialization; and the hexagonal lattice map structure, which is the most popular neighborhood structure and provides a smoother map. In this study, our methodology used a clustering method in a two-level process. The first level involved using SOMs on the data for the period from 1981 to 2018 and then applying hierarchical agglomerative clustering on the SOM results in order to determine the onset and offset zones in Senegal. The process for classifying the onset zones in Senegal is presented in the following Figure 2.

2.2.3. Hierarchical Ascendant Classification

After obtaining the SOM topological map, we applied a hierarchical ascendant classification (HAC) algorithm with a neighborhood constraint on the matrix composed of the reference vectors to reduce this large number of cells to a limited number of classes containing the map cells. HAC is a classification method belonging to the family of hierarchical methods. It is an iterative classification method, where a set of partitions P of N elements into increasingly fine classes is obtained by successive groupings of parts. In this study, this method allowed us to calculate a hierarchy of partitions from the topological map. Each partition grouped the neurons of the map in a different way. The different partitions of the hierarchy were determined iteratively, starting with the finest partition, which was composed of all the neurons in the map. The hierarchical classification used this initial partition and proceeded with successive groupings by merging two neuron subsets at each iteration. The choice of the two subsets that merge at a given step was made using a similarity measure defined between the two subsets. Among all the pairs of subsets that constituted the partition at this stage, we chose the two most similar neuron subsets based on the chosen distance measure. These successive groupings produced a binary tree of classification called a dendrogram, with its root corresponding to the class grouping all the individuals. This dendrogram represented a hierarchy of partitions. We then chose a partition by truncating the tree at a given level. In this work, the interannual variability and the spatial distribution of the onset and end dates, as well as the duration of the rainy season in Senegal, were studied for the period 1981 to 2018. We then performed a composite analysis of the atmospheric parameters to study the atmospheric and/or oceanic conditions associated with these events (onset and offset).

3. Results and Discussion

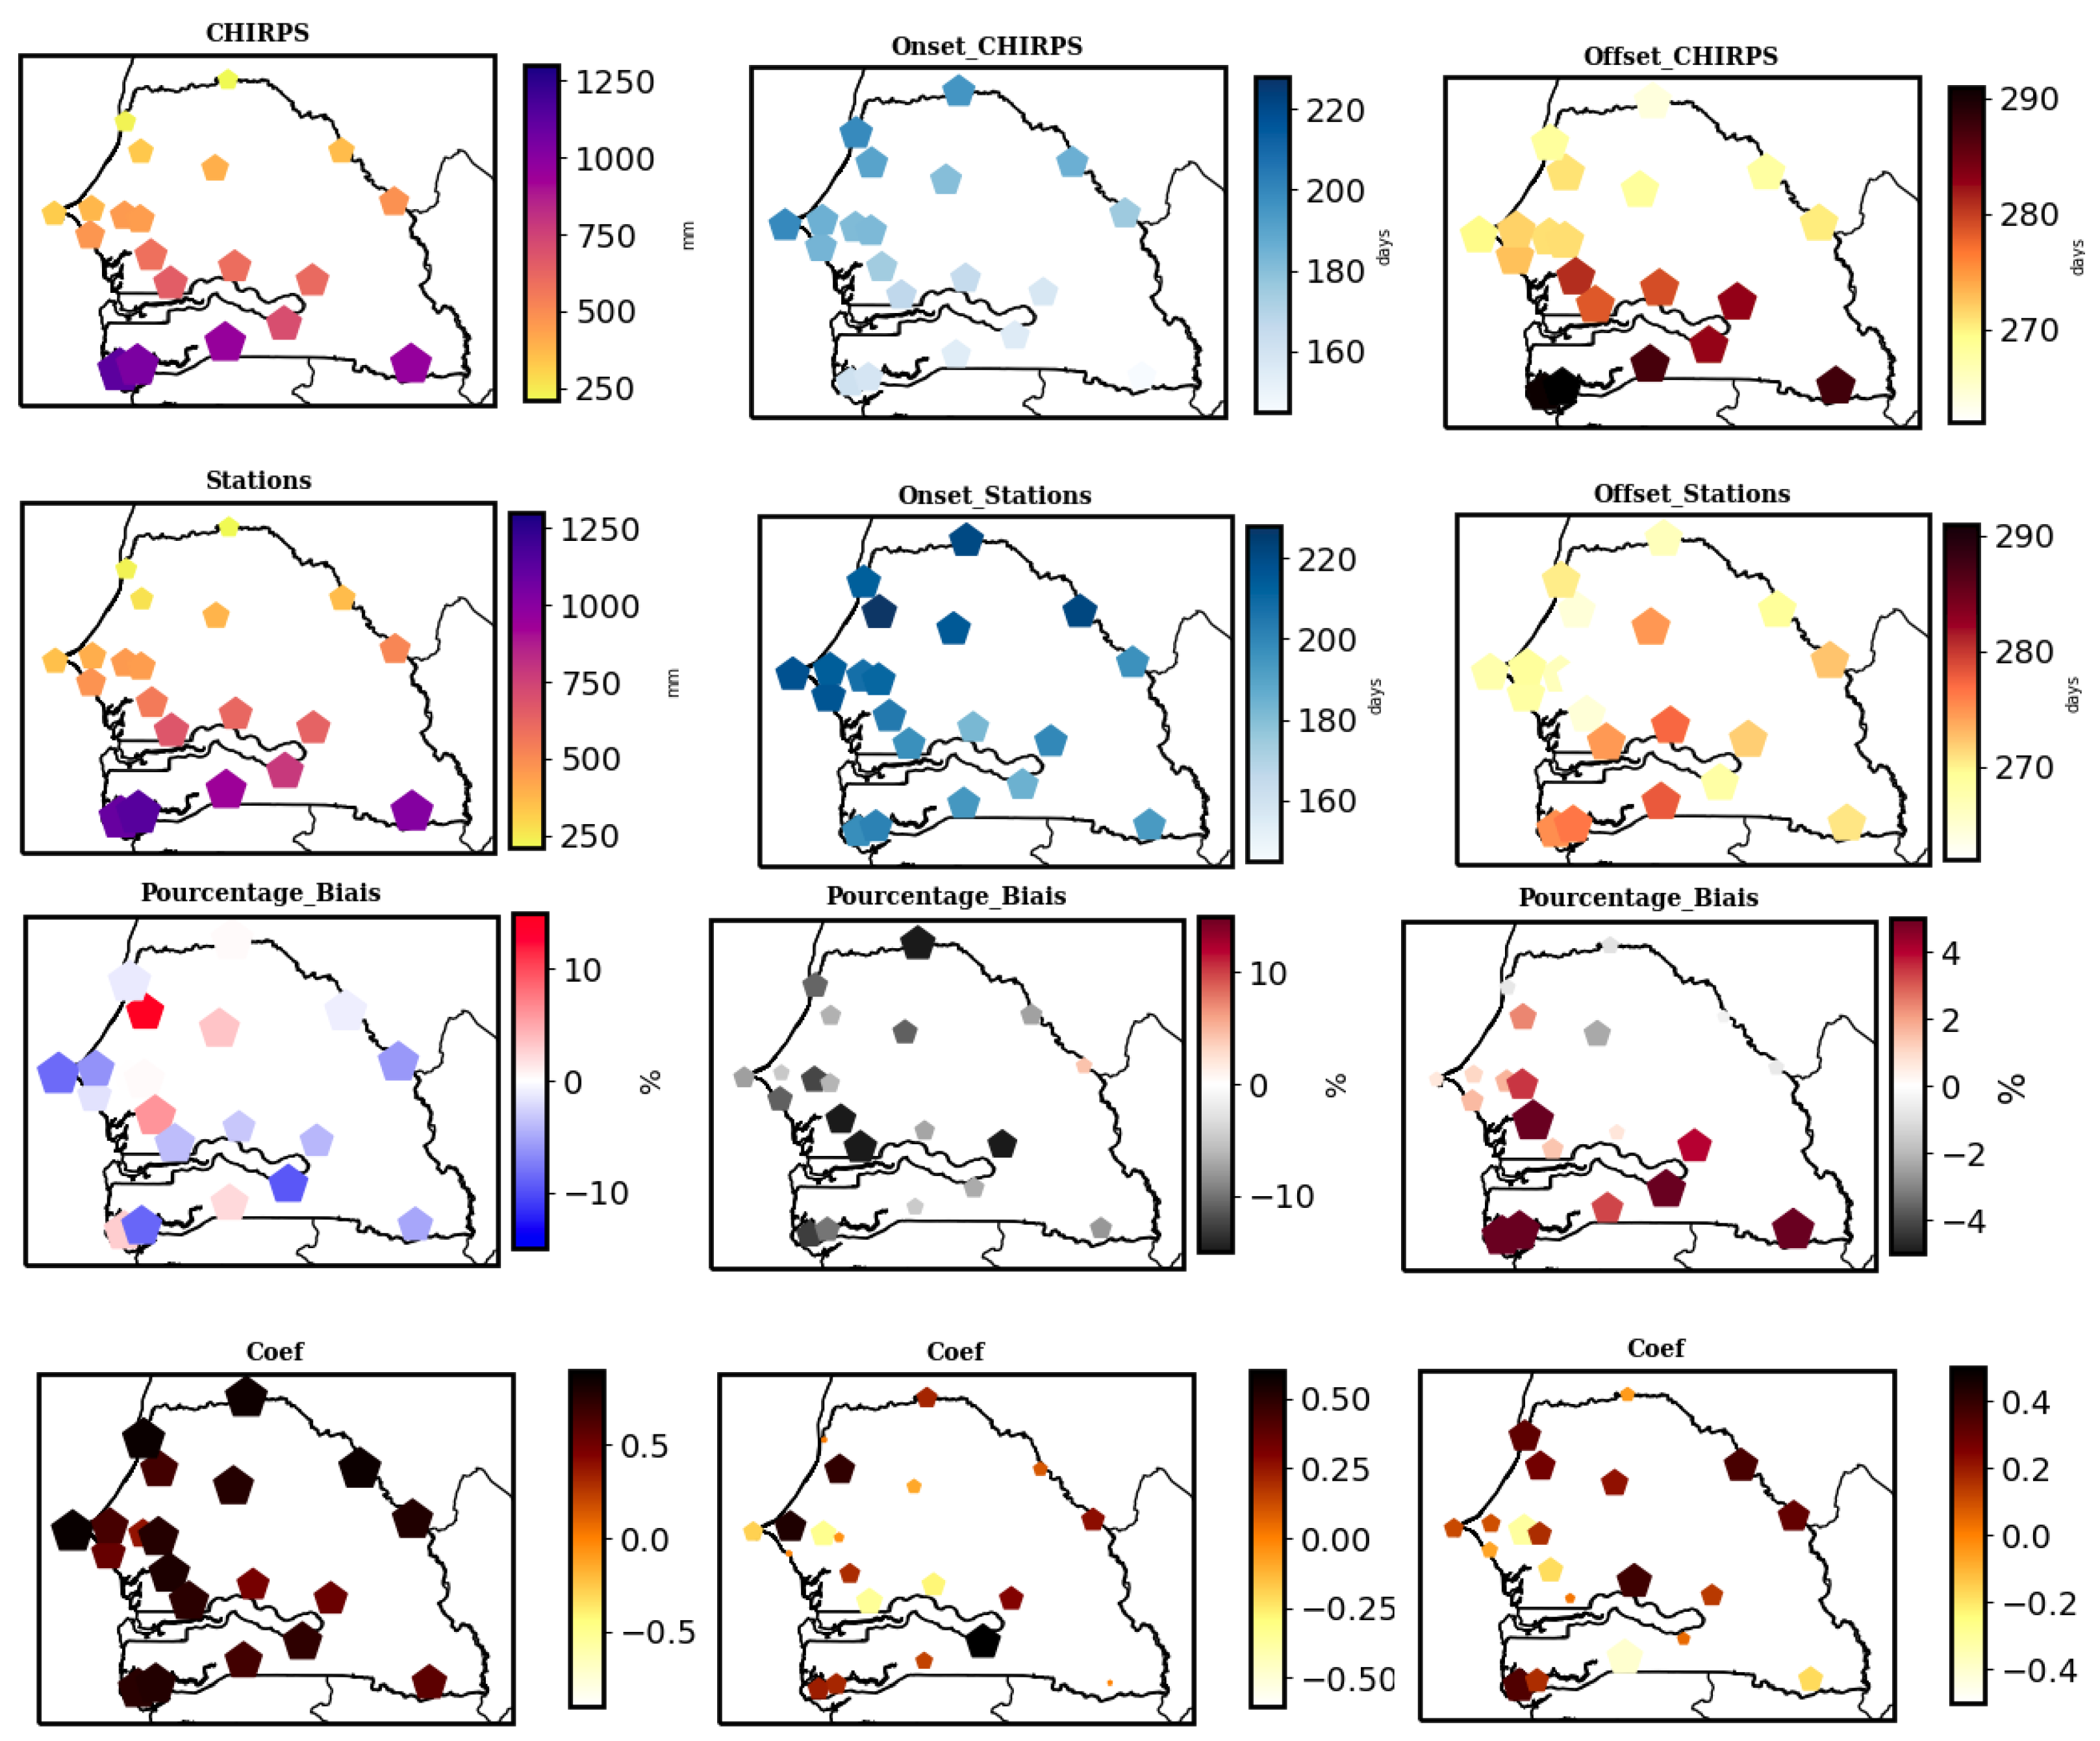
3.1. Validation of CHIRPS Data Using Rain Gauge Data in Senegal

Although CHIRPS satellite data have been validated in several studies focusing on West Africa, such as [33,35,36,37], we conducted a comparison of the annual cumulative precipitation data from CHIRPS and the NHMS-SN observation data in Senegal. Additionally, we compared certain precipitation indices, such as the onset and cessation dates of the rainy seasons, calculated from the NHMS-SN and CHIRPS data, using the method in [13]. Figure 3 presents an evaluation comparing the CHIRPS satellite data to the NHMS-SN observations for the JJAS period from 1981 to 2010. In the first column of the figure, we present the annual cumulative precipitation data from CHIRPS alongside the NHMS-SN observations in Senegal. We can observe that the CHIRPS satellite data adequately represent the spatial distribution of the observations, following a similar north–south gradient, with higher values in southern stations and lower values in the north. These findings confirm the conclusions in [8,52], which demonstrated that the precipitation distribution in Senegal delineates northern and southern regions, with increasing rainfall gradients from north to south. The bias percentage analysis reveals that the CHIRPS data underestimate the NHMS-SN observations for most stations across the country, especially those in the southeast. However, for some stations, we can observe overestimation by the CHIRPS data. The correlation coefficient between the CHIRPS precipitation accumulations and the NHMS-SN observations shows high correlation coefficients, reaching nearly 0.7 across the country. In the second column of the figure, the onset dates calculated using the CHIRPS data accurately reflect the structure indicated by the NHMS-SN data. However, in the last column, a CHIRPS structure quite similar to that of the stations can be observed, with later cessation dates in the south and earlier dates in the north. The figure clearly shows that the latest onset dates of the rainy season are in northern Senegal, where the monsoon can start as late as the end of July or early August. The end date of the rainy season in the north is early October, while it can extend to late October in southern Senegal. These results corroborate the conclusions in [53]. The bias percentage for the onset dates shows that the onset dates calculated using station data are earlier than those calculated using CHIRPS data for almost the entire country. Conversely, for the cessation dates (offset), the CHIRPS data overestimate the NHMS-SN observations. The low bias percentage values (maximum of 12% for precipitation accumulation and onset) clearly show that the CHIRPS data accurately represent the observations, especially in determining the cessation dates (maximum bias percentage = 4%). The correlation coefficients calculated between the station onset (onset calculated using NHMS-SN data) and CHIRPS onset reach values of 0.5 in some stations, whereas for the offset, the maximum value is 0.4. Despite the slightly elevated biases and weak correlations encountered at some stations, this detailed analysis strengthens the reliability of CHIRPS satellite data in depicting precipitation patterns in Senegal. Ground observations (NHMS-SN) are insufficient to calculate the onset and cessation dates of the rainy season at each grid point in Senegal. This prompted us to use CHIRPS data to calculate and represent these onset and cessation indices for the rainy season at each grid point in Senegal over a long period from 1981 to 2018.

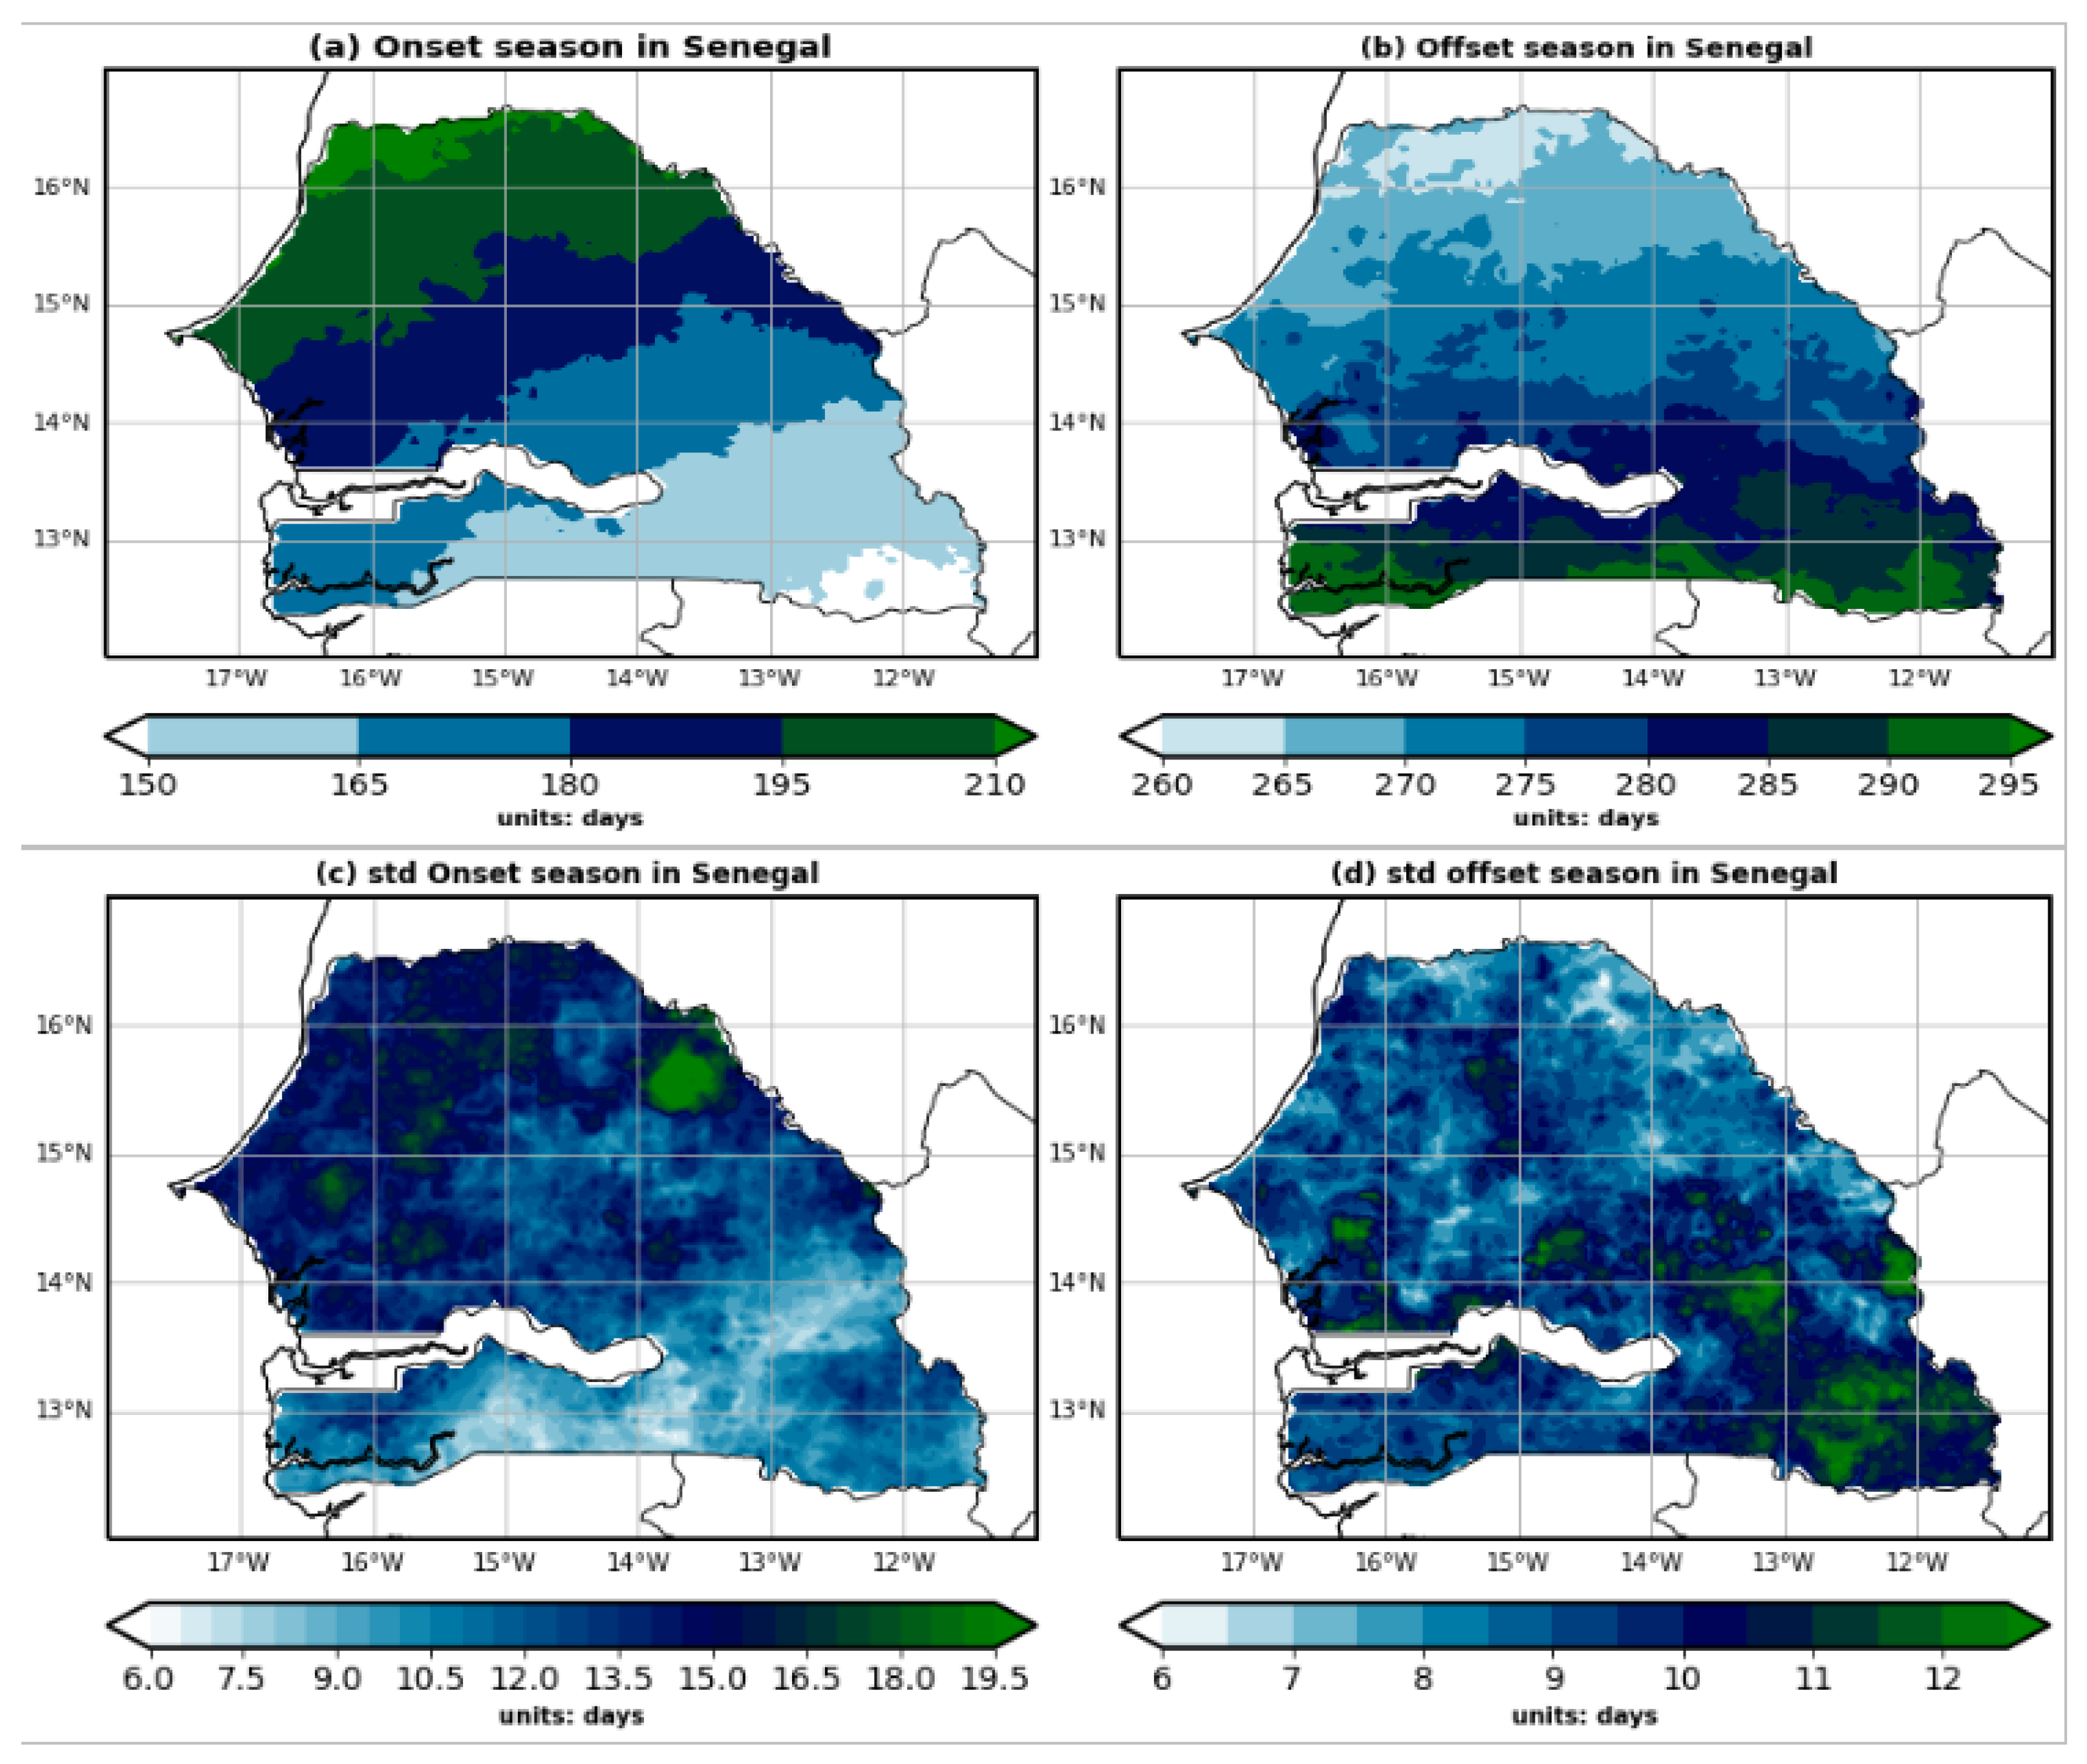
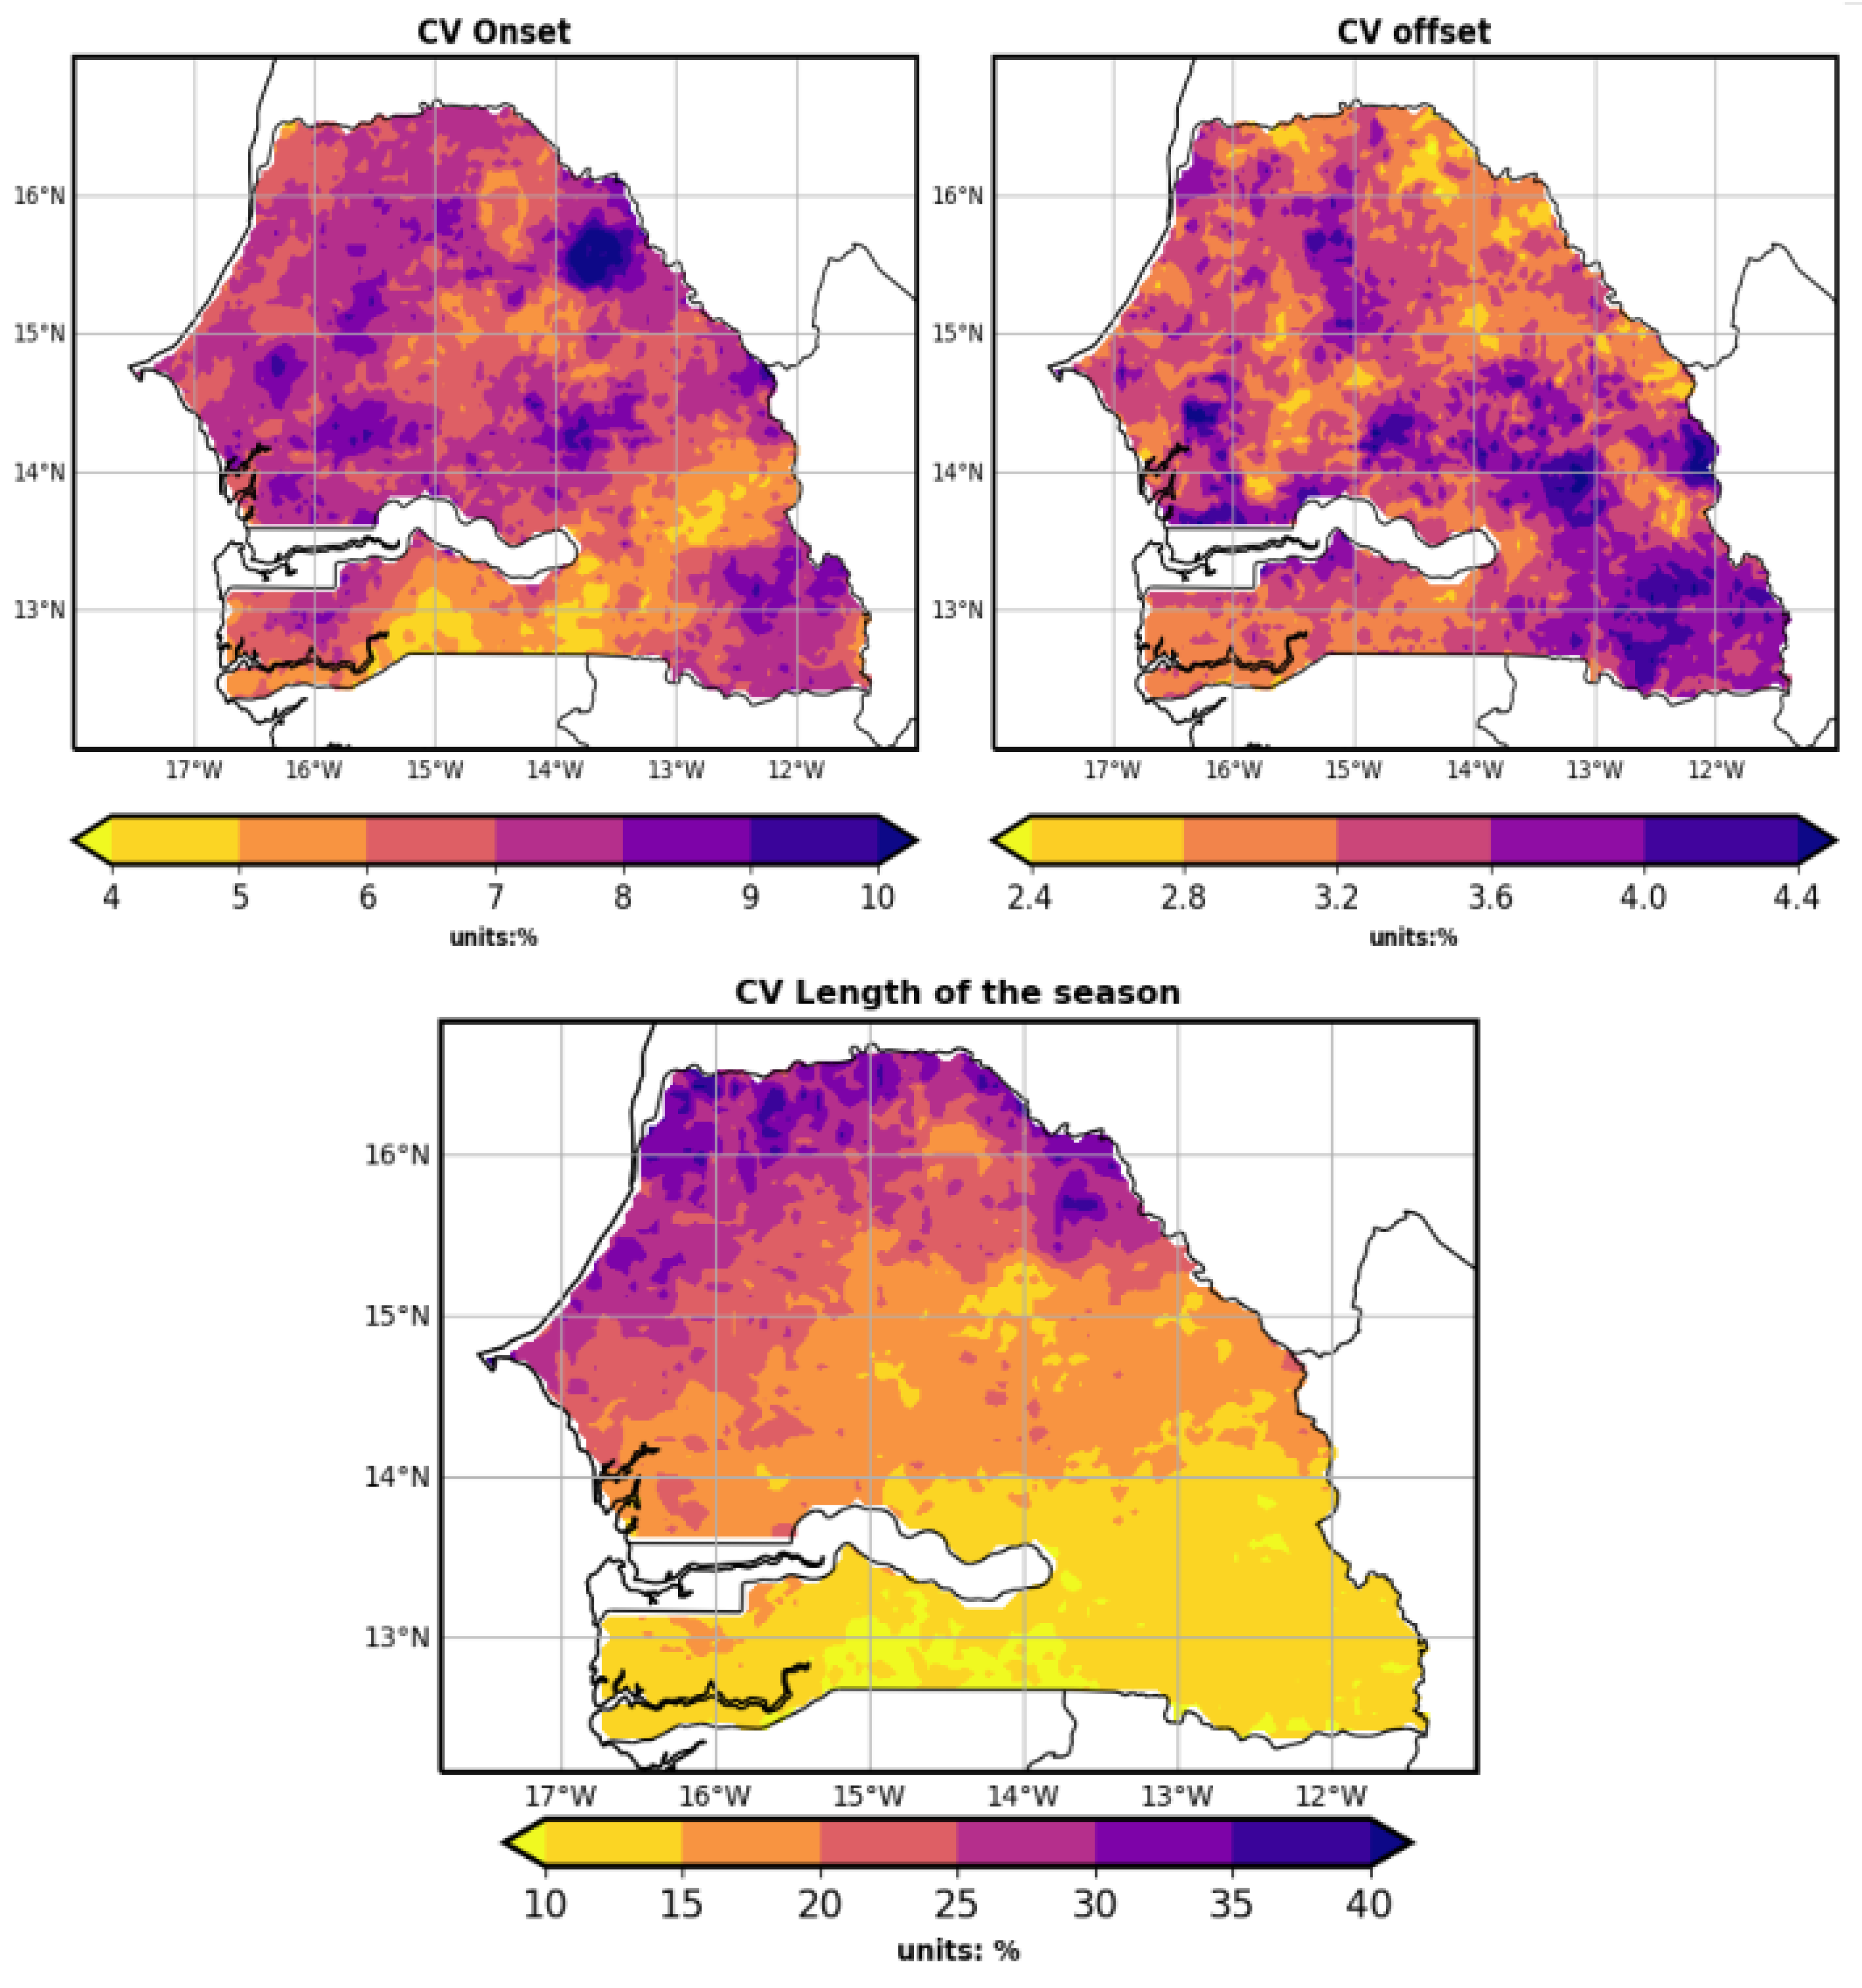
3.2. Spatial Variability of Onset and Cessation of the Rainy Season in Senegal

The rainy season in West Africa corresponds to the period when the main agricultural activities take place. In Senegal, as in other Sahelian countries, the rainy season is highly variable temporally and spatially. This spatiotemporal variability makes the selection of seed varieties and crop types difficult to plan. Figure 4 below illustrates this spatiotemporal fluctuation in the onset dates of the rainy season in Senegal. Figure 4a,b show the meridional gradients from south to north of the onset and offset of the rainy season in Senegal. The start (onset) and cessation (offset) of the rainy season exhibit a dual gradient in Senegal: a gradient oriented from southeast to northwest for the onset of the season, and a gradient from south to north for the offset season date. However, this gradient results in start dates becoming increasingly later going from southeast to northwest and end dates becoming increasingly later going from north to south. Indeed, the rainfall withdrawal begins first in the northern part of Senegal around 17 to 27 September, then progressively from 28 September to 7 October toward the center of Senegal between latitudes 14° and 15° N. Thus, the end of the season is defined in a relatively symmetrical way with respect to the beginning, underlining the contradiction between the sudden onset of the monsoon and its gradual withdrawal. This justifies that the latitudinal gradient of the start and end of the season, from south to north or from north to south, is consistent with the zonal structure of rainfall associated with the seasonal progression of the Intertropical Convergence Zone (ITCZ). These results, therefore, correspond to the same latitudinal distribution of the West African summer monsoon, which is linked to a shift of the ITCZ from a quasi-stationary position at 5° N in May/June to another quasi-stationary position at 10° N in July/August [54]. This north to south gradient of the start and end dates of the season is in perfect agreement with the results of the study in [13], which demonstrated that the spatial configurations of rainfall accumulation and intensity, as well as the onset dates, cessation dates, and length of the season, describe a clear gradient oriented from south to north. In addition, the authors confirmed the dual (south to north and southeast to northwest) gradient in Senegal. However, this meridional distribution of the beginning and end of the season is accompanied by a variability in the standard deviation (Figure 4c,d), where the variation is between 6 and 19 days for the onset of the season and between 6 and 12 days for the offset of the season. This finding is consistent with the results of the study in [55], which demonstrated that the spatiotemporal variability of the onset dates is higher than that of the cessation dates. The conclusions of the study conducted in [2] partially highlighted the pronounced spatial gradient and temporal variability of the onset of the season in Senegal. The average onset date of the rainy season in Senegal is 29 June, with a standard deviation of 6 days, meaning that the season can start up to 6 days before or after the expected date. Similarly, the average end date of the season is October 4, with a standard deviation of about 5 days. These results corroborate the studies in [56], which showed that in 80% of cases, the rainy season starts at the earliest during the second half of June and ends at the latest during the first half of October.

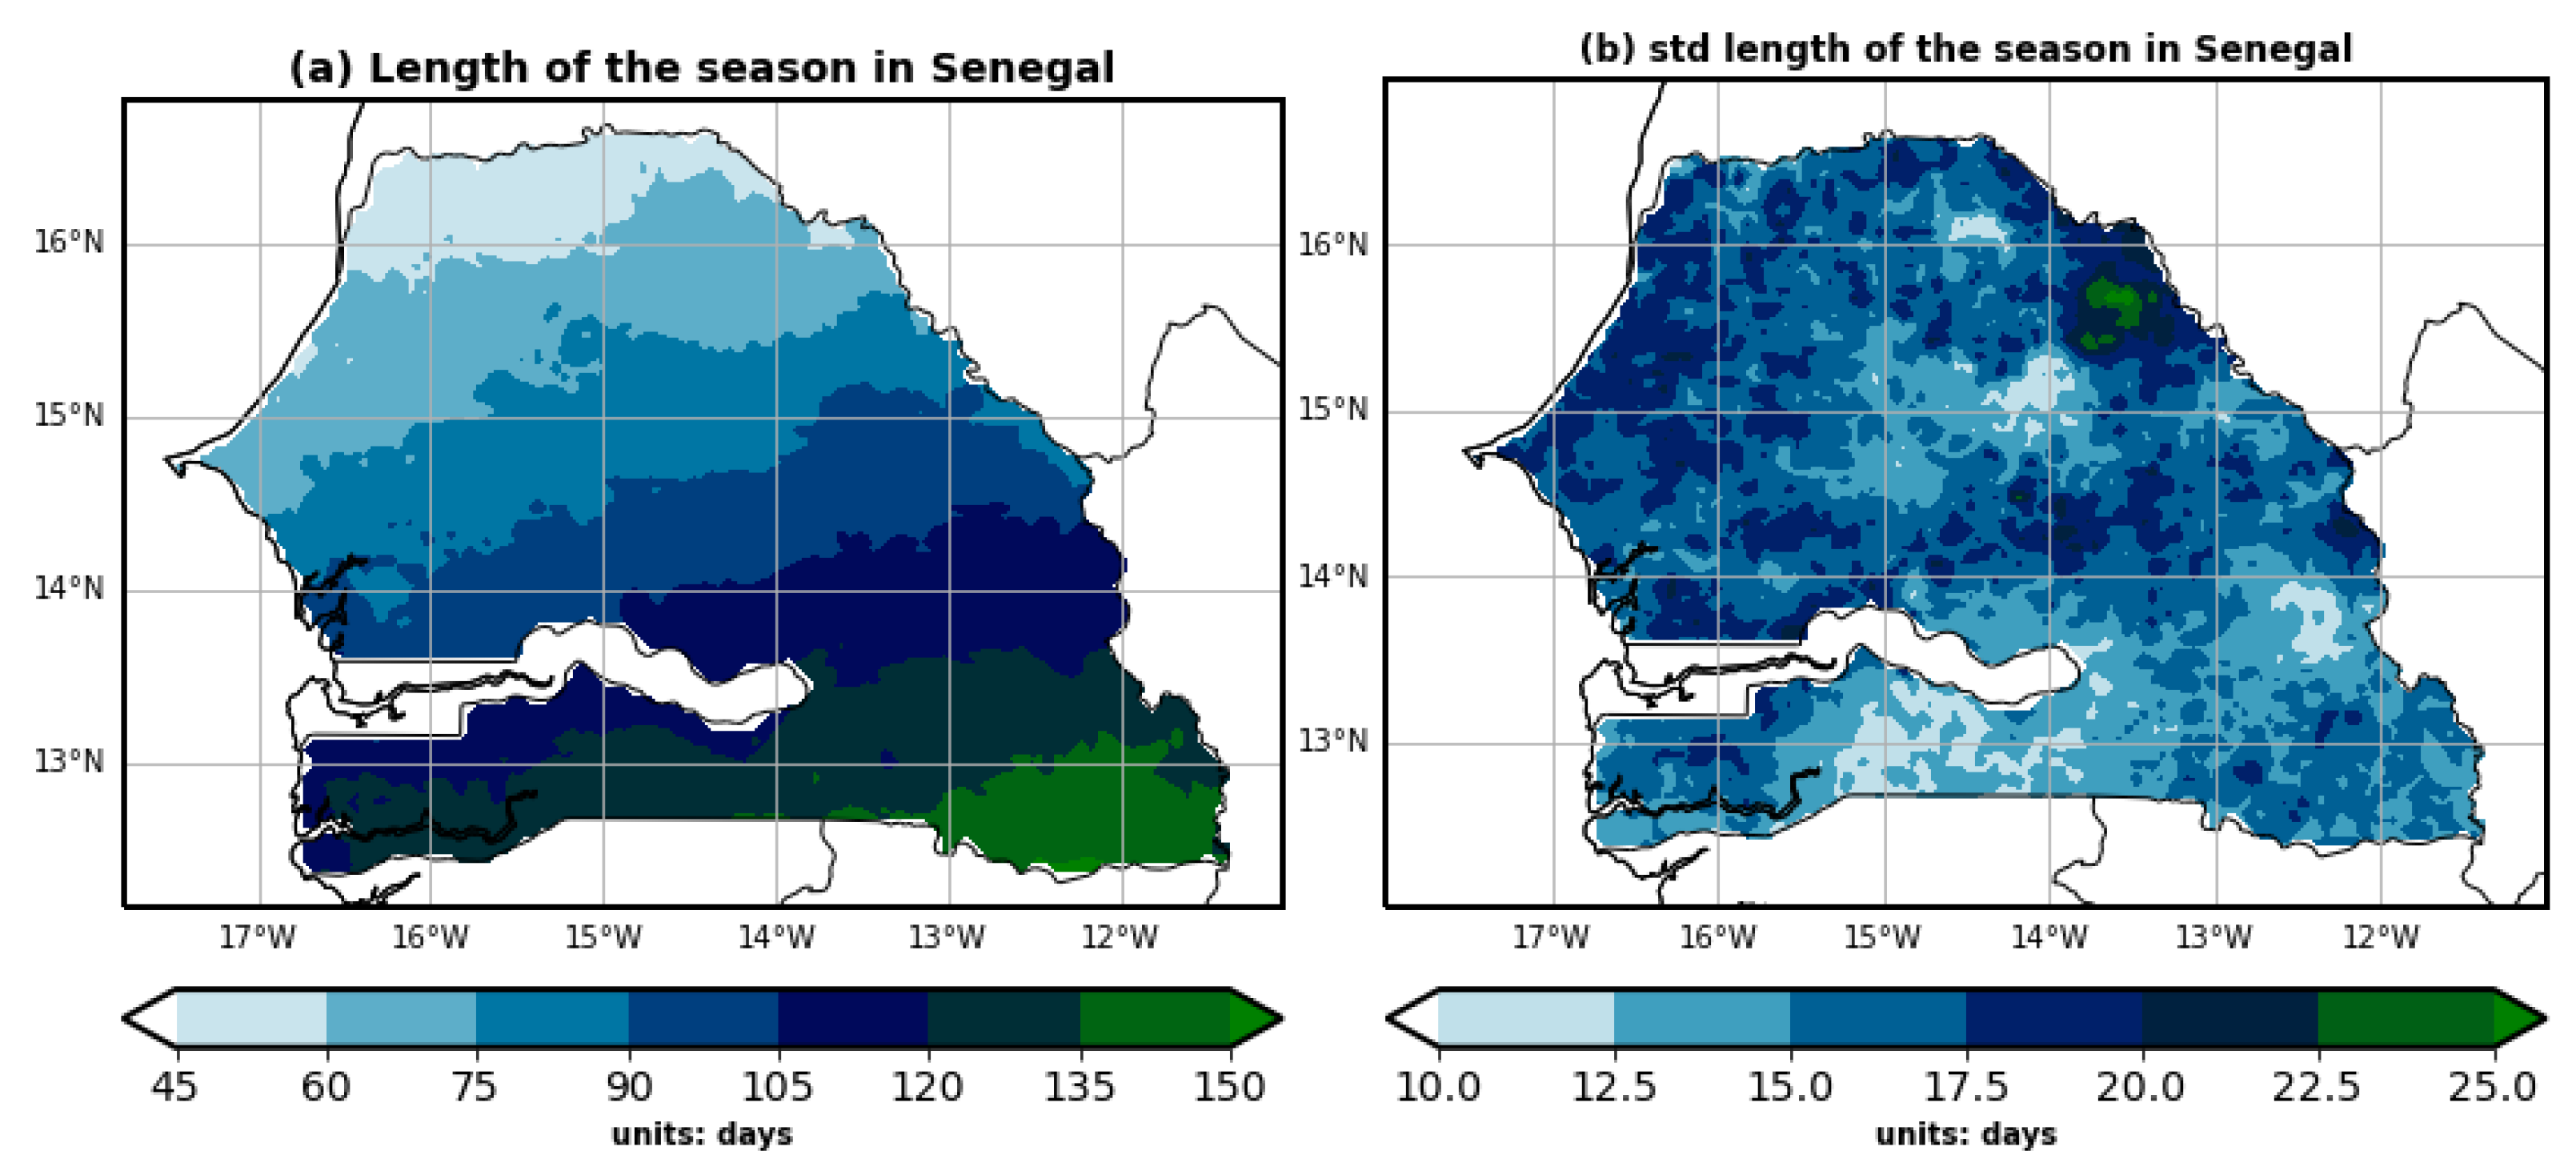
3.3. Spatial Variability of the Length of the Rainy Season in Senegal

The length of the rainy season ( L R S ) varies from year to year and from place to place. This duration is calculated by taking the difference between the onset and cessation dates of the rainy season, as defined above. The spatial distribution of the length of the rainy season in Senegal shows a north to south gradient, with a decrease in the length of the season going from south to north (Figure 5). This figure indicates that the length of the rainy season in Senegal varies from 45 to 150 days (Figure 5a), with a standard deviation ranging between approximately 10 and 25 days (Figure 5b). This spatiotemporal variation in the duration of the rainy season confirms the findings in [55,57]. Thus, the longer duration of the rainy season in southern and central Senegal indicates a higher probability of rainy days in this region, as well as significant rainfall accumulations. In addition, the extension of the rainy season in the south of the country can be attributed to an earlier onset and a later end compared to the north of the country. This difference in the duration of the rainy season between the north and south of the country can sometimes reach 105 days, which is in perfect agreement with the results in [2].
The spatial variability in the length of the rainy season can have several implications. For example, the season’s length can impact water availability and agriculture in different regions of the country [1,4]. A longer rainy season in southern and central Senegal suggests a higher probability of rainy days in this part of the country, as well as higher seasonal rainfall accumulations. This can be beneficial for agriculture and water supply, as greater precipitation can aid crop growth and recharge water resources. In addition, the extension of the rainy season in the south of the country, with an earlier onset and later offset compared to the north of the country, can also present challenges. For example, a longer rainy season may increase the risk of flooding in some regions [2]. Additionally, the variability in the rainy season can affect agricultural planning and planting schedules, as farmers must account for these variations to optimize yields [13,15]. Therefore, the duration of the rainy season is of considerable interest for planning agricultural activities. Indeed, in order to minimize the risks associated with late starts and early ends to the rainy season, Senegalese farmers can adjust their farming activities to occur between the second half of July and the first half of October. However, it should be noted that the shortening of the rainy season is exacerbated by the dry spells that frequently occur during the rainy season [2,58,59].
For a more precise analysis of these rainfall characteristics (onset, offset, and season length), the coefficient of variation ( C V ) at each grid point was determined, as shown in Figure 6. In contrast to the spatial variability of the onset, offset, and season length, we can observe that the interannual variabilities of the onset and cessation exhibit minimal fluctuations. The offset date varies between 2% and 5%, and the onset date is more variable (4% to 10%). There is more interannual variability in the onset dates, while the timing of the rainy season onset is crucial for determining optimal crop planting times [2]. However, for season length, we can observe a north to south gradient of the C V , with high C V values (up to 40%) in the north, moderate values in the central region, and low values in the south.
After identifying spatial variations in the onset, offset, and length of the rainy season, we then established the expected period for the onset and offset of the rainy season for each region of Senegal.

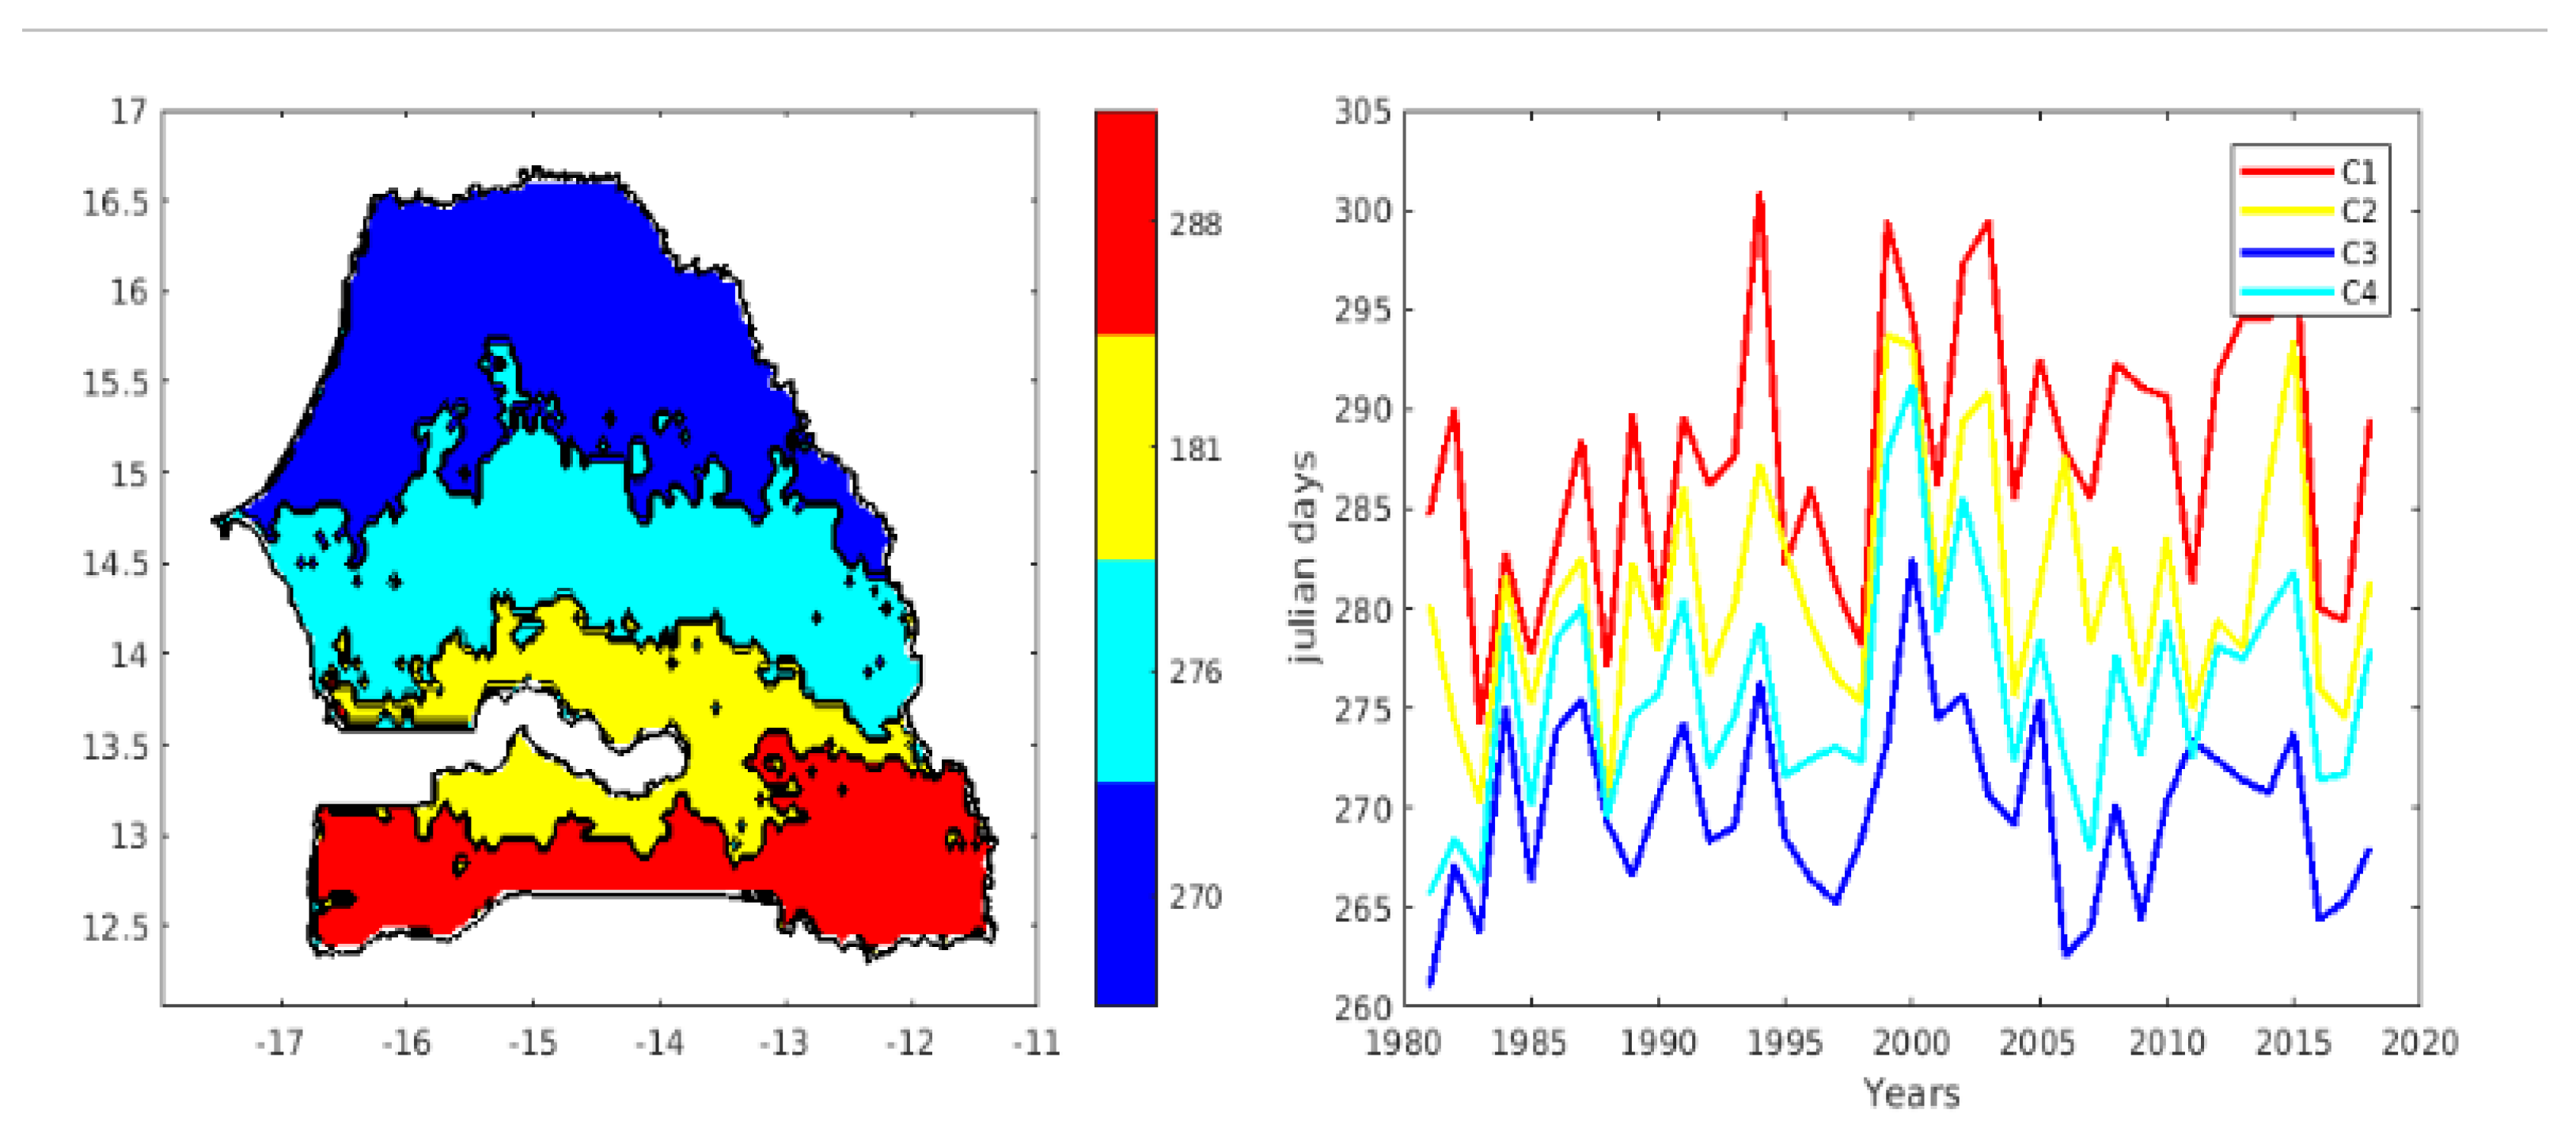
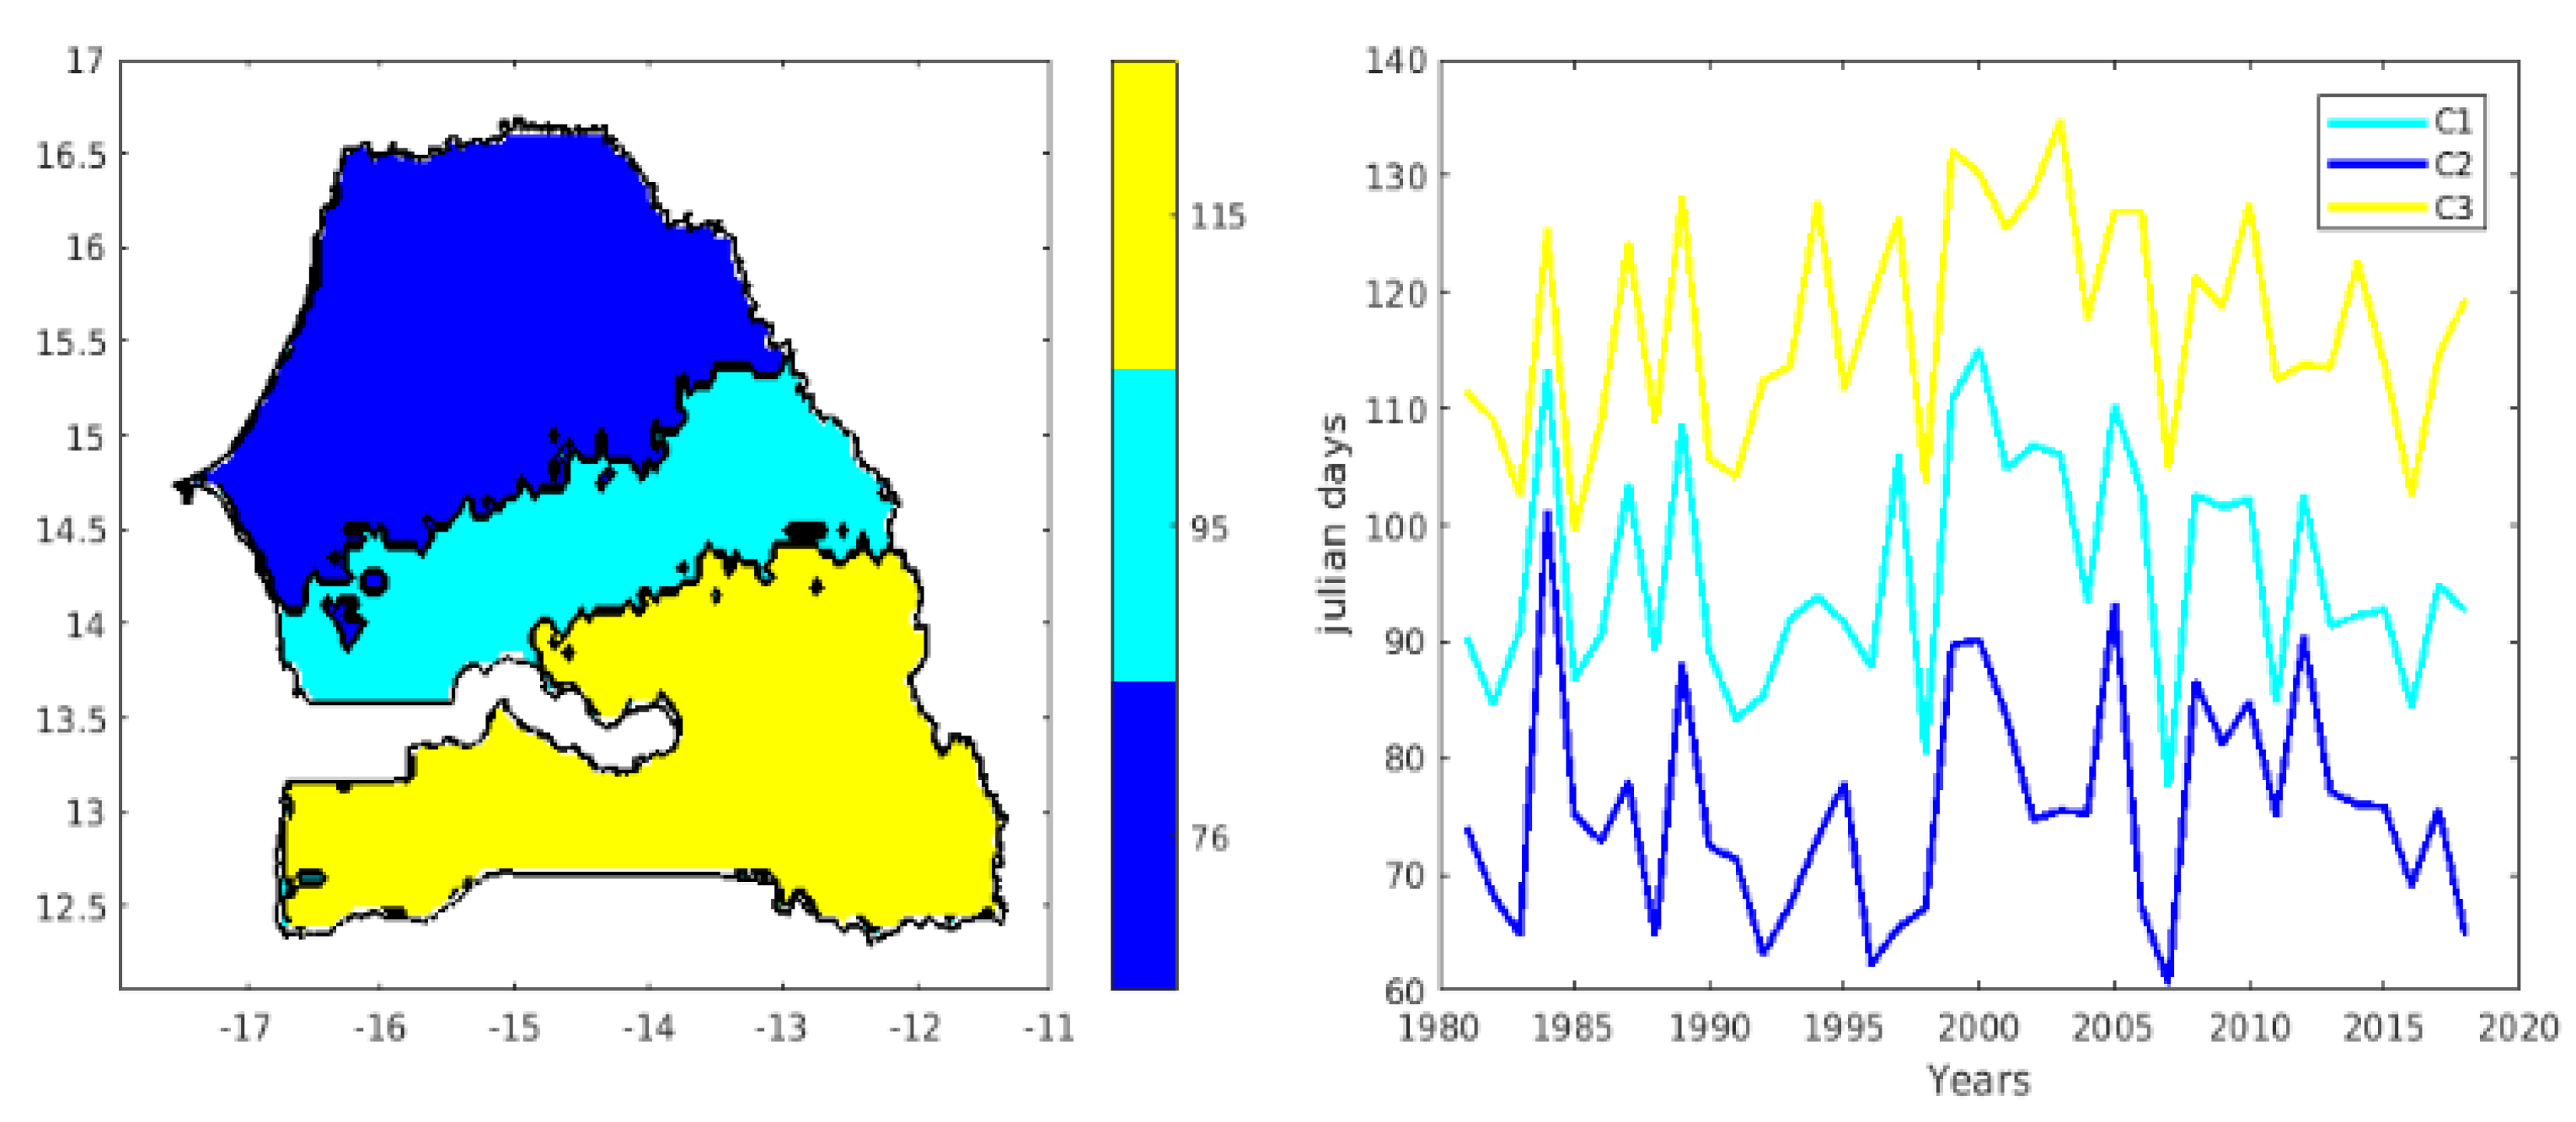
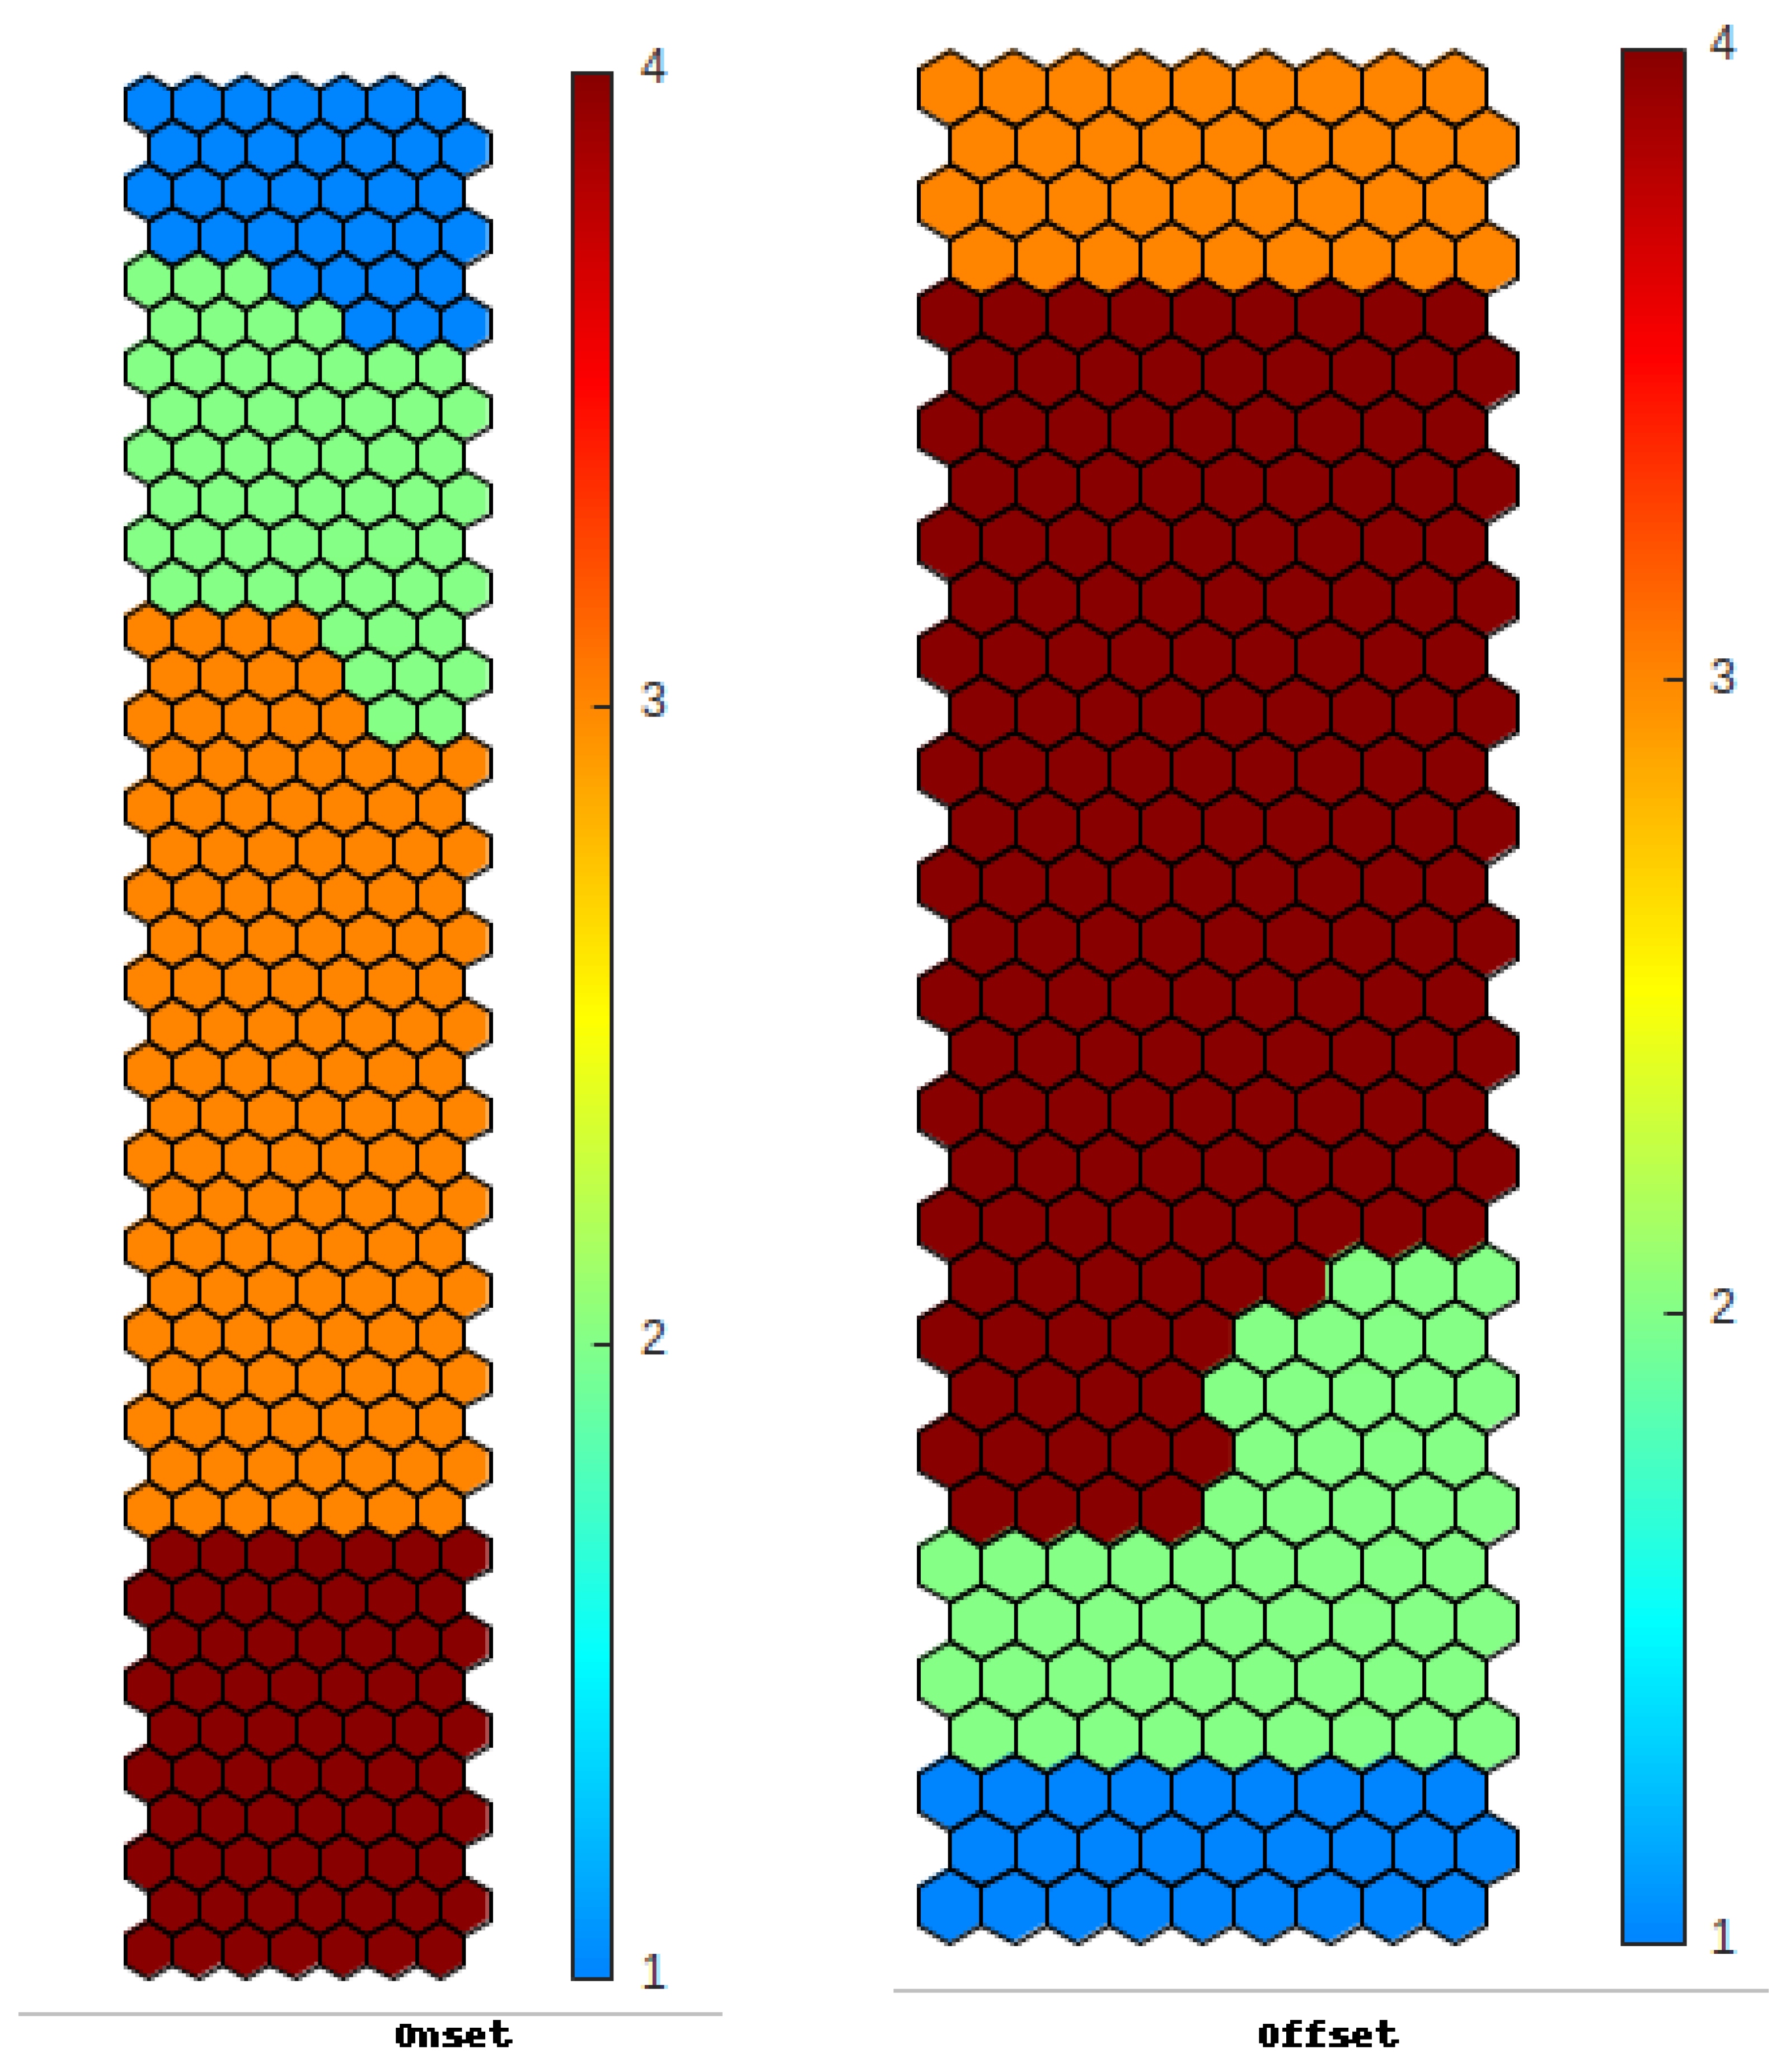
3.4. Regionalization of the Onset and Offset in Senegal

To classify the onset and cessation phases of rain in Senegal, the Kohonen algorithm was applied to the database of the onset and cessation dates. Several SOM applications were carried out by varying the initialization parameters. The best map in terms of vector quantization was retained, and we finally obtained a 43 × 7 map comprising 301 neurons for the onset and a 33 × 9 map comprising 297 neurons for the offset. We then projected the pixels of the year 1984 onto the obtained onset and offset maps (Figure 7). The two figures show a good organization of the topology of the observations (pixels) on the map. We note that the two maps are well organized, with weaker values at the top right and stronger values at the bottom. Due to the high number of neurons on each map (301 neurons for onset and 297 neurons for offset), we grouped them into a reduced number of classes using hierarchical agglomerative clustering (HAC), with the Ward criterion as the method for aggregating neurons from the self-organizing map. The choice of the number of classes was made by opting for the most discriminant partition, taking into account the “elbow” rule applied to the dendrogram of the HAC and the histogram of the aggregation levels. Figure 8 presents the dendrogram and histogram of the neurons for the onset map. In light of these two figures, we selected the appropriate number of classes, namely four classes in this case. To strengthen our choice of the number of classes, we calculated the Davies–Bouldin index [60], an indicator measuring the compactness and separability of classes. Thus, we performed this calculation for classification into four classes and another into five classes. The results obtained indicate a value of 1.23 for the first classification and a value of 1.45 for the second classification, confirming the relevance of choosing four classes.
Figure 9 illustrates the distribution of the four classes on the self-organizing map for the onset (left) and offset (right). The color bar indicates the class numbers. It is noteworthy that for the onset, class 3 corresponds to the neurons in the middle of the map, whereas class 4 corresponds to those at the bottom of the map. Conversely, for the offset, the representation differs. Classes 1 and 2 pertain to the neurons at the bottom of the map, whereas the neurons at the top of the map correspond to class 3.
After classifying the neurons into different classes, we projected the data from each class onto the geographical map of Senegal. The left map in Figure 10 illustrates the spatial distribution of various onset phases of the rainy season averaged over the period 1981–2018. We can observe a clear meridional gradient at the onset of the season, with later starts in the northern part of the country and earlier starts in the south. These results indicate that the onset dates of the rainy season are classified around 9 June (160th day) in the southeastern regions of Senegal (depicted in blue on the map), extending up to latitude 13° N in the eastern part of the country. Moving from the southeast toward the center of Senegal, these onset dates are observed around 19 June (172nd day). In the north-central part of Senegal (depicted in yellow on the map), the onset dates of the season are classified as around 27 June (181st day). The northwestern part of Senegal (depicted in red on the map) is characterized by an onset of the season around 11 July (day 195). When examining the interannual variability averaged over each class for the period 1981–2018 (see Figure 10 on the right), we sometimes observed early (1984, 1997, 2005, and 2014) and late (1989, 1991, 2007, and 2015) onsets of the season. Additionally, an interannual irregularity in the onset dates was observed between different classes as well as between clusters. This difference between clusters is due to the spatial variability of seasonality between the south and north of Senegal. In other words, this variability in the onset can be explained by the climatic differences between these two zones (the south has a sub-Guinean climate, and the north has a Sahelian climate). Similar to the spatial variability, we found that the interannual variability of the onset of the season follows a south to north gradient. However, a weak south to north gradient was observed in some years, such as 1984 and 2007.
Figure 11 (left) illustrates the spatial distribution of the four clusters concerning the cessation of the rainy season in Senegal averaged over the period 1981 to 2018. In the figure, we can observe a variation in the clusters from south to north. However, the earliest cessation dates can be observed in northern Senegal between latitudes 14.5° and 16.5° north. In this northern zone of the country, cessation dates are anticipated around 27 September (270th day). Similarly, between latitudes 13.8° and 14.5° north, the season end dates are estimated around 3 October (276th day). In the zone between 13° and 13.8° north, the cessation of the season is classified around October 8th. As for the southern part of Senegal (the Casamance region), the cessation dates are classified around 15 October. Figure 11 (right) presents the interannual variability of the cessation of the season averaged over each cluster. We can observe a low meridional variation in the season’s end between approximately 1984 and 1994, followed by a strong meridional gradient from 1995 to 2018. Similar to the onset, we also observed low variations between the north and the south for the cessation in some years, such as 1984, 1985, 1986, etc.
Regarding the spatial distribution of the classes of the length of the season (Figure 12, left), short seasons can be observed in the north up to 14° N (approximately 76 days). In the central part of the country, between 13.5° and 14° north, the seasons last around 3 months and 5 days. In the southern part of the country, between 12° and 13.5° north, the duration of the seasons is about 115 days. Interannual irregularity in the lengths of the seasons can be observed across the different classes, as well as within each class (Figure 12, right). Years with low variability in the duration of the season (1984, 1989, 2007) and years with high variability in the duration (1988, 1991, 2002, etc.) can also be observed. Years such as 2001, 2003, and even 2010 are characterized by long rainy seasons, whereas others, like 2007, 1994, 1992, etc., are distinguished by shorter durations of the season (Figure 12, right).

4. Dynamic Analysis

To better characterize the start and end of the rainy season, the behavior of certain atmospheric parameters was analyzed for the years 1984 and 2007, particular years marked, respectively, by an early onset/offset and a late onset/offset across almost the entire Senegalese territory. Specifically, in 1984, the average start date of the rainy season across Senegal was 12 June, with a variation of plus or minus 6 days (Figure S1 in the supplementary materials). The average end date was 5 October, with a standard deviation of 5 days. In 2007, the rainy season began on 6 July and ended on 26 September. Here, we applied a Lanczos filter [61] to the daily atmospheric variables to investigate seasonality and intra-seasonal variations. The Lanczos filter is a temporal filter that combines the advantages of a Gaussian filter and a low-pass filter. It is particularly effective in attenuating short-term fluctuations while preserving long-term trends. By applying this filter, we removed climatology beyond 90 days (approximately 3 months). This climatology represents the long-term variations in atmospheric variables. We also eliminated signals below 10 days. These signals represent very short-term variations. By staying within the intra-seasonal to seasonal range (10 to 90 days), we were able to identify variations in the atmospheric parameters on shorter time scales, such as seasons or months. These variations are crucial for understanding their impacts on the onset and offset dates of the systems. The objective here was to document the dynamic and thermodynamic signatures at altitude of the onset and offset, as well as the potential precursors to these events. To achieve this, we focused on the geopotential and temperature fields at 200 hPa, as well as the zonal wind at 700 and 925 hPa [62].

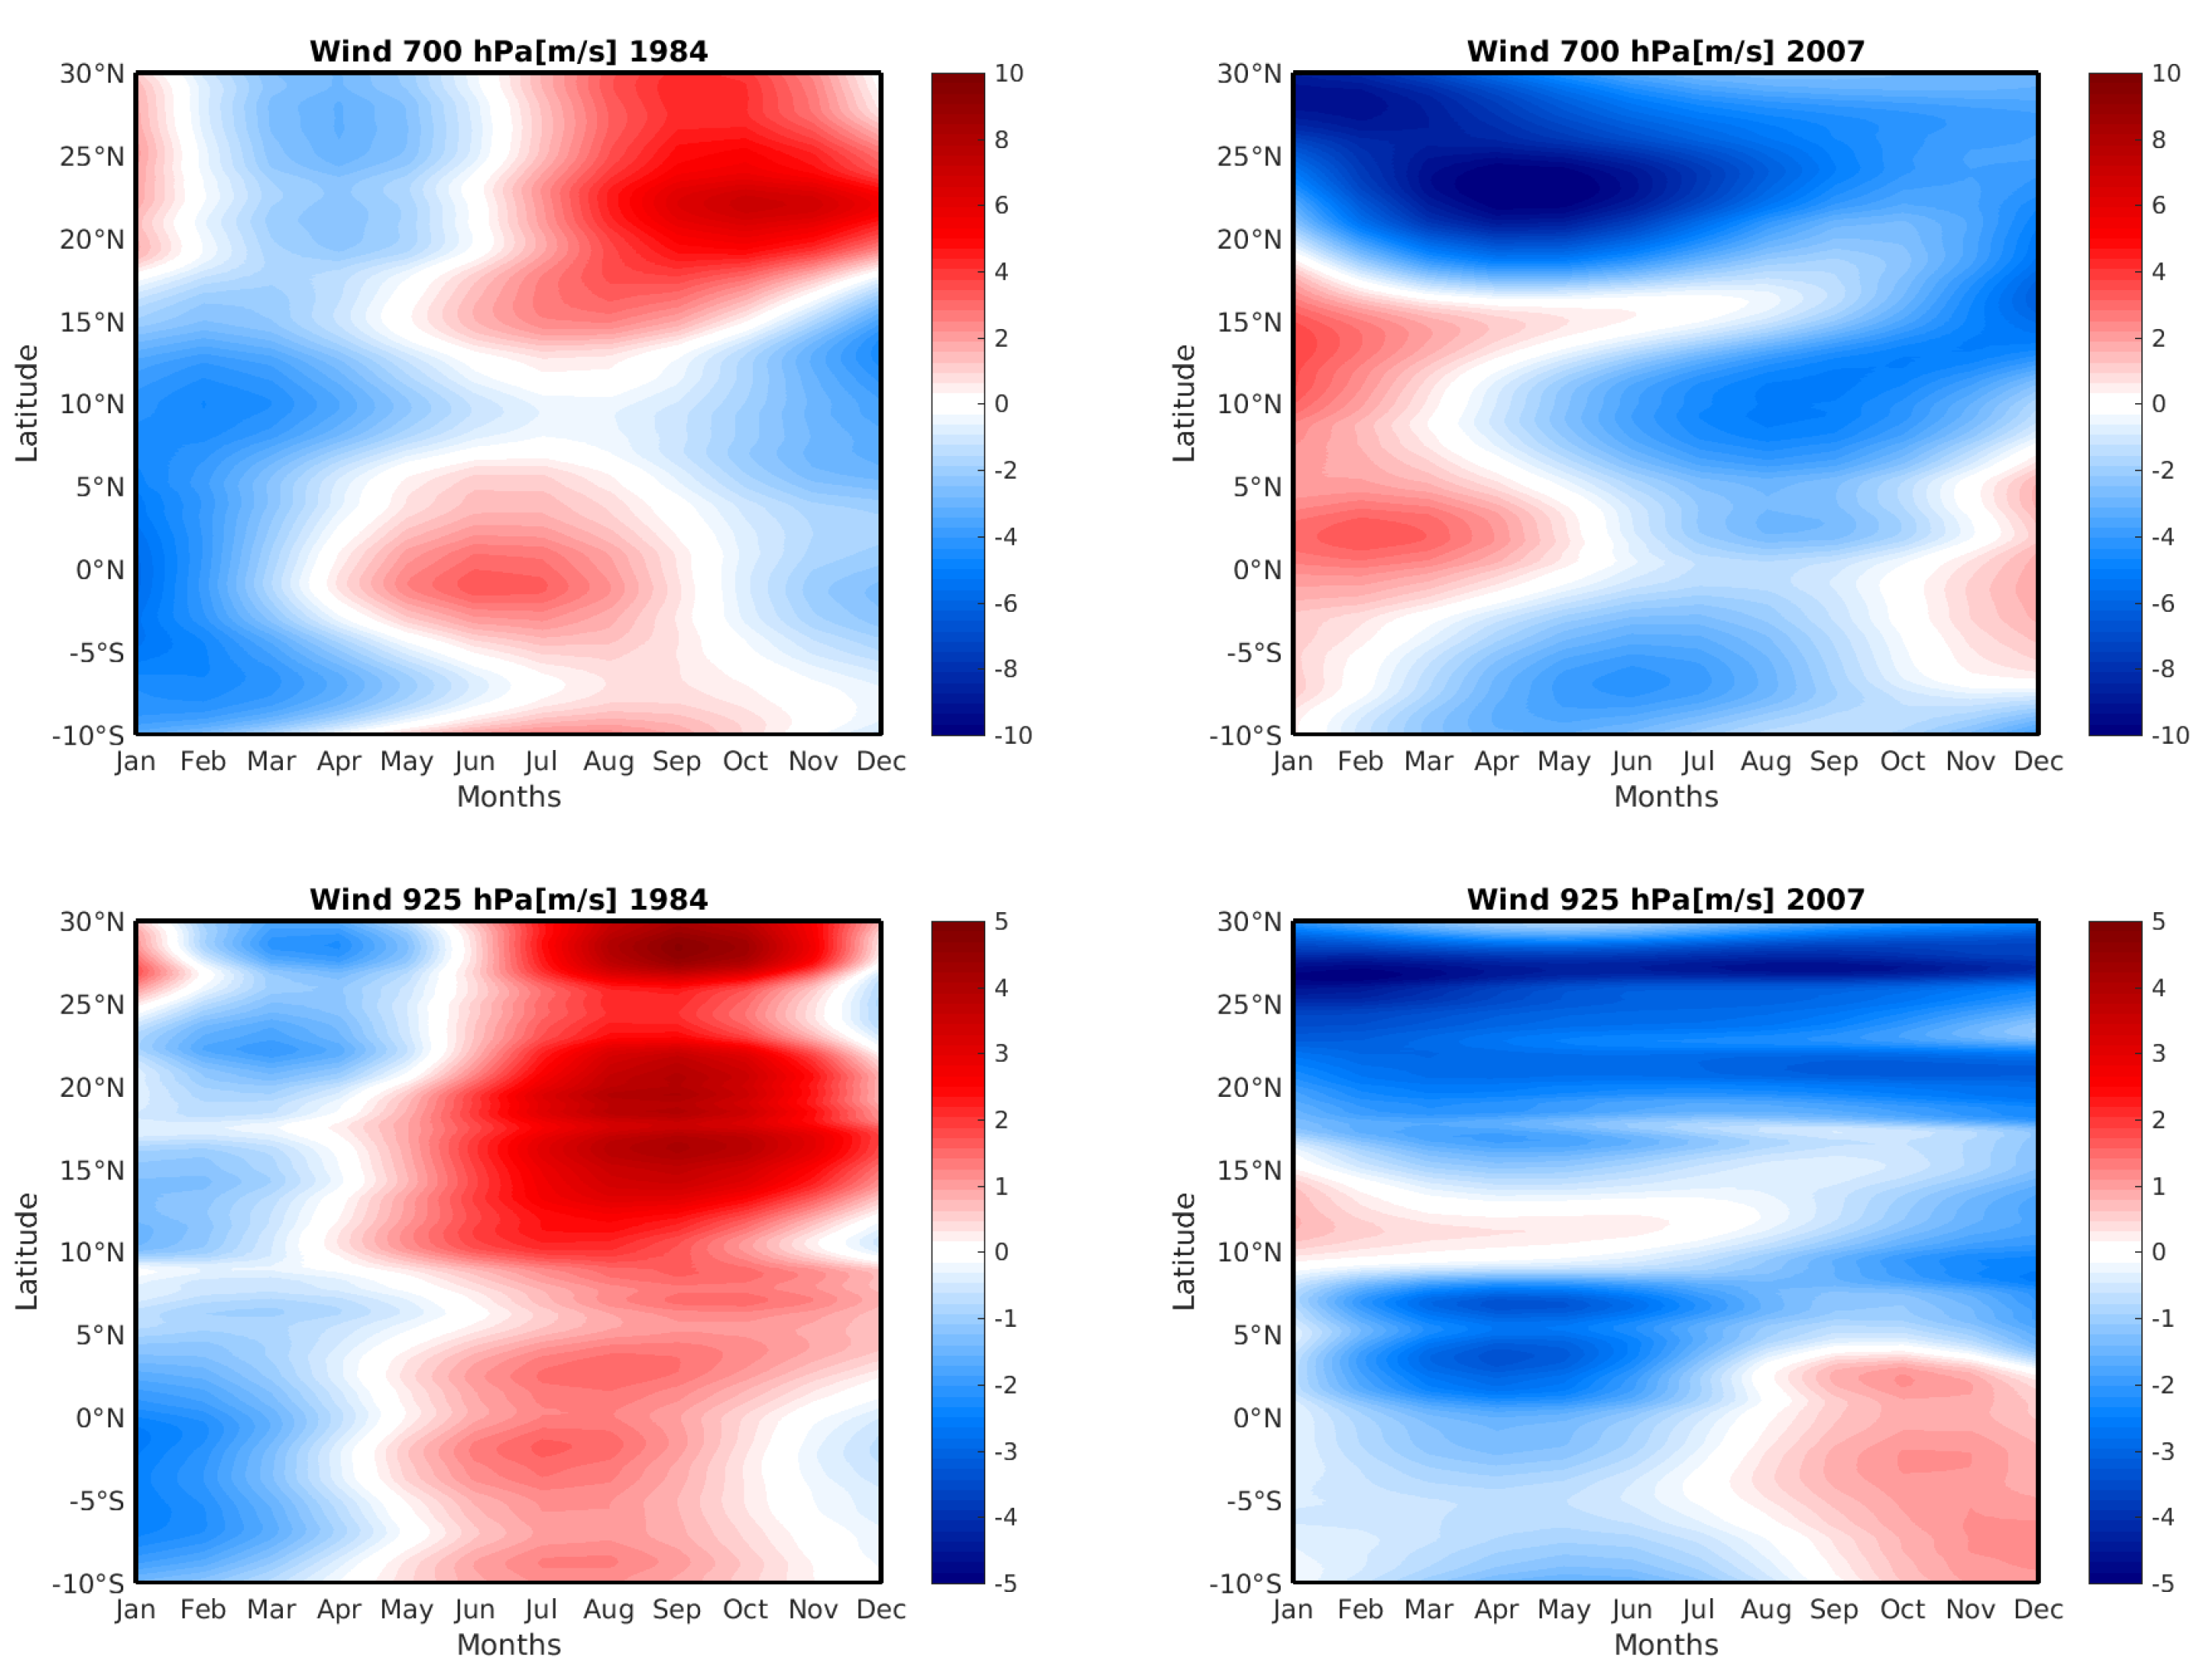
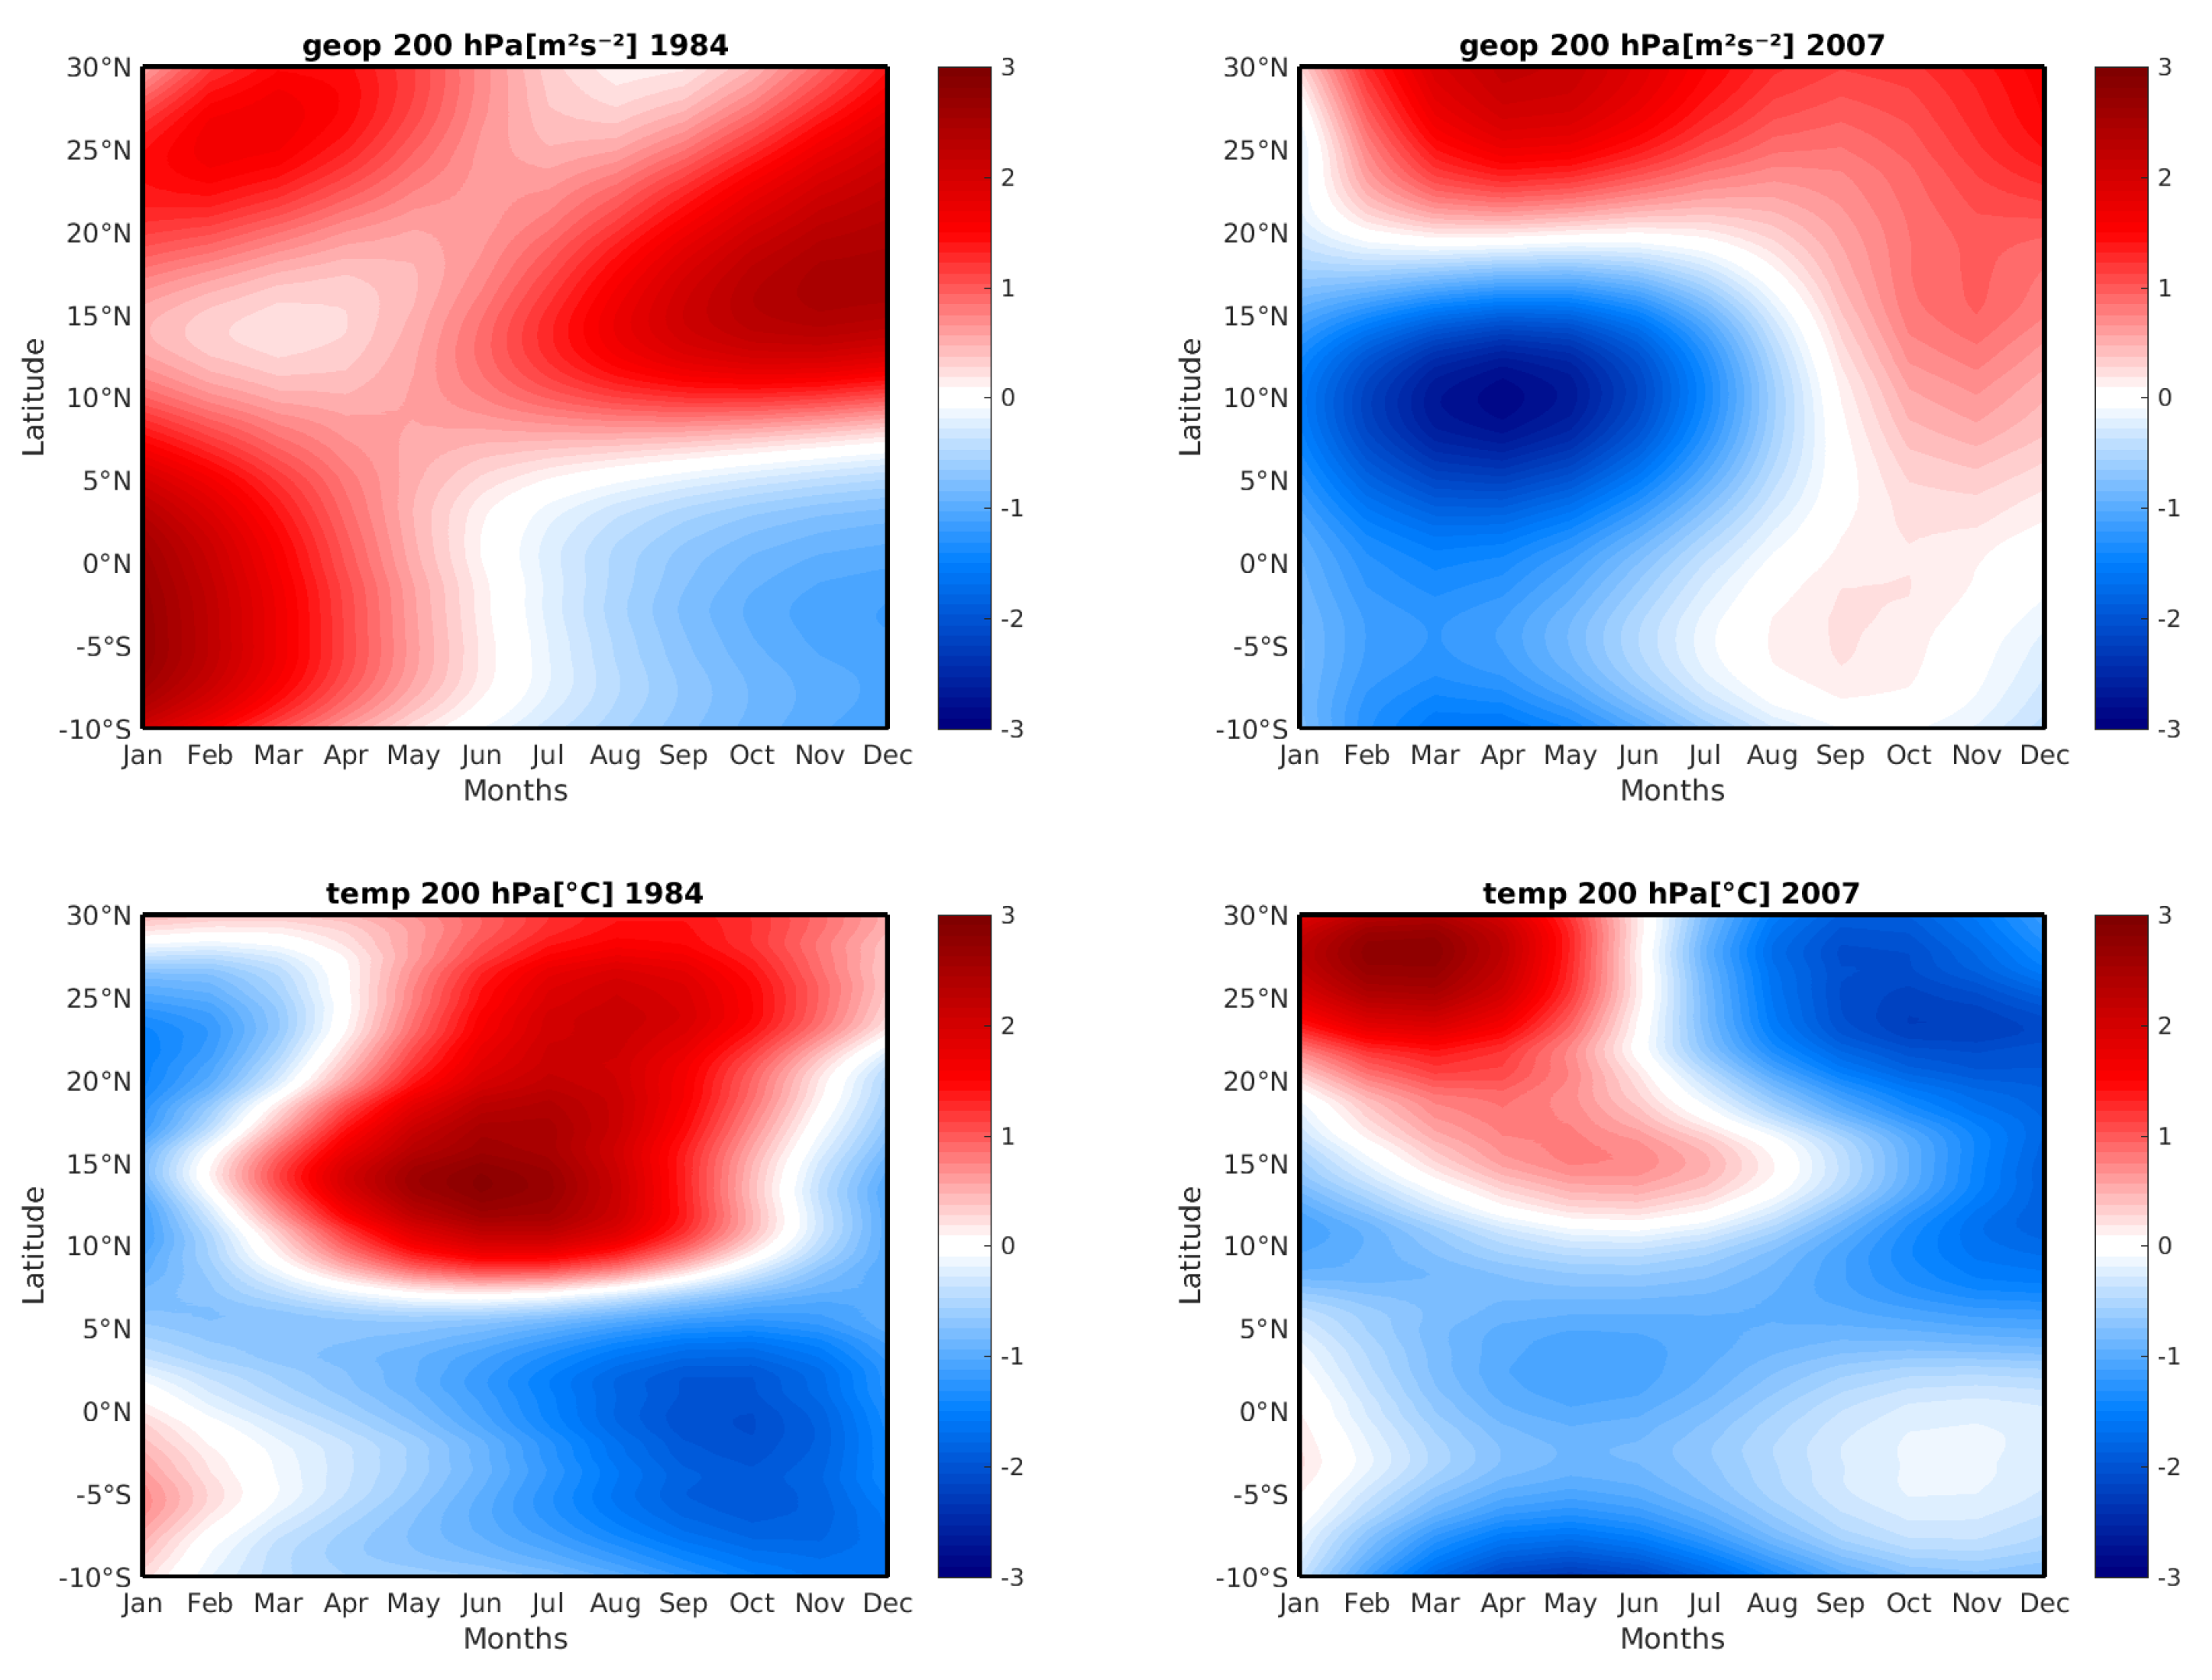
4.1. Analysis of High-Altitude Fields

The geopotential, measuring the strength of the gravity field at a given altitude, was examined in conjunction with the temperature at 200 hPa. Figure 13 illustrates Hovmüller time/latitude diagrams of geopotential anomalies and temperature anomalies averaged between longitudes −10° W and 10° E. Between January and May, positive geopotential anomalies can be observed from −10° S to 30° N, followed by negative anomalies from June to December between −10° S and 5° N for the year 1984. These variations correspond to anticyclonic and cyclonic zones. The onset of 1984, starting in June, is characterized by negative anomalies in the Gulf of Guinea and elevated values beyond 5° N, inducing high pressure above the Sahel and low pressure in latitudes below 5 °C. This increase in geopotential, corresponding to the onset according to [62], is confirmed.
In 2007, the increase in geopotential started in late July, justifying the late onset. Temperature fields reveal elevated values before the onset in 1984 between 10° N and 20° N, persisting until October. In 2007, maxima occurred in February between 25° and 30° N, decreasing toward 14 and 15° N at the beginning of the season. Both years exhibited elevated temperatures between 10° and 30° N before the onset. In 1984, they remained high after the onset, whereas in 2007, they decreased significantly. In 2007, there was a south–north temperature gradient decreasing toward October, the offset date. In 1984, high temperatures persisted in the north and decreased in the south. The higher temperature above the Sahel created high pressure, associated with high geopotential. After the onset in 1984, a faster and more stable Tropical Easterly Jet ( T E J ) persisted longer than that in 2007, when it weakened rapidly. The associated warm air mass was less homogeneous and stationary in 2007, influencing the T E J intensity due to a lesser temperature gradient. These dynamic and thermodynamic differences likely explain the precipitation surplus in 1984 compared to 2007. Moreover, according to [16,63], the evolution of the Tropical Easterly Jet ( T E J ) is a particularly good indicator of the onset of the monsoon.

4.2. Analysis of Mid-Altitude Fields and Low-Altitude Fields

4.2.1. Analysis of Mid-Altitude Fields

The objective of this section is to document the dynamic and thermodynamic signatures at mid-altitude of the onset and offset, and potentially the precursors to this triggering. To achieve this, we focused on the 700 hPa wind fields, where the influence of the African Easterly Jet ( A E J ) on the West African Monsoon could be assessed. The analysis of 700 hPa winds revealed that for both years considered, the East African Jet ( E A J ) signal appeared before the onset of the rainy season (Figure 14 top row). In the case of the onset in 1984, this signal appeared very early, before April, although its intensity was relatively low compared to 2007 when a strong 700 hPa wind signal was noted between May and June. During the summer period, a decrease in the intensity of the E A J was observed between mid-June and early September on latitudes between 5°N and 15° N for the year 1984. This weakening of the E A J favored the penetration of the monsoon flow, contributing to the onset of the rainy season. According to [64,65], this weakening of the E A J can be explained by the decrease in temperature over the continent, reducing the thermal contrast between the Gulf of Guinea and the continental surface. Furthermore, Ref. [66] demonstrated that the weakening of the E A J can lead to a significant increase in rainfall on the Sahel and a decrease on the coastal strip. In contrast, for the year 2007, an intense E A J was observed in summer (June, July, August, and September) between latitudes 5° N and 15° N. This jet stream became increasingly intense toward 20 to 30° N between April and June. This high intensity of the E A J in the summer of 2007 may have weakened the moisture advection into the continent, pushing the Intertropical Front ( I T F ) southward. The observed break in the summer of 1984 between latitudes 5° and 15° N, which extended until early October, may explain the delay in the end of the season. All these observations are consistent with previous studies, indicating that the intensity of the African Easterly Jet ( A E J ) varies according to the intensity of the West African Monsoon. Thus, Refs. [67,68] showed that a very active monsoon is characterized by a weak A E J intensity at the beginning of the monsoon, as well as a position around 15° north. During a drier monsoon, the A E J is strong at the beginning of the monsoon and close to 10° north.

4.2.2. Analysis of Low-Altitude Fields

Figure 14 (bottom row) illustrates the time/latitude diagram of the 925 hPa wind component averaged between −10° W and 10° E for the 1984 and 2007 seasons. The strength of the zonal component varied from one year to another. In 1984, at the beginning of May, the monsoon flow established itself, extending up to 30° N. Between 5° N and 20 to 25° N, the flow reached maximum speeds of 4 m/s between May and October. The intensification and expansion of the flow in latitudes up to 30° N can explain the respective early and late onset dates. Conversely, in 2007, just before the onset around the beginning of August, a sharp decrease in the westerly component of the monsoon flow was observed. This intensity drop for the 2007 season can be explained by a strong easterly wind pushing the intertropical front southward. The late appearance of the low-level monsoon flow, also known as the monsoon flux, explains the delayed start of the 2007 season. The weakening of the zonal component, coupled with strong easterly winds between 5° and 30° N from August to late December, may explain the early end of the season by hindering the advection of humidity toward the continent. Thus, the monsoon flow emerges as a crucial factor influencing the onset and offset dates of the rainy season in West Africa, particularly in Senegal. Generally, a stronger and earlier monsoon flow is associated with an earlier onset of the rainy season. Conversely, a weaker and later monsoon flow is linked to a later end of the rainy season [54,69]. This relationship is explained by the fact that a more robust and earlier monsoon flow facilitates the transport of moisture to the continent, contributing to the formation of clouds and precipitation.

5. Conclusions

The aim of this study was to make a substantial contribution to the detection and regionalization of the onset, cessation, and duration dates of the rainy season in Senegal from 1981 to 2018. To achieve this objective, daily CHIRPS precipitation data from 1981 to 2018 were utilized to determine the onset, withdrawal dates, and length of the rainy season in Senegal. A classification method based on self-organizing maps was employed to categorize these indices throughout Senegal. This approach allowed for the identification of different classes for the onset, cessation, and length of the rainy season in the country. ERA5 reanalyses were also leveraged to characterize the onset and withdrawal dates of the rainy season by analyzing the behavior of specific atmospheric parameters for the years 1984 and 2007. The results indicate that the onset and duration of the rainy season follow a southeast-to-northwest gradient in Senegal, with early onsets in the southeast and late onsets in the northwest. The length of the rainy season varies from 45 to 150 days from the northwest to the southeast of the country. A meridional gradient is also observed for the withdrawal of the season. The coefficient of variability shows greater interannual variability in the onset compared to the cessation. For the length of the season, the coefficient of variation varies from north to south, with high values in the north, moderate values in the center, and low values in the south. The use of self-organizing maps allowed for the classification of the onset, withdrawal, and length of the season into four zones for the onset and withdrawal, and three zones for the length of the season. This regionalization provides information on the onset, withdrawal, and length of the season classes for each specific zone, which can be valuable for planning crops adapted to each region. Dynamic analysis demonstrated the importance of dynamic and thermodynamic factors in the onset and withdrawal of the rainy season in Senegal. A stronger and earlier monsoon flow corresponds to an earlier onset of the rainy season, whereas a weaker and later monsoon flow is associated with a later withdrawal. An active monsoon is characterized by a weak African Easterly Jet (AEJ) at the beginning of the monsoon, located around 15° north. In contrast, a drier monsoon shows a strong AEJ at the beginning of the monsoon, located near 10° north. These results could serve as decision-support tools for agricultural development stakeholders by providing crucial information for water resource management, infrastructure planning, and flood risk preparedness. In terms of perspectives, in addition to mentioning the in-depth analysis of the links with key climatic variability modes on both interannual and intraseasonal scales such as the El Niño Southern Oscillation (ENSO) and the Madden–Julian Oscillation (MJO), it would also be relevant to consider a potential correction of biases in the CHIRPS data. This approach would improve the accuracy of our results and ensure the robustness of our conclusions.

Supplementary Materials

The following supporting information can be downloaded at https://www.mdpi.com/article/10.3390/atmos15030378/s1, Figure S1: Interannual variability in the start and end dates of the rainy season in Senegal over the period 1981 to 2018. We observe that the earliest and latest start dates were 1984 and 1991 respectively, and the earliest and latest cessation dates were 1983 and 2000 respectively.; Figure S2: Quality control and data homogeneity assessment.This figure illustrates the quality control and data homogeneity assessment. We observe a data availability percentage close to 100%.

Author Contributions

Conceptualization, D.F., A.L.D. and A.T.G.; methodology, D.F., F.K., D.W. and C.M.N.F.; software, D.F. and D.W.; validation, D.F., J.M. and A.L.D.; formal analysis, D.F., F.K. and A.L.D.; writing—original draft preparation and writing—review and editing, D.F.; visualization, D.F.; supervision, A.T.G. All authors have read and agreed to the published version of the manuscript.

Funding

This research received no external funding.

Institutional Review Board Statement

Not applicable.

Informed Consent Statement

Not applicable.

Data Availability Statement

The CHIRPS data and ERA5 reanalyses used in this study are freely accessible and can be accessed at the following links: https://data.ceda.ac.uk/badc/chirps/data/CHIRPS-2.0/global_daily/netcdf/p05 and https://cds.climate.copernicus.eu 10 February 2024. As for the data from the National Hydrological and Meteorological Service (NHMS), I obtained them from the database of my laboratory, the Laboratory of Atmospheric and Ocean Physics-Siméon Fongang (LPAO-SF)/ESP/UCAD.

Acknowledgments

This research is part of a Ph.D. study conducted in the Laboratoire Physique de l’Atmosphère et de l’Océan-Siméon Fongang (LPAO-SF)/ESP/UCAD.

Conflicts of Interest

The authors declare no conflicts of interest.

Abbreviations

The following abbreviations are used in this manuscript:
ITCZIntertropical Convergence Zone
CHIRPSClimate Hazards Group Infrared Precipitation with Stations
OLRoutgoing longwave radiation
LRSlength of the rainy season
SOMsself-organizing maps
HAChierarchical agglomerative clustering
MJOMadden–Julian Oscillation
ENSOEl Niño Southern Oscillation
AEJAfrican Easterly Jet
ITFIntertropical Front
TEJTropical Easterly Jet
MJJAMay, June, July, August
SONSeptember, Octobre, Novembe
CVcoefficient of variation
ICRISATInternational Crop Research Institute for the Semi-Arid Tropics
NHMSNational Hydrological and Meteorological Services

References

  1. Toure, A.K.; Diakhaté, M.; Gaye, A.T.; Diop, M.; Ndiaye, O. Sensivity of Crop Yields to Temperature and Rainfall Daily Metrics in Senegal. Am. J. Rural. Dev. 2020, 8, 1–11. [Google Scholar]
  2. Touré, A.K.; Fall, C.M.N.; Diakhaté, M.; Wane, D.; Rodríguez-Fonseca, B.; Ndiaye, O.; Diop, M.; Gaye, A.T. Predictability of intra-seasonal descriptors of rainy season over Senegal using global SST patterns. Atmosphere 2022, 13, 1437. [Google Scholar] [CrossRef]
  3. FAO 2015 Country Fact Sheet on Food and Agriculture Policy Trends. Available online: https://www.fao.org/3/i4841e/i4841e.pdf (accessed on 10 February 2024).
  4. Fall, C.M.N.; Lavaysse, C.; Kerdiles, H.; Dramé, M.S.; Roudier, P.; Gaye, A.T. Performance of dry and wet spells combined with remote sensing indicators for crop yield prediction in Senegal. Clim. Risk Manag. 2021, 33, 100331. [Google Scholar] [CrossRef]
  5. Roudier, P.; Kane, C.; Leblois, A.; Sultan, B.; Weber, S. Deux Exemples de Stratégies de Gestion du Risque Agricole en Afrique de l’Ouest. Serv. Clim. Assur. Indicielles 2019, 239, 1–17. [Google Scholar]
  6. Diallo, I.; Giorgi, F.; Deme, A.; Tall, M.; Mariotti, L.; Gaye, A.T. Projected changes of summer monsoon extremes and hydroclimatic regimes over West Africa for the twenty-first century. Clim. Dyn. 2016, 47, 3931–3954. [Google Scholar] [CrossRef]
  7. Sultan, B.; Defrance, D.; Iizumi, T. Evidence of crop production losses in West Africa due to historical global warming in two crop models. Sci. Rep. 2019, 9, 12834. [Google Scholar] [CrossRef] [PubMed]
  8. Dieng, O.; Roucou, P.; Louvet, S. Variabilité intra-saisonnière des précipitations au Sénégal (1951–1996). Sécheresse 2008, 19, 87–93. [Google Scholar]
  9. Diba, I.; Camara, M. Analyse De L’impact Du Changement De La Couverture Végétale Sur La Pluie Et La Température De Surface Au Sénégal. Eur. Sci. J. 2017, 13, 29. [Google Scholar] [CrossRef]
  10. Sultan, B.; Roudier, P.; Quirion, P.; Alhassane, A.; Muller, B.; Dingkuhn, M.; Ciais, P.; Guimberteau, M.; Traore, S.; Baron, C. Assessing climate change impacts on sorghum and millet yields in the Sudanian and Sahelian savannas of West Africa. Environ. Res. Lett. 2013, 8, 014040. [Google Scholar] [CrossRef]
  11. Roudier, P.; Muller, B.; d’Aquino, P.; Roncoli, C.; Soumaré, M.A.; Batté, L.; Sultan, B. The role of climate forecasts in smallholder agriculture: Lessons from participatory research in two communities in Senegal. Clim. Risk Manag. 2014, 2, 42–55. [Google Scholar] [CrossRef]
  12. Sivakumar, M. Empirical analysis of dry spells for agricultural applications in West Africa. J. Clim. 1992, 5, 532–539. [Google Scholar] [CrossRef]
  13. Marteau, R.; Sultan, B.; Moron, V.; Baron, C.; Traoré, S.B.; Alhassane, A. The onset of the rainy season and farmers’ sowing strategy for pearl millet cultivation in Southwest Niger. Agric. For. Meteorol. 2011, 151, 1356–1369. [Google Scholar] [CrossRef]
  14. Mugalavai, E.M.; Kipkorir, E.C.; Raes, D.; Rao, M.S. Analysis of rainfall onset, cessation and length of growing season for western Kenya. Agric. For. Meteorol. 2008, 148, 1123–1135. [Google Scholar] [CrossRef]
  15. Camberlin, P. Les Précipitations dans la Corne Orientale de l’Afrique: Climatologie, Variabilité et Connexions Avec Quelques Indicateurs Océano-Atmosphériques. Ph.D. Thesis, Université de Bourgogne, Dijon, France, 1994. [Google Scholar]
  16. Fontaine, B.; Louvet, S.; Roucou, P. Definition and predictability of an OLR-based West African monsoon onset. Int. J. Climatol. J. R. Meteorol. Soc. 2008, 28, 1787–1798. [Google Scholar] [CrossRef]
  17. Sultan, B.; Janicot, S. Abrupt shift of the ITCZ over West Africa and intra-seasonal variability. Geophys. Res. Lett. 2000, 27, 3353–3356. [Google Scholar] [CrossRef]
  18. Balme, M.; Galle, S.; Lebel, T. Démarrage de la saison des pluies au Sahel: Variabilité aux échelles hydrologique et agronomique, analysée à partir des données EPSAT-Niger. Sci. Chang. Planétaires/Sécheresse 2005, 16, 15–22. [Google Scholar]
  19. Walter, M. Length of the rainy season in Nigeria. Niger. Geogr. J. 1967, 10, 123–128. [Google Scholar]
  20. Omotosho, J.B.; Balogun, A.; Ogunjobi, K. Predicting monthly and seasonal rainfall, onset and cessation of the rainy season in West Africa using only surface data. Int. J. Climatol. J. R. Meteorol. Soc. 2000, 20, 865–880. [Google Scholar] [CrossRef]
  21. Jolliffe, I.T.; Sarria-dodd, D.E. Early detection of the start of the wet season in tropical climates. Int. J. Climatol. 1994, 14, 71–76. [Google Scholar] [CrossRef]
  22. Marteau, R.; Moron, V.; Philippon, N. Spatial coherence of monsoon onset over western and central Sahel (1950–2000). J. Clim. 2009, 22, 1313–1324. [Google Scholar] [CrossRef]
  23. Sivakumar, M. Predicting rainy season potential from the onset of rains in Southern Sahelian and Sudanian climatic zones of West Africa. Agric. For. Meteorol. 1988, 42, 295–305. [Google Scholar] [CrossRef]
  24. Raes, D.; Sithole, A.; Makarau, A.; Milford, J. Evaluation of first planting dates recommended by criteria currently used in Zimbabwe. Agric. For. Meteorol. 2004, 125, 177–185. [Google Scholar] [CrossRef]
  25. Kipkorir, E.C.; Raes, D.; Bargerei, R.J.; Mugalavai, E.M. Evaluation of two risk assessment methods for sowing maize in Kenya. Agric. For. Meteorol. 2007, 144, 193–199. [Google Scholar] [CrossRef]
  26. Kohonen, T. The self-organizing map. Proc. IEEE 1990, 78, 1464–1480. [Google Scholar] [CrossRef]
  27. Gueye, A.K. Modélisation Statistique des Précipitations Quotidiennes au Sénégal. Ph.D. Thesis, Universite Pierre et Marie Curie, Paris, France, 2010. [Google Scholar]
  28. Lamb, P.J. Large-scale tropical Atlantic surface circulation patterns associated with Subsaharan weather anomalies. Tellus 1978, 30, 240–251. [Google Scholar] [CrossRef]
  29. Nicholson, S.E. Revised rainfall series for the West African subtropics. Mon. Weather. Rev. 1979, 107, 620–623. [Google Scholar] [CrossRef]
  30. Youssouph, S.; Geremy, P.; Ansoumana, B.; Theo, V.; Thierry, L.; Honore, D.; Guillaume, Q.; Catherine, W.; Ousmane, N.; Aida Diongue, N.; et al. Intensity–duration–frequency (IDF) rainfall curves in Senegal. Nat. Hazards Earth Syst. 2018, 18, 1849–1866. [Google Scholar] [CrossRef]
  31. Funk, C.C.; Peterson, P.J.; Landsfeld, M.F.; Pedreros, D.H.; Verdin, J.P.; Rowland, J.D.; Romero, B.E.; Husak, G.J.; Michaelsen, J.C.; Verdin, A.P.; et al. A quasi-global precipitation time series for drought monitoring. US Geol. Surv. Data Ser. 2014, 832, 1–12. [Google Scholar]
  32. Herold, N.; Behrangi, A.; Alexander, L.V. Large uncertainties in observed daily precipitation extremes over land. J. Geophys. Res. Atmos. 2017, 122, 668–681. [Google Scholar] [CrossRef]
  33. Sacré Regis, M.D.; Mouhamed, L.; Kouakou, K.; Adeline, B.; Arona, D.; Houebagnon Saint, J.C.; Koffi Claude, A.K.; Talnan Jean, H.C.; Salomon, O.; Issiaka, S. Using the CHIRPS dataset to investigate historical changes in precipitation extremes in West Africa. Climate 2020, 8, 84. [Google Scholar] [CrossRef]
  34. Xie, P.; Joyce, R.; Wu, S.; Yoo, S.H.; Yarosh, Y.; Sun, F.; Lin, R. Reprocessed, bias-corrected CMORPH global high-resolution precipitation estimates from 1998. J. Hydrometeorol. 2017, 18, 1617–1641. [Google Scholar] [CrossRef]
  35. Huffman, G.J.; Adler, R.F.; Bolvin, D.T.; Nelkin, E.J. The TRMM multi-satellite precipitation analysis (TMPA). In Satellite Rainfall Applications for Surface Hydrology; Springer: Berlin/Heidelberg, Germany, 2010; pp. 3–22. [Google Scholar]
  36. Sorooshian, S.; Nguyen, P.; Sellars, S.; Braithwaite, D.; AghaKouchak, A.; Hsu, K. Satellite-based remote sensing estimation of precipitation for early warning systems. Extrem. Nat. Hazards Disaster Risks Soc. Implic. 2014, 1, 99–112. [Google Scholar]
  37. Bichet, A.; Diedhiou, b.A. West African Sahel has become wetter during the last 30 years, but dry spells are shorter and more frequent. Clim. Res. 2018, 75, 155–162. [Google Scholar] [CrossRef]
  38. Bliefernicht, J.; Salack, S.; Waongo, M.; Annor, T.; Laux, P.; Kunstmann, H. Towards a historical precipitation database for West Africa: Overview, quality control and harmonization. Int. J. Climatol. 2022, 42, 4001–4023. [Google Scholar] [CrossRef]
  39. Frei, C.; Christensen, J.H.; Déqué, M.; Jacob, D.; Jones, R.G.; Vidale, P.L. Daily precipitation statistics in regional climate models: Evaluation and intercomparison for the European Alps. J. Geophys. Res. Atmos. 2003, 108. [Google Scholar] [CrossRef]
  40. Froidurot, S.; Diedhiou, A. Characteristics of wet and dry spells in the West African monsoon system. Atmos. Sci. Lett. 2017, 18, 125–131. [Google Scholar] [CrossRef]
  41. Davy, E.; Mattei, F.; Solomon, S. An Evaluation of Climate and Water Resources for Development of Agriculture in the Sudano-Sahelian Zone of West Africa; World Meteorological Organization: Geneva, Switzerland, 1976. [Google Scholar]
  42. Richardson, A.J.; Risien, C.; Shillington, F.A. Using self-organizing maps to identify patterns in satellite imagery. Prog. Oceanogr. 2003, 59, 223–239. [Google Scholar] [CrossRef]
  43. Lorenz, E.N. Empirical Orthogonal Functions and Statistical Weather Prediction; Massachusetts Institute of Technology, Department of Meteorology Cambridge: Cambridge, MA, USA, 1956; Volume 1. [Google Scholar]
  44. Badran, F.; Yacoub, M.; Thiria, S. Chapter 7: Self-organizing Maps and Unsupervised Classification. In Neural Networks, Methodology and Applications; Springer: Berlin/Heidelberg, Germany, 2005; pp. 379–442. [Google Scholar]
  45. Liu, Y.; Weisberg, R.H.; Mooers, C.N. Performance evaluation of the self-organizing map for feature extraction. J. Geophys. Res. Ocean. 2006, 111. [Google Scholar] [CrossRef]
  46. Riveros, N.A.M.; Espitia, B.A.C.; Pico, L.E.A. Comparison between K-means and self-organizing maps algorithms used for diagnosis spinal column patients. Inform. Med. Unlocked 2019, 16, 100206. [Google Scholar] [CrossRef]
  47. Kiang, M.Y.; Kumar, A. An evaluation of self-organizing map networks as a robust alternative to factor analysis in data mining applications. Inf. Syst. Res. 2001, 12, 177–194. [Google Scholar] [CrossRef]
  48. Liu, Y.; Weisberg, R.H. Patterns of ocean current variability on the West Florida Shelf using the self-organizing map. J. Geophys. Res. Oceans 2005, 110. [Google Scholar] [CrossRef]
  49. Murtagh, F.; Hernández-Pajares, M. The Kohonen self-organizing map method: An assessment. J. Classif. 1995, 12, 165–190. [Google Scholar] [CrossRef]
  50. Liu, Y.; Weisberg, R.H. A review of self-organizing map applications in meteorology and oceanography. Self-Organ. Maps Appl. Nov. Algorithm Des. 2011, 1, 253–272. [Google Scholar]
  51. Vesanto, J.; Alhoniemi, E. Clustering of the self-organizing map. IEEE Trans. Neural Netw. 2000, 11, 586–600. [Google Scholar] [CrossRef] [PubMed]
  52. Diatta, I. Impact des Fluctuations Pluviométriques sur la Production Agricole Dans la Région de Thionck-Essyl en Basse Casamance. Université Cheikh Anta Diop de Dakar-Certificat D’aptitude à L’enseignement Moyen (CAEM). 2007. Available online: https://www.memoireonline.com/07/08/1185/impact-fluctuations-pluviometriquesproduction-agricole-thionck-essyl.html (accessed on 10 February 2024).
  53. Badji, A.; Mohino, E.; Diakhat, É.M.; Juliette, M.; Amadou Thierno, G. Decadal Variability of Rainfall in Senegal: Beyond the total seasonal amount. J. Clim. 2022, 35, 5339–5358. [Google Scholar] [CrossRef]
  54. Sultan, B.; Janicot, S. The West African monsoon dynamics. Part II:. The “preonset” and “onset” of the summer monsoon. Journal of climate. J. Clim. 2003, 16, 3407–3427. [Google Scholar] [CrossRef]
  55. Camberlin, P.; Diop, M. Application of daily rainfall principal component analysis to the assessment of the rainy season characteristics in Senegal. Clim. Res. 2003, 23, 159–169. [Google Scholar] [CrossRef]
  56. Sane, T.; Mbaye, D.; Pascal, S. Rainy season quality study in Upper Casamance (South Senegal). Sci. Chang. Planétaires/Sécheresse 2008, 19, 23–28. [Google Scholar]
  57. Diop, M. A propos de la durée de la saison des pluies au Sénégal. Sci. Chang. Planétaires/Sécheresse 1996, 7, 7–15. [Google Scholar]
  58. Panthou, G.; Vischel, T.; Lebel, T. Recent trends in the regime of extreme rainfall in the Central Sahel. Int. J. Climatol. 2014, 34, 3998–4006. [Google Scholar] [CrossRef]
  59. Salack, S.; Giannini, A.; Diakhaté, M.; Gaye, A.T.; Muller, B. Oceanic influence on the sub-seasonal to interannual timing and frequency of extreme dry spells over the West African Sahel. Clim. Dyn. 2014, 42, 189–201. [Google Scholar] [CrossRef]
  60. Davies, D.L.; Bouldin, D.W. A cluster separation measure. IEEE Trans. Pattern Anal. Mach. Intell. 1979, PAMI-1, 224–227. [Google Scholar] [CrossRef]
  61. Duchon, C.E. Lanczos filtering in one and two dimensions. J. Appl. Meteorol. Climatol. 1979, 18, 1016–1022. [Google Scholar] [CrossRef]
  62. Besson, L. Processus Physiques Responsables de l’Etablissement et de la Variabilité de la Mousson Africaine. Ph.D. Thesis, Université Pierre et Marie Curie-Paris VI, Paris, France, 2009. [Google Scholar]
  63. Sultan, B. Etude de la mise en place de la mousson en Afrique de l’Ouest et de la variabilité intra—Saisonnière de la convection. Application à la sensibilité des rendements agricoles. Ph.D. Thesis, Université Paris, Paris, France, 2002. [Google Scholar]
  64. Lafore, J.P.; Asencio, N.; Bouniol, D.; Flamant, C.; Guichard, F.; Hall, N.; Janicot, S.; Kocha, C.; Lavaysse, C.; Leroux, S.; et al. Évolution de notre compréhension du système de mousson ouest-africain. La Météorologie 2012, 11–16. [Google Scholar] [CrossRef]
  65. Cook, K.H. Generation of the African easterly jet and its role in determining West African precipitation. J. Clim. 1999, 12, 1165–1184. [Google Scholar] [CrossRef]
  66. Saley, I.A.; Sanda, S.I.; Bell, J.P.; Ly, M.; Salack, S.; Fode, M.; Diedhiou, A. Impacts potentiels de la Grande Muraille Verte sur le climat du Sahel et de l’Afrique de l’Ouest. Ann. l’Université Abdou Moumouni 2016, 1, 1–18. [Google Scholar]
  67. Nicholson, S.E.; Grist, J. A conceptual model for understanding rainfall variability in the West African Sahel on interannual and interdecadal timescales. Int. J. Climatol. J. R. Meteorol. Soc. 2001, 21, 1733–1757. [Google Scholar] [CrossRef]
  68. Newell, R.E.; Kidson, J.W. African mean wind changes between Sahelian wet and dry periods. J. Climatol. 1984, 4, 27–33. [Google Scholar] [CrossRef]
  69. Hagos, S.M.; Cook, K.H. Ocean warming and late-twentieth-century Sahel drought and recovery. J. Clim. 2008, 21, 3797–3814. [Google Scholar] [CrossRef]
Figure 1. Spatial distribution of annual cumulative precipitation in West Africa and Senegal averaged over the period from 1981 to 2018.
Atmosphere 15 00378 g001
Figure 2. Presentation of the working methodology.
Atmosphere 15 00378 g002
Figure 3. Spatial variability of annual precipitation totals, onset dates, and offset dates calculated for the period 1981 to 2010 using CHIRPS satellite data and NHMS-SN observation data in Senegal. The first line presents the annual accumulations of the CHIRPS precipitation data and the onset and cessation dates calculated using the CHIRPS data, respectively. The second line displays the annual accumulations of the NHMS-SN precipitation data and the onset and cessation dates calculated using the NHMS-SN data, respectively. The third line represents the percentage biases between the CHIRPS and NHMS-SN data for the annual accumulations, onset dates, and cessation dates, respectively. The fourth line illustrates the correlation coefficients between the CHIRPS and NHMS-SN data for the annual accumulations, onset dates, and cessation dates, respectively.
Atmosphere 15 00378 g003
Figure 4. Spatial distribution of the onset and offset dates of the rainy season (top) along with their respective standard deviations (bottom) in Senegal averaged over the period 1981 to 2018 for May to August ( M J J A ) for onset and September to November ( S O N ) for offset.
Atmosphere 15 00378 g004
Figure 5. Spatial distribution of the length of the rainy season (a) and its standard deviation (b) in Senegal averaged over the period 1981 to 2018.
Atmosphere 15 00378 g005
Figure 6. Coefficient of variation for rainy season descriptors (onset, offset, and season length) in Senegal averaged over the period 1981 to 2018. Values are expressed as percentages (%).
Atmosphere 15 00378 g006
Figure 7. Projection of the pixels of the year 1984 onto the self-organizing maps of the onset and offset.
Atmosphere 15 00378 g007
Figure 8. Distribution of aggregation levels for 20 categories, along with the dendrogram resulting from hierarchical classification applied to our neurons.
Atmosphere 15 00378 g008
Figure 9. Classification of neurons on the topological map for onset (left) and offset (right). The onset and offset dates from 1981 to 2018 are considered.
Atmosphere 15 00378 g009
Figure 10. Rationalization of the onset dates of the rainy season in Senegal: spatial onset classification on the left and time series of classes on the right averaged over the period from 1981 to 2010.
Atmosphere 15 00378 g010
Figure 11. Rationalization of the offset dates of the rainy season in Senegal: spatial end classification on the left and the time series of classes on the right).
Atmosphere 15 00378 g011
Figure 12. Spatial and temporal classification of the length of the rainy season in Senegal (1981 to 2018).
Atmosphere 15 00378 g012
Figure 13. Hovmöller diagram of latitude as a function of time of the 200 hPa geopotential height anomaly (top row) and 200 hPa temperature (bottom row) for the 1984 and 2007 monsoon seasons.
Atmosphere 15 00378 g013
Figure 14. Hovmöller diagram of latitude as a function of time of time of the 700 hPa wind (top row) and 850 hPa wind (bottom row) for the 1984 and 2007 monsoon seasons.
Atmosphere 15 00378 g014
Disclaimer/Publisher’s Note: The statements, opinions and data contained in all publications are solely those of the individual author(s) and contributor(s) and not of MDPI and/or the editor(s). MDPI and/or the editor(s) disclaim responsibility for any injury to people or property resulting from any ideas, methods, instructions or products referred to in the content.

