Review

An Appraisal of the Progress in Utilizing Radiosondes and Satellites for Monitoring Upper Air Temperature Profiles

by
Frederick M. Mashao
1,2,*,
Belay Demoz
3,
Yehenew Kifle
4,
Danitza Klopper
1,
Hector Chikoore
1,2,
Ricardo K. Sakai
5 and
Kingsley K. Ayisi
2
1
Department of Geography and Environmental Studies, University of Limpopo, Sovenga 0727, South Africa
2
Risk and Vulnerability Science Center, University of Limpopo, Sovenga 0727, South Africa
3
Physics Department, University of Maryland, Baltimore County, Baltimore, MD 21250, USA
4
Department of Math and Statistics, University of Maryland, Baltimore County, Baltimore, MD 21250, USA
5
Program in Atmospheric Sciences, Howard University, Beltsville, MD 20705, USA
*
Author to whom correspondence should be addressed.
Atmosphere 2024, 15(3), 387; https://doi.org/10.3390/atmos15030387
Submission received: 12 February 2024 / Revised: 5 March 2024 / Accepted: 18 March 2024 / Published: 21 March 2024
(This article belongs to the Section Upper Atmosphere)

Abstract

:
Upper air temperature measurements are critical for understanding weather patterns, boundary-layer processes, climate change, and the validation of space-based observations. However, there have been growing concerns over data discrepancies, the lack of homogeneity, biases, and discontinuities associated with historical climate data records obtained using these technologies. Consequently, this article reviews the progress of utilizing radiosondes and space-based instruments for obtaining upper air temperature records. A systematic review process was performed and focused on papers published between 2000 and 2023. A total of 74,899 publications were retrieved from the Google Scholar, Scopus, and Web of Science databases using a title/abstract/keyword search query. After rigorous screening processes using relevant keywords and the elimination of duplicates, only 599 papers were considered. The papers were subjected to thematic and bibliometric analysis to comprehensively outline the progress, gaps, challenges, and opportunities related to the utilization of radiosonde and space-based instruments for monitoring upper air temperature. The results show that in situ radiosonde measurements and satellite sensors have improved significantly over the past few decades. Recent advances in the bias, uncertainty, and homogeneity correction algorithms (e.g., machine learning approaches) for enhancing upper air temperature observations present great potential in improving numerical weather forecasting, atmospheric boundary studies, satellite data validation, and climate change research.

1. Introduction

Upper air temperature is a fundamental atmospheric parameter that affects weather patterns and climate. To understand and predict weather patterns and severe weather events, it is crucial to have accurate temperature data from the upper atmosphere [1]. Identifying climate change signals in the upper atmosphere is also critical due to the rising temperature in the troposphere and the cooling of the stratosphere which has been strongly associated with anthropogenic activities [2,3]. Consequently, in situ measurements of atmospheric temperature, between the surface and the top of the stratosphere (i.e., 50 km), provide high-quality data that are used to understand boundary layer processes, radiative transfer calculations, air pollution meteorology, and to validate estimates from space-based instruments [4]. In this context, high-quality data refer to observational data that are accurate, precise, reliable, and free from significant errors or biases [5]. For instance, high-quality RS data can be used to understand boundary layer processes such as vertical structure [6], Boundary Layer Height [7] evolution [8], and turbulence [9]. Furthermore, to understand radiative transfer calculations, RS data provide crucial atmospheric parameters such as temperature, humidity, and pressure which are used to validate and calibrate radiative transfer models [10]. For pollution meteorology, RSs are important for detecting temperature inversions, atmospheric stability and mixing, understanding the transport of pollutants, validation, and the improvement in air quality models [11,12].
The RS has the advantage of being a direct measurement of atmospheric variables in the troposphere and lower stratosphere (~25 km) with the necessary accuracy and detail, which are essential for numerical weather prediction (NWP) and the monitoring of regional and global climate change [13]. The RS has the advantage of being a direct measurement of temperature, especially in the upper atmosphere where other instruments, such as satellites, cannot reach it; there have been major drawbacks in its applications. For instance, there have been growing concerns over radiosonde (RS) data discrepancies, the lack of homogeneity, biases, and discontinuities associated with historical climate data records [14]. For instance, ref. [15] has documented these issues observed in the historical monthly upper air humidity dataset for Australia. Meanwhile, ref. [16] expressed this issue when analyzing global subdaily radiosonde temperature data from 1958 to 2018. These studies have shown large discrepancies in global temperature trends, between trends derived from space-based instruments, balloon-borne (RS) instruments, and expected trends diagnosed with the state-of-the-art models ([17,18]). The source of uncertainty in the trends of upper air (e.g., 10 m above the surface to the Karman line at approximately 100 km above sea level) temperature records results from frequent and undocumented changes in instrumentation. These uncertainties are also caused by calibration errors or inhomogeneities in the RS dataset that occur over time as instrumentation is upgraded (e.g., from RS92 to RS41), observing practices are changed, processing code is improved, and due to the influence of solar and infrared radiation on the thermistor [19]. Several attempts were made to improve the quality of the measurement series by applying methods to remove apparent temperature discontinuities that occurred due to changes in instruments and practice [20,21]. Such methods include intercomparison (i.e., differencing) [22], homogenization (i.e., Pairwise Homogenization Algorithm (PHA)) [23], temperature bias corrections (i.e., dual RS launches) [24], empirical corrections (i.e., fit regressions) [25], and using reference data (GRUAN datasets) [26], statistical (i.e., RHARM homogenization, [27]), and machine learning approaches to detect patterns and anomalies in the data [28]. It is important to note that the list is exhaustive. For example, the comparison of temperature measurements from adjacent weather stations with RS data serves as one of the methods used to identify errors that come with changes in instrumentation. However, this technique fell short due to the low number of collocated observations and large atmospheric variability [29]. The limited number of collocated observations, especially in remote or sparsely populated regions, results in gaps in the dataset and makes it challenging to capture the full range of atmospheric conditions, leading to uncertainties in analysis and modeling. Resultantly, the data still failed to meet the needs of climate scientists [29,30]. Therefore, it is essential to develop techniques that will separate temperature signals from unavoidable non-climatic effects caused by instrument instabilities, measurement biases, and network inhomogeneities [29].
Meteorological satellites provide an alternative means of obtaining upper air temperature estimates which are assimilated into NWP models. Assimilating space-borne meteorological data into NWP models is a complex process that comes with its own set of challenges and limitations [31]. For instance, satellite data may have inherent biases, errors, or uncertainties due to instrument calibration, orbital drift, or atmospheric conditions [32]. In addition, variations in sensor characteristics, spatial resolution, and data processing techniques can also introduce inconsistencies in the satellite observations leading to errors [31]. Therefore, space-borne meteorological data need to undergo careful calibration, validation, and error estimation prior to assimilation in NWP models [31,33].
Space-borne meteorological instruments include passive sensors such as microwave sounders [34], infrared wave sounders [35], radio occultation (RO) systems [36], and radars [37]. However, satellite remote sensors are also imperfect and prone to errors. For instance, microwave sounders boost global coverage at a high sampling rate but suffer from coarse resolution (e.g., AMSU-A—48 km × 48 km), whereas infrared sounders (e.g., MTG-Sounders—4 km × 4 km) are sensitive to contamination by clouds and other aerosols. In addition, the potential of RO to provide high-quality temperature data is also limited by biases and uncertainties associated with each of the observation types [38]. For example, RO data suffer from the negative refractivity bias, especially pronounced in the lower atmosphere or planetary boundary layer [39]. In addition, RO retrieval algorithms rely on assumptions about the atmospheric properties and their vertical profiles [36]. Therefore, errors or uncertainties in the assumed atmospheric models can propagate into the retrieved data, affecting the accuracy of temperature and humidity profiles [40]. Despite shortcomings associated with these instruments, they have also been used extensively to correct and characterize RS temperature biases in the upper and lower stratosphere [27,36].
For instance, ref. [4] compared RS with COSMIC atmospheric profile data to compute differences among RS types and the effects of imperfect collocations. Meanwhile, ref. [36] developed a novel technique to correct RS temperature biases using RO data. Although various studies have been conducted to enhance the quality of upper air temperature measurements to improve the validation of space-based observations and weather forecasting [21,41,42], there is still a lack of literature review studies that focus on the uses of RS and space-based instruments for monitoring upper air temperature records despite their significant contributions in providing data for studying atmospheric processes, climate change, and numerical weather forecasting. For instance, the previous reviews focused only on the uses of RSs in climate change studies (e.g., [43,44]). Ref. [45] provided a brief review of the global satellite dataset of air temperature derived from satellite remote sensing and weather stations. The reviews by ref. [46] focused only on RO for monitoring upper air temperature in the tropics.
Therefore, this article sought to review the existing literature on the progress and developments of RS and space-based instruments for monitoring upper air temperature profiles. Additionally, it reviews the challenges and prospects of using RS and space-based instruments for upper air temperature monitoring, given the immense scope of RS and space-based instruments for monitoring upper air temperature issues. We first review in situ measurements and remote sensing applications for monitoring upper air temperature records as well as their associated challenges. Then, we delve into niche areas whereby upper air temperature observations are used such as weather forecasting, atmospheric boundary layer, and climate change studies. We then discuss the progress, challenges, and future directions of the research focusing on monitoring upper air temperature profiles using in situ and satellite observations. We conclude the review with a brief overview of the results obtained in the study, highlighting important findings and future research endeavors.

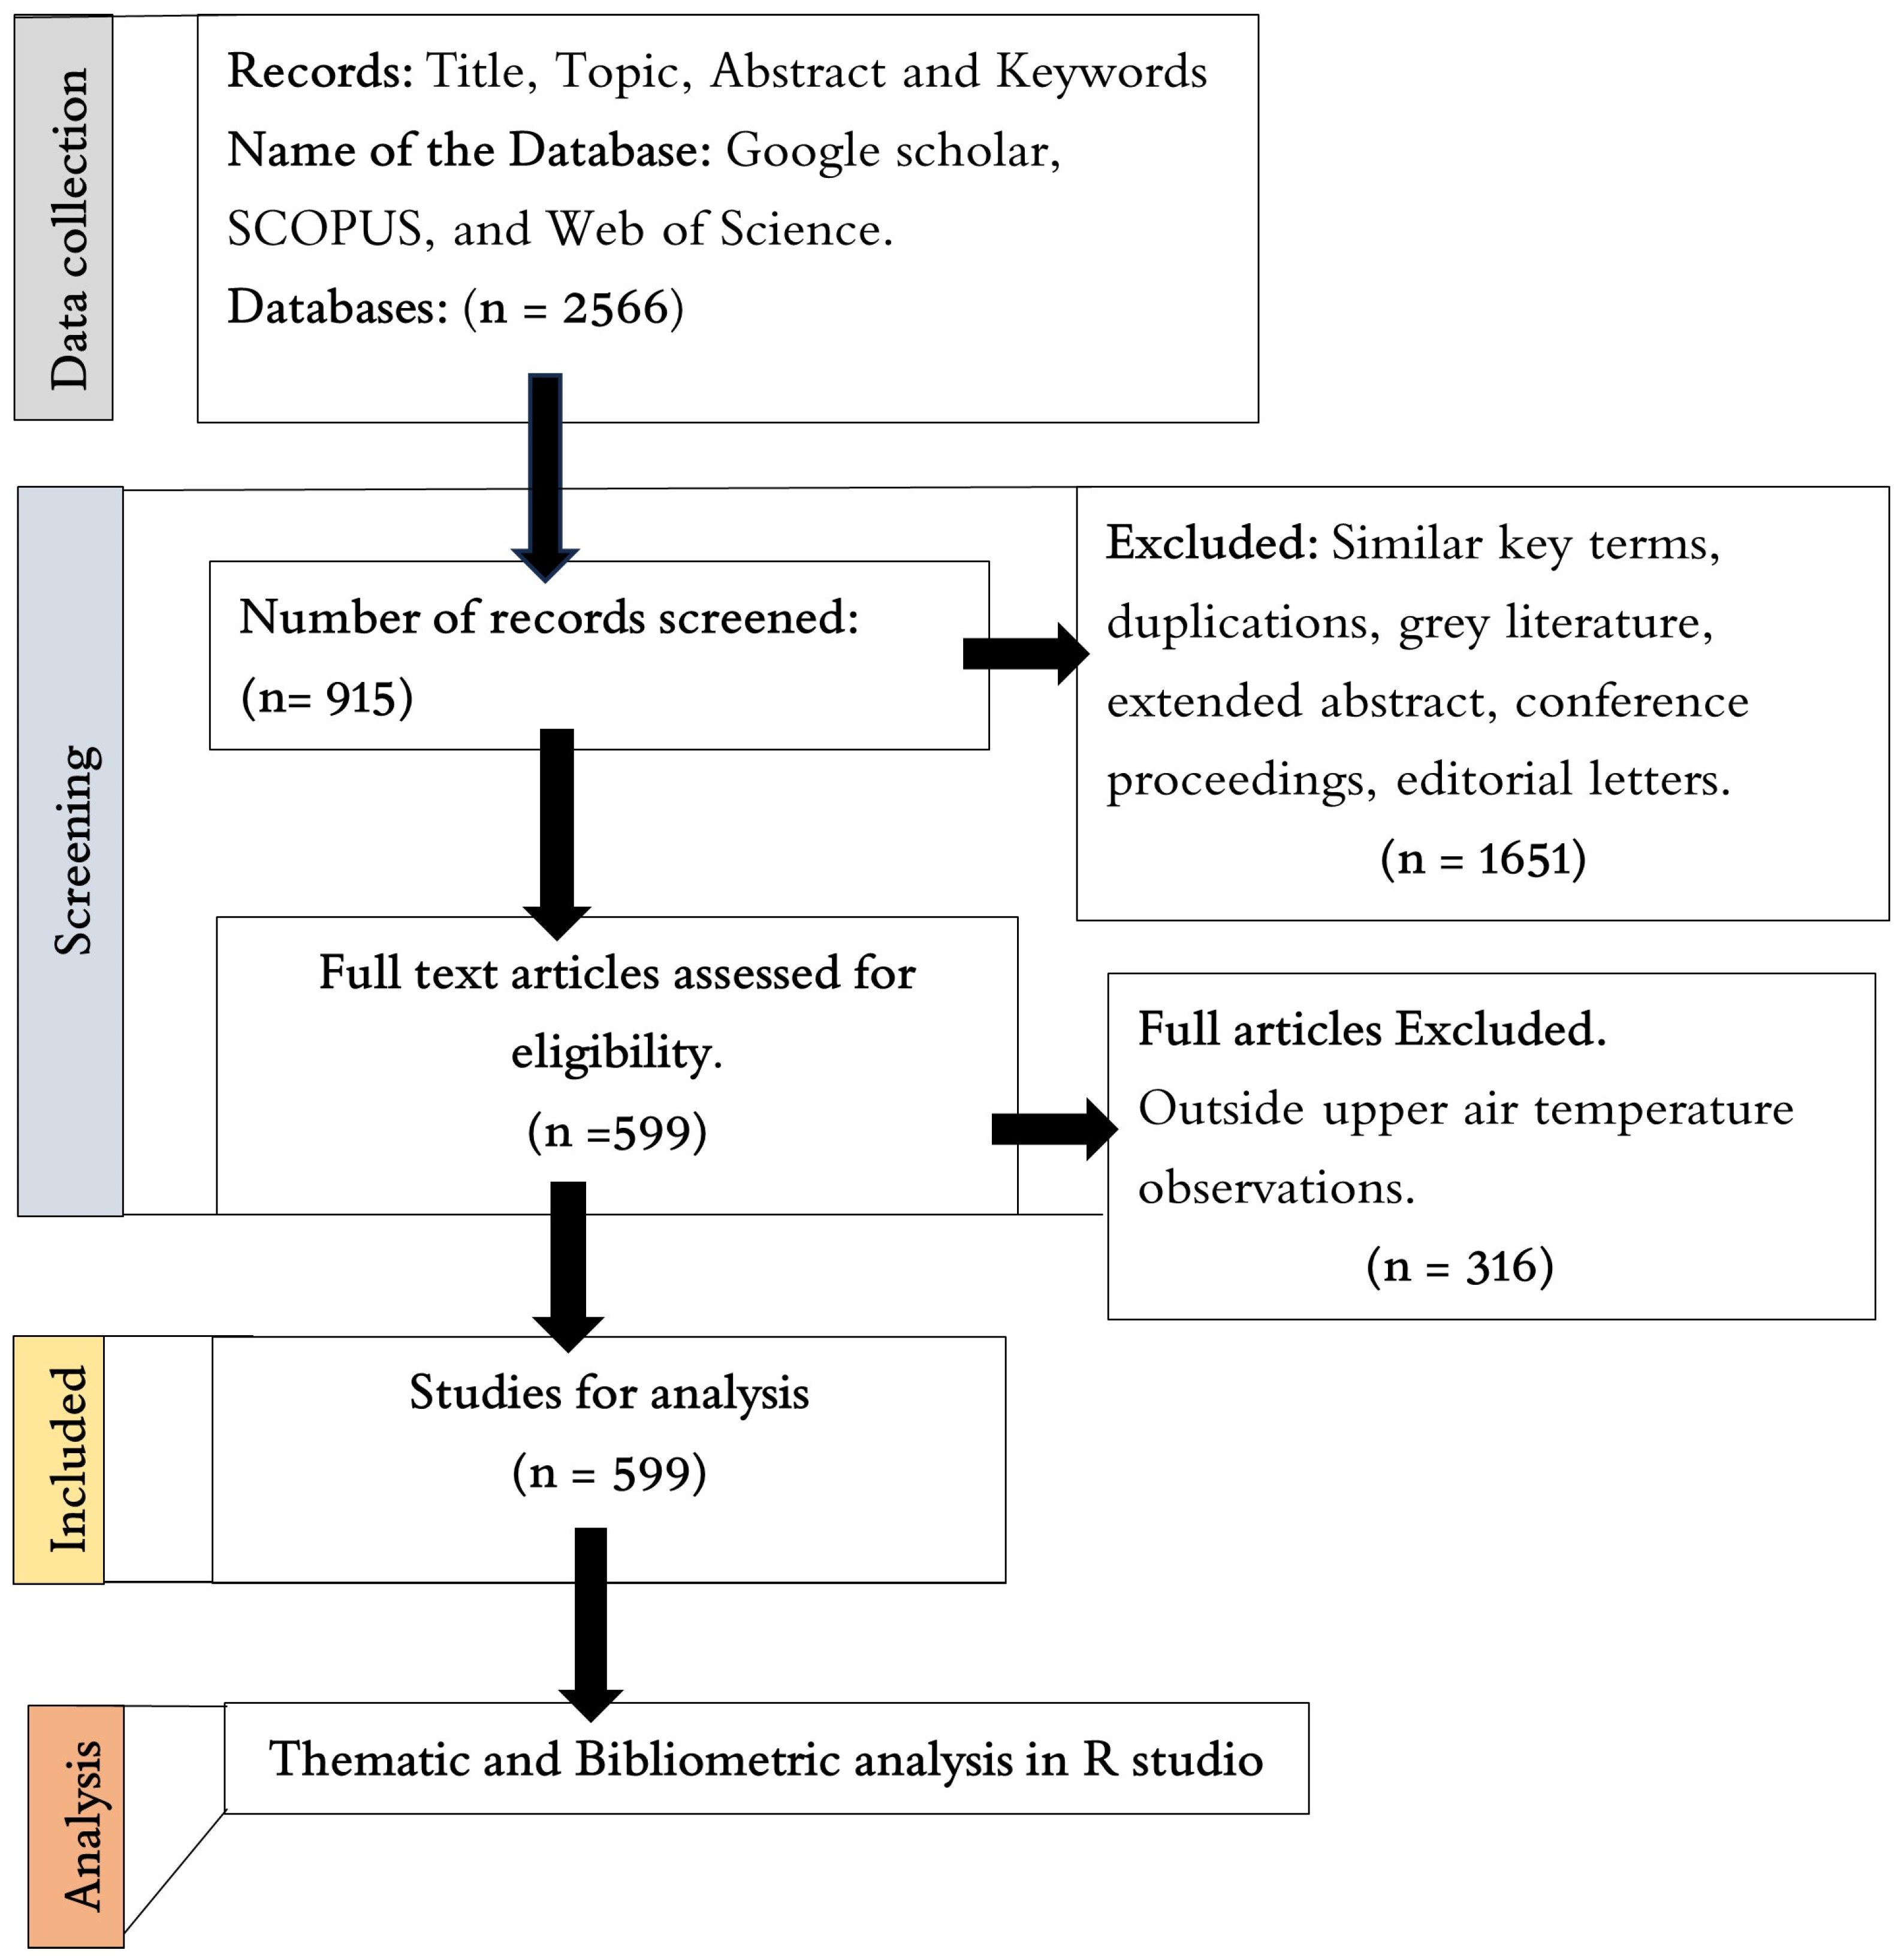
2. Research Method and Literature Search

This study adopted a systematic review method [47] to identify rigorously, critically appraise, and summarize empirical studies published between 2000 and 2023 reporting on the use and developments of RS and space-based instruments for monitoring upper air temperature profiles. The studies included in this systematic review were appraised based on a recognized set of criteria such as the study design, methodological rigor, bias assessment, outcome measures, data collection and analysis, reporting quality, and publication bias, following the approach by [48]. This criterion was used to ensure the methodological quality and reliability of the findings.
The approach taken to querying the literature consisted of a selective title/abstract/keyword search in specific scientific libraries such as Google Scholar, Scopus, and Web of Science databases, targeting peer-reviewed international journals related to the use of radiosondes and satellites for monitoring upper air temperature records. A regressive reference list assessment was also utilized to identify supplementary journal articles from relevant literature reviews and the corresponding references.
Terms from the initial search query included “radiosonde”, “satellites” AND “atmospheric temperature measurements” for studies published between 2000 and 2023. Then, a total of 74,899 publications were retrieved from the search with 36,800 from Google Scholar, 31,670 from Scopus, and 6429 from Web of Science. Using level 2 search parameters which included terms like “atmospheric temperature trends”, “radiosonde challenges”, “radio occultation”, “temperature retrieval”, algorithm evaluation”, and “satellite validation”, the retrieved publications were subjected to additional screening. Level 2 search parameters were used to refine the search results and focus on the most relevant studies that discuss the obstacles and problems faced in monitoring upper air temperatures. This filtering approach resulted in a total of 2566 articles, with 1210 articles from Google Scholar, 1050 articles from Scopus, and 306 articles from Web of Science. The third level was performed to further refine and focus on relevant papers that identify challenges and issues while presenting practical applications of upper air temperature data. Therefore, the screening included keywords such as “discontinuities”, “errors”, “uncertainties”, “inhomogeneities”, “biases”, “weather forecasting”, “atmospheric boundary layer”, and “climate change”. The chosen keywords align closely with the objectives of the systematic review, which aims to assess the current state of knowledge, identify gaps and challenges, and explore the prospects of using remote sensing and space-based instruments for upper air temperature monitoring.
As a result, 599 articles (see Figure 1) were eventually included in the analysis after removing duplicates, papers that were not in English, grey literature, extended abstracts, conference proceedings, and publications that were not published between 2000 and 2023. All the remaining 599 articles were saved in Microsoft Excel and a thematic analysis was performed to comprehensively outline the progress, gaps, challenges, and opportunities related to using radiosonde and space-based instruments for monitoring upper air temperature for the validation of space-based observations, weather forecasting, atmospheric boundary, and climate change studies. Furthermore, the papers were exported to the “Bibtex” format and were subjected to a bibliometric analysis in R studio [49]. The key metrics considered in the bibliometric analysis of this study included publication trends, keyword analysis, and co-citation analysis. These metrics provided insights into the landscape of the research on the topic, highlighting influential works, emerging trends, and the overall impact of the literature. Finally, Figure 1 shows a flow diagram of the methodology adopted to screen, select, and analyze the relevant publications covered in this study, as also illustrated by [50].

3. Results

3.1. In Situ Measurements for Monitoring Upper Air Temperature Profiles

Upper air includes the atmospheric regions which cannot be determined or described solely on surface observations [36]. These regions extend from just about 20 m above the surface to the Karman line which is about 100 km above sea level. The Karman line forms a boundary between the atmosphere and outer space [36]. This demarcation is significant because it marks the altitude at which the atmosphere becomes extremely thin and the distinction between “air” and “space” becomes less clear [51]. In the context of upper air observations, the Kármán line serves as a reference point for the uppermost reaches of Earth’s atmosphere that are typically studied [51]. Upper air observations date back to the mid-19th century, when meteorologists started experimenting with the use of a kite to carry aloft thermometers and barometers [52], and much progress has been made ever since. Between the 1920s and 1930s, radiosondes were invented by Vilho Vaisala in Finland and independently by Pavel Molchanovin in the Soviet Union [44] and have since enabled meteorologists to obtain important information about the behavior of the winds above the Earth’s surface through the troposphere and stratosphere. These exercises were previously expensive, sporadic, and difficult to monitor using ground-based instruments [53].
The longest existing in situ upper air RS records (Integrated Global Radiosonde archive) date back to 1958 [54] and provide unique information on essential climate variables that is not available from remote sensors. RSs play a vital role in the provision of upper air temperatures that are assimilated into NWP models, along with other observational data from, for example, surface stations and space-based instruments [53,55]. RSs incorporate a battery-powered telemetry instrument package that is carried into the atmosphere typically by a weather balloon [33]. Telemetry instruments play a crucial role in radiosondes by enabling the transmission of data from the radiosonde instrument to the ground station [56]. This capability allows meteorologists and scientists to receive real-time information about atmospheric conditions at various altitudes, contributing significantly to upper air measurements and weather forecasting [57]. RS instruments measure temperature, pressure, altitudes, wind (both speed and direction), relative humidity, and cosmic ray readings at high altitudes [33,55]. There are other classes of radiosondes such as rawinsondes and dropsondes [58]. A rawinsonde is a class of radiosondes whose position is tracked as it ascends in the atmosphere to provide wind speed and direction, although, in practice, radiosonde and rawinsonde are frequently used interchangeably [33,53]. On the other hand, dropsondes are released from airplanes and fall rather than being carried by weather balloons [33]. These instruments are normally employed for different applications; for instance, radiosondes are used primarily for obtaining vertical profiles of the atmosphere and numerical weather prediction models [56]. Meanwhile, rawinsondes are used to obtain detailed wind data at various altitudes, especially for studying the behavior of jet streams, fronts, and other weather systems. On the other hand, dropsondes are used in situations where precise atmospheric data are needed in a specific location or along a specific path (e.g., detailed structure and the intensity of storms) [59].
In situ measurements for upper air temperature have also been observed from aircraft [60], drones [61], and sounding rockets [62]. These instruments present their strengths and weaknesses compared to balloon-borne radiosondes. For example, aircraft offer flexibility to be deployed rapidly, with various instruments for specific locations and altitudes, providing targeted measurements where needed [63]. However, they are expensive to maintain, weather-dependent (i.e., not operating under severe storms), and limited to lower- and mid-level altitudes, unable to reach the upper atmosphere like balloons or sounding rockets [64]. Concurrently, drones are more cost-effective for localized measurements and can fly at lower altitudes than balloons, providing detailed data closer to the Earth’s surface [65]. Some drawbacks associated with drones include that they can only go up to 10 km altitude, are weather-dependent, and have limited flight endurance, which can restrict the duration of data collection [65]. Sounding rockets can reach much higher altitudes with larger sophisticated payloads than balloons or aircraft, providing data from the upper atmosphere and even into space [62]. However, sounding rocket missions are expensive and complex to plan and execute [62].
While much has changed in the capabilities of the instruments over the years, balloon-borne RSs are still one of the primary means by which in situ upper air weather information is collected globally. For instance, in the Northern Hemisphere, ref. [66] compared the use of the Atmospheric InfraRed Sounder (AIRS) and radiosonde observations over West Africa. Meanwhile, ref. [28] assessed the contrasts between upper temperature profiles and multiple reanalysis datasets in China. In the Southern Hemisphere, ref. [26] combined RS data from the distributed GRUAN site Lauder–Invercargill, New Zealand, to provide a site atmospheric state best estimate (SASBE) [67] of the temperature. The latter studies have underscored the critical significance of improving RS data quality irrespective of location and the pivotal role it plays in validating and calibrating other datasets, such as space-based and ERA5 reanalysis data. Ref. [44] provided a review of upper air temperature trends and then highlighted the current problems and results. A review by [68] showed that the spatial density and accuracy of RS data widely vary according to climate variables, the region of the world, and the layer of the atmosphere. For instance, regions with more significant temperature and humidity variations tend to have denser radiosonde networks [68]. Furthermore, the accuracy of radiosonde data can also be influenced by the calibration of the instruments used [68]. Table 1 summarizes the other studies on in situ upper air temperature observations and their associated accuracies.

3.2. Challenges of In Situ Radiosonde Measurements for Upper Air Temperature Observations

Considerable progress (Figure 2) has been made over the last few decades in using in situ RS measurements for upper air temperature observations. For instance, the number of papers published between 2000 and 2023 (Figure 2) indicates that there has been a significant surge in interest in using RS measurements for upper air temperature observations, and 2019 emerged as the most productive year. Figure 2 also portrays a steady decline in the number of publications from 2020 to 2023 despite the expansion of the global operational upper air network over the years from about 800 stations in the year 2014 [73] to approximately 1723 stations in 2019 [54].
However, the exact number of active RS launching sites that exist globally to date is still not clear as the number fluctuates due to a couple of factors. For instance, most of the RS stations are sparsely distributed and are densely concentrated in Northern Hemisphere land areas (see Figure 3), leaving large regions of the world’s oceans and the Southern Hemisphere essentially unmonitored [26,74]. Figure 3 shows that regions such as Africa, South America, the Southern Ocean, and the Antarctic are particularly underrepresented in terms of radiosonde observations. This leads to significant data gaps, and biases in climate models, and limits our understanding of the Southern Hemisphere weather and global atmospheric profile, especially in these crucial regions where severe weather events are becoming prevalent (e.g., tropical cyclones) [75].
This imbalance in the spatial distribution of RS launching sites can be attributed to the high cost of RS launches (approximately USD 500 per launch) which is too expensive for developing countries, thus limiting the number of upper air sites worldwide (800) [20,61,73,76]. In addition, since each station launches RSs twice (i.e., at 00:00 and 12:00 UTC) per day for every day of the year, this standard practice has led to serious budget constraints, and some countries such as Russia, Mexico, and Brazil are cutting their RS programs from two ascents per day to one [77].
In addition, large-scale disruptions and movement restrictions such as the COVID-19 pandemic also influenced the quantity of observations especially high-quality in situ observations that are made by commercial aircraft every day [78,79]. For more information on this subject, ref. [79] reviewed the impacts of COVID-19 on commercial aircraft-based observations for NWP. The latter issues have led to the regional reduction in RS reports and were reported to have a significant impact on forecast performance (i.e., increased errors and uncertainties), which then affected global forecast scores [77,79]. Furthermore, the reduction in these observations has been linked to challenges in predicting the onset and intensity of tropical cyclones and severe weather events [80].
Figure 3. Global distributions of radiosonde launching [81].
Atmosphere 15 00387 g003
Despite the high launching costs, other factors that affect the spatial distribution and temporal resolution of the radiosondes illustrated in Figure 3, especially in Africa, are telecommunications issues rather than ascents not being made at all. These issues include inadequate internet connectivity, the lack of reliable phone lines, and the limited availability of satellite communication [82]. It is also important to note that radiosondes transmit data in real-time to ground stations using radio signals or satellite communication [83]. However, in areas with poor telecommunications infrastructure, delays or interruptions in data transmission can occur, resulting in a low and variable number of RS reports. Meanwhile, in remote islands, it is more expensive to maintain RS launching sites, and it takes longer to fix equipment failures, thus limiting the number of global active stations [77]. For instance, transporting personnel and equipment to these remote stations can be difficult and costly. This can lead to delays in maintenance visits or the infrequent servicing of instruments. In addition, stations in remote islands, particularly in the tropics, may face harsh weather conditions such as tropical storms, high humidity, and corrosion from saltwater [84]. These conditions can lead to equipment degradation and malfunctions. This also shows that not all observational sites produce continuous series, since some stations constantly experience interruptions in soundings, resulting in the continuity of the series that is not ideal [20].
The value and quality of upper air observations have gained a lot of interest recently, due to their important role in weather forecasting and the validation of space-based observations. The RS has been providing profiles of the initial state of the atmospheric analysis which drives NWP models and improves forecast accuracy and the calibration of space-based estimates. The World Meteorological Organization has established requirements for the accuracy (Table 1) of the data gathered by RSs (see, e.g., [85]). For instance, operational standards allow for errors of 1 K in the tropospheric temperature and less than 7.5% in the relative humidity (RH) [85]. However, many stations around the world are still struggling to comply with these requirements due to several factors such as defective RSs or ground equipment, the impact of solar/IR radiation on the RS temperature sensors, and observer errors [81]. Compliance with WMO accuracy requirements is essential to ensure the quality and reliability of these observations [85]. Accurate and standardized upper air data not only improve the accuracy of weather forecasts but also enhance our understanding of climate variability and change. Meeting WMO standards ensures that meteorological observations are consistent, comparable, and trustworthy, benefiting global efforts in weather prediction, climate research, and disaster preparedness [85].
RS challenges have been extensively reviewed in the past few decades. For instance, a review by [44] highlighted RS issues related to vertical coverage, as opposed to only spatial coverage. It was reported that poor sampling in the stratosphere in contrast to the troposphere was associated with high uncertainty and gave rise to biases in the upper air temperature observation trends [44]. The biases resulting from the extremely dry and solar radiation-influenced conditions and the low pressure at altitudes above the tropopause are still a challenge for RS sensor technologies [44]. Solar radiation-induced heating can lead to warmer temperature measurements in the upper atmosphere resulting in a distorted view of the temperature profile, affecting weather forecasts and climate studies [86]. Moreover, low-pressure conditions at altitudes above the tropopause can lead to drift in the calibration of pressure sensors over time [87]. This drift can result in inaccuracies in pressure measurements, affecting the calculation of altitude and density [87]. Although manufacturers have attempted to develop algorithms for removing the effects of solar radiation, it was reported to cause overcorrection [41] resulting in erroneous data. Biases associated with solar radiation effects also vary for different RS sensor types and heights [19]. For example, some sensors such as Vaisala RS90 undergo relatively objective radiation correction, but it is still difficult to objectively trace, identify, and remove inherent sensor biases for the historical RS data and use the corrected RS temperatures to build long-term temperature climate records [19]. Recently, attempts have been made to reduce the influence of radiation on temperature measurements; for example, ref. [86] adopted an approach whereby the external surfaces of the sensor plates were covered with aluminum foil to lessen the impact of solar radiation. Additionally, the interior surfaces of the plates were coated in black to lessen the effects of indirect radiation. Computational fluid dynamics (CFD) and neural network techniques were used to quantify temperature errors of the sensors fitted with the new radiation shield caused by different radiations (direct solar radiation, reflected radiation, diffused radiation, and long-wave radiation). The study managed to achieve the observed and anticipated temperature errors of 0.036 °C (correlation coefficient), 0.046 °C (mean absolute error), and 0.99 (root mean square error), respectively.
The issue of uncertainties that exist within long-term temperature climate records constructed from in situ measurements and satellite estimates remains the most challenging problem for climate change research. Inhomogeneities associated with temperature records are mainly due to changes in instruments, data transfer or processing algorithms, and site locations [88,89]. For instance, over the years, there have been changes in the types of instruments used to measure temperature. This includes shifts from mercury thermometers to electronic sensors, which can introduce biases if not properly adjusted for [28]. Moreover, weather stations are sometimes moved to different locations over time due to changes in land use, urbanization, or logistical reasons. Such relocations can create artificial temperature trends or discontinuities in the data [89]. Some regions, especially in developing countries or remote areas, may have sparse or incomplete temperature records. Missing data can introduce uncertainties in regional climate analyses [89]. Climate models rely on accurate historical data for calibration and validation [90]. Biases or uncertainties in temperature records can lead to discrepancies between model projections and observed trends [90].
Several approaches have been developed in the past few decades to detect, estimate, and eliminate these apparent inhomogeneities. For example, ref. [91] performed intercomparisons between the radiosonde-based and satellite (e.g., Microwave Sounding Unit (MSU)) radiance to detect and remove most of the mean warm bias from the RS records. The study managed to achieve a robust warming maximum of 0.2–0.3 K (10 yr) − 1 for the 1979–2006 period in the tropical upper troposphere using homogenized radiosonde datasets. Ref. [92] used the statistical modeling of the collocation uncertainty of atmospheric temperature profiles and achieved 85% of the total collocation uncertainty and 0.2% measurement error. Both studies managed to achieve the acceptable bias standards according to the WMO (<1 K) [85]. Meanwhile, ref. [13] combined metadata (i.e., to determine the candidate dates when inhomogeneities could be introduced in the datasets) and statistical inference to create the HadAT datasets. The study produced only parametric uncertainty, because of their methodological choices, and not structural uncertainty which relates to sensitivity to the choice of approach [13]. More recently, ref. [22] also compared two RSs (i.e., iMS-100 and RS92) and reanalysis data using statistical approaches for the detection of steplike changes in upper air temperature records. The results of the study managed to produce a difference of around −0.1 K, and the data were mostly in agreement [22].
Although much has been done to detect inhomogeneities and remove biases in the upper air temperature time series, the subject remains open for further investigations [44]; despite all these efforts, resultant data still fails to meet the needs of climate scientists [29]. In an attempt to avert the radiosonde’s drawbacks, primarily the low sampling frequency and balloon drift, refs. [36,67] developed an atmospheric state best estimate (SASBE) for humidity and temperature. The SASBE methodology employs an optimal estimation framework, which integrates different data sources while considering their uncertainties to derive the best estimate of atmospheric state variables [67]. By integrating multiple data sources and accounting for uncertainties, the SASBE provides a more accurate and reliable estimation of humidity and temperature profiles [26]. Therefore, the SASBE can lead to improved forecast accuracy, especially for short-range and severe weather events. However, ensuring the accuracy and reliability of data from multiple sources is a key challenge when developing an SASBE. Strict data quality control procedures must be adopted to identify and correct errors or biases [26]. The optimal estimation framework used in the SASBE involves complex mathematical algorithms and computations, requiring substantial computational resources [26]. Although the SASBE serves as a promising framework to improve the value of temperature and humidity measurements by combining data records from collocated sites or multi-source instruments, further investigations are required to realize its potential. Lastly, it is essential to acknowledge that the compilation of challenges and proposed solutions presented in this review paper is not exhaustive. This review draws upon the studies that were included and analyzed within the scope of this work. As the study of upper air temperature continues to evolve, new insights and perspectives may emerge, thereby offering additional dimensions to the challenges faced and the strategies proposed. The limitations of this review lie in its reliance on the available literature up to the time of writing. Future research endeavors are encouraged to explore further aspects and potential solutions for addressing the complexities discussed herein.

3.3. Remote Sensing Applications for Upper Air Temperature Observations

Remote sensing has gained enormous traction and evolved (Figure 4) over the years for monitoring upper temperature profiles, whenever direct measurements are expensive or difficult to execute [93]. For example, Figure 4 illustrates a thematic evolution of remote sensing concepts associated with upper air temperature observations with the objective of the detection and identification of essential topics between 2000 and 2023, including thematic change and evolution in the remote sensing of upper air research field. The period of 23 years considered for our collection of papers was split into five periods: 2000–2007, 2008–2014, 2015–2017, 2018–2020, and 2021–2023, as shown in Figure 4. Furthermore, papers on remote sensing applications on upper air temperature (shown in orange and brown color) became more prevalent between 2008 and 2004, 2015 and 2017, 2018 and 2020, and 2021 and 2023, evolving from studies on modeling, data assimilation, absorption cross-sections, and energy fluxes.
This suggests that the number of papers on the remote sensing of upper air temperature has progressively increased over time, and thematic evolution has been ongoing since the introduction of satellites in the 1960s for different meteorological applications [33]. This evolution has revolutionized weather observations and forecasting [53]. In this context, remote sensing involves collecting or capturing information about the upper air without being in physical contact with the explored region of the atmosphere [94]. Remote sensing sensors do not directly measure atmospheric variables, instead, information about atmospheric conditions is retrieved from raw satellite properties such as absorption spectra [95], radiance derived from radiometers [96], and the time delay of signal data from RO [97]. In most cases, the extraction of upper air climate variables such as temperature from the raw satellite data requires state-of-the-art retrieval algorithms (e.g., RO—Abel transform [98]) and, most importantly, validation [56]. For instance, refs. [93,99] provided an extensive review of retrieval algorithms for extracting atmospheric variables from satellite estimates and their associated inverse problems. The retrieval algorithms can be derived from statistical relationships between satellite radiance and target parameters or the inversion of a system [99].
Remote sensing observations of upper air temperatures have been made using a wide range of instruments (i.e., ground-based and satellite-based) and measurement techniques [93]. For instance, ground-based measurements include Raman lidar, differential absorption lidars (DIALs), radio acoustic sounding systems (RASSs), and radiometers [100]. A Raman lidar is a type of lidar (Light Detection and Ranging) system that utilizes the Raman scattering effect to measure atmospheric properties including temperature [101]. Lidar systems use laser pulses to probe the atmosphere, and the Raman lidar specifically employs Raman scattering to obtain information about the composition and structure of the atmosphere [101]. On the other hand, differential absorption lidars (DIALs) are remote sensing instruments used to measure the concentration of trace gases and aerosols in the atmosphere [102]. They employ the principle of laser-induced absorption spectroscopy to detect specific molecules by measuring the absorption of laser light at particular wavelengths [102]. DIALs operate by transmitting two laser beams, typically referred to as the “on-line” and “off-line” wavelengths, into the atmosphere [102]. Meanwhile, a radio acoustic sounding system (RASS) is a remote sensing instrument designed to measure vertical profiles of the temperature and wind speed in the atmosphere [103]. It employs the principles of radar technology and acoustic sound waves to gather data on the atmospheric conditions at various altitudes above the instrument’s location [103].
Furthermore, most satellite instruments measure electromagnetic radiation, some measure sound propagation. For example, ref. [104] has used the Hyperspectral Infrared Atmospheric Sounder (HIRAS) to retrieve upper air temperature and moisture profiles in China. The study managed to achieve temperature (relative humidity) accuracies ranging from 1 k to 1.5 k for low, mid, and high troposphere layers [104]. More recently, ref. [105] used satellite microwave sounders and a backward merging approach to monitor temperature records in the mid-tropospheric regions. Nonetheless, Table 2 summarizes a variety of studies for monitoring atmospheric temperatures using remote sensing, ground-based (i.e., looking up), and satellite-based instruments (i.e., looking down). Table 2 also presents the various instrument types used, location of the study, climate variable investigated, and associated biases or accuracy of the variable investigated.
In addition, Global Navigation Satellite Systems (GNSS) radio occultation (RO) has been used to retrieve temperature and water vapor profiles that are then used to study weather events in recent years [106]. RO occurs when a radio signal from a transmitter on a global positioning system (GPS) satellite propagates through the atmosphere and they are bent and delayed due to atmospheric moisture gradients for minutes [107]. The accumulated bending angle can be retrieved using the observed phase data on the receiver and the orbits of GNSS and Low Earth orbit (LEO) satellites [107].
Based on the bending angle, a profile can be retrieved using statistical algorithms such as Abel inversion [36], ray tracing [108], Monte Carlo simulations [109], optimal estimation [110], Fourier Transform [111], and Chirp Z-Transform [112]. Normally, Abel inversion is used when the occulting atmosphere is assumed to be spherically symmetric. This method is based on the principle that the integral of a function over a line can be used to reconstruct the function itself [98]. In the context of atmospheric science, this integral equation relates the measured quantity (such as refractivity or density) along a line of sight to the desired vertical profile. The Abel inversion formula mathematically relates the measured integral of the function f(r) along the line of sight to the desired function f(z) as follows [98]:
f ( z ) = 1 π z f ( r ) r 2 z 2 d r
whereby f(z) is the desired vertical profile, f(r) is the measured quantity along the line of sight at radial distance r, and z is the altitude or height at which the vertical profile is being retrieved [98]. Meanwhile, the ray tracing approach is an integration of the equations describing the optical rays across a layered barotropic atmosphere [109]. It provides a detailed simulation of the paths of rays, considering interactions such as reflection, refraction, and scattering. In atmospheric science, it involves simulating the propagation of radio waves emitted by GNSS satellites as they pass through the Earth’s atmosphere [109]. Ray tracing models simulate the bending of these radio waves as they pass through different atmospheric layers, and then calculate the bending angles of radio waves at various altitudes in the atmosphere [109]. Although ray tracing was reported to be easier to execute, it is also computationally intensive and time-consuming [109]. Figure 5 illustrates the common RO temperature retrieval techniques used in the literature analyzed in this review from 2000 to 2023. The results show that Abel transform (44.17%) has been the most widely used retrieval algorithm (e.g., [36,108]) despite the need for a priori information. This is because of its efficiency, stability, physical interpretability, and extensive validation in the RO community [98]. Furthermore, it proved to be a robust and trusted method for RO data analysis in meteorological research, climate studies, and operational weather forecasting [113]. Meanwhile, Chirp Z-Transform and Monte Carlo simulations were the least used retrieval algorithms. For instance, Chirp Z-Transform was used by [112] to estimate Mars’ atmospheric and ionospheric profiles from Tianwen-1 radio occultation, and as a result, its applications on Earth’s atmosphere are not yet well understood. Finally, this diverse array of techniques and instruments provides essential data for understanding atmospheric dynamics and improving weather prediction models. Therefore, more studies are needed to further understand their potential and challenges in different scenarios.
Table 2. Summary of studies on remote sensing applications for upper air temperature observations.
PlatformInstrument TypeArea of InterestVariablesAccuracyReference
Space-borneFY-3E—Microwave Temperature Sounder (MWTS-III)ChinaTemperature The bias between the observed and simulated temperature (O–B) was less than 2.0 K in the study. [114]
Space-borneNOAA-Microwave Sounding Unit (MSU) and the Advanced Microwave Sounding Unit (AMSU)Global and tropical regionsTemperatureThe uncertainty for all MSU/AMSU tropospheric channels (e.g., TLT (temperature lower troposphere), TMT (temperature middle troposphere), TTS (temperature troposphere stratosphere), and TLS (temperature lower stratosphere)) ranged from 0.044 to 0.012 K/decade for both global and tropical regions. [115]
Space-borne and ground-based FengYun-4 (FY-4)-Geostationary Interferometric Infrared Sounder (GIIRS), AERI and Ground-Based—NCAR DIALPerdigão, BrazilTemperature and water vaporTemperature biases for all tested instruments ranged from 0.1 to 1.6 °C at different altitudes.[116]
Space-borne and airborneCOSMIC GPS radio occultation and radiosondes South Asia, Asian summer monsoon regionTemperatureAn intercomparison of the COSMIC-2 and radiosonde measured temperature yielded an absolute mean difference and standard deviation of less than 0.5 K and 2.5 K, respectively.[117]
Space-borneSuomi National Polar-orbiting Partnership (S-NPP), NOAA-20 satellites and Cross-track Infrared Sounder observationsNorth AmericaTemperatureNOAA-20 and S-NPP VIIRS temperature observations correlated with collocated Cross-track Infrared Sounder observations, with daily averaged biases within 0.1 K at the nadir.[118]
Ground-basedHyperspectral Infrared Atmospheric SounderSouth Great Plain (SGP) siteTemperature and relative humidityIn comparison with radiosonde data, the Hyperspectral Infrared Atmospheric Sounder demonstrated good retrieval ability with a root mean square error (RMSE) of 0.87 K for temperature and 1.06 g/kg for the water vapor mixing ratio. [119]

3.4. Challenges of Using Remote Sensing Sensors in Upper Air Temperature Observations

When comparing operational satellite retrievals for temperature with other ground-based and RS instruments, satellite observations boost with global coverage [115]. However, due to their large field of view (FOV), satellite observations suffer from poor vertical resolution and high levels of errors and inconsistencies over larger geographic regions that can cause problems in numerical weather forecasting [56]. In addition, since most satellite-borne multispectral infrared radiometers use radiance for atmospheric moisture and temperature profiles, cloud contamination complicates the retrieval of sounding profiles from radiance. Clouds normally absorb infrared radiation introducing biases or errors to atmospheric temperature measurements from space-based instruments rendering them useless, since most operational numerical weather prediction centers only assimilate cloud-free data [33].
Early satellite instruments of poor vertical resolution have also been associated with low spectral resolution [56]. For instance, the high-resolution infrared radiation sounder and vertical temperature profile radiometer onboard the NOAA satellites had limited channels and provided a coarse vertical resolution and lower accuracy [104]. The vertical smearing of the atmospheric structure caused by low spectral resolution in satellites amplifies errors and uncertainties in the datasets [56]. However, with current technological advancements, high spectral resolution space-based instruments such as the Cross-track Infrared Sounder (CrIS) onboard the S-NPP satellite, China’s Hyperspectral Infrared Atmospheric Sounder (HIRAS) onboard the FengYun (FY)-3D satellite, and the Atmospheric Infrared Sounder (AIRS) onboard NASA’s EOS Aqua satellite are now used for atmospheric temperature observations, thus improving accuracy [104].
Similar to the RS, inhomogeneities associated with a specific sensor on a single satellite and with the combining of data from other satellite platforms taint satellite temperature records [44]. Biases can have a variety of sources, such as instrument faults that can include orbital bias or scan bias. For instance, biases in temperature data derived from satellite observation can be introduced by the radiative transfer model. A review by [33] explains in detail how the radiative transfer model introduces biases. Lastly, another potential cause of biases is radiance, which may occasionally resolve a dynamical scale that the radiative transfer and numerical model are unable to solve [120].
The calibration and validation of satellite sensors remain a core activity to ensure they provide a clear picture of the state of the atmosphere. For instance, to effectively assimilate satellite data such as RO into a weather prediction model, one needs to correctly process them and properly account for the measurement characteristics and measurement errors. RO suffers from negative refractivity biases, especially in the planetary boundary layer [28]. Studies by [39,121] have also indicated that negative “N” biases occur due to a none-unique inversion problem in the traditional Abel inversion that is utilized to extract the RO refractivity from the bending angle (BA).
Intercomparisons of satellite data against laboratory-based data and high-quality RS data are important for the calibration and validation of space-based instruments (see more studies in Table 2). These intercomparisons help to minimize the impact of systematic biases on long-term observations and are important for establishing reference quality measurement time series. For instance, ref. [122] compared the estimates made from the Microwave Sounding Unit channel 2 and the Advanced Microwave Sounding Unit channel 5 to evaluate the agreement made by the two co-orbiting satellites. Meanwhile, in another study, ref. [4]’s collocated global atmospheric temperature profiles were compared with RS data to quantify error characteristics of the RS and determine the effects of the imperfect temporal and spatial collocation of the two observations. In conclusion, ongoing efforts in validating and improving the quality of satellite observations, alongside continued intercomparisons with ground-based RS data, are essential steps towards enhancing the accuracy and reliability of global temperature monitoring. These endeavors will further complement in situ observations and contribute to a clearer understanding of the Earth’s atmospheric dynamics.

3.5. Upper Air Observations in Weather Forecasting, Atmospheric Boundary Layer, and Climate Change Studies

3.5.1. Weather Forecasting

There have been substantial advances in weather forecasting over the past few decades mainly due to the improvements in instruments used for upper air observations, computer technology, and data assimilation techniques [123]. Weather forecasting is conducted using mathematical representations of the atmosphere and oceans in NWP. NWP helps in anticipating extreme weather events such as floods, tropical cyclones, heatwaves, and strong winds which are becoming more prevalent due to climate change. In situ and upper air satellite data have steadily taken the lead as the main sources of information ingested into NWP models through data assimilation techniques [123]. Data assimilation involves the process of combining a variety of measurements that are unevenly distributed in time and space, with prior knowledge of the state provided by an NWP model, to create the grid data as the best estimate of the true initial state of a considered system [124].
A review by [33] highlighted different types of data assimilation techniques such as objective analysis, successive correction methods, optimum interpolation, variational methods, etc. However, it is not the scope of this review to discuss them in greater detail. Good data assimilation provides the initial point for weather/climate predictions and can also be used as a foundation for subsequent research into the mechanisms underlying weather/climate evolution [125]. To ensure proper data assimilation into NWP, most upper air observation data must be corrected for systematic biases by employing variational bias corrections (i.e., 1D, 2D, 3D, and 4DVAR) (see [33]). However, adequate anchor measurements are necessary to perform variational bias correction in a forecasting model [120]. RS and satellite data serve as anchors in NWP, and they ensure the stability of the assimilation system. Therefore, these two observation categories must be consistent with one another. For example, the estimated temperature fields may have spurious characteristics because of biases between various RS instrument types [126]; this is normally correct using various approaches including data homogenization [127]. Subsequently, the forecast skill of NWPs can be enhanced by homogenizing satellite and RS measurements before being assimilated into the models. However, there are a few exceptions such as RO estimates which can be assimilated into the NWP model as raw as they are without bias corrections, hence they act as anchors to models to “keep the models from drifting toward their climates” [19]. Despite recent developments (see [33,123]) in the use of upper air observations in numerical weather prediction modeling, it is important to note that the models are not perfect, since they are dissipative discretized and suffer from dispersion errors and the exclusion of subgrid processes [128]. Consequently, further studies are still required to correct RS and satellite observations to ensure data homogenization before being assimilated into NWP to enhance weather forecasting.

3.5.2. Atmospheric Boundary Layer

Upper air observations made using RS and satellite sensors have been instrumental in the understanding of the atmospheric boundary layer (ABL) processes. The atmospheric boundary layer or planetary boundary layer (PBL) is the lowest portion of the troposphere that interacts directly with the Earth’s surface [129]. The ABL responds to some forcings such as frictional drag, solar heating, and evapotranspiration with a timescale of an hour or less [130]. Therefore, spatiotemporal information on ABL height is important for numerical weather forecasting, air quality forecasting, and greenhouse gas concentration budgets. In addition, the ABL has diurnal variations and can be classified into four categories such as the convective boundary layer (CBL) in the daytime, the more stable nocturnal boundary layer (NBL) at night, the early morning transition (EMT) period, and the early evening transition (EET) period. The top height of the ABL can be determined from vertical profiles of temperature, humidity, wind, and pollutants such as aerosol papers [130]. For instance, ref. [131] used RS, space-borne lidar and European Centre for Medium-Range Weather Forecasts (ECMWF) model data to determine the ABL’s top height in South Africa. Meanwhile, ref. [58] studied the relationship between the temperature inversion layer and the ABL and their aerosol capture capabilities with the aid of RS and micropulse lidar data in the United States of America.
Despite the greater significance of ABL height information in operational forecasting, there is still no single, reliable, and widely accepted approach for retrieving mixing [9]. In addition, it is still challenging to acquire accurate ABL information over complex terrain [9] and cloud-topped ABL predominantly in sea regions. The latter is mainly due to sparse observations and technical difficulties in measuring turbulent fluctuations of wind velocity, temperature, or humidity with acceptable spatial and temporal resolution [9]. Measuring fluctuations in the atmospheric boundary layer presents several challenges due to the dynamic and complex nature of this region of the atmosphere [100]. The ABL is characterized by turbulent air motions caused by irregularities in the Earth’s surface, such as buildings, trees, and terrain. These turbulent motions lead to rapid and unpredictable fluctuations in temperature, humidity, wind speed, and direction [100]. Understanding these fluctuations is crucial for various applications, ranging from weather forecasting to air quality monitoring and climate research.
Furthermore, studies by [132,133] have demonstrated that there is still a knowledge gap among scientists concerning the strongly nonhomogeneous and nonstationary ABL. The latter motivates further studies on the use of in situ and satellite observations for tackling the ABL’s grand challenges, in order to improve weather forecasting, air quality, and/or numerical modeling.

3.5.3. Climate Change

Climate change is one of the biggest challenges ever faced by the current political, social, economic, and environmental sectors of society. Climate change can be described as a significant long-term alteration to the expected patterns of the planet’s typical weather over an extended period [134,135]. Owing to the latter, weather patterns are shifting due to warming temperatures, which is also upsetting the natural order. This puts both humanity and all other kinds of life on Earth in grave danger [134]. Therefore, it is crucial to understand where, how quickly, and how much the climate is changing to mitigate and adapt to climate change impacts. Over the past few decades, upper air observations have contributed immensely to understanding climate change processes. For example, vertical profiles of essential climate variables such as temperature, humidity, and pressure derived from RS and satellite observations have been used to study atmospheric stability, lapse rates, and other climate-related parameters [20]. However, strict criteria must be met by observing systems to accurately monitor climate change, particularly regarding measurement accuracy and long-term stability [136]. Unfortunately, most upper air observations have historically been made for short-term numerical weather forecasting, and these data frequently have limited value for climate research [13]. This is reported to have been caused by several factors such as undocumented changes in instrumentation, the lack of instrument calibration, and lower requirements for long-term stability and traceability [29]. In addition, despite great advances in upper air observations in the last few decades, it is still difficult to link the RS errors of the new systems with the old systems, due to the complexity of the errors in the older systems [136]. This drawback is caused by spurious discontinuities (i.e., changes in the mean and variance) of the RS emanating from changes in observational practices, instruments, and manufacturer processing methods [21].
Several attempts have been made to ensure the homogenization of upper air records of the RS to be able to accurately characterize temperature changes which are associated with climate change. Homogenization in climate data refers to the process of removing artificial biases or inconsistencies introduced into the data due to changes in observation practices, instruments, or station locations over time. It aims to create a more consistent and reliable dataset by adjusting for these non-climatic influences. For example, ref. [21] used an automatic homogenization approach to quantify uncertainties in historical tropical tropospheric temperature records from the RS ranging from 1979 to 2003. The automatic homogenization approach yielded conflicting results whereby the models performed better for earlier periods but were uncertain in recent periods. This study highlighted the general difficulties in simulating long-term global warming problems using RS data which include data quality issues, spatial coverage, vertical resolution, and homogenization. Addressing these difficulties is crucial for producing reliable climate projections, improving climate models, informing policy decisions, understanding climate feedback, validating satellite data, and enhancing climate resilience. More recently, ref. [16] developed a novel approach to homogenize discontinuities in both the mean and variance of global RS networks. The method showed great potential in improving homogeneities in global RS records by clearly portraying a warming maximum of around 300 hPa which the [21] approach failed to achieve. In other attempts to ensure long-term reference quality datasets of essential climate variables (e.g., including temperature) suitable for detecting climate changes, the GCOS (Global Climate Observing System) Reference Upper-Air Network (GRUAN) was established [30]. The GRUAN is a global network of high-quality reference stations for upper air measurements that aims to provide long-term, consistent, and high-quality observations of essential climate variables in the atmosphere [30]. The GRUAN focuses on the vertical profile of temperature, humidity, and atmospheric pressure from the surface to the stratosphere. All known biases are accounted for in GRUAN data products [30]. The ability to reprocess is made possible by the GRUAN’s long-term storing of raw measurements together with a variety of metadata, which is crucial given the evolving understanding of measurement and bias. Although the GRUAN has been operational for more than a decade, there are still a few upper launching stations certified by this organization, more specifically in the southern hemisphere. These impede efforts for ensuring good quality RS data to meet the needs of earth system scientists for accurately predicting climate change in developing countries.
Furthermore, global positioning systems’ RO estimates offer immense potential in providing climate records that are unrestricted by the limitations imposed by other in situ and satellite instruments. RO boasts with characteristics such as long-term stability and self-calibration and has a very good height resolution and can be assimilated into NPW without bias corrections [137] when compared to other in situ and satellite instruments. Several studies have been conducted to explore the applications of RO technology in climate change studies. For instance, ref. [138] has studied temperature uncertainties from GNSS-RO using a novel rOPS L1a excess phase processing retrieval approach. The rOPS L1a processing approach offers the potential to produce reliable long-term data records, with uncertainty estimations, and this can benefit climate change applications [138]. On the other hand, ref. [139] developed a novel approach to observe rapid stratospheric warming (SSW) under climate change using ECMWF Reanalysis 5 and RO data in the polar regions. Meanwhile, ref. [137] used RO and fingerprinting methods to detect atmospheric climate change. All the latter studies agreed that observed RO trends were able to detect global warming, in particular, the widespread cooling of the lower stratosphere and the warming of the troposphere. However, spatial and temporal coverage are still limitations of this technique. In addition, the quality of GNSS-RO estimates is still poor in the lower troposphere, especially in the subtropics, and this limits their usefulness in climate change studies. Subsequently, more studies are required to solve the issues such as the need for a priori information, bending angle errors, and ionospheric effects-induced errors.

4. Discussion

This study provided a comprehensive review of the advancements in utilizing both in situ and satellite estimates for monitoring upper air temperature profiles. Additionally, it explored challenges and potential future directions for the monitoring of upper air temperature profiles through in situ and satellite observations. The findings based on the search keywords indicate that the use of RS and satellite observations has advanced significantly over the past 23 years. For instance, RS and satellite observations have undergone significant advancements ranging from sensor [140,141] and algorithm development [140,142] to calibration and validation improvements [61,142,143] to application changes [61,144]. These findings are further discussed in Section 4.1 and Section 4.2.

4.1. Challenges of Using In Situ Radiosondes and Satellites for Upper Air Temperature Observations

The results of this review in Section 3.1 and Section 3.2 highlighted that RS temperature data quality remains an important topic of interest in atmospheric sciences. The quality of atmospheric temperature data is foundational for a wide range of applications in atmospheric sciences, climate research, weather forecasting, ecosystem management, human health, and policy development [145]. It underpins our understanding of climate change, weather patterns, and atmospheric processes, ultimately contributing to informed decisions and actions for a sustainable future [146]. Many studies illustrated that despite RS data quality being of paramount importance, there have been growing challenges such as data discrepancies [147], the lack of homogeneity (in time and space) [148], biases [149], and discontinuities [15] associated with current and historical climate data records obtained using these technologies. It is anticipated that these challenges will continue in the future due to factors such as inadequate documentation on instrumentation changes [150], calibration drifts [151], measurement errors [152], biases in correction methods [153], and variations in data processing techniques [154], among others.
In attempts to address the latter challenges, many studies (e.g., [155,156,157]) have performed intercomparison studies to compare RS observations and data from other different instruments, platforms, or measurement techniques. This was conducted to assist in accurately identifying inconsistencies, biases, or systematic errors between datasets. By quantifying the differences and understanding their sources, scientists can improve the reliability and consistency of the data [155]. Other studies use various techniques such as machine learning [158,159], statistical (e.g., temperature profile mean differences approach [88]), data assimilation [160], and data homogenization [161] to calculate biases or systematic errors between datasets. Despite rigorous attempts to calculate and correct RS temperature biases, errors still range between 0.2 and 7 K, as illustrated in Table 1 in Section 3.2. Some of the latter studies in Table 1 showed promising results and managed to achieve bias values ranging from 0.2 to 2 k which are widely accepted biases in kelvins for RS temperature observations [162,163]. It is also important to note that the variations in temperature biases (K) depend on the instrument type, calibration procedures, and specific atmospheric conditions [150]. This highlights the need for further studies to estimate and correct both RS biases and systematic errors between datasets.
Furthermore, this review has highlighted the issue of the scarcity of RS launching stations, particularly in developing countries (i.e., Africa), over oceans, and polar regions compared to other parts of the globe [56]. Sparse RS launching leads to a lack of data points across different regions and altitudes in the atmosphere [79]. This data sparsity hampers the ability to create a comprehensive and detailed picture of atmospheric conditions for NWP model initialization and the validation of space-based observations [159]. These issues might also worsen due to the decrease in the number of global RS sites because of budget constraints [77]. Therefore, enhancing the quality of the few available RS launching sites is imperative to safeguard the future of numerical weather forecasting and climate change studies by developing longer independent temperature measurement series to monitor temperature evolution and better evaluate temperature biases.
In addition, the findings of this review showed that the reliance on satellite technology for meteorological operations especially in areas with few or no RS launches has increased over the years (see Figure 4, theme evolution) but has been limited by a myriad of challenges such as orbit changes [164], sensor evolutions [165], and resolutions (e.g., vertical resolution) [143] that make it difficult for their harmonization into a single time series, thus making them insufficient to study climate change. RSs are commonly utilized for calibrating satellite observations and vice versa. However, the vertical resolution of the in situ measurements should ideally match that of the satellite retrieval, achieved through the suitable application of averaging kernels [145]. The retrieval process relies on a series of assumptions and prior data, leading to potential impacts on the comparison. In addition, it is more challenging to characterize error in a priori information and retrieval techniques than in RS observations [166]. For instance, to reduce the need for prior information as input in radio occultation extraction and to lessen the reliance of retrieved products on a priori knowledge, a new tangent linear retrieval algorithm was developed [36]. However, more studies are needed to test the efficacy and repeatability of this new approach under different atmospheric conditions, since instrument biases at one location may not be the same for another different location due to variations in atmospheric conditions.
Furthermore, other challenges that emanate when comparing satellite observations and RSs include spatial variability and collocation [156,167]. For example, the horizontal drift of RS, which can vary significantly with the season, needs to be taken into account by small footprint nadir-looking satellite equipment when comparing the two datasets. Compared to polar-orbiting satellites, geostationary satellites offer more temporally resolved observations but lower horizontal resolution. To build a complete RS profile, they might have to take into account the comparatively slow balloon rise [145]. Moreover, to overcome RS data sparsity, more studies are now exploring the use of ERA5 data acquired from global analysis systems such as that at the European Center for Medium-Range Weather Forecasting (ECMWF) to calculate and reduce some collocation errors by explicitly considering the dynamics of the atmosphere [168,169].
This review has also demonstrated that radiation errors amongst multispectral infrared radiometers are still a problem that limits the accurate retrieval of upper air temperature data from satellite sensors [145,170]. Furthermore, cloud contamination, instrument faults, orbital or scan biases, and radiative transfer models can complicate the retrieval of sounding profiles from satellite radiance data, introducing biases or errors in atmospheric temperature estimates [33]. The results depicted in Table 2 (see Section 3.3) underscore the impact of these challenges on the biases and errors observed in satellite temperature estimates, which ranged from 0.1 to 2.0 K [114]. Therefore, more studies are needed to explore different approaches to accurately estimate and correct these biases using advanced machine learning algorithms, such as neural networks or random forests, which are increasingly used to correct, interpolate, or assimilate atmospheric data. Finally, improving the homogeneity, temporal resolution, and accuracy of the upper air temperature records is imperative to make them appropriate for weather forecasting, atmospheric boundary layer, and climate change studies.

4.2. Progress and Future Directions in the Use of Radiosondes and Satellites for Upper Air Temperature Observations

Significant progress has been made to enhance upper air temperature records acquired utilizing in situ and satellite-based instruments to improve weather forecasting [171], the understanding of atmospheric boundary layer processes [172], and climate change studies [140]. Studies have demonstrated that RSs are still by far the most effective tools for in situ atmospheric temperature observations, but operational meteorological satellites are gradually closing the gap despite their reliance on in situ data for their calibration and validation [77,146,151]. For instance, there have been great advances in RS [141,173] and satellite technology [174]. Manufacturers have been at the forefront of these developments, and they incorporate new models into the market as soon as they become available. For instance, ref. [141] developed a new microbead thermistor, encapsulated with an insulation layer and reflective layer to enhance the response speed of the temperature sensors in the RS.
These advances have been shown to improve the inherent biases and uncertainties that come with instrumentation. In addition, studies have demonstrated that Vaisala Radiosonde RS41 introduces improvements to data accuracy and consistency since more stations are transitioning from Vaisala Radiosonde RS92 [24,150]. Intercomparisons of RS datasets of old and new models are critical for long-term high-quality reference observations of upper air essential climate variables (ECVs) such as temperature and water vapor [150]. This is important to ensure that the change of measurement instruments does not introduce inhomogeneities to the data record [150]. Unfortunately, this practice is not universally adopted, particularly in developing countries where conducting dual measurements of upper air climate variables can be cost-prohibitive. Resultantly, this leads to a lack of documentation of instrument changes. Therefore, more studies need to be conducted to compare different radiosonde instruments (models) for monitoring upper air temperature in developing countries to ensure long-term continuity and homogeneity and to aid in climate change studies. In addition, to maintain a reference-quality record of upper air essential climate variables such as temperature, international initiatives such as GRUAN [10] should be supported, and GRUAN-certified sites should be expanded in the Southern Hemisphere. For instance, currently, there is no GRUAN-certified site in the African continent (mainland), and this is a setback for climate change studies.
Many new concepts and methods have been proposed in recent years to improve upper air temperature quality, but the methods are not yet mature and are usually not generalized, so they may only be valid for limited scenarios. For example, many novel techniques (e.g., the tangent retrieval algorithm developed by [36] or rOPS L1a processing approach developed by [138]) still need to be tested in different environmental conditions to enhance upper air observations. Moreover, a variety of satellite-based atmospheric temperature retrieval algorithms including statistical, neural network [175], machine learning [175], and physical-based methods [100] have been developed to date and have improved accuracy. One example includes NOAA’s unique combined atmospheric processing system (NUCAPS) which was developed to retrieve environmental data records such as temperature, greenhouse gases, and relative humidity from hyperspectral infrared sounders (e.g., Cross-track Infrared Sounder) [176]. The potential of the data assimilation of NOOA-20 and SOUMI NPP VIIRS clear sky surface temperatures [118] into numerical weather forecasting has been demonstrated; although this is still in the experimental phase, it seems promising. With the recent launch of GPS reflectometry and refractometry missions, such as the FORMOSAT-7/COSMIC-2 mission, CICERO, and TechDemoSat-1, the potential of RO estimates for providing temperature records for numerical weather prediction, atmospheric boundary layer studies, and climate change studies will be realized. RO presents more prospects than other upper air temperature instruments because it can be assimilated into numerical weather prediction without bias corrections [166]. However, serious processing is required before data assimilation because it also suffers from negative refractivity biases, especially in the planetary boundary layer [177]. Thus, this therefore warrants more studies on the correction of negative refractivity biases. Several atmospheric retrieval algorithms were reviewed in this study such as Abel inversion [36], ray tracing [108], Monte Carlo simulations [109], optimal estimation [110], Fourier Transform [111], and Chirp Z-Transform [112]. This study has demonstrated that Abel transform is widely preferred despite the need for prior information due to several key advantages such as physical interpretability, and it allows for the retrieval of multiple atmospheric profiles simultaneously. It provides a well-defined mathematical framework for inversion, leading to reliable and consistent results for radio occultation studies.
The future applications of radio occultation (RO) for upper air temperature observations appear promising with the development of new inversion models, such as the tangent linear retrieval method [36]. This innovative algorithm aims to reduce the requirement for extensive prior knowledge, such as scale heights, in RO data extraction. It seeks to minimize the dependence of retrieved products on a priori information. However, further studies are warranted to assess the retrieval performance under varied scenarios. Additionally, comparisons between new and traditional methods like tangent linear retrieval, Gauss–Newton Optimization, and neural network approaches are necessary to determine the optimal approach.
The utilization of Artificial Intelligence (AI) [178] and drones [179] in upper air observations and quality improvement has been really limited. For instance, AI methods will allow us to capture the intricate nonlinear relationships between essential climate variables and different instrumentation types and environmental conditions, for meaningful comparison and better interpretation [180]. AI has demonstrated considerable potential in addressing a variety of statical and environmental challenges, ranging from weather forecasting [181] and pinpointing critical scenarios to assisting human interpretation and uncovering novel relationships within extensive datasets [49]. This presents fresh possibilities for accelerating the analysis of vast datasets, enhancing models, and effectively revolutionizing the utilization of upper air climate data in the coming years. Meanwhile, drone applications in upper air temperature observations can be more cost-effective for localized or short-duration observations when compared to manned aircraft or satellite missions and can be reused; when compared to RSs, their potential has not been realized yet. With technological advancements, drones are most likely to reach a greater altitude in the atmosphere, and this will enhance their usefulness in the future for atmospheric studies. These advances are critical to improve data quality standards (SI), thus improving weather forecasting, atmospheric boundary layer, and climate change studies.

5. Conclusions

This current study conducted a systematic review to examine and assess the global scientific production on the progress and developments of RS and space-based instruments for monitoring upper air temperature profiles, as well as highlight the limitations and successes associated with these instruments. The literature has indicated that although much progress has been made to improve upper air temperature observations from RS and space-based instruments, there has been a steady decline in the number of publications using RSs for upper air temperatures in the past four years (2019–2023), and the results show that more focus has shifted towards the use of space-based instruments based on the scientific production rate. Despite space-based instruments closing the gap, RSs remain crucial for in situ temperature observations used for weather forecasting, boundary layer studies, climate research, and satellite data validation.
For instance, recent advances in radiosonde technology include radiosondes that are equipped with miniaturized temperature sensors that boast remarkable improvements in response times and accuracy. These sensors often use advanced thermistor or platinum resistance thermometer technologies, and they can achieve resolutions as fine as 0.1 °C. Their reduced size and improved calibration methods ensure precise temperature measurements throughout the radiosonde’s ascent through the atmosphere. These improvements show promising prospects, although radiosonde data quality improvements require a multifaceted approach due to the various sources of errors and biases that can be introduced during the measurement process, as discussed in Section 4.1. The pressing need for multifaceted approaches anchored in research and innovation to enhance the quality of radiosonde (RS) data cannot be overstated, given its pivotal role in weather forecasting, climate change research, and the validation of spaceborne instruments.
The findings of this review also revealed a vast number of emerging methods designed to enhance RS temperature data quality. These methods include RS data intercomparisons, homogenization techniques, temperature bias corrections, empirical adjustments, the utilization of reference data and metadata, as well as statistical and machine learning approaches. However, most of these emerging techniques (e.g., SASBE) are still in the preliminary stages of development and are often tailored to specific conditions and scenarios. Hence, further studies are warranted to assess the repeatability and accuracy of these proposed methods across varied atmospheric conditions and sensor platforms. In addition, machine learning approaches are increasingly employed in weather forecasting and surface temperature retrievals. However, there remains a paucity of research on their application for in situ and space-based atmospheric temperature retrievals and quality improvement. The adoption of machine learning and AI presents a wide range of opportunities such as assisting in improving data quality (i.e., cleaning up noisy data from radiosondes by identifying and filtering out erroneous readings caused by instrument error or interference), optimizing calibration, and promoting data fusion and integration.
Initiatives like the GCOS Reference Upper-Air Network (GRUAN) are vital for maintaining quality upper air climate data; however, there is a need for expansion, particularly in developing countries like many in Africa. The absence of any GRUAN-accredited stations on the African mainland poses a significant challenge for the continent’s atmospheric science community and research. The potential expansion of the GRUAN to areas that are currently not available presents new prospects for the future of climate change studies and numerical weather forecasting. Furthermore, the expansion of the GRUAN will foster international collaboration among meteorological agencies and research institutions to share data and best practices and standardize measurement techniques.
Moreover, with the growing reliance on space-based instruments for upper air temperature observations, challenges such as orbit fluctuations and sensor resolutions impede data harmonization. This underscores the need for further investigation, particularly in regions with sparse RS coverage, to augment the existing data and address the issue of data scarcity. Furthermore, satellite inter-calibration systems such as NOAA’s NU-CAPS, Constellation Observing System for Meteorology, Ionosphere, and Climate (COSMIC), A-train (including Aqua, CloudSat, CALIPSO), Infrared Atmospheric Sounding Interferometer (IASI), Advanced Technology Microwave Sounder (ATMS), and the next-generation Infrared Atmospheric Sounding Interferometer (IASI-NG) offer an opportunity to improve the accuracy of satellite temperature retrievals in the absence of in situ data. Intercomparisons between satellite and in situ data, when collocated in space and time, offer novel opportunities for a more comprehensive understanding of upper air temperature dynamics. GPS RO missions and advances in temperature retrieval algorithms (e.g., tangent linear retrieval, Gauss–Newton Optimization, and neural network approaches) present positive prospects for weather prediction and climate studies, despite needing careful calibration and validation for accurate data assimilation. Radio occultation offers advantages such as global coverage, high vertical resolution, accuracy, consistency, all-weather capability, operational efficiency, and cost-effectiveness compared to radiosondes. Multiple RO satellites can be used to cross-validate measurements, ensuring data consistency and reducing uncertainties. Therefore, research and development in RO retrieval algorithms, instrument technology, data processing techniques, and validation methodologies is critical to realize the true potential of these instruments for upper air temperature observations.
In conclusion, this study further highlighted the importance of developing a comprehensive strategy to improve the quality and continuity of upper air temperature observations which encompass rigorous instrument calibration, robust quality control procedures, technological advancements in radiosonde design, integration with remote sensing technologies, and international collaboration among meteorological agencies and research institutions. The advancements in upper air temperature observations are pivotal for NWP modeling, greatly boosting operational forecasting capacities. This is especially becoming more critical due to the growing threats posed by severe weather events, which have intensified and become more frequent in recent years. The recent developments in RS and space-borne observations are instrumental in deepening our comprehension of the intricate interplay between upper air temperature dynamics, atmospheric boundary layer processes, and human-induced activities. Consequently, these advancements aid in the formulation of policies, drive global climate change mitigation initiatives, and support adaptation efforts worldwide.

Author Contributions

Conceptualization, F.M.M. and B.D.; methodology, F.M.M. and H.C.; software, F.M.M.; formal analysis, F.M.M.; data curation, F.M.M.; writing—original draft preparation, F.M.M., H.C., B.D. and R.K.S.; writing—review and editing, K.K.A., Y.K. and D.K.; supervision, B.D., Y.K., H.C. and D.K.; funding acquisition, F.M.M. and K.K.A. All authors have read and agreed to the published version of the manuscript.

Funding

This research was funded by South Africa’s Department of Higher Education and Training (DHET), University Staff Doctoral Program (USDP), and National Research Foundation (NRF), Thuthuka PHD track, grant number TTK23042597037.

Institutional Review Board Statement

Not applicable.

Informed Consent Statement

Not applicable.

Data Availability Statement

Data sharing is not applicable as new data were not analyzed.

Acknowledgments

The authors would like to sincerely acknowledge the University of Limpopo, University of Maryland Baltimore County, and Howard University for supporting this research as part of the University Staff Doctoral Program (USDP), sponsored by South Africa’s Department of Higher Education and Training (DHET) and Thutuka NRF PHD Track.

Conflicts of Interest

The authors declare no conflicts of interest.

References

  1. Grotjahn, R.; Black, R.; Leung, R.; Wehner, M.F.; Barlow, M.; Bosilovich, M.; Gershunov, A.; Gutowski, W.J.; Gyakum, J.R.; Katz, R.W. North American extreme temperature events and related large scale meteorological patterns: A review of statistical methods, dynamics, modeling, and trends. Clim. Dyn. 2016, 46, 1151–1184. [Google Scholar] [CrossRef]
  2. Essa, Y.H.; Cagnazzo, C.; Madonna, F.; Cristofanelli, P.; Yang, C.; Serva, F.; Caporaso, L.; Santoleri, R. Intercomparison of Atmospheric Upper-Air Temperature from Recent Global Reanalysis Datasets. Front. Earth Sci. 2022, 10, 935139. [Google Scholar] [CrossRef]
  3. Lee, H.; Calvin, K.; Dasgupta, D.; Krinner, G.; Mukherji, A.; Thorne, P.; Trisos, C.; Romero, J.; Aldunce, P.; Barret, K. IPCC, 2023: Climate Change 2023: Synthesis Report, Summary for Policymakers. Contribution of Working Groups I, II and III to the Sixth Assessment Report of the Intergovernmental Panel on Climate Change; Core Writing Team, Lee, H., Romero, J., Eds.; IPCC: Geneva, Switzerland, 2023. [Google Scholar]
  4. Sun, B.; Reale, A.; Seidel, D.J.; Hunt, D.C. Comparing radiosonde and COSMIC atmospheric profile data to quantify differences among radiosonde types and the effects of imperfect collocation on comparison statistics. J. Geophys. Res. Atmos. 2010, 115. [Google Scholar] [CrossRef]
  5. Hunziker, S.; Gubler, S.; Calle, J.; Moreno, I.; Andrade, M.; Velarde, F.; Ticona, L.; Carrasco, G.; Castellón, Y.; Oria, C. Identifying, attributing, and overcoming common data quality issues of manned station observations. Int. J. Climatol. 2017, 37, 4131–4145. [Google Scholar] [CrossRef]
  6. Zhou, Q.; Zhang, Y.; Jia, S.; Jin, J.; Lv, S.; Li, Y. Climatology of cloud vertical structures from long-term high-resolution radiosonde measurements in Beijing. Atmosphere 2020, 11, 401. [Google Scholar] [CrossRef]
  7. Chen, X.; Yang, T.; Wang, Z.; Wang, F.; Wang, H. An ensemble method for improving the estimation of planetary boundary layer height from radiosonde data. Atmos. Meas. Tech. Discuss. 2023, 16, 4289–4302. [Google Scholar] [CrossRef]
  8. Lappin, F.M.; Bell, T.M.; Pillar-Little, E.A.; Chilson, P.B. Low-level buoyancy as a tool to understand boundary layer transitions. Atmos. Meas. Tech. Discuss. 2022, 15, 1185–1200. [Google Scholar] [CrossRef]
  9. Herrera-Mejía, L.; Hoyos, C.D. Characterization of the atmospheric boundary layer in a narrow tropical valley using remote-sensing and radiosonde observations and the WRF model: The Aburrá Valley case-study. Q. J. R. Meteorol. Soc. 2019, 145, 2641–2665. [Google Scholar] [CrossRef]
  10. Larosa, S.; Cimini, D.; Gallucci, D.; Nilo, S.T.; Romano, F. PyRTlib: An educational Python-based library for non-scattering atmospheric microwave Radiative Transfer computations. Geosci. Model Dev. Discuss. 2024, 17, 2053–2076. [Google Scholar] [CrossRef]
  11. Piringer, M.; Baumann-Stanzer, K. The Role of Temperature Inversions in Air Pollution Episodes Demonstrated by Examples in the Eastern Alps (Austria). In Oxford Research Encyclopedia of Climate Science; Oxford University Press: Oxford, UK, 2024. [Google Scholar]
  12. Sun, X.; Zhao, T.; Tang, G.; Bai, Y.; Kong, S.; Zhou, Y.; Hu, J.; Tan, C.; Shu, Z.; Xu, J. Vertical changes of PM2.5 driven by meteorology in the atmospheric boundary layer during a heavy air pollution event in central China. Sci. Total Environ. 2023, 858, 159830. [Google Scholar] [CrossRef]
  13. Thorne, P.W.; Parker, D.E.; Tett, S.F.; Jones, P.D.; McCarthy, M.; Coleman, H.; Brohan, P. Revisiting radiosonde upper air temperatures from 1958 to 2002. J. Geophys. Res. Atmos. 2005, 110. [Google Scholar] [CrossRef]
  14. Guo, Y.; Weng, F.; Wang, G.; Xu, W. The long-term trend of upper-air temperature in China derived from microwave sounding data and its comparison with radiosonde observations. J. Clim. 2020, 33, 7875–7895. [Google Scholar] [CrossRef]
  15. Jovanovic, B.; Smalley, R.; Siems, S. A historical monthly upper-air humidity dataset for Australia. J. South. Hemisph. Earth Syst. Sci. 2023, 73, 148–167. [Google Scholar] [CrossRef]
  16. Zhou, C.; Wang, J.; Dai, A.; Thorne, P.W. A new approach to homogenize global subdaily radiosonde temperature data from 1958 to 2018. J. Clim. 2021, 34, 1163–1183. [Google Scholar] [CrossRef]
  17. Doi, A.; Kono, Y.; Kimura, K.; Nakahara, S.; Oyama, T.; Okada, N.; Satou, Y.; Yamashita, K.; Matsumoto, N.; Baba, M. A balloon-borne very long baseline interferometry experiment in the stratosphere: Systems design and developments. Adv. Space Res. 2019, 63, 779–793. [Google Scholar] [CrossRef]
  18. Zhang, J.; Chen, H.; Zhu, Y.; Shi, H.; Zheng, Y.; Xia, X.; Teng, Y.; Wang, F.; Han, X.; Li, J. A novel method for estimating the vertical velocity of air with a descending radiosonde system. Remote Sens. 2019, 11, 1538. [Google Scholar] [CrossRef]
  19. Ho, S.-p.; Peng, L.; Vömel, H. Characterization of the long-term radiosonde temperature biases in the upper troposphere and lower stratosphere using COSMIC and Metop-A/GRAS data from 2006 to 2014. Atmos. Chem. Phys. 2017, 17, 4493–4511. [Google Scholar] [CrossRef]
  20. Seidel, D.J.; Berger, F.H.; Diamond, H.J.; Dykema, J.; Goodrich, D.; Immler, F.; Murray, W.; Peterson, T.; Sisterson, D.; Sommer, M. Reference upper-air observations for climate: Rationale, progress, and plans. Bull. Am. Meteorol. Soc. 2009, 90, 361–369. [Google Scholar] [CrossRef]
  21. Thorne, P.W.; Brohan, P.; Titchner, H.A.; McCarthy, M.P.; Sherwood, S.C.; Peterson, T.C.; Haimberger, L.; Parker, D.E.; Tett, S.F.; Santer, B.D. A quantification of uncertainties in historical tropical tropospheric temperature trends from radiosondes. J. Geophys. Res. Atmos. 2011, 116. [Google Scholar] [CrossRef]
  22. Hoshino, S.; Sugidachi, T.; Shimizu, K.; Kobayashi, E.; Fujiwara, M.; Iwabuchi, M. Comparison of GRUAN data products for Meisei iMS-100 and Vaisala RS92 radiosondes at Tateno, Japan. Atmos. Meas. Tech. 2022, 15, 5917–5948. [Google Scholar] [CrossRef]
  23. Domonkos, P. Time Series Homogenization with ACMANT: Comparative Testing of Two Recent Versions in Large-Size Synthetic Temperature Datasets. Climate 2023, 11, 224. [Google Scholar] [CrossRef]
  24. Sun, B.; Calbet, X.; Reale, A.; Schroeder, S.; Bali, M.; Smith, R.; Pettey, M. Accuracy of Vaisala RS41 and RS92 upper tropospheric humidity compared to satellite hyperspectral infrared measurements. Remote Sens. 2021, 13, 173. [Google Scholar] [CrossRef]
  25. Fassó, A.; Sommer, M.; von Rohden, C. Interpolation uncertainty of atmospheric temperature radiosoundings. Atmos. Meas. Tech. Discuss. 2020, 13, 6445–6458. [Google Scholar] [CrossRef]
  26. Tradowsky, J.S.; Bodeker, G.E.; Querel, R.R.; Builtjes, P.J.; Fischer, J. Combining data from the distributed GRUAN site Lauder–Invercargill, New Zealand, to provide a site atmospheric state best estimate of temperature. Earth Syst. Sci. Data 2018, 10, 2195–2211. [Google Scholar] [CrossRef]
  27. Madonna, F.; Tramutola, E.; SY, S.; Serva, F.; Proto, M.; Rosoldi, M.; Gagliardi, S.; Amato, F.; Marra, F.; Fassò, A. The new Radiosounding HARMonization (RHARM) data set of homogenized radiosounding temperature, humidity, and wind profiles with uncertainties. J. Geophys. Res. Atmos. 2022, 127, e2021JD035220. [Google Scholar] [CrossRef]
  28. Guo, J.; Zhang, J.; Shao, J.; Chen, T.; Bai, K.; Sun, Y.; Li, N.; Wu, J.; Li, R.; Li, J. A merged continental planetary boundary layer height dataset based on high-resolution radiosonde measurements, ERA5 reanalysis, and GLDAS. Earth Syst. Sci. Data 2024, 16, 1–14. [Google Scholar] [CrossRef]
  29. Bodeker, G.; Kremser, S. Techniques for analyses of trends in GRUAN data. Atmos. Meas. Tech. 2015, 8, 1673–1684. [Google Scholar] [CrossRef]
  30. Bodeker, G.; Bojinski, S.; Cimini, D.; Dirksen, R.; Haeffelin, M.; Hannigan, J.; Hurst, D.; Leblanc, T.; Madonna, F.; Maturilli, M. Reference upper-air observations for climate: From concept to reality. Bull. Am. Meteorol. Soc. 2016, 97, 123–135. [Google Scholar] [CrossRef]
  31. Eyre, J.; Bell, W.; Cotton, J.; English, S.; Forsythe, M.; Healy, S.; Pavelin, E. Assimilation of satellite data in numerical weather prediction. Part II: Recent years. Q. J. R. Meteorol. Soc. 2022, 148, 521–556. [Google Scholar] [CrossRef]
  32. Eyre, J.R.; English, S.J.; Forsythe, M. Assimilation of satellite data in numerical weather prediction. Part I: The early years. Q. J. R. Meteorol. Soc. 2020, 146, 49–68. [Google Scholar] [CrossRef]
  33. Fletcher, S.J. Data Assimilation for the Geosciences: From Theory to Application; Elsevier: Amsterdam, The Netherlands, 2022. [Google Scholar]
  34. Han, Y.; Hou, X. Evaluation of the in-orbit performance of the microwave temperature sounder onboard the FY-3D satellite using different radiative transfer models. J. Quant. Spectrosc. Radiat. Transf. 2020, 253, 107041. [Google Scholar] [CrossRef]
  35. Wallace, J.; Kanaroglou, P. The effect of temperature inversions on ground-level nitrogen dioxide (NO2) and fine particulate matter (PM2.5) using temperature profiles from the Atmospheric Infrared Sounder (AIRS). Sci. Total Environ. 2009, 407, 5085–5095. [Google Scholar] [CrossRef]
  36. Tradowsky, J.S.; Burrows, C.P.; Healy, S.B.; Eyre, J.R. A new method to correct radiosonde temperature biases using radio occultation data. J. Appl. Meteorol. Climatol. 2017, 56, 1643–1661. [Google Scholar] [CrossRef]
  37. Lima, L.M.; Paulino, A.R.; de Araujo, L.R.; Maia, F.B.P.; Batista, P.P. Monthly averages of diurnal temperature variation from meteor radar at Cachoeira Paulista (22.7° S, 45° W), Brazil. J. Atmos. Sol.-Terr. Phys. 2021, 221, 105689. [Google Scholar] [CrossRef]
  38. Bonafoni, S.; Biondi, R.; Brenot, H.; Anthes, R. Radio occultation and ground-based GNSS products for observing, understanding and predicting extreme events: A review. Atmos. Res. 2019, 230, 104624. [Google Scholar] [CrossRef]
  39. Wang, K.-N.; Ao, C.O.; Morris, M.G.; Hajj, G.A.; Kurowski, M.J.; Turk, F.J.; Moore, A.W. Joint 1DVar retrievals of tropospheric temperature and water vapor from Global Navigation Satellite System radio occultation (GNSS-RO) and microwave radiometer observations. Atmos. Meas. Tech. 2024, 17, 583–599. [Google Scholar] [CrossRef]
  40. Zhran, M.; Mousa, A.; Alshehri, F.; Jin, S. Evaluation of Tropopause Height from Sentinel-6 GNSS Radio Occultation Using Different Methods. Remote Sens. 2023, 15, 5513. [Google Scholar] [CrossRef]
  41. Inai, Y.; Aoki, S.; Honda, H.; Furutani, H.; Matsumi, Y.; Ouchi, M.; Sugawara, S.; Hasebe, F.; Uematsu, M.; Fujiwara, M. Balloon-borne tropospheric CO2 observations over the equatorial eastern and western Pacific. Atmos. Environ. 2018, 184, 24–36. [Google Scholar] [CrossRef]
  42. Lee, J.M.; Tao, C.; Hannah, W.M.; Xie, S.; Bader, D.C. Assessment of warm and dry bias over ARM SGP site in E3SMv2 and E3SM-MMF. J. Atmos. Sci. 2023, 80, 2545–2556. [Google Scholar] [CrossRef]
  43. Luers, J.K.; Eskridge, R.E. Use of radiosonde temperature data in climate studies. J. Clim. 1998, 11, 1002–1019. [Google Scholar] [CrossRef]
  44. Sterin, A.; Khan, V.; Rubinshtein, K. Upper-air temperature trends: Current problems and some recent results. In Climate Variabilsity and Extremes during the Past 100 Years; Springer: Berlin/Heidelberg, Germany, 2008; pp. 85–101. [Google Scholar]
  45. Hooker, J.; Duveiller, G.; Cescatti, A. A global dataset of air temperature derived from satellite remote sensing and weather stations. Sci. Data 2018, 5, 180246. [Google Scholar] [CrossRef]
  46. Scherllin-Pirscher, B.; Steiner, A.K.; Anthes, R.A.; Alexander, M.J.; Alexander, S.P.; Biondi, R.; Birner, T.; Kim, J.; Randel, W.J.; Son, S.-W. Tropical temperature variability in the UTLS: New insights from GPS radio occultation observations. J. Clim. 2021, 34, 2813–2838. [Google Scholar] [CrossRef]
  47. Wright, R.W.; Brand, R.A.; Dunn, W.; Spindler, K.P. How to write a systematic review. Clin. Orthop. Relat. Res. 2007, 455, 23–29. [Google Scholar] [CrossRef]
  48. de Bruin, M.; McCambridge, J.; Prins, J.M. Reducing the risk of bias in health behaviour change trials: Improving trial design, reporting or bias assessment criteria? A review and case study. Psychol. Health 2015, 30, 8–34. [Google Scholar] [CrossRef]
  49. Derviş, H. Bibliometric analysis using bibliometrix an R package. J. Scientometr. Res. 2019, 8, 156–160. [Google Scholar] [CrossRef]
  50. Mashala, M.J.; Dube, T.; Mudereri, B.T.; Ayisi, K.K.; Ramudzuli, M.R. A systematic review on advancements in remote sensing for assessing and monitoring land use and land cover changes impacts on surface water resources in semi-arid tropical environments. Remote Sens. 2023, 15, 3926. [Google Scholar] [CrossRef]
  51. McDowell, J.C. The edge of space: Revisiting the Karman Line. Acta Astronaut. 2018, 151, 668–677. [Google Scholar] [CrossRef]
  52. Henry, M. Assembling meteorology: Balloons, leaking gas, and colonial relations in the making of new atmospheres. J. R. Soc. N. Z. 2017, 47, 162–168. [Google Scholar] [CrossRef]
  53. Milrad, S. Synoptic Analysis and Forecasting: An Introductory Toolkit; Elsevier: Amsterdam, The Netherlands, 2017. [Google Scholar]
  54. Ferreira, A.P.; Nieto, R.; Gimeno, L. Completeness of radiosonde humidity observations based on the Integrated Global Radiosonde Archive. Earth Syst. Sci. Data 2019, 11, 603–627. [Google Scholar] [CrossRef]
  55. Naakka, T.; Nygård, T.; Tjernström, M.; Vihma, T.; Pirazzini, R.; Brooks, I.M. The impact of radiosounding observations on numerical weather prediction analyses in the Arctic. Geophys. Res. Lett. 2019, 46, 8527–8535. [Google Scholar] [CrossRef]
  56. Vömel, H.; Ingleby, B. Balloon-borne radiosondes. In Field Measurements for Passive Environmental Remote Sensing; Elsevier: Amsterdam, The Netherlands, 2023; pp. 23–35. [Google Scholar]
  57. Thompson, A.M.; Smit, H.G.; Kollonige, D.E.; Stauffer, R.M. Ozonesondes: Instrumentation and Data Applications. In Field Measurements for Passive Environmental Remote Sensing; Elsevier: Amsterdam, The Netherlands, 2023; pp. 57–78. [Google Scholar]
  58. Liu, L.; Han, Y.; Xia, Y.; Guo, Q.; Gao, W.; Guo, J. Investigation of atmospheric dynamic and thermodynamic structures of typhoon Sinlaku (2020) from high-resolution dropsonde and two-way rawinsonde measurements. Remote Sens. 2022, 14, 2704. [Google Scholar] [CrossRef]
  59. Zheng, M.; Torn, R.; Delle Monache, L.; Doyle, J.; Ralph, F.M.; Tallapragada, V.; Davis, C.; Steinhoff, D.; Wu, X.; Wilson, A. An Assessment of Dropsonde Sampling Strategies for Atmospheric River Reconnaissance. Mon. Weather Rev. 2024, 152, 811–835. [Google Scholar] [CrossRef]
  60. McPartland, M.; Bonin, T.; Reynolds, T. A New System for Obtaining Aircraft Derived Atmospheric Observations for Enhanced Weather Forecasting. In Proceedings of the AIAA AVIATION 2022 Forum, Chicago, IL, USA, 27 June–1 July 2022; p. 4154. [Google Scholar]
  61. Muñoz, L.E.; Campozano, L.V.; Guevara, D.C.; Parra, R.; Tonato, D.; Suntaxi, A.; Maisincho, L.; Páez, C.; Villacís, M.; Córdova, J. Comparison of Radiosonde Measurements of Meteorological Variables with Drone, Satellite Products, and WRF Simulations in the Tropical Andes: The Case of Quito, Ecuador. Atmosphere 2023, 14, 264. [Google Scholar] [CrossRef]
  62. Song, Y.; He, Y.; Leng, H. Analysis of Atmospheric Elements in Near Space Based on Meteorological-Rocket Soundings over the East China Sea. Remote Sens. 2024, 16, 402. [Google Scholar] [CrossRef]
  63. Bayomi, N.; Fernandez, J.E. Eyes in the Sky: Drones Applications in the Built Environment under Climate Change Challenges. Drones 2023, 7, 637. [Google Scholar] [CrossRef]
  64. Kondaveeti, H.K.; Kumaravelu, N.K.; Vanambathina, S.D.; Mathe, S.E.; Vappangi, S. A systematic literature review on prototyping with Arduino: Applications, challenges, advantages, and limitations. Comput. Sci. Rev. 2021, 40, 100364. [Google Scholar] [CrossRef]
  65. Bärfuss, K.; Dirksen, R.; Schmithüsen, H.; Bretschneider, L.; Pätzold, F.; Bollmann, S.; Panten, P.; Rausch, T.; Lampert, A. Drone-Based Atmospheric Soundings up to an Altitude of 10 km-Technical Approach towards Operations. Drones 2022, 6, 404. [Google Scholar] [CrossRef]
  66. Osei, M.A.; Amekudzi, L.K.; Ferguson, C.R.; Danuor, S.K. Inter-comparison of AIRS temperature and relative humidity profiles with AMMA and DACCIWA radiosonde observations over West Africa. Remote Sens. 2020, 12, 2631. [Google Scholar] [CrossRef]
  67. Tobin, D.C.; Revercomb, H.E.; Knuteson, R.O.; Lesht, B.M.; Strow, L.L.; Hannon, S.E.; Feltz, W.F.; Moy, L.A.; Fetzer, E.J.; Cress, T.S. Atmospheric Radiation Measurement site atmospheric state best estimates for Atmospheric Infrared Sounder temperature and water vapor retrieval validation. J. Geophys. Res. Atmos. 2006, 111. [Google Scholar] [CrossRef]
  68. Domonkos, P.; Tóth, R.; Nyitrai, L. Climate Observations: Data Quality Control and Time Series Homogenization; Elsevier: Amsterdam, The Netherlands, 2022; Volume 3. [Google Scholar]
  69. Vömel, H.; Goodstein, M.; Tudor, L.; Witte, J.; Fuchs-Stone, Ž.; Sentić, S.; Raymond, D.; Martinez-Claros, J.; Juračić, A.; Maithel, V. High-resolution in situ observations of atmospheric thermodynamics using dropsondes during the Organization of Tropical East Pacific Convection (OTREC) field campaign. Earth Syst. Sci. Data 2021, 13, 1107–1117. [Google Scholar] [CrossRef]
  70. Li, J.; Sheng, Z.; Fan, Z.; Zhou, S.; Shi, W. Data analysis of upper atmosphere temperature detected by sounding rockets in China. J. Atmos. Ocean. Technol. 2017, 34, 555–565. [Google Scholar] [CrossRef]
  71. Sun, B.; Reale, A.; Pettey, M.; Smith, R.; Brown, C. The NOAA sounding Products Validation System (NPROVS). In Field Measurements for Passive Environmental Remote Sensing; Elsevier: Amsterdam, The Netherlands, 2023; pp. 281–296. [Google Scholar]
  72. van der Linden, R.; Knippertz, P.; Fink, A.H.; Ingleby, B.; Maranan, M.; Benedetti, A. The influence of DACCIWA radiosonde data on the quality of ECMWF analyses and forecasts over southern West Africa. Q. J. R. Meteorol. Soc. 2020, 146, 1719–1739. [Google Scholar] [CrossRef]
  73. Lafon, T.; Fowler, J.; Jiménez, J.F.; Cordoba, G.J.T. A viable alternative for conducting cost-effective daily atmospheric soundings in developing countries. Bull. Am. Meteorol. Soc. 2014, 95, 837–842. [Google Scholar] [CrossRef]
  74. Zhang, J.; Xu, X.; Luo, J. Estimating the observation errors of FY-3C radio occultation dataset using the three-cornered hat method. Terr. Atmos. Ocean. Sci. 2023, 34, 22. [Google Scholar] [CrossRef]
  75. Shao, J.; Zhang, J.; Wang, W.; Zhang, S.; Yu, T.; Dong, W. Occurrence frequency of Kelvin-Helmholtz instability assessed by global high-resolution radiosonde and ERA5 reanalysis. Atmos. Chem. Phys. Discuss. 2023, 23, 12589–12607. [Google Scholar] [CrossRef]
  76. Abdunabiev, S.; Musacchio, C.; Merlone, A.; Paredes, M.; Pasero, E.; Tordella, D. Validation and traceability of miniaturized multi-parameter cluster radiosondes used for atmospheric observations. Measurement 2024, 224, 113879. [Google Scholar] [CrossRef]
  77. Ingleby, B.; Pauley, P.; Kats, A.; Ator, J.; Keyser, D.; Doerenbecher, A.; Fucile, E.; Hasegawa, J.; Toyoda, E.; Kleinert, T. Progress toward high-resolution, real-time radiosonde reports. Bull. Am. Meteorol. Soc. 2016, 97, 2149–2161. [Google Scholar] [CrossRef]
  78. James, E.P.; Benjamin, S.G.; Jamison, B.D. Commercial-aircraft-based observations for NWP: Global coverage, data impacts, and COVID-19. J. Appl. Meteorol. Climatol. 2020, 59, 1809–1825. [Google Scholar] [CrossRef]
  79. Wagner, T.J.; August, T.; Hultberg, T.; Petersen, R.A. On the use of routine airborne observations for evaluation and monitoring of satellite observations of thermodynamic profiles. Atmos. Meas. Tech. 2024, 17, 1–14. [Google Scholar] [CrossRef]
  80. Haiden, T.; Janousek, M.; Vitart, F.; Bouallègue, Z.B.; Ferranti, L.; Prates, F.; Richardson, D. Evaluation of ECMWF Forecasts, including the 2018 Upgrade; European Centre for Medium Range Weather Forecasts: Reading, UK, 2018. [Google Scholar]
  81. National Oceanic and Atmospheric Administration. Radiosondes. Available online: https://www.noaa.gov/jetstream/upperair/radiosondes#:~:text=The%20radiosonde%20is%20a%20small,%2C%20temperature%2C%20and%20relative%20humidity (accessed on 28 January 2024).
  82. Nyamukondiwa, R.M.; Orger, N.C.; Nakayama, D.; Cho, M. A Study on the Derivation of Atmospheric Water Vapor Based on Dual Frequency Radio Signals and Intersatellite Communication Networks. Aerospace 2023, 10, 807. [Google Scholar] [CrossRef]
  83. Marja, F.; Aisyah, S. LabVIEW Based Radiosonde Telemetry System in RF Communication. In Proceedings of the 2018 International Conference on Applied Engineering (ICAE), Batam, Indonesia, 3–4 October 2018; pp. 1–5. [Google Scholar]
  84. Khan, M.S.; Farhan, M.; Fayyaz, O.; Shakoor, R. Effect of AlN Nanoparticle Concentration in the Electrolyte on Corrosion Resistance and Mechanical Properties of the Electrodeposited Composite Coatings. Mater. Today Commun. 2024, 38, 108330. [Google Scholar] [CrossRef]
  85. Nash, J. Measurement of upper-air pressure, temperature and humidity. World Meteorol. Organ. IOM Rep. 2015, 87, 1–89. [Google Scholar]
  86. Yang, J.; An, Q.; Liu, Q.; Tan, M.; Jiang, L. Development of a radiation shield for atmospheric temperature measurement system. Measurement 2024, 229, 114399. [Google Scholar] [CrossRef]
  87. Leung, D.P.; McCormick, D.J.; Malpas, S.C.; Budgett, D.M. Reducing Drift in Implantable Pressure Sensors. IEEE Sens. J. 2018, 19, 2458–2465. [Google Scholar] [CrossRef]
  88. Böck, T.; Pospichal, B.; Löhnert, U. Measurement uncertainties of scanning microwave radiometers and their influence on temperature profiling. Atmos. Meas. Tech. 2024, 17, 219–233. [Google Scholar] [CrossRef]
  89. Zolghadrshojaee, M.; Tegtmeier, S.; Davis, S.M.; Pilch Kedzierski, R. Variability and long-term changes of tropical cold point temperature and water vapor. EGUsphere 2024, 2024, 1–23. [Google Scholar]
  90. Lanzante, J.R.; Klein, S.A.; Seidel, D.J. Temporal homogenization of monthly radiosonde temperature data. Part I: Methodology. J. Clim. 2003, 16, 224–240. [Google Scholar] [CrossRef]
  91. Haimberger, L.; Tavolato, C.; Sperka, S. Toward elimination of the warm bias in historic radiosonde temperature records—Some new results from a comprehensive intercomparison of upper-air data. J. Clim. 2008, 21, 4587–4606. [Google Scholar] [CrossRef]
  92. Fassò, A.; Ignaccolo, R.; Madonna, F.; Demoz, B.; Franco-Villoria, M. Statistical modelling of collocation uncertainty in atmospheric thermodynamic profiles. Atmos. Meas. Tech. 2014, 7, 1803–1816. [Google Scholar] [CrossRef]
  93. Rodgers, C.D. Inverse Methods for Atmospheric Sounding: Theory and Practice; World Scientific: Singapore, 2000; Volume 2. [Google Scholar]
  94. Lavender, S.; Lavender, A. Practical Handbook of Remote Sensing; CRC Press: Boca Raton, FL, USA, 2023. [Google Scholar]
  95. Burrows, J.; Dehn, A.; Deters, B.; Himmelmann, S.; Richter, A.; Voigt, S.; Orphal, J. Atmospheric remote-sensing reference data from GOME: Part 1. Temperature-dependent absorption cross-sections of NO2 in the 231–794 nm range. J. Quant. Spectrosc. Radiat. Transf. 1998, 60, 1025–1031. [Google Scholar] [CrossRef]
  96. Chen, H.; Guan, L. Assessing FY-3E HIRAS-II Radiance Accuracy Using AHI and MERSI-LL. Remote Sens. 2022, 14, 4309. [Google Scholar] [CrossRef]
  97. Teng, H.F.; Kuo, Y.H.; Done, J.M. Potential Impacts of Radio Occultation Data Assimilation on Forecast Skill of Tropical Cyclone Formation in the Western North Pacific. Geophys. Res. Lett. 2023, 50, e2021GL096750. [Google Scholar] [CrossRef]
  98. Wee, T.-K. A variational regularization of Abel transform for GPS radio occultation. Atmos. Meas. Tech. 2018, 11, 1947–1969. [Google Scholar] [CrossRef]
  99. Nalli, N.R.; Kalluri, S. Introduction: Field measurements and remote sensing. In Field Measurements for Passive Environmental Remote Sensing; Elsevier: Amsterdam, The Netherlands, 2023; pp. 1–20. [Google Scholar]
  100. Kotthaus, S.; Bravo-Aranda, J.A.; Collaud Coen, M.; Guerrero-Rascado, J.L.; Costa, M.J.; Cimini, D.; O’Connor, E.J.; Hervo, M.; Alados-Arboledas, L.; Jiménez-Portaz, M. Atmospheric boundary layer height from ground-based remote sensing: A review of capabilities and limitations. Atmos. Meas. Tech. 2023, 16, 433–479. [Google Scholar] [CrossRef]
  101. Mao, S.; Yin, Z.; Wang, L.; Wei, Y.; Bu, Z.; Chen, Y.; Dai, Y.; Müller, D.; Wang, X. Aerosol Optical Properties Retrieved by Polarization Raman Lidar: Methodology and Strategy of a Quality-Assurance Tool. Remote Sens. 2024, 16, 207. [Google Scholar] [CrossRef]
  102. Yu, J.; Cheng, Y.; Kong, Z.; Song, J.; Chang, Y.; Liu, K.; Gong, Z.; Mei, L. Broadband continuous-wave differential absorption lidar for atmospheric remote sensing of water vapor. Opt. Express 2024, 32, 3046–3061. [Google Scholar] [CrossRef] [PubMed]
  103. Kartashov, V.; Babkin, S.; Kartashov, A.; Pershyn, Y. Development of the Atmosphere Radio-Acoustic Sounding Method in Ukraine and in the World in the Period of 1961–2000. In Proceedings of the 2023 IEEE International Conference on Information and Telecommunication Technologies and Radio Electronics (UkrMiCo), Kyiv, Ukraine, 13–18 November 2023; pp. 372–376. [Google Scholar]
  104. Li, S.; Hu, H.; Fang, C.; Wang, S.; Xun, S.; He, B.; Wu, W.; Huo, Y. Hyperspectral Infrared Atmospheric Sounder (HIRAS) atmospheric sounding system. Remote Sens. 2022, 14, 3882. [Google Scholar] [CrossRef]
  105. Zou, C.Z.; Xu, H.; Hao, X.; Liu, Q. Mid-Tropospheric Layer Temperature Record Derived from Satellite Microwave Sounder Observations with Backward Merging Approach. J. Geophys. Res. Atmos. 2023, 128, e2022JD037472. [Google Scholar] [CrossRef]
  106. He, Y.; Zhang, S.; Guo, S.; Wu, Y. Quality Assessment of the Atmospheric Radio Occultation Profiles from FY-3E/GNOS-II BDS and GPS Measurements. Remote Sens. 2023, 15, 5313. [Google Scholar] [CrossRef]
  107. Li, F.; Hou, C.; Kan, L.; Fu, N.; Wang, M.; Wang, Z. Mountain top-based atmospheric radio occultation observations with open/closed loop tracking: Experiment and validation. Remote Sens. 2020, 12, 4078. [Google Scholar] [CrossRef]
  108. Caruso, A.; Bourgoin, A.; Togni, A.; Zannoni, M.; Tortora, P. Radio Occultation Data Analysis with Analytical Ray-Tracing. Radio Sci. 2023, 58, e2023RS007740. [Google Scholar] [CrossRef]
  109. Schinder, P.J.; Flasar, F.M.; Marouf, E.A.; French, R.G.; McGhee, C.A.; Kliore, A.J.; Rappaport, N.J.; Barbinis, E.; Fleischman, D.; Anabtawi, A. The structure of Titan’s atmosphere from Cassini radio occultations. Icarus 2011, 215, 460–474. [Google Scholar] [CrossRef]
  110. Palmer, P.I.; Barnett, J.; Eyre, J.; Healy, S. A nonlinear optimal estimation inverse method for radio occultation measurements of temperature, humidity, and surface pressure. J. Geophys. Res. Atmos. 2000, 105, 17513–17526. [Google Scholar] [CrossRef]
  111. Gorbunov, M. Editorial for the Special Issue:“Radio Occultations for Numerical Weather Prediction, Ionosphere, and Space Weather”. Remote Sens. 2023, 15, 2107. [Google Scholar] [CrossRef]
  112. Liu, M.; Chen, L.; Jian, N.; Guo, P.; Kong, J.; Wang, M.; Han, Q.; Ping, J.; Wu, M. Preliminary Estimations of Mars Atmospheric and Ionospheric Profiles from Tianwen-1 Radio Occultation One-Way, Two-Way, and Three-Way Observations. Remote Sens. 2023, 15, 5506. [Google Scholar] [CrossRef]
  113. Culverwell, I.; Healy, S.; Elvidge, S. One-Dimensional Variational Ionospheric Retrieval Using Radio Occultation Bending Angles: 1. Theory. Space Weather. 2024, 22, e2023SW003572. [Google Scholar] [CrossRef]
  114. Qian, X.; Qin, Z.; Li, J.; Han, Y.; Liu, G. Preliminary Evaluation of FY-3E Microwave Temperature Sounder Performance Based on Observation Minus Simulation. Remote Sens. 2022, 14, 2250. [Google Scholar] [CrossRef]
  115. Mears, C.A.; Wentz, F.J.; Thorne, P.; Bernie, D. Assessing uncertainty in estimates of atmospheric temperature changes from MSU and AMSU using a Monte-Carlo estimation technique. J. Geophys. Res. Atmos. 2011, 116. [Google Scholar] [CrossRef]
  116. Turner, D.D.; Löhnert, U. Ground-based temperature and humidity profiling: Combining active and passive remote sensors. Atmos. Meas. Tech. 2021, 14, 3033–3048. [Google Scholar] [CrossRef]
  117. Veenus, V.; Das, S.S.; Sama, B.; Uma, K. A comparison of temperature and relative humidity measurements derived from COSMIC-2 radio occultations with radiosonde observations made over the Asian summer monsoon region. Remote Sens. Lett. 2022, 13, 394–405. [Google Scholar] [CrossRef]
  118. Wang, W.; Cao, C. NOAA-20 and S-NPP VIIRS thermal emissive bands on-orbit calibration algorithm update and long-term performance inter-comparison. Remote Sens. 2021, 13, 448. [Google Scholar] [CrossRef]
  119. Yang, W.; Liu, L.; Deng, W.; Huang, W.; Ye, J.; Hu, S. Deep Retrieval Architecture of Temperature and Humidity Profiles from Ground-Based Infrared Hyperspectral Spectrometer. Remote Sens. 2023, 15, 2320. [Google Scholar] [CrossRef]
  120. Dee, D.P. Variational bias correction of radiance data in the ECMWF system. In Proceedings of the ECMWF Workshop on Assimilation of High Spectral Resolution Sounders in NWP, Reading, UK, 28 June–1 July 2004; pp. 97–112. [Google Scholar]
  121. Gomaa, H.E.; Mousa, A.; Yousef, M.; Mahrous, A. Statistical Validation of GNSS Radio Occultation data over Egypt. Adv. Basic Appl. Sci. 2024, 2, 29–45. [Google Scholar] [CrossRef]
  122. Mears, C.A.; Wentz, F.J. A satellite-derived lower-tropospheric atmospheric temperature dataset using an optimized adjustment for diurnal effects. J. Clim. 2017, 30, 7695–7718. [Google Scholar] [CrossRef]
  123. Pu, Z.; Kalnay, E. Numerical weather prediction basics: Models, numerical methods, and data assimilation. In Handbook of Hydrometeorological Ensemble Forecasting; Springer: Berlin/Heidelberg, Germany, 2019; pp. 67–97. [Google Scholar] [CrossRef]
  124. Zhu, S.; Wang, B.; Zhang, L.; Liu, J.; Liu, Y.; Gong, J.; Xu, S.; Wang, Y.; Huang, W.; Liu, L. A 4DEnVar-Based Ensemble Four-Dimensional Variational (En4DVar) Hybrid Data Assimilation System for Global NWP: System Description and Primary Tests. J. Adv. Model. Earth Syst. 2022, 14, e2022MS003023. [Google Scholar] [CrossRef]
  125. Gneiting, T.; Raftery, A.E. Weather forecasting with ensemble methods. Science 2005, 310, 248–249. [Google Scholar] [CrossRef]
  126. Divakarla, M.G.; Barnet, C.D.; Goldberg, M.D.; McMillin, L.M.; Maddy, E.; Wolf, W.; Zhou, L.; Liu, X. Validation of Atmospheric Infrared Sounder temperature and water vapor retrievals with matched radiosonde measurements and forecasts. J. Geophys. Res. Atmos. 2006, 111. [Google Scholar] [CrossRef]
  127. Wolf, K.; Bellouin, N.; Boucher, O. Long-term upper-troposphere climatology of potential contrail occurrence over the Paris area derived from radiosonde observations. Atmos. Chem. Phys. 2023, 23, 287–309. [Google Scholar] [CrossRef]
  128. Boukabara, S.-A.; Jones, E.; Geer, A.; Kazumori, M.; Garrett, K.; Maddy, E. Assimilation of precipitation observations from space into numerical weather prediction (NWP). Satell. Precip. Meas. 2020, 2, 941–982. [Google Scholar]
  129. Madonna, F.; Summa, D.; Di Girolamo, P.; Marra, F.; Wang, Y.; Rosoldi, M. Assessment of trends and uncertainties in the atmospheric boundary layer height estimated using radiosounding observations over Europe. Atmosphere 2021, 12, 301. [Google Scholar] [CrossRef]
  130. Chandra, S.; Dwivedi, A.K.; Kumar, M. Characterization of the atmospheric boundary layer from radiosonde observations along eastern end of monsoon trough of India. J. Earth Syst. Sci. 2014, 123, 1233–1240. [Google Scholar] [CrossRef]
  131. Korhonen, K.; Giannakaki, E.; Mielonen, T.; Pfüller, A.; Laakso, L.; Vakkari, V.; Baars, H.; Engelmann, R.; Beukes, J.; Van Zyl, P. Atmospheric boundary layer top height in South Africa: Measurements with lidar and radiosonde compared to three atmospheric models. Atmos. Chem. Phys. 2014, 14, 4263–4278. [Google Scholar] [CrossRef]
  132. Garratt, J.R. The atmospheric boundary layer. Earth-Sci. Rev. 1994, 37, 89–134. [Google Scholar] [CrossRef]
  133. Silva, E.; Tirabassi, T.; Vilhena, M.T.; Buske, D.; Quadros, R. Solution of the puff model for pollutant dispersion in the atmospheric boundary layer by the Giltt method. In Proceedings of the 22nd International Congress of Mechanical Engineering, Ribeirão Preto, Brazil, 3–7 November 2013; pp. 3–7. [Google Scholar]
  134. Romm, J.J. Climate Change: What Everyone Needs to Know; Oxford University Press: Oxford, UK, 2022. [Google Scholar]
  135. Pirani, A.; Fuglestvedt, J.S.; Byers, E.; O’Neill, B.; Riahi, K.; Lee, J.-Y.; Marotzke, J.; Rose, S.K.; Schaeffer, R.; Tebaldi, C. Scenarios in IPCC assessments: Lessons from AR6 and opportunities for AR7. NPJ Clim. Action 2024, 3, 1. [Google Scholar] [CrossRef]
  136. Immler, F.; Dykema, J.; Gardiner, T.; Whiteman, D.; Thorne, P.; Vömel, H. Reference quality upper-air measurements: Guidance for developing GRUAN data products. Atmos. Meas. Tech. 2010, 3, 1217–1231. [Google Scholar] [CrossRef]
  137. Lackner, B.C.; Steiner, A.K.; Hegerl, G.C.; Kirchengast, G. Atmospheric climate change detection by radio occultation data using a fingerprinting method. J. Clim. 2011, 24, 5275–5291. [Google Scholar] [CrossRef]
  138. Innerkofler, J.; Kirchengast, G.; Schwärz, M.; Marquardt, C.; Andres, Y. GNSS radio occultation excess-phase processing for climate applications including uncertainty estimation. Atmos. Meas. Tech. 2023, 16, 5217–5247. [Google Scholar] [CrossRef]
  139. Wang, Y.; Li, Y.; Wang, G.; Yuan, Y.; Geng, H. Influences of Sudden Stratospheric Warming Events on Tropopause Based on GNSS Radio Occultation Data. Atmosphere 2023, 14, 1553. [Google Scholar] [CrossRef]
  140. Jing, X.; Ho, S.-P.; Shao, X.; Liu, T.-C.; Chen, Y.; Zhou, X. Spire RO Thermal Profiles for Climate Studies: Initial Comparisons of the Measurements from Spire, NOAA-20 ATMS, Radiosonde, and COSMIC-2. Remote Sens. 2023, 15, 3710. [Google Scholar] [CrossRef]
  141. Liu, Y.; Wang, J.; Huo, P.; Shi, C.; Liu, Z.; Yan, Y.; Yao, J.; Chang, A. A novel design of fast response Mn–Ni–Cu–Fe–O microbead thermistors for radiosonde. J. Mater. Sci. Mater. Electron. 2023, 34, 1737. [Google Scholar] [CrossRef]
  142. Ming, Z.; Li, X.; Teng, G.; Wu, C.; Huang, C.; Chang, Q. Research on retrieval algorithm of middle atmospheric temperature using Rayleigh lidar based on Kalman filter. In Proceedings of the AOPC 2022: Advanced Laser Technology and Applications, Online, 18–19 December 2022; pp. 55–60. [Google Scholar]
  143. Casas, M.C.; Schmidt, G.A.; Miller, R.L.; Orbe, C.; Tsigaridis, K.; Nazarenko, L.S.; Bauer, S.E.; Shindell, D.T. Understanding Model-Observation Discrepancies in Satellite Retrievals of Atmospheric Temperature Using GISS ModelE. J. Geophys. Res. Atmos. 2023, 128, e2022JD037523. [Google Scholar] [CrossRef]
  144. Gong, Y.; Liu, Z.; Chan, P.W.; Hon, K.K. Assimilating GNSS PWV and radiosonde meteorological profiles to improve the PWV and rainfall forecasting performance from the Weather Research and Forecasting (WRF) model over the South China. Atmos. Res. 2023, 286, 106677. [Google Scholar] [CrossRef]
  145. Ingleby, B.; Motl, M.; Marlton, G.; Edwards, D.; Sommer, M.; von Rohden, C.; Vömel, H.; Jauhiainen, H. On the quality of RS41 radiosonde descent data. Atmos. Meas. Tech. Discuss. 2022, 15, 165–183. [Google Scholar] [CrossRef]
  146. Madonna, F.; Tramutola, E.; Sy, S.; Serva, F.; Proto, M.; Rosoldi, M.; Gagliardi, S.; Amato, F.; Marra, F.; Fassò, A. Radiosounding HARMonization (RHARM): A new homogenized dataset of radiosounding temperature, humidity and wind profiles with uncertainty. Earth Syst. Sci. Data Discuss. 2020, 2020, 1–38. [Google Scholar]
  147. Ma, Y.; Liu, J.; Mamtimin, A.; Aihaiti, A.; Xu, L. Validation of FY-4A Temperature Profiles by Radiosonde Observations in Taklimakan Desert in China. Remote Sens. 2023, 15, 2925. [Google Scholar] [CrossRef]
  148. Zhang, L.; Ding, M.; Zheng, X.; Chen, J.; Guo, J.; Bian, L. Assessment of AIRS Version 7 Temperature Profiles and Low-Level Inversions with GRUAN Radiosonde Observations in the Arctic. Remote Sens. 2023, 15, 1270. [Google Scholar] [CrossRef]
  149. Fan, H.; Li, S.; Sun, Z.; Xiao, G.; Li, X.; Liu, X. Analysis of systematic biases in tropospheric hydrostatic delay models and construction of a correction model. Geosci. Model Dev. 2023, 16, 1345–1358. [Google Scholar] [CrossRef]
  150. Dirksen, R.J.; Bodeker, G.E.; Thorne, P.W.; Merlone, A.; Reale, T.; Wang, J.; Hurst, D.F.; Demoz, B.B.; Gardiner, T.D.; Ingleby, B. Managing the transition from Vaisala RS92 to RS41 radiosondes within the Global Climate Observing System Reference Upper-Air Network (GRUAN): A progress report. Geosci. Instrum. Methods Data Syst. 2020, 9, 337–355. [Google Scholar] [CrossRef]
  151. Voggenberger, U.; Haimberger, L.; Ambrogi, F.; Poli, P. Balloon drift estimation and improved position estimates for radiosondes. Geosci. Model Dev. Discuss. 2023, 2023, 1–29. [Google Scholar]
  152. Sato, K.; Inoue, J.; Yamazaki, A.; Hirasawa, N.; Sugiura, K.; Yamada, K. Antarctic radiosonde observations reduce uncertainties and errors in reanalyses and forecasts over the Southern Ocean: An extreme cyclone case. Adv. Atmos. Sci. 2020, 37, 431–440. [Google Scholar] [CrossRef]
  153. Chen, Z.; Zhou, Z.; Liu, Z.; Li, Q.; Zhang, X. Bias adjustment and analysis of Chinese daily historical radiosonde temperature data. J. Meteorol. Res. 2021, 35, 17–31. [Google Scholar] [CrossRef]
  154. von Rohden, C.; Sommer, M.; Naebert, T.; Motuz, V.; Dirksen, R.J. Laboratory characterisation of the radiation temperature error of radiosondes and its application to the GRUAN data processing for the Vaisala RS41. Atmos. Meas. Tech. Discuss. 2022, 15, 383–405. [Google Scholar] [CrossRef]
  155. Qiao, Y. A new method for producing temperature profiles based on ERA5 and RAOB. In Proceedings of the 2023 7th International Conference on Machine Vision and Information Technology (CMVIT), Xiamen, China, 24–26 March 2023; pp. 35–39. [Google Scholar]
  156. Fassò, A.; Keernik, H.; Rannat, K. On the Kalman Smoother Interpolation Error Distribution in Collocation Comparison of Atmospheric Profiles. Axioms 2023, 12, 902. [Google Scholar] [CrossRef]
  157. Summa, D.; Vivone, G.; Franco, N.; D’Amico, G.; De Rosa, B.; Di Girolamo, P. Atmospheric Boundary Layer Height: Inter-Comparison of Different Estimation Approaches Using the Raman Lidar as Benchmark. Remote Sens. 2023, 15, 1381. [Google Scholar] [CrossRef]
  158. Renju, R.; Raju, C.S.; Swathi, R.; Milan, V. Retrieval of atmospheric temperature and humidity profiles over a tropical coastal station from ground-based Microwave Radiometer using deep learning technique. J. Atmos. Sol.-Terr. Phys. 2023, 249, 106094. [Google Scholar] [CrossRef]
  159. Haynes, K.; Stock, J.; Dostalek, J.; Anderson, C.; Ebert-Uphoff, I. Exploring the Use of Machine Learning to Improve Vertical Profiles of Temperature and Moisture. Artif. Intell. Earth Syst. 2024, 3, e220090. [Google Scholar] [CrossRef]
  160. Xun Yang, J.; You, Y.; Blackwell, W.; Da, C.; Kalnay, E.; Grassotti, C.; Liu, Q.M.; Ferraro, R.; Meng, H.; Zou, C.-Z. A Community Error Inventory for Satellite Microwave Observation Error Representation and Uncertainty Quantification. Bull. Am. Meteorol. Soc. 2024, 105, E1–E20. [Google Scholar] [CrossRef]
  161. Chen, J.; Dai, A. The atmosphere has become increasingly unstable during 1979–2020 over the Northern Hemisphere. Geophys. Res. Lett. 2023, 50, e2023GL106125. [Google Scholar] [CrossRef]
  162. Tegtmeier, S.; Anstey, J.; Davis, S.; Dragani, R.; Harada, Y.; Ivanciu, I.; Pilch Kedzierski, R.; Krüger, K.; Legras, B.; Long, C. Temperature and tropopause characteristics from reanalyses data in the tropical tropopause layer. Atmos. Chem. Phys. 2020, 20, 753–770. [Google Scholar] [CrossRef]
  163. Bell, B.; Hersbach, H.; Simmons, A.; Berrisford, P.; Dahlgren, P.; Horányi, A.; Muñoz-Sabater, J.; Nicolas, J.; Radu, R.; Schepers, D. The ERA5 global reanalysis: Preliminary extension to 1950. Q. J. R. Meteorol. Soc. 2021, 147, 4186–4227. [Google Scholar] [CrossRef]
  164. García-Comas, M.; Funke, B.; López-Puertas, M.; Glatthor, N.; Grabowski, U.; Kellmann, S.; Kiefer, M.; Linden, A.; Martínez-Mondéjar, B.; Stiller, G.P. Version 8 IMK–IAA MIPAS temperatures from 12–15 µm spectra: Middle and Upper Atmosphere modes. Atmos. Meas. Tech. 2023, 16, 5357–5386. [Google Scholar] [CrossRef]
  165. Ladstädter, F.; Steiner, A.K.; Gleisner, H. Resolving the 21st century temperature trends of the upper troposphere–lower stratosphere with satellite observations. Sci. Rep. 2023, 13, 1306. [Google Scholar] [CrossRef]
  166. Tradowsky, J.S. Enhancing the Upper-Air Observational Temperature Record to Improve Satellite Validation and Weather Forecasts. Doctoral Thesis, Freie Universität Berlin, Berlin, Germany, 2018. [Google Scholar]
  167. Nielsen, J.K.; Gleisner, H.; Syndergaard, S.; Lauritsen, K.B. Estimation of refractivity uncertainties and vertical error correlations in collocated radio occultations, radiosondes, and model forecasts. Atmos. Meas. Tech. 2022, 15, 6243–6256. [Google Scholar] [CrossRef]
  168. Gopikrishnan, G.; Kuttippurath, J.; Thapliyal, P.; Shukla, M. Validation of INSAT-3D and INSAT-3DR Temperature Profile Retrievals Using Ground-Based, Satellite, and Reanalysis Data. J. Geophys. Res. Atmos. 2023, 128, e2023JD038912. [Google Scholar] [CrossRef]
  169. Jiang, C.; Gao, X.; Wang, S.; An, Q.; Zhu, M. Comparison of pressure, temperature and specific humidity from COSMIC-2 with radiosonde and ERA5. J. Spat. Sci. 2023, 1–19. [Google Scholar] [CrossRef]
  170. Zhao, H.; Ma, X.; Jia, G.; Mi, Z.; Ji, H. Synergistic Retrieval of Temperature and Humidity Profiles from Space-Based and Ground-Based Infrared Sounders Using an Optimal Estimation Method. Remote Sens. 2022, 14, 5256. [Google Scholar] [CrossRef]
  171. Beckert, A.A.; Eisenstein, L.; Oertel, A.; Hewson, T.; Craig, G.C.; Rautenhaus, M. The three-dimensional structure of fronts in mid-latitude weather systems as represented by numerical weather prediction models. Geosci. Model Dev. Discuss. 2023, 1–40. [Google Scholar] [CrossRef]
  172. Angel, A.C.; Manoj, M. A novel method of estimating atmospheric boundary layer height using a 205 MHz VHF radar. Sci. Total Environ. 2024, 907, 168109. [Google Scholar] [CrossRef]
  173. Xia, P.; Shan, Y.; Ye, S.; Xia, J. A New Technology to Detect the Tropopause, Solving Some Radiosonde Data’s Insufficient Detection Height Problem. In IEEE Transactions on Geoscience and Remote Sensing; IEEE: Piscataway, NJ, USA, 2023. [Google Scholar]
  174. Troglia Gamba, M.; Polidori, B.D.; Minetto, A.; Dovis, F.; Banfi, E.; Dominici, F. GNSS Radio Frequency Interference Monitoring from LEO Satellites: An In-Laboratory Prototype. Sensors 2024, 24, 508. [Google Scholar] [CrossRef]
  175. Pereira, S.; Canhoto, P.; Salgado, R. Development and assessment of artificial neural network models for direct normal solar irradiance forecasting using operational numerical weather prediction data. Energy AI 2024, 15, 100314. [Google Scholar] [CrossRef]
  176. Berndt, E.; Smith, N.; Barnet, C. Integrating NASA Aqua AIRS in a Real-Time NUCAPS Science-To-Applications System to Support Severe Weather Forecasting. Earth Space Sci. 2023, 10, e2022EA002725. [Google Scholar] [CrossRef]
  177. Yang, S.C.; Chen, S.H.; Chang, C.C. Understanding the impact of assimilating FORMOSAT-7/COSMIC-2 radio occultation refractivity on tropical cyclone genesis: Observing system simulation experiments using Hurricane Gordon (2006) as a case study. Q. J. R. Meteorol. Soc. 2023, 149, 1293–1318. [Google Scholar] [CrossRef]
  178. Beucler, T.; Gentine, P.; Yuval, J.; Gupta, A.; Peng, L.; Lin, J.; Yu, S.; Rasp, S.; Ahmed, F.; O’Gorman, P.A. Climate-invariant machine learning. Sci. Adv. 2024, 10, eadj7250. [Google Scholar] [CrossRef]
  179. Bärfuss, K.B.; Schmithüsen, H.; Lampert, A. Drone-based meteorological observations up to the tropopause—A concept study. Atmos. Meas. Tech. 2023, 16, 3739–3765. [Google Scholar] [CrossRef]
  180. Donnelly, J.; Daneshkhah, A.; Abolfathi, S. Forecasting global climate drivers using Gaussian processes and convolutional autoencoders. Eng. Appl. Artif. Intell. 2024, 128, 107536. [Google Scholar] [CrossRef]
  181. McGovern, A.; Tissot, P.; Bostrom, A. Developing trustworthy AI for weather and climate. Phys. Today 2024, 77, 26–31. [Google Scholar] [CrossRef]
Figure 1. Shows the methodology used to choose the publications that were reviewed.
Atmosphere 15 00387 g001
Figure 2. Progress of in situ radiosonde papers for monitoring upper air temperatures.
Atmosphere 15 00387 g002
Figure 4. Theme evolution of remote sensing applications in upper air temperature observations from 2000 to 2023.
Atmosphere 15 00387 g004
Figure 5. Radio occultation retrieval approaches for upper air temperature observations.
Atmosphere 15 00387 g005
Table 1. Summary of studies on in situ upper air temperature observations.
PlatformSensor TypeLaunching SiteVariablesAccuracyReference
Balloon-born radiosondeVaisala RS92 and RS41, and MeteomodemGlobalTemperature and relative humidityThe systematic differences in the temperature profile for both Meteomodem and Vaisala were less than ±0.2 K up to 10 hPa; RH profile differences were less than 1% RH for the Sodankylä Vaisala dataset up to 300 hPa. [27]
Drone (LUCA)HMP110 (Vaisala)Baltic Sea, GermanyTemperature, humidity, and pressureThe uncertainty of the pressure was 0.6 hPa, temperature was 1 k, and humidity yielded 5%. [65]
Aircraft AVAPS DropsondeRD41 and NRD41Tropical East Pacific and CaribbeanTemperature, pressure, and relative humidityThe pressure was achieved with the uncertainty of 0.4 hPa, temperature with 0.2 K, and relative humidity with a bias of 2%.[69]
Near-space sounding rocketn/aChinaTemperatureThe precision of the temperature measurements ranged between 1.58 k below 50 km and 3.08 k between 50 and 60 km[70]
Balloon-born radiosondeVarious sensors accessed via NPROVS collocations GlobalTemperatureThe global average biases in the 15–70 hPa layer were 0.05–1.89 K standard deviation (~52,000 profiles) at night and 0.39–1.80 K standard deviation (~64,500 profiles) in the daytime (SEA > 7.5).[71]
Balloon-born radiosondeVarious sensors through the DACCIWA campaign West AfricaTemperatureThe temperature biases range from 0.5 K to 1 K through the troposphere.[72]
Disclaimer/Publisher’s Note: The statements, opinions and data contained in all publications are solely those of the individual author(s) and contributor(s) and not of MDPI and/or the editor(s). MDPI and/or the editor(s) disclaim responsibility for any injury to people or property resulting from any ideas, methods, instructions or products referred to in the content.

