
Exploring the Spatio-Temporal Trends of Geomorphological Incidents Induced by Precipitation on Chinese Highways
1
Tongling Meteorological Bureau, Tongling 244100, China
2
Public Weather Service Center of China Meteorological Administration, Beijing 100081, China
3
Key Laboratory of Transportation Meteorology of China Meteorological Administration, Nanjing 210009, China
*
Author to whom correspondence should be addressed.
Atmosphere 2024, 15(4), 391; https://doi.org/10.3390/atmos15040391
Submission received: 5 February 2024
/
Revised: 14 March 2024
/
Accepted: 15 March 2024
/
Published: 22 March 2024
(This article belongs to the Special Issue Advance in Transportation Meteorology (2nd Edition))
Abstract
:The spatiotemporal distribution of geomorphological incidents was examined in the present study, including the characteristics of obstruction distances and durations, by utilizing nationwide incident mitigation data and precipitation observation records from the period spanning 2019 to 2022. By comparing rainfall features over different temporal scales across various regions, the aim of the present study was to enhance the current comprehension of the patterns through which regional precipitation initiates incidents on highways by comparing rainfall characteristics over distinct temporal scales across diverse geographical areas. The findings indicate that: (1) The spatial distribution of highway incidents in China is significantly correlated with regional natural environments, predominantly concentrated in the southern parts of the country’s second and third topographical terraces. The temporal distribution closely aligns with annual and monthly precipitation patterns, with the majority of occurrences taking place from June to September. Further, notable disparities in the distribution of highway-related incidents were observed among counties across most provinces; (2) National highways experience a notably higher frequency of incidents than expressways and provincial roads, with most obstruction lengths concentrated within 1 km and durations predominantly under 3 days; (3) The probability of daily rainfall inducing highway incidents is distinctly higher than that of short-duration rainfall, with eastern and southern China experiencing significantly greater inducing precipitation volumes than other regions. The majority of areas are susceptible to incidents within a 3-day window following heavy rainfall or within 24 h after intense short-duration rainfall. Moreover, it is observed that incidents are more closely associated with extreme precipitation occurring within a single day; (4) There is a certain lag between the timing of incidents and the occurrence of extreme short-duration heavy rainfall, with the highest frequency of incidents coinciding with continuous rainfall periods of 3 to 6 days.
1. Introduction
Highway traffic, serving as an integral element of the transportation system, assumes a pivotal role in facilitating China’s economic growth [1]. The total length of national highways has grown from 1.6 million kilometers in 1978 to 5.16 million kilometers in 2022, with expressways reaching 177,300 km, making China the world leader in terms of expressway infrastructure [2]. China stands as one of the nations most significantly impacted by geomorphological disasters, with losses attributed to these events representing more than 35% of the overall losses incurred from various natural calamities [3,4,5]. In geomorphological incidents, collapses, landslides, debris flows, and engineering incidents induced by human activities account for more than half of the losses, amounting to approximately 20 billion yuan annually [6]. Owing to annual incidents, the complex and variable topography, meteorology, and hydrology along highways contribute to significant losses and safety hazards [7,8]. As such, effectively preventing and managing highway incidents to ensure transportation safety is an urgent issue.
In the field of highway geohazard prevention and control, numerous scholars have primarily focused on conducting causal analyses of geomorphological events occurring on road slopes and mountainous highways. Such analyses have been conducted through theoretical investigations, on-site inspections, and expert scoring methodologies [9,10,11,12,13,14,15]. Leveraging GIS technology, several experts have conducted spatiotemporal distribution studies and risk assessments involving highway incidents such as rockfalls [16,17,18], debris flows [19,20,21], and landslides [22,23,24]. Based on such research, targeted mitigation measures have been proposed [25,26]. Studies have indicated that precipitation constitutes one of the principal external factors responsible for triggering incidents on highways. Antecedent factors such as hourly extreme precipitation, daily extreme precipitation, and effective precipitation are all closely linked to the occurrence of incidents [27,28,29,30,31].
To elucidate the relationship between highway geomorphological events and precipitation, the majority of scholars have primarily conducted qualitative research on the correlation between precipitation and incidents [32,33,34]. The findings from such research have indicated a positive correlation between the frequency of incident occurrences and the amount of precipitation [35,36], with significant differences in annual precipitation observable under different geomorphological backgrounds [37]. A minority of researchers have conducted quantitative studies on highway incidents and their precipitation characteristics [38,39]. These studies have unveiled a strong association between the frequency and duration of intense precipitation events and the likelihood of incident occurrences [40]. Notably, the most substantial correlation has been identified with precipitation events occurring within the 24 h leading up to an incident event [41].
Such investigations into the interplay between highway incidents and precipitation have predominantly been regional in scope, and there is a scarcity of studies on the precipitation characteristics over different temporal scales across the nation. Analyzing the specific precipitation triggers for incidents in various regions, along with the development of reliable scientific monitoring and an early warning system, can provide substantial support for forecasting, early warning, and prevention efforts related to highway incidents. In the present study, data on China’s highway geomorphological incidents over the past four years was leveraged to analyze the national spatio-temporal characteristics of these incidents. At the same time, the antecedent precipitation features were compared across different regions, with the goal of facilitating further understanding of the patterns of rainfall-induced incidents on highways.
2. Data and Methods
2.1. Data Sources
The present study encompassed highway geomorphological incident data and real-time precipitation data. The former consisted of 5626 incident events, such as debris flows, landslides, and collapses on highways from 2019 to 2022, sourced from the Ministry of Transport’s highway traffic condition information system. The system is capable of collecting incident events on highways from various provinces nationwide and generating an Excel document. The event information includes event type, event description, occurrence location, time of occurrence, start and end points, and other related details.
The exact geographic locations of 1338 incident events were determined using highway vector data inversion. The latter comprised hourly and daily precipitation amounts measured at the nearest regional meteorological stations within 5 km of the incident sites. This data was collected from the “Tianqing” meteorological big data cloud platform built by the China National Meteorological Information Center and includes real-time meteorological element data from national stations across China.
2.2. Research Methods
2.2.1. Regional Division Standards
The highway incident data does not include information from Taiwan Province. Therefore, the working area of this study is limited to mainland China. According to first-level meteorological geographical zoning standards, mainland China is divided into ten regions: North China, Northeast China, East China, Central China, South China, Southwest China, Northwest China, Inner Mongolia, Tibet, and Xinjiang. For the present study, Inner Mongolia was included in North China, Xinjiang in Northwest China, and Tibet in Southwest China, as shown in Figure 1.
Given that highway incidents in Northeast China have occurred only 17 times, with a relatively low incidence rate, the robustness, reliability, and generalizability of the research findings will be compromised. Therefore, the present study primarily concentrated on investigating the six regions of Northwest China, North China, East China, Southwest China, Central China, and South China.
2.2.2. Rainfall Grading Standards
Employing the “The grade of rainfall in short time weather service” (TCMSA0013-2019), thresholds of 0.1 mm/h, 2 mm/h, 4 mm/h, 8 mm/h, and 20 mm/h were selected to distinguish between light rain, moderate rain, heavy rain, torrential rain, and downpour for short-term hourly precipitation levels.
In accordance with the “Grade of precipitation” (GB/T28592-2012), specific daily precipitation thresholds were selected. These thresholds included 0.1 mm/d for light rain, 10 mm/d for moderate rain, 25 mm/d for heavy rain, 50 mm/d for torrential rain, and 100 mm/d for downpour, facilitating the classification of daily precipitation levels.
2.2.3. County-Level Incident Proportion
The complex and ever-changing terrain in China leads to significant differences in the spatial distribution of geomorphological incidents among provinces. To analyze the differential characteristics of county-level incidents within each province, a calculation formula for calculating the proportion of highway incidents at the county level has been developed. The formula is used to compare the proportion of county-level incidents within each province as follows:
where () is the proportion of incidents that occurred in the county (); () is the total number of incidents that occurred in the county (); and () is the total number of incidents that occurred in the province to which the county () belongs.
2.2.4. Probability of Precipitation-Induced Incidents
China is one of the regions with the most significant monsoon climate in the world. The influence of the monsoon leads to an uneven distribution of precipitation in time and space, with precipitation gradually decreasing from the southeast coast to the northwest inland, and the annual precipitation is concentrated in the summer. To reduce the impact of regional and temporal differences on the probability of precipitation induction, a formula for calculating the probability of an incident being induced by different levels of precipitation has been developed. The formula is calculated by comparing the frequency of precipitation at a certain level before an incident event with the frequency of the same level of precipitation within the same month, and its expression is:
where () is the probability of an incident being induced by rainfall level () during precipitation period (); () is the number of occurrences of rainfall level () during precipitation period () for event (); () is the sum of the occurrences of the i-th precipitation level before all events; () is the number of occurrences for the same rainfall level () during the month of event (), with () representing different rainfall levels, () representing different precipitation periods, and () being the incident event number, starting with 1 for the first event and so on.
2.2.5. Antecedent Effective Precipitation
Rainfall is a significant factor in triggering geomorphological incidents. The occurrence of such incidents is not only closely related to the rainfall of the day but also exhibits a certain lag effect. Moreover, as the timing of rainfall shifts earlier, the influence of prior rainfall gradually diminishes. In 1980, Crozier introduced the API (Antecedent Precipitation Index) method in the study of rainfall-induced landslide forecasting [42], suggesting a model for calculating the antecedent effective rainfall associated with landslide events as follows:
where () is the antecedent effective rainfall in millimeters; () is the day of calculation; () is the decay coefficient; () is the daily rainfall amount on day (); and () is the number of days selected. Subsequent research indicates that the most impactful rainfall on the occurrence of incidents typically occurs within 3 days prior to the incident, and rainfall within 10 days also significantly affects the occurrence of incidents [43,44]. In conjunction with national-level operational application experience, antecedent rainfall within the previous 15 days also has a certain influence on the generation of incidents [45,46]. In the present study, () was taken as 15 days, and () as 0.8, to calculate the effective precipitation volume.
3. Feature Analysis of Highway Geomorphological Incident Events
3.1. Spatial Distribution Characteristics
3.1.1. Regional Distribution Features
Between 2019 and 2022, highway incidents in China primarily occurred in the Northwest, Southwest, and South China regions, especially concentrated in the central-southern part of Shaanxi, the mid-western part of Sichuan, the southern part of Chongqing, and the western part of Yunnan. In contrast, there were scattered occurrences of such incidents in Xinjiang, Tibet, and the Northeast regions (Figure 2a).
When examining the proportion of county-level incidents (Figure 2b), noticeable geographical disparities in the distribution of incidents become evident. The majority of provinces in the Northwest, Central China, and North China regions, which are characterized by high-relief features such as the Tianshan, Wushan, and Taihang mountain ranges, exhibit an uneven distribution with a noticeable inclination. Specifically, southern Shaanxi, southern Shanxi, southwestern Hebei, central-western Xinjiang, southwestern Hubei, and northwestern Hunan demonstrate a significantly disproportionate share of incidents within their respective provincial territories, with significant variations in occurrence frequencies. In contrast, provinces in the Southwest, East China, and South China regions, which predominantly feature the Qinghai-Tibet Plateau, southeastern hills, and the Pearl River Delta plains, show a more uniform distribution of incidents. Sichuan, Chongqing, Yunnan, and Fujian, in particular, experience a widespread distribution of incidents within their provincial boundaries, with less pronounced disparities in county-level frequencies. Overall, highway incidents are principally clustered in the southern areas of China’s second and third topographical tiers, regions abundant with plateaus, basins, and hills, where the distribution of incidents exhibits a conspicuous correlation with the natural environment.
Spatial frequency distributions of various types of highway incidents show significant differences (map omitted). Highway collapses and debris flows are primarily concentrated in the southeastern part of the Northwest region and the eastern part of the Qinghai-Tibet Plateau. On the other hand, landslides are predominantly found in the Northwest, Southwest, and South China regions. The southern parts of Sichuan and Shaanxi emerge as hotspots for all types of incidents.
3.1.2. Roads with Frequent Occurrences
Over the past four years, the incidences of geomorphological incidents on expressways, national highways, and provincial roads have accounted for 16.8%, 47.4%, and 35.6%, respectively. National highways have notably surpassed expressways and provincial roads in terms of frequency, accounting for the highest proportion of incidents. There is a noticeable variation in the types of incidents that affect different road levels. Collapses are most commonly observed on national and provincial roads, with national highways experiencing a higher frequency of collapses compared to provincial roads. Landslides and debris flows tend to occur on expressways and national highways.
3.2. Temporal Distribution Characteristics
3.2.1. Annual Variation Features
Over the past four years, highway incidents have demonstrated noticeable inter-annual variability (Figure 3a). The lowest incidence occurred in 2019 with 769 occurrences, followed by a gradual increase in 2020. The peak was reached in 2021, with a total of 1883 occurrences, and there was a notable decrease in 2022. The overall trend in annual precipitation volume aligns with the frequency of incident occurrences, with collapses and landslides following a trend similar to annual precipitation. However, for debris flows, apart from a decrease in 2019, their variation characteristics from 2020 to 2022 are not as distinct.
3.2.2. Monthly Variation Features
Highway geomorphological incidents show pronounced monthly variations (Figure 3b), peaking in June, followed by July to September, and markedly fewer from November to the following March. The general monthly variation trends for each type of incident remain consistent, with some localized differences. Across these trends, it is observed that the months with the highest frequency of landslides, debris flows, and collapses are, respectively, June, August, and September. The average monthly precipitation volume is highly correlated with the frequency of incident occurrences, both following an increasing and then decreasing trend, with the peak period for both being between June and August. The shift in trend for each type of incident is largely in line with the monthly precipitation pattern. The peak months for collapses and debris flows (August to September) exhibit a slight delay compared to the peak month for precipitation (July).
3.2.3. Characteristics of Highway Geomorphological Incident Blockages
In the past four years, the average obstruction distance caused by highway geomorphological incidents has been 9.4 km, with the longest obstruction extending to 714 km. The majority of road blockages are relatively short, with 85.8% of incidents leading to obstructions within a distance of 1 km (Figure 4a). Additionally, 32.4% of these incidents occur exclusively at the incident site without significant road blockage beyond it. Incident frequency decreases swiftly with the lengthening of blocking duration (Figure 4b), with 4411 incident events occurring within 5 days, 50% lasting no more than 0.8 days, and 75% lasting no longer than 3.1 days.
4. Spatiotemporal Characteristics of Precipitation-Induced Conditions
4.1. Probability of Precipitation-Induced Incidents at Various Intensities
The probability of short-duration rainfall events inducing geomorphological incidents on highways within the past six hours has remained consistently low (Table 1). Nevertheless, this probability increases significantly between six and twenty-four hours after the rainfall, with the highest incidence associated with short-duration torrential rain, followed by episodes of torrential rain. Geographical disparities in the classification of incident-inducing short-duration rainfall are pronounced, with East and Central China experiencing the highest risk levels at above 20% for both torrential rain and downpour. Meanwhile, the regions of Northwest and Southwest China are most vulnerable to torrential rain, with North China being susceptible to torrential rain as well. Additionally, South China is prone to downpours. In all of these cases, the probability of these rainfall types inducing incidents on highways exceeds 15%.
With daily rainfall, the incident probability incrementally mounts as the rainfall intensity and duration extend. In regions such as the East, Northwest, Southwest, and North China, the risk of incidents resulting from daily rainfall exhibits a noticeable increase from the previous day up to a span of 3 days. However, there is a noticeable slowdown in this increase beyond the 3-day mark. The probability of incidents precipitated by torrential rain or more severe conditions is particularly pronounced three days preceding the event. During the week leading up to a incident, significant regional variations in the induction probabilities were identified, with rates above 40% for torrential rain in East, Central, and North China and exceeding 75% for downpour. Northwest and Southwest China show less variation, with probabilities mostly ranging between 30% and 40% for moderate rain and above; however, South China has a lower probability for moderate to heavy rain, with a marked increase for torrential rain and above.
In summary, the probability of daily rainfall leading to incidents is higher than that of short-duration rainfall events. Prolonged heavy rainfall carries a greater risk of inducing incidents on highways compared to brief, intense precipitation. These events are most likely to occur within 3 days of torrential rain or within 24 h of a short-term torrential rain episode.
4.2. Hourly Precipitation Characteristics for the Preceding 24 h
In the 24 h before an incident, the average hourly rainfall across all regions typically increases before decreasing, with peak precipitation periods often occurring around twelve hours before the event (Figure 5). The average hourly rainfall in East, Central, and South China is distinctly higher than that in Northwest, North, and Southwest China. In the former regions, the maximum average hourly rainfall can attain heavy rain levels. In contrast, North and Southwest China might encounter moderate rainfall, whereas the Northwest experiences lighter rainfall. In most regions, more than 50% of the total rainfall amounts are concentrated in the twelve hours preceding the occurrence of the incident. Notably, East, Central, and South China exhibit significantly higher rainfall quantities across all percentiles compared to other regions during this critical twelve-hour period.
In the Northwest, East, Southwest, and South China, maximum hourly rainfall within 24 h prior to an incident consistently exceeds 10 mm. In North and Central China, while there is a temporary drop in maximum hourly rainfall to below 10 mm during the 5–8 h immediately preceding the incident, the values are generally higher at other times within this 24 h period. The Southwest and South regions often see maximum hourly rainfall concentrated between 30–70 mm, while other regions typically range from 15 to 40 mm. Further, the Northwest, Southwest, and South China tend to record their maximum hourly rainfall between 24 and 12 h before the incident, whereas in North, East, and Central China, peak values are more frequent from 12 to 8 h prior. Clearly, there exists a distinct time gap between the onset of the incident and the occurrence of extreme, short-duration, intense rainfall. This highlights the critical importance of monitoring such precipitation events within a 24 h timeframe to better predict and mitigate potential incidents.
4.3. Cumulative Precipitation Characteristics for the Preceding 24 h
In various regions, the frequency of incidents within the last 24 h exhibits a declining trend with increasing precipitation amounts, although the intervals of incident-causing precipitation differ (Figure 6). In the Northwest and Southwest, the precipitation intervals that precede incidents are more tightly concentrated, with a higher frequency of incidents occurring at levels below 40 mm. On the other hand, North, East, Central, and South China exhibit broader ranges of critical precipitation intervals. In North China, the predominant range for incidents spans from 10–75 mm; in East China, it falls between 5–50 mm; and in Central and South China, it extends from 5–120 mm. Furthermore, these regions also experience secondary peaks in the frequency of incidents at precipitation levels exceeding 150 mm.
For East and South China, the average cumulative precipitation amounts in the 24 h prior to an incident, as well as the various percentile thresholds, are higher than in other regions. In contrast, the Northwest, North, and Southwest had similar precipitation thresholds prior to the incident (Table 2).
4.4. Daily Precipitation Characteristics for the Preceding 15 Days
The average daily rainfall in each region demonstrates a slow, oscillating growth from the 15th to the 3rd day preceding the incident, followed by a sharp increase, with the maximum rainfall occurring on the day preceding the incident (Figure 7). In South, East, and Central China, the average daily rainfall can surpass 80 mm, significantly exceeding that of other regions. In most areas, over 50% of the rainfall occurs on the day before the incident, with East, Central, and South China experiencing significantly greater rainfall amounts across all percentiles during this critical period.
When examining the maximum daily rainfall, most regions show a fluctuating upward trend, with the greatest values typically occurring around the 7th day and the day preceding the incident. The Southwest and South China can reach over 300 mm, while other areas exceed 200 mm. A noticeable pattern emerges with a substantial increase in maximum rainfall occurring three days before the incident, and this pattern closely correlates with the occurrence of extreme precipitation within a day of an incident.
4.5. Effective Precipitation Characteristics for the Preceding 15 Days
The proportion of effective precipitation frequency over the preceding 15 days reveals distinct regional characteristics (Figure 8). In the Northwest and Southwest, the frequency of incidents decreases rapidly with increasing precipitation, with 80% of incidents concentrated within 75 mm. In North and Central China, the frequency initially increases and then decreases with precipitation. Approximately 70% of incidents are concentrated within a range of 75 mm of precipitation, while incidents induced by effective precipitation exceeding 150 mm account for approximately 5% of the total. In East and South China, the frequency trends are not significantly affected by increased rainfall, with all effective precipitation levels up to 200 mm contributing approximately 5–10% to incident occurrences.
In East and South China, the percentiles and averages of effective precipitation prior to an incident are relatively high, with 50% of the incident-inducing rainfall at or above 120 mm. North and Central China come next, with precipitation levels above 50 mm, while the Northwest and Southwest regions exhibit weaker rainfall levels that can lead to incidents, typically above 40 mm (Table 3).
4.6. Characteristics of the Maximum Continuous Rainfall Days for the Preceding 15 Days
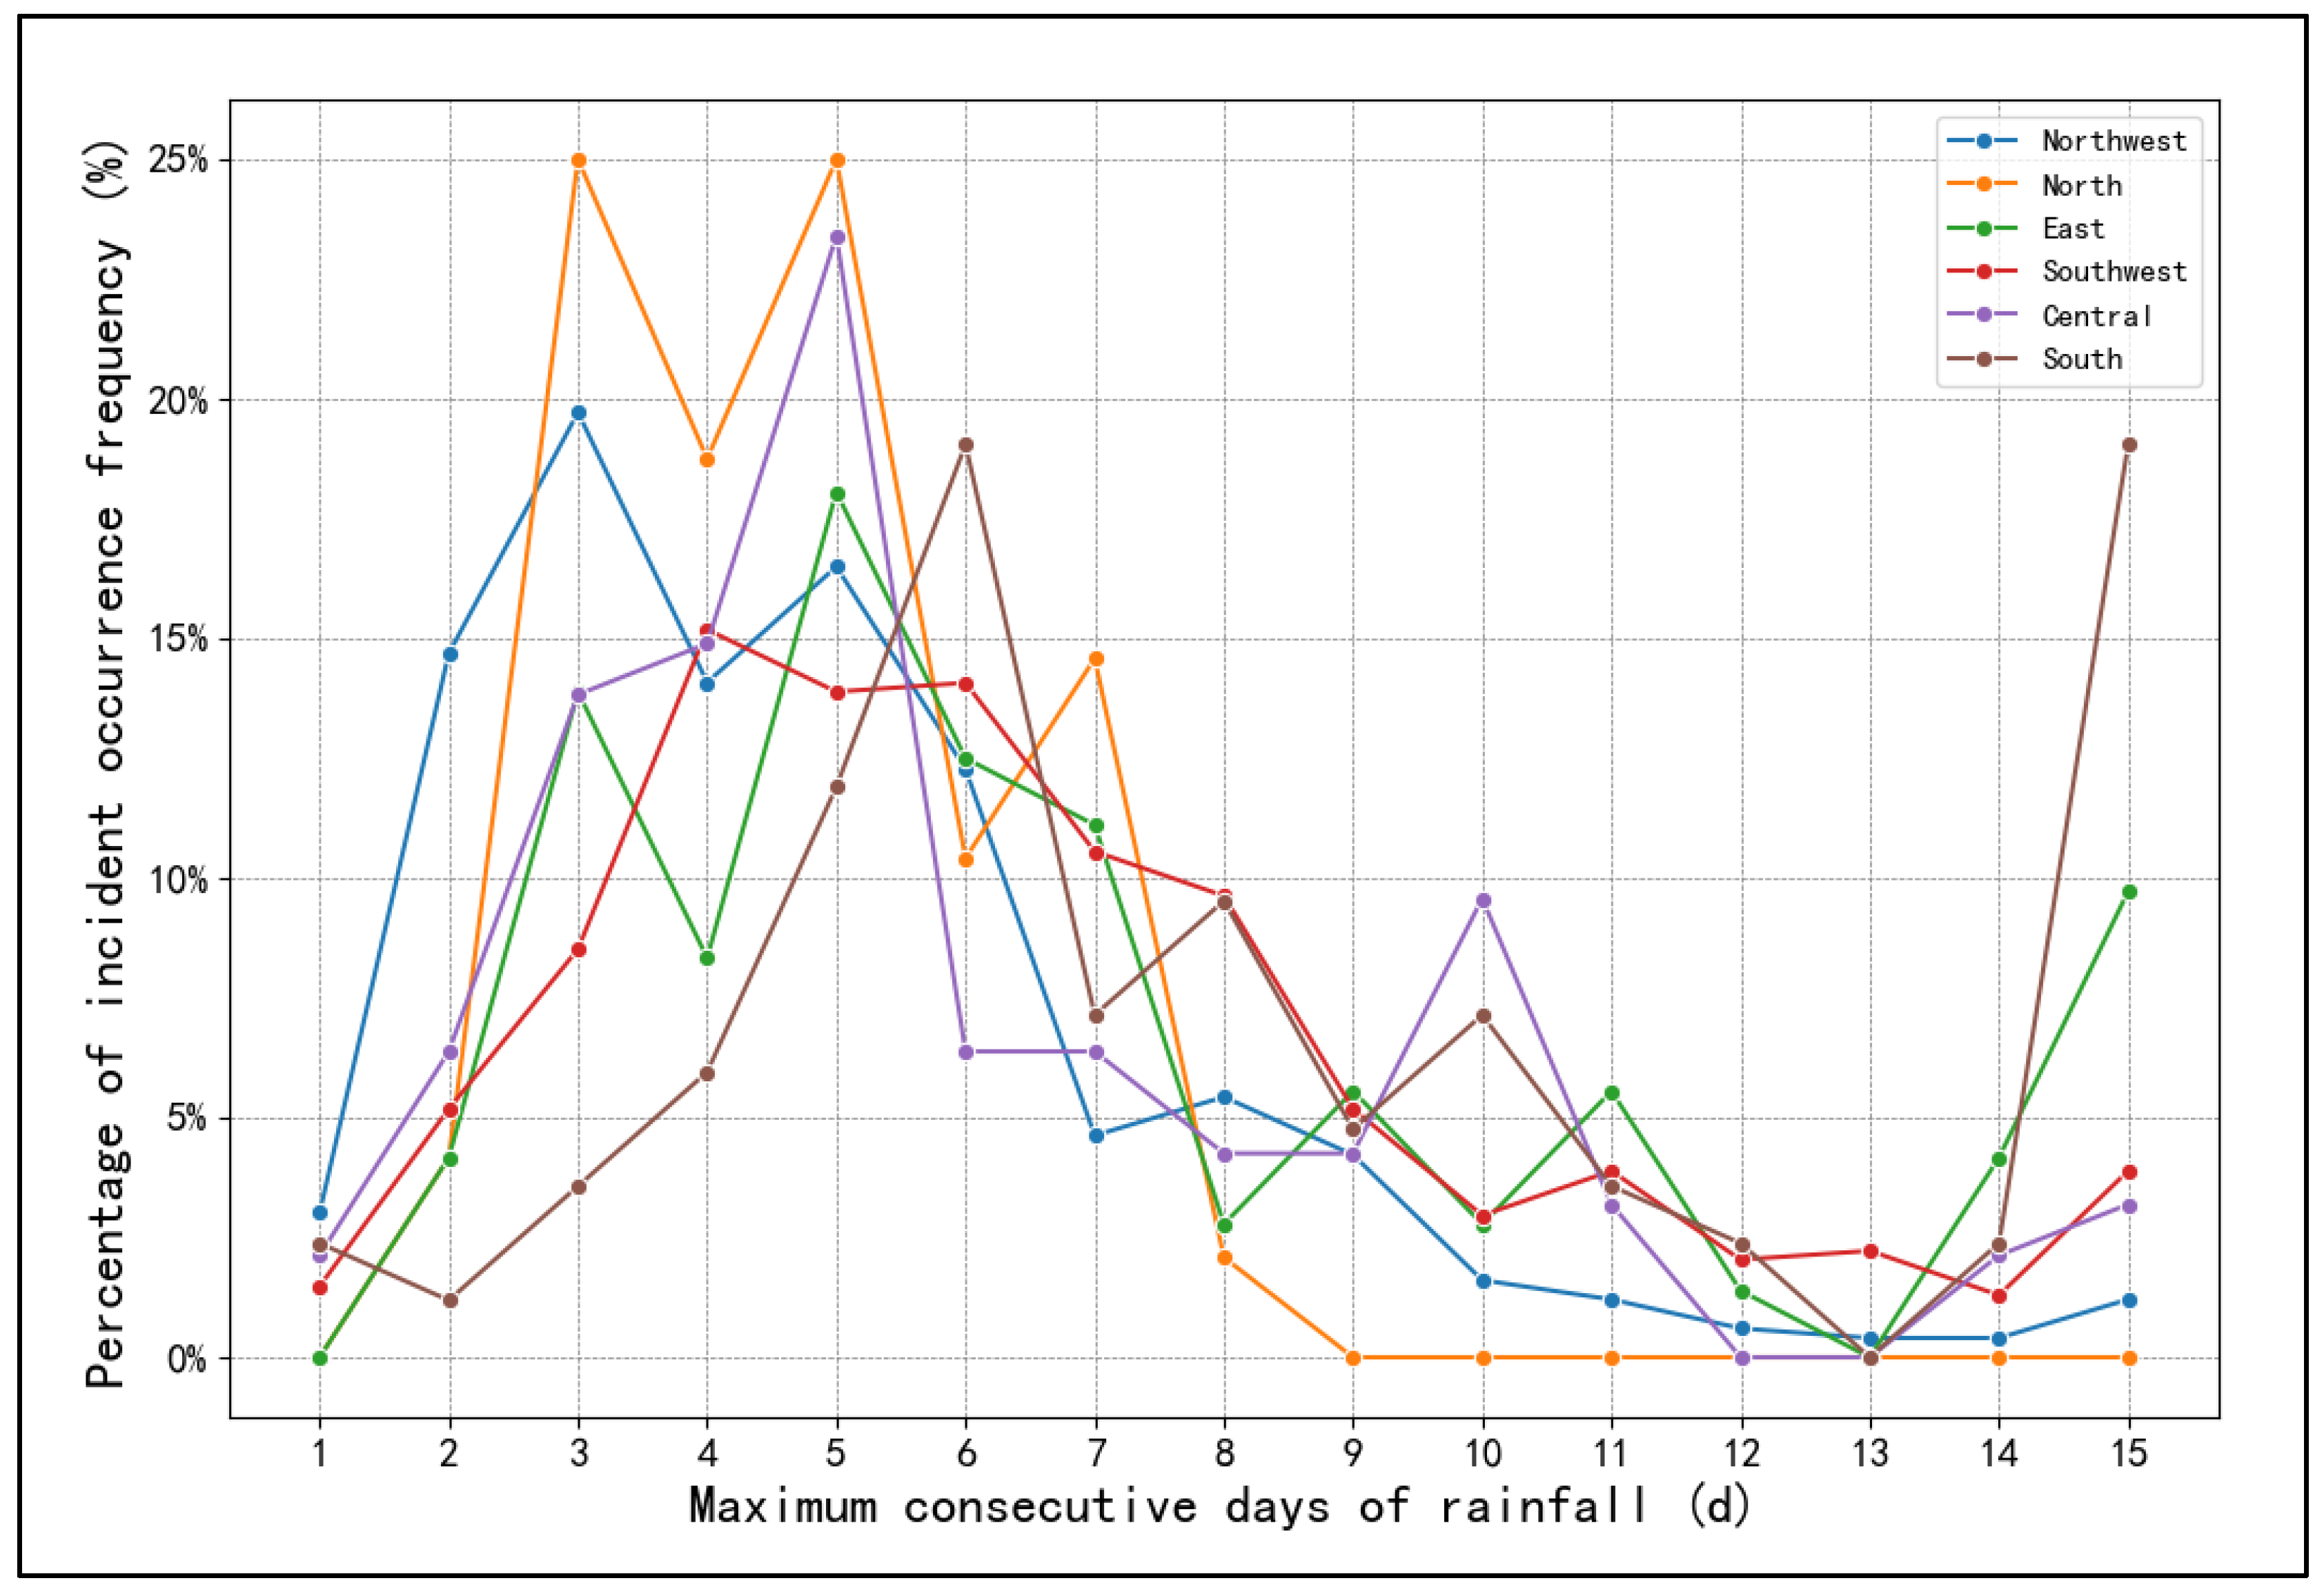
In most regions, there is a unimodal distribution of incident frequency concerning the longest continuous span of rainfall. The highest frequencies are typically concentrated within the range of 3 to 6 days, and the cumulative proportion for four days reaches over 70% (Figure 9). The Northwest region shows a peak at 3 days, the Southwest at 4 days, and North, Central, and East China at 5 days, while South China peaks at both 6 and 15 days.
5. Conclusions and Future Research
5.1. Feature Analysis of Highway Geomorphological Incident Events
In the past four years, geomorphological incidents on highways in China have mainly taken place in the southern regions of the country’s secondary and tertiary topographical tiers. There are notable differences in the distribution of highways at the county level across most provinces. Collapses and landslides have been more frequent than debris flows. There is a high degree of correlation between the annual and monthly variations of highway incidents and precipitation trends. The year with the highest frequency of such incidents was 2021, with a concentration of occurrences primarily between the months of June and September.
Incidents on national roads have occurred with a markedly higher frequency than on expressways and provincial roads, especially in regions such as Sichuan, Shaanxi, and Yunnan. The frequency of incidents decreases as the distance and duration of road blockages increase, with the average blockage being 9.4 km and lasting 12.9 days. Moreover, 85.8% of incidents result in blockages within a one-kilometer radius, and 75% have closure durations of 3.1 days or less.
5.2. Spatiotemporal Characteristics of Precipitation-Induced Conditions
The probability of precipitation-induced incidents is notably higher for daily rainfall compared to short-duration rainfall events. With daily rainfall, the incident probability incrementally mounts as the rainfall intensity and duration extend. During the week leading up to an incident, significant regional variations in the induction probabilities were identified, with rates above 40% for torrential rain in East, Central, and North China. Sustained heavy precipitation is more likely to trigger incidents on highways. In most instances, torrential rain within 3 days or short-duration torrential rain within 24 h is likely to precipitate such incidents.
A noticeable time lag exists between the occurrence of extreme, short-duration, intense rainfall and the initiation of incidents. In the 24 h before an incident, the average hourly rainfall across all regions typically increases before decreasing, and the frequency of incidents exhibits a declining trend with increasing precipitation amounts, with peak precipitation periods often occurring around twelve hours before the event. In most regions, the highest probability of an incident is associated with continuous rainfall spanning three to six days. Moreover, in East and South China, significantly higher precipitation amounts are observed across all categories during these critical periods.
5.3. Limitations and Future Research
The present study has shed light on the spatial-temporal characteristics of highway geomorphological incidents in China, particularly in relation to precipitation-induced conditions. However, it is important to note that the limitations of the study, such as the relatively brief data span and the sample size in certain regions, may have influenced the conclusions. Further, the precipitation data were derived from the nearest single-station records, which may not perfectly align with the actual rainfall at the incident sites. This is consistent with the findings of similar studies conducted by researchers [40,41,47], who also identified the challenge of limited data span and sample size in their analyses.
When comparing our results with previous research, we can observe similarities and differences that provide valuable insights. For instance, the influence of topographical and geomorphological conditions on highway incidents, which was not extensively explored in this study, has been a focal point in the findings of scientists [32,38,48]. This comparison highlights the need for a more comprehensive analysis considering the geographical environment and road conditions, as emphasized in the work of investigators [49,50,51,52,53].
Future research aims to address these limitations by extending the study period and incorporating regional geographical data, providing a more robust foundation for the risk assessment and zoning of highway geomorphological incidents. Building upon previous studies and leveraging a more extensive dataset will further refine our understanding of the complex interplay between precipitation, topography, and geomorphological incidents on highways in China.
Author Contributions
Conceptualization, J.Z. and H.T.; methodology, H.T., J.Z. and J.S.; software, J.Z. and H.T.; validation, J.Z., H.T. and J.S.; formal analysis, J.Z. and J.S.; investigation; resources, H.T.; data curation, J.Z.; writing—original draft preparation, J.S.; writing—review and editing, J.Z.; visualization, J.Z. and H.T.; supervision, J.Z.; project administration, J.Z. and H.T.; funding acquisition, J.Z. and H.T. All authors have read and agreed to the published version of the manuscript.
Funding
This research was funded by the Joint Research Project for Meteorological Capacity Improvement of the China Meteorological Administration (Grant number 23NLTSZ009), the Innovation Fund Project of the Public Meteorological Service Center of the China Meteorological Administration (Grant number M2023011), and the Special Program for Innovation and Development of the Anhui Provincial Meteorological Bureau (Grant number CXM202206).
Institutional Review Board Statement
Not applicable.
Informed Consent Statement
Not applicable.
Data Availability Statement
The used data in this study are obtained from the data platform of China Meteorological Administration and the National Intelligent Road Network Monitoring Platform.
Conflicts of Interest
The authors declare no conflict of interest.
References
- Hong, J.; Chu, Z.; Wang, Q. Transport infrastructure and regional economic growth: Evidence from China. Transportation 2011, 38, 737–752. [Google Scholar] [CrossRef]
- China Ministry of Transport. 2022 Statistical Bulletin on the Development of China’s Transportation Industry. 2023. Available online: https://xxgk.mot.gov.cn/2020/jigou/zhghs/202306/t20230615_3847023.html (accessed on 1 July 2023).
- Yang, C.; Zhang, H.; Li, X.; He, Z.; Li, J. Analysis of spatial and temporal characteristics of major natural incidents in China from 2008 to 2021 based on mining news database. Nat. Hazards 2023, 118, 1881–1916. [Google Scholar] [CrossRef]
- Huang, Y.; Li, L.; Xu, C.; Cheng, J.; Xu, X.; Zheng, T.; Zhang, X. Spatiotemporal distribution patterns of deadly geohazard events in China, 2013–2019. Nat. Hazards Res. 2022, 2, 316–324. [Google Scholar] [CrossRef]
- Wu, L.; Ma, D.; Li, J. Assessment of the Regional Vulnerability to Natural Disasters in China Based on DEA Model. Sustainability 2023, 15, 10936. [Google Scholar] [CrossRef]
- Chen, W.; Zhong, C.; Qin, X.; Wang, L. Geological Disaster: An overview. In Intelligent Interpretation for Geological Disasters; Springer: Singapore, 2023. [Google Scholar] [CrossRef]
- Turner, A.K. Social and environmental impacts of landslides. Innov. Infrastruct. Solut. 2018, 3, 70. [Google Scholar] [CrossRef]
- Lin, C.-Y.; Lai, Y.-C.; Wu, S.-W.; Mo, F.-C.; Lin, C.-Y. Assessment of potential sediment incidents and resilience management of mountain roads using environmental indicators. Nat. Hazards 2022, 111, 1951–1975. [Google Scholar] [CrossRef]
- Amatya, P.; Kirschbaum, D.; Stanley, T. Use of Very High-Resolution Optical Data for Landslide Mapping and Susceptibility Analysis along the Karnali Highway, Nepal. Remote. Sens. 2019, 11, 2284. [Google Scholar] [CrossRef]
- Bi, H.; Nie, L.; Zeng, C.; Fan, C.; Zhou, T.; Liu, X. Geological hazard susceptibility evaluation in Wenchuan area based on three models of multivariate instability index analysis. Chin. J. Geol. Hazard Control. 2022, 33, 123–131. (In Chinese) [Google Scholar] [CrossRef]
- Chen, C.; Sun, F. Flood damage assessments based on entropy weight-grey relational analyses. J. Tsinghua Univ. Sci. Technol. 2022, 62, 1067–1073. (In Chinese) [Google Scholar] [CrossRef]
- Guo, J.; Huang, H.; Li, G. Basic characteristics and meteorological risk assessment of highway geological hazard in Sichuan province. Plateau Mt. Meteorol. Res. 2017, 37, 82–86. [Google Scholar] [CrossRef]
- Kim, H.-S.; Chung, C.-K.; Kim, S.-R.; Kim, K.-S. A GIS-Based framework for real-time debris-flow hazard assessment for expressways in Korea. Int. J. Disaster Risk Sci. 2016, 7, 293–311. [Google Scholar] [CrossRef]
- Yang, H.; Zhao, Y.; Cheng, Q. Geohazards regionalization along highways in Shandong province, China. Geomat. Nat. Hazards Risk 2020, 11, 1760–1781. [Google Scholar] [CrossRef]
- Yang, H.-Z.; Dong, J.-Y.; Guo, X.-L. Geohazards and risk assessment along highway in Sichuan Province, China. J. Mt. Sci. 2023, 20, 1695–1711. [Google Scholar] [CrossRef]
- Silveira, L.R.C.; Lana, M.S.; dos Santos, T.B. A Quantitative Rockfall Risk Analysis System for Highway Rock Slopes. Geotech. Geol. Eng. 2023, 42, 1131–1152. [Google Scholar] [CrossRef]
- Ansari, M.K.; Ahmad, M.; Singh, R.; Singh, T.N. Rockfall hazard rating system along SH-72: A case study of Poladpur-Mahabaleshwar road (Western India), Maharashtra, India. Geomat. Nat. Hazards Risk 2015, 7, 649–666. [Google Scholar] [CrossRef]
- Budetta, P.; De Luca, C.; Nappi, M. Quantitative rockfall risk assessment for an important road by means of the rockfall risk management (RO.MA.) method. Bull. Eng. Geol. Environ. 2015, 75, 1377–1397. [Google Scholar] [CrossRef]
- Zhang, Y.; Huang, C.; Li, M. Spatio-temporal evolution characteristics of typical debris flow sources after an earthquake. Landslides 2022, 19, 2263–2275. [Google Scholar] [CrossRef]
- Li, Y.; Zou, Q.; Hao, J.; Su, L. Risk Assessment of Debris Flows Along the Karakoram Highway (Kashgar-Khunjerab Section) in the Context of Climate Change. Int. J. Disaster Risk Sci. 2023, 14, 586–599. [Google Scholar] [CrossRef]
- Ali, S.; Haider, R.; Abbas, W.; Basharat, M.; Reicherter, K. Empirical assessment of rockfall and debris flow risk along the Karakoram Highway, Pakistan. Nat. Hazards 2021, 106, 2437–2460. [Google Scholar] [CrossRef]
- Zhang, Y.; Ayyub, B.M.; Gong, W.; Tang, H. Risk assessment of roadway networks exposed to landslides in mountainous regions—A case study in Fengjie County, China. Landslides 2023, 20, 1419–1431. [Google Scholar] [CrossRef]
- Jaiswal, P.; van Westen, C.J.; Jetten, V. Quantitative assessment of direct and indirect landslide risk along transportation lines in southern India. Nat. Hazards Earth Syst. Sci. 2010, 10, 1253–1267. [Google Scholar] [CrossRef]
- Zhou, M.; Yuan, M.; Yang, G.; Mei, G. Risk analysis of road networks under the influence of landslides by considering landslide susceptibility and road vulnerability: A case study. Nat. Hazards Res. 2023, 9, 1–35. [Google Scholar] [CrossRef]
- Shao, L. Geomorphological incident prevention and control and resource protection in mineral resource exploitation region. Int. J. Low-Carbon Technol. 2019, 14, 142–146. [Google Scholar] [CrossRef]
- Yu, P.; Dong, J.; Hao, H.; Xie, Y.; Zhang, H.; Wang, J.; Zhu, C.; Guan, Y.; Yu, H. Risk Assessment and Prevention Planning for Collapse Geological Hazards Considering Extreme Rainfall—A Case Study of Laoshan District in Eastern China. Land 2023, 12, 1558. [Google Scholar] [CrossRef]
- Jia, L.; Yang, S.; Wang, W.; Zhang, X. Impact analysis of highways in China under future extreme precipitation. Nat. Hazards 2021, 110, 1097–1113. [Google Scholar] [CrossRef]
- Liu, K.; Wang, M.; Cao, Y.; Zhu, W.; Wu, J.; Yan, X. A Comprehensive Risk Analysis of Transportation Networks Affected by Rainfall-Induced Multihazards. Risk Anal. 2018, 38, 1618–1633. [Google Scholar] [CrossRef] [PubMed]
- Pregnolato, M.; Alistair, F.; Richard, D. Analysis of the risk of transport infrastructure disruption from extreme rainfall. In Proceedings of the 12th International Conference on Applications of Statistics and Probability in Civil Engineering, Vancouver, BC, Canada, 12–15 July 2015. [Google Scholar] [CrossRef]
- Yang, S.; Ye, J.; Zhang, X.; Liu, H. Study of the impact of rainfall on freeway traffic flow in Southeast China. Int. J. Crit. Infrastruct. 2012, 8, 230–241. [Google Scholar] [CrossRef]
- Yang, S.; Yin, G.; Shi, X.; Liu, H.; Zou, Y. Modeling the adverse impact of rainstorms on a regional transport network. Int. J. Disaster Risk Sci. 2016, 7, 77–87. [Google Scholar] [CrossRef]
- Zhang, S.; Wang, Y.; Jia, B.; Shangming, Z. Spatial-temporal changes and influencing factors of geologic incidents from 2005 to 2016 in China. J. Geo. Inf. Sci. 2017, 19, 1567–1574. [Google Scholar] [CrossRef]
- Bi, X.; Fan, Q.; He, L.; Zhang, C.; Diao, Y.; Han, Y. Analysis and Evaluation of Extreme Rainfall Trends and Geological Hazards Risk in the Lower Jinshajiang River. Appl. Sci. 2023, 13, 4021. [Google Scholar] [CrossRef]
- Shen, D.; Guo, J.; Chen, J. Risk assessment of geological hazards in Dingxi region of Gansu Province. Chin. J. Geol. Hazard Control. 2021, 32, 134–142. [Google Scholar] [CrossRef]
- Kirschbaum, D.; Adler, R.; Adler, D.; Peters-Lidard, C.; Huffman, G. Global Distribution of Extreme Precipitation and High-Impact Landslides in 2010 Relative to Previous Years. J. Hydrometeorol. 2012, 13, 1536–1551. [Google Scholar] [CrossRef]
- Kirschbaum, D.; Kapnick, S.B.; Stanley, T.; Pascale, S. Changes in Extreme Precipitation and Landslides Over High Mountain Asia. Geophys. Res. Lett. 2019, 47, 4. [Google Scholar] [CrossRef]
- Lausier, A.M.; Jain, S. Overlooked Trends in Observed Global Annual Precipitation Reveal Underestimated Risks. Sci. Rep. 2018, 8, 16746. [Google Scholar] [CrossRef] [PubMed]
- Chang, S.-K.; Lee, D.-H.; Wu, J.-H.; Juang, C.H. Rainfall-based criteria for assessing slump rate of mountainous highway slopes: A case study of slopes along Highway 18 in Alishan, Taiwan. Eng. Geol. 2011, 118, 63–74. [Google Scholar] [CrossRef]
- Wang, Z.; Tian, H.; Di, J.; Xu, F. Research on the tempo-spatial characteristics of road damage induced by precipitation. J. Meteorol. Environ. 2018, 34, 98–104. (In Chinese) [Google Scholar]
- Tian, H.; Wang, Z.; Dai, Z.; Li, W. Research on Relationship Between Highway Traffic Blocking Induced by Waterlogging and Precipitation. Meteorol. Mon. 2018, 44, 684–691. (In Chinese) [Google Scholar]
- Crozier, M.J.; Eyles, R.J. Assessing the probability of rapid mass movement. In Proceedings of the 3rd Australia–New Zealand Conference on Geomechanics, Wellington, New Zealand, 12–16 May 1980; Institution of Professional Engineers New Zealand: Wellington, New Zealand, 1980; pp. 247–253. [Google Scholar]
- Gong, Q.; Huang, G.; Guo, M. Present status of research and its developmental tendency on prediction and early warning of geologic hazards. World Ceology 2006, 25, 296–302. [Google Scholar]
- Jiang, Z.; Jiang, C.; Wang, J.; Zhang, X.; Huang, Y.; Huang, T.; Ying, L. Analysis of geological hazard and its relationship with precipitation in northern Fujian. World Geol. 2009, 28, 127–133. (In Chinese) [Google Scholar]
- Zhang, G. Study on the Relation between Effective Precipitation and Landslide/Debris Flow with Probabilistic Model. Meteorol. Mon. 2014, 40, 886–890. (In Chinese) [Google Scholar]
- Di, J.; Wang, Z.; Tian, H.; Kai, X.; Xiaodan, Y.; Hui, C.; Fengwen, X. A Risk Forecast Method for Southwest Road Damages Based on Precipitation. Q. J. Appl. Meteorol. 2015, 26, 268–279. (In Chinese) [Google Scholar]
- Liu, Y.; Tang, C.; Li, T.; Wen, M.; Lian, J. Statistical relations between geo-hazards and rain-type. J. Eng. Geol. 2009, 17, 656–661. (In Chinese) [Google Scholar]
- Lepore, C.; Kamal, S.A.; Shanahan, P.; Bras, R.L. Rainfall-induced landslide susceptibility zonation of Puerto Rico. Environ. Earth Sci. 2011, 66, 1667–1681. [Google Scholar] [CrossRef]
- Adam, B.; Emily, B.; Elizabeth, S. Effectiveness of indicators for assessing the vulnerability of barrier island highways. Transp. Res. Part D Transp. Environ. 2022, 105, 103234. [Google Scholar] [CrossRef]
- de Carvalho, J.C.; de Rezende, L.R.; Cardoso, F.B.d.F.; Lucena, L.C.d.F.; Guimarães, R.C.; Valencia, Y.G. Tropical soils for highway construction: Peculiarities and considerations. Transp. Geotech. 2015, 5, 3–19. [Google Scholar] [CrossRef]
- Nepal, N.; Chen, J.; Chen, H.; Wang, X.; Sharma, T.P.P. Assessment of landslide susceptibility along the Araniko Highway in Poiqu/Bhote Koshi/Sun Koshi Watershed, Nepal Himalaya. Prog. Disaster Sci. 2019, 3, 100037. [Google Scholar] [CrossRef]
- Giovanni, B.; Nicola, S. Geomorphological study of the Fadalto landslide, Venetian Prealps, Italy. Geomorphology 1996, 15, 337–350. [Google Scholar] [CrossRef]
- TCMSA0013-2019; The Grade of Rainfall in Short Time Weather Service. Group standard of China Meteorological Service Association: Beijing, China, 2019.
- GB/T28592-2012; Grade of Precipitation. National Standard of the People’s Republic of China: Beijing, China, 2012.
Figure 1.
Schematic map of the study area in China.
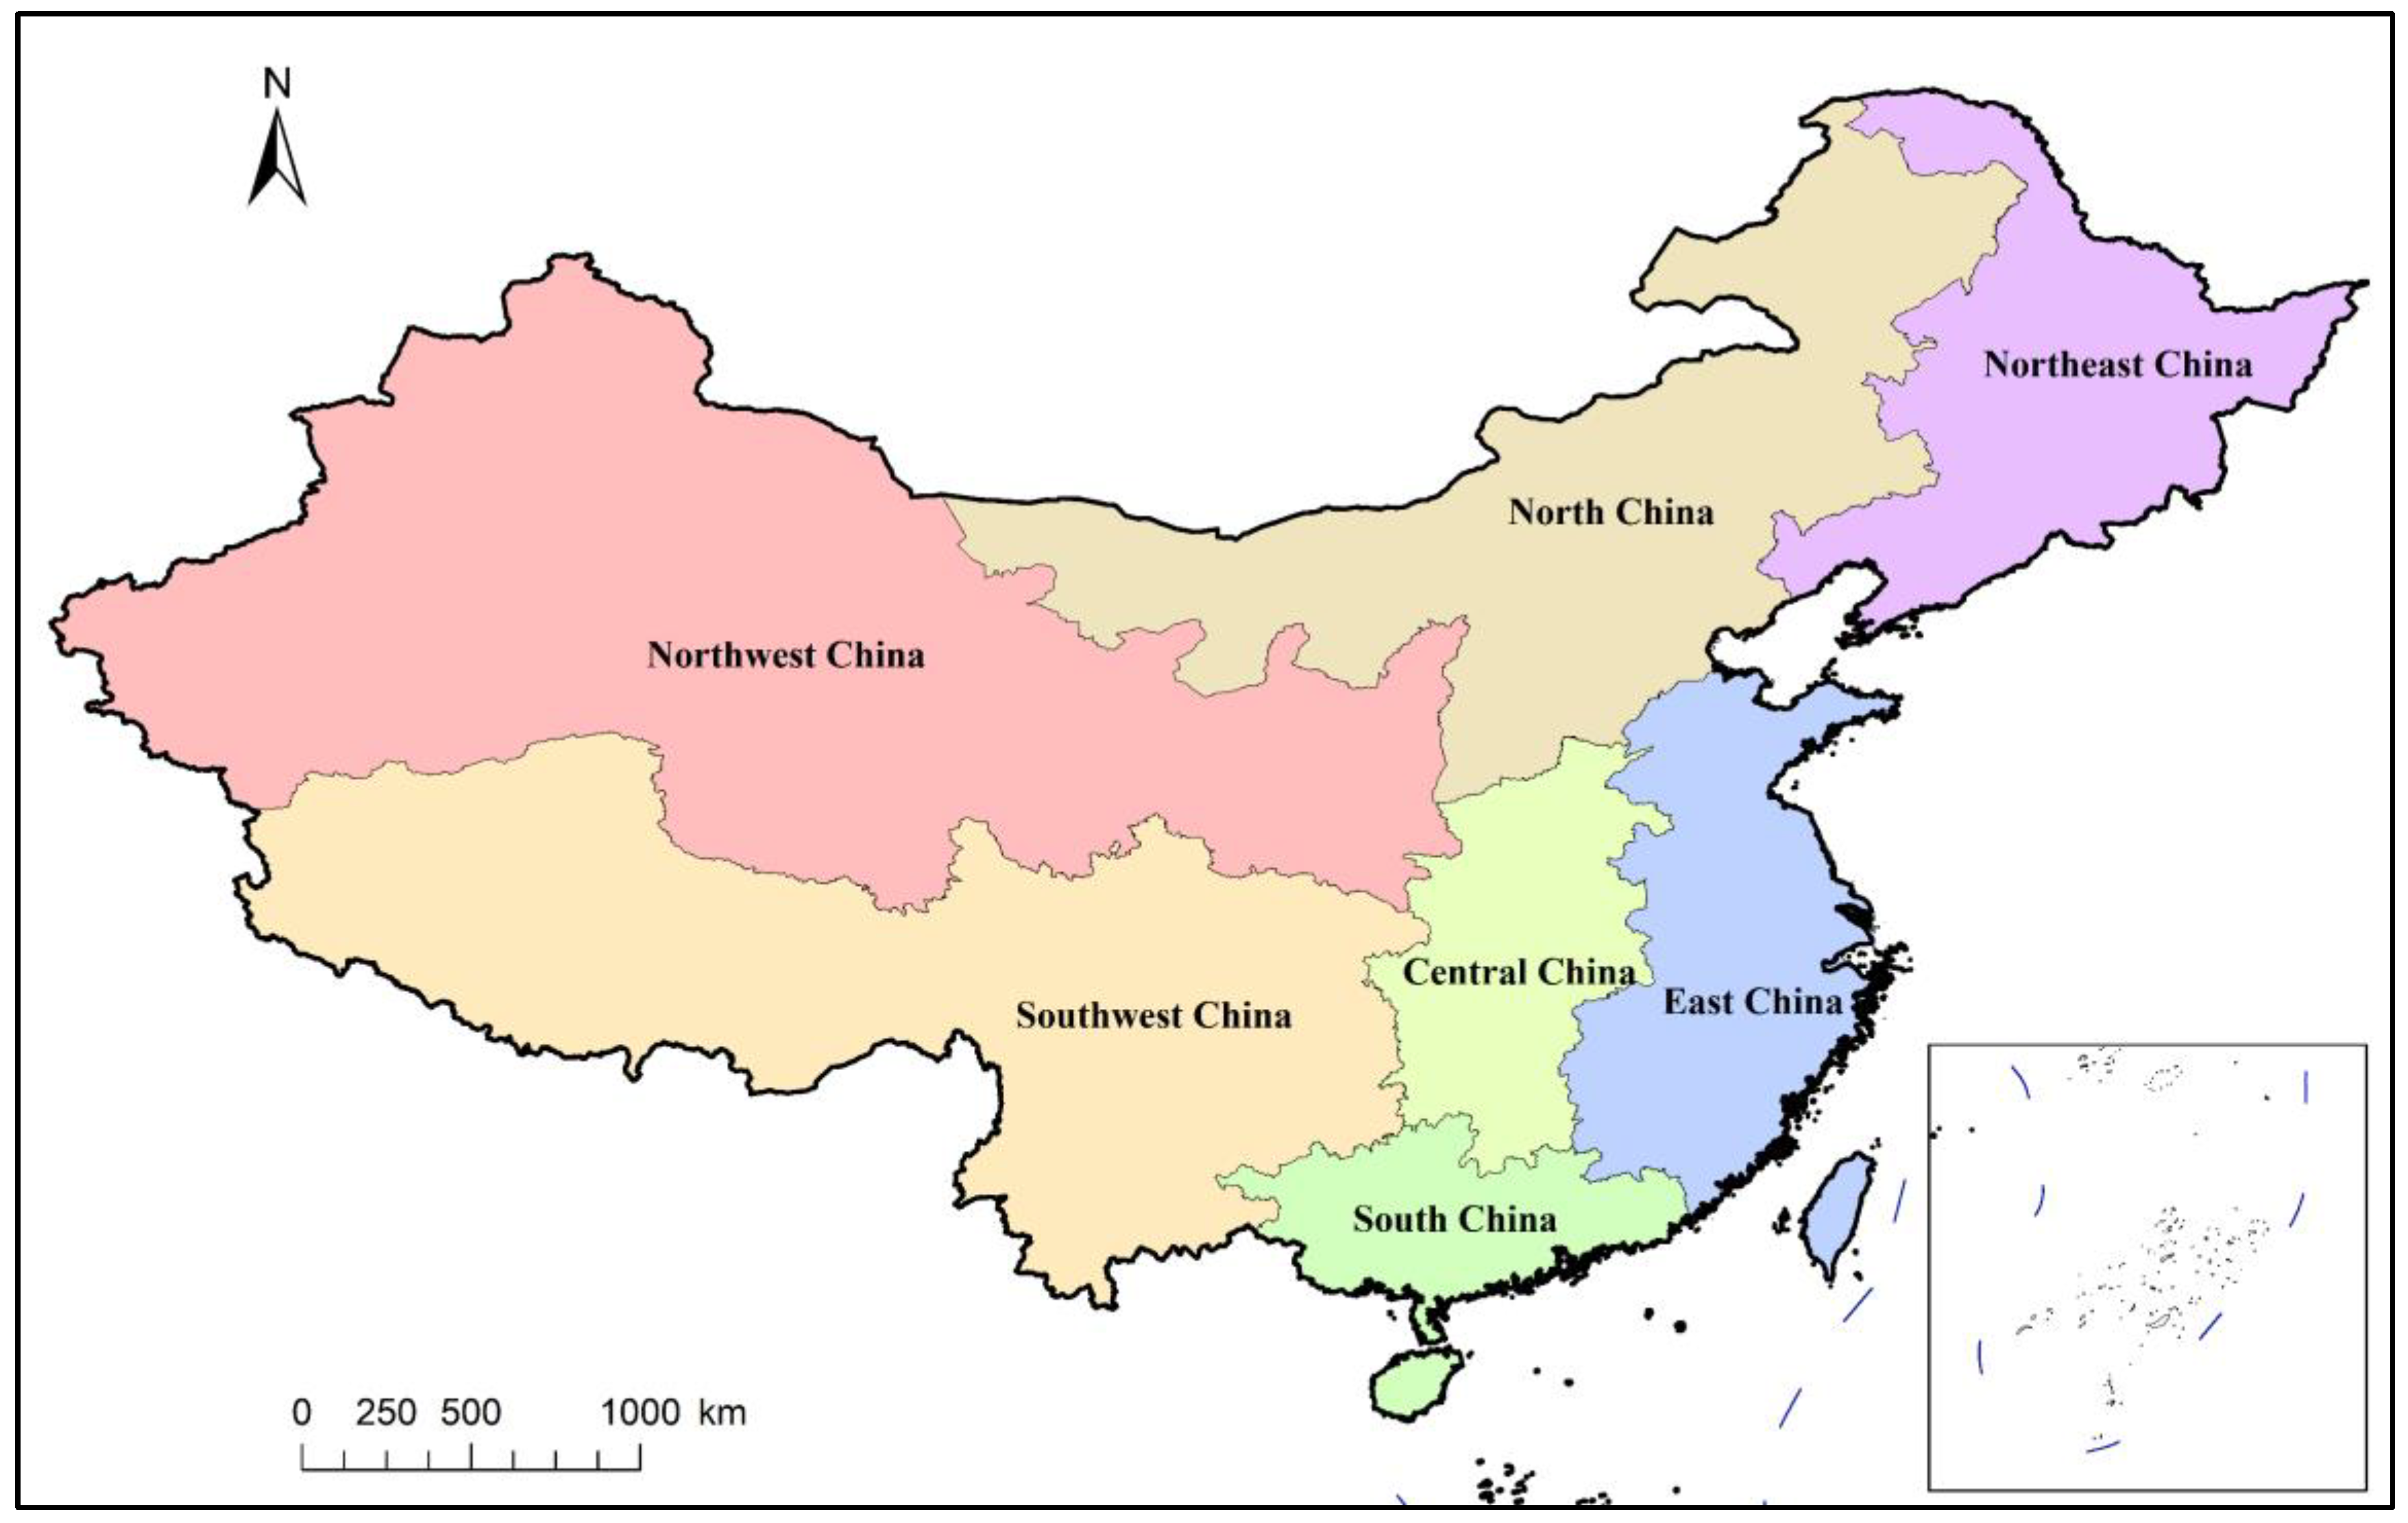
Figure 2.
Spatial distribution of highway geomorphological incidents in counties of China from 2019 to 2022: (a) Occurrence frequency; (b) Proportion of incidents.
Figure 2.
Spatial distribution of highway geomorphological incidents in counties of China from 2019 to 2022: (a) Occurrence frequency; (b) Proportion of incidents.
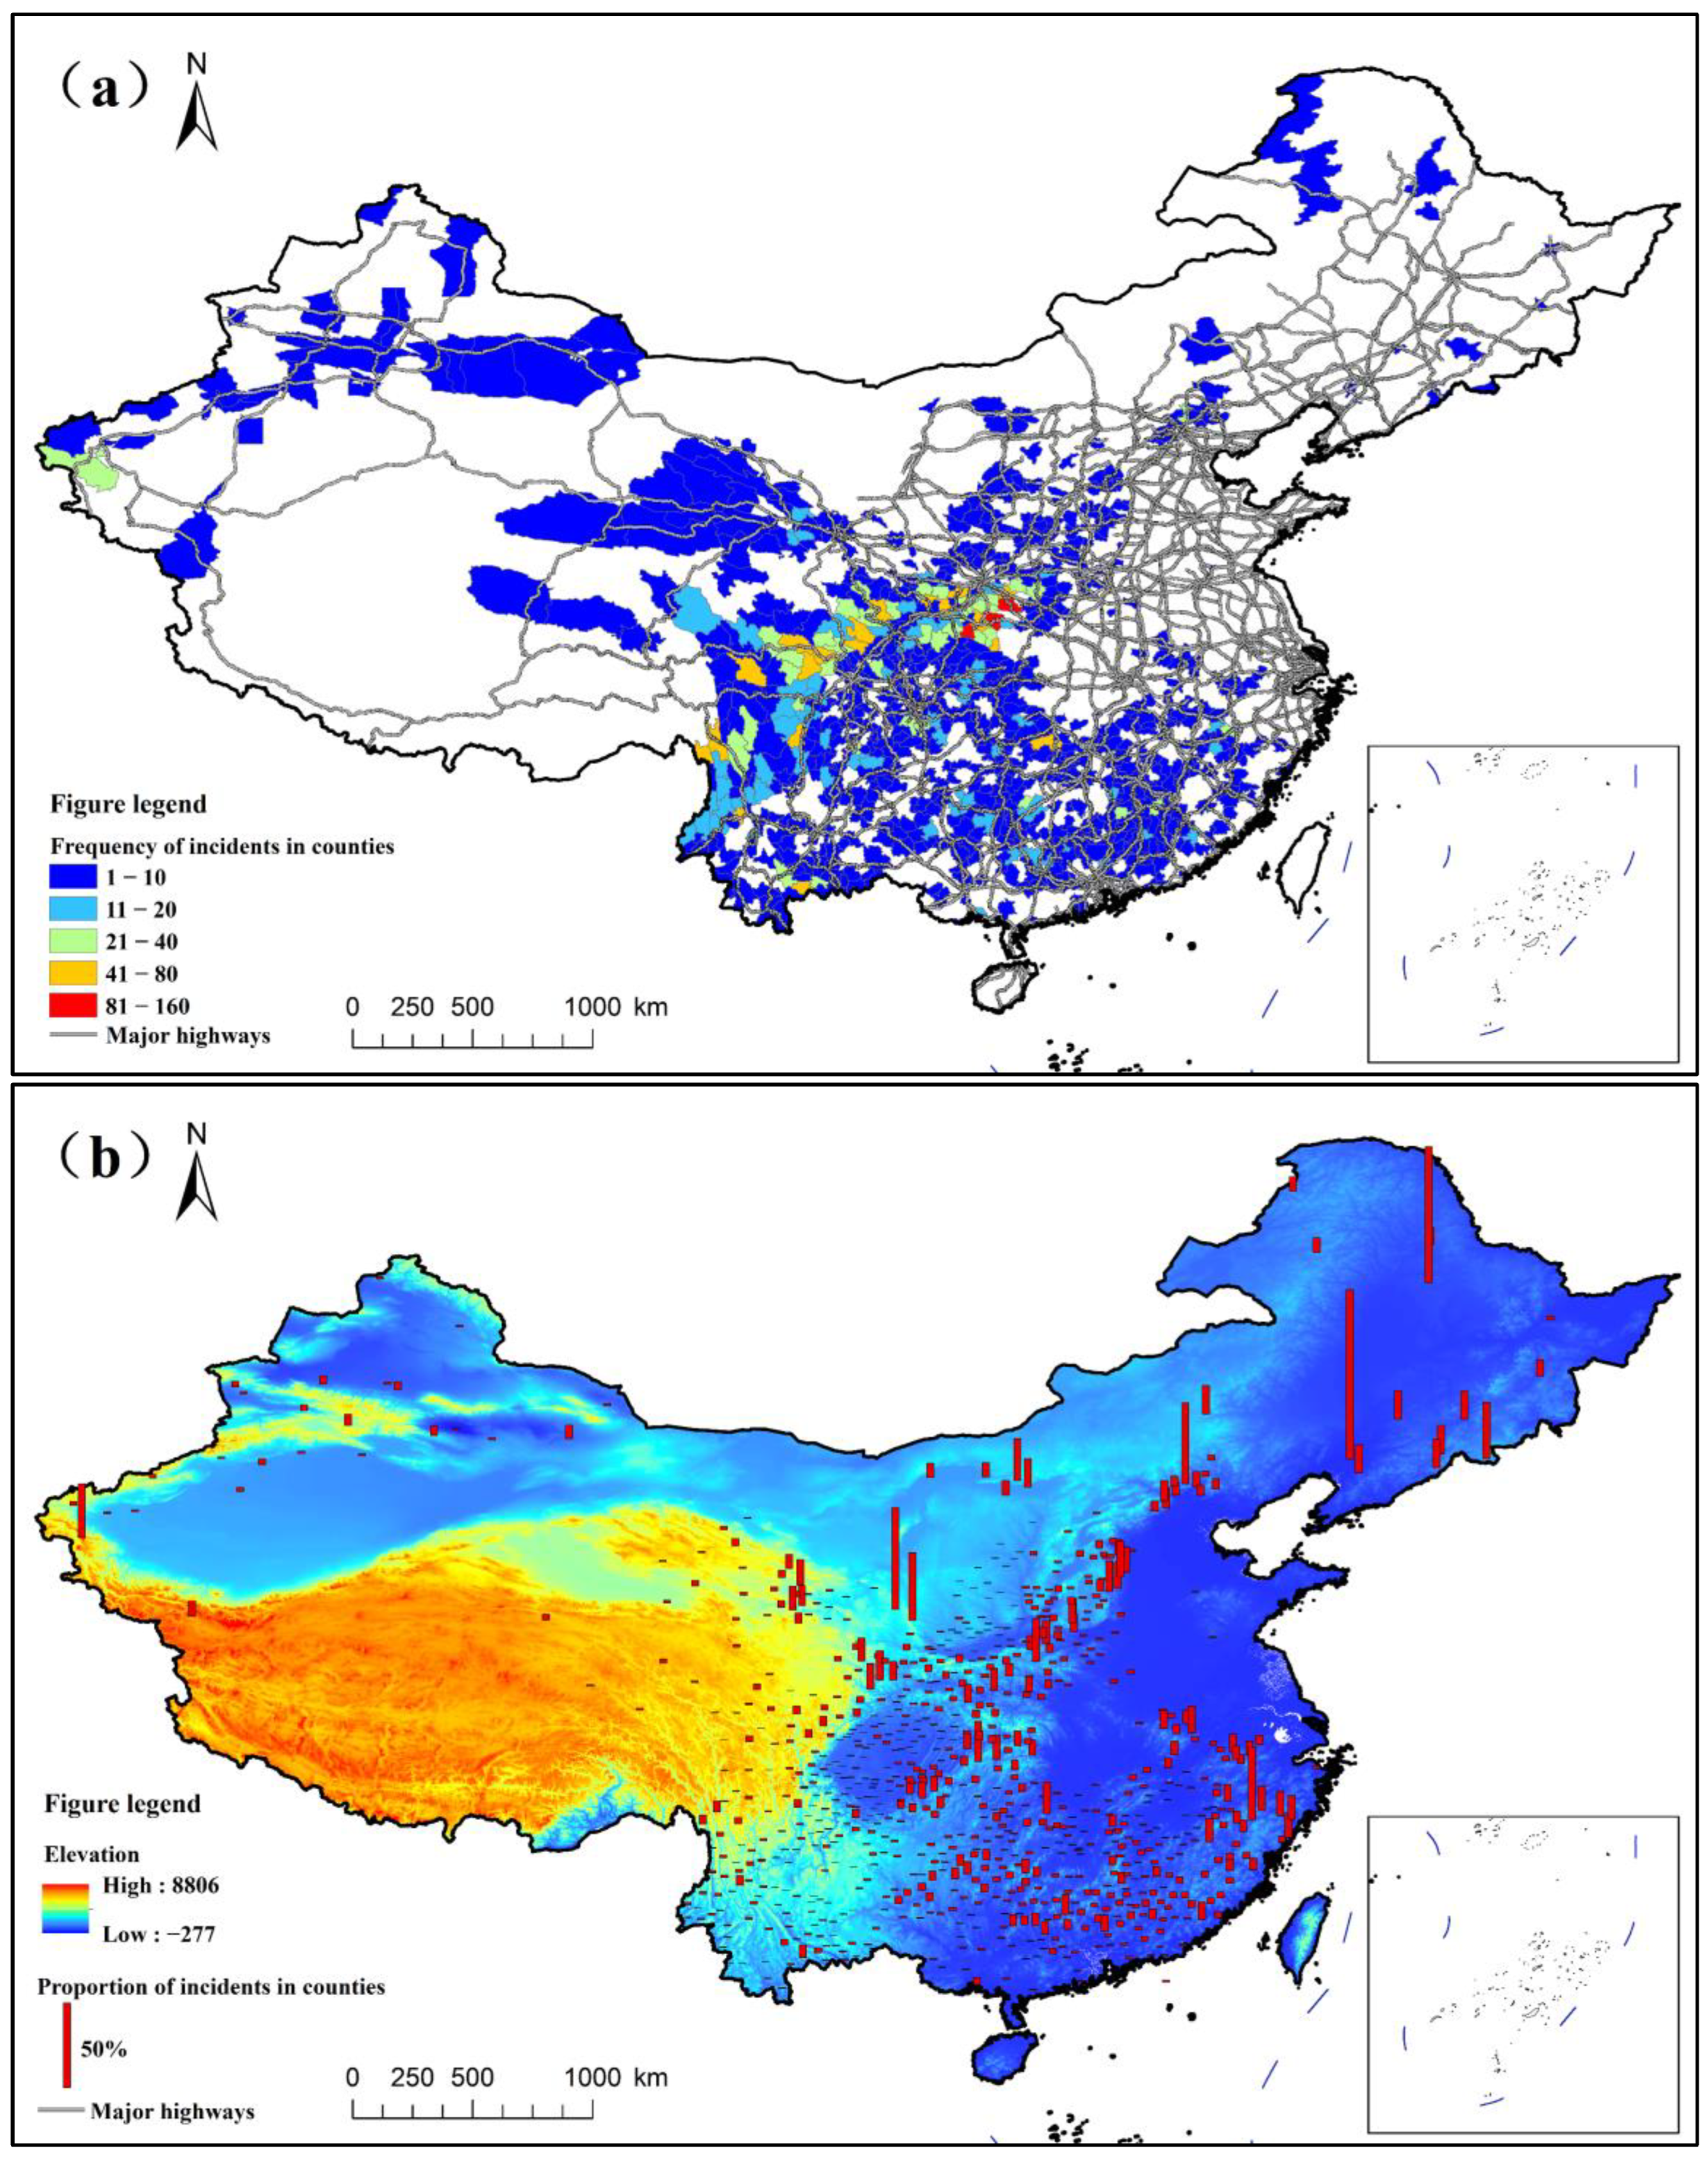
Figure 3.
Occurrence frequency of highway geomorphological incidents in China from 2019 to 2022 versus rainfall: (a) Yearly totals; (b) Monthly totals.
Figure 3.
Occurrence frequency of highway geomorphological incidents in China from 2019 to 2022 versus rainfall: (a) Yearly totals; (b) Monthly totals.

Figure 4.
Distribution of the proportion of highway geomorphological incidents in China from 2019 to 2022: (a) Blocking distance (0 km represents the frequency of incidents causing road blockage only at the incident point, (0, 1] km represents the frequency of incidents within the range of >0 km and ≤1 km); (b) Blocking duration ([0, 0.5] represents a blockade duration of ≤12 h, (0.5, 1] represents a blockade duration of >12 h and ≤24 h, (1, 5] represents a blockade duration of >1 day and ≤5 days).
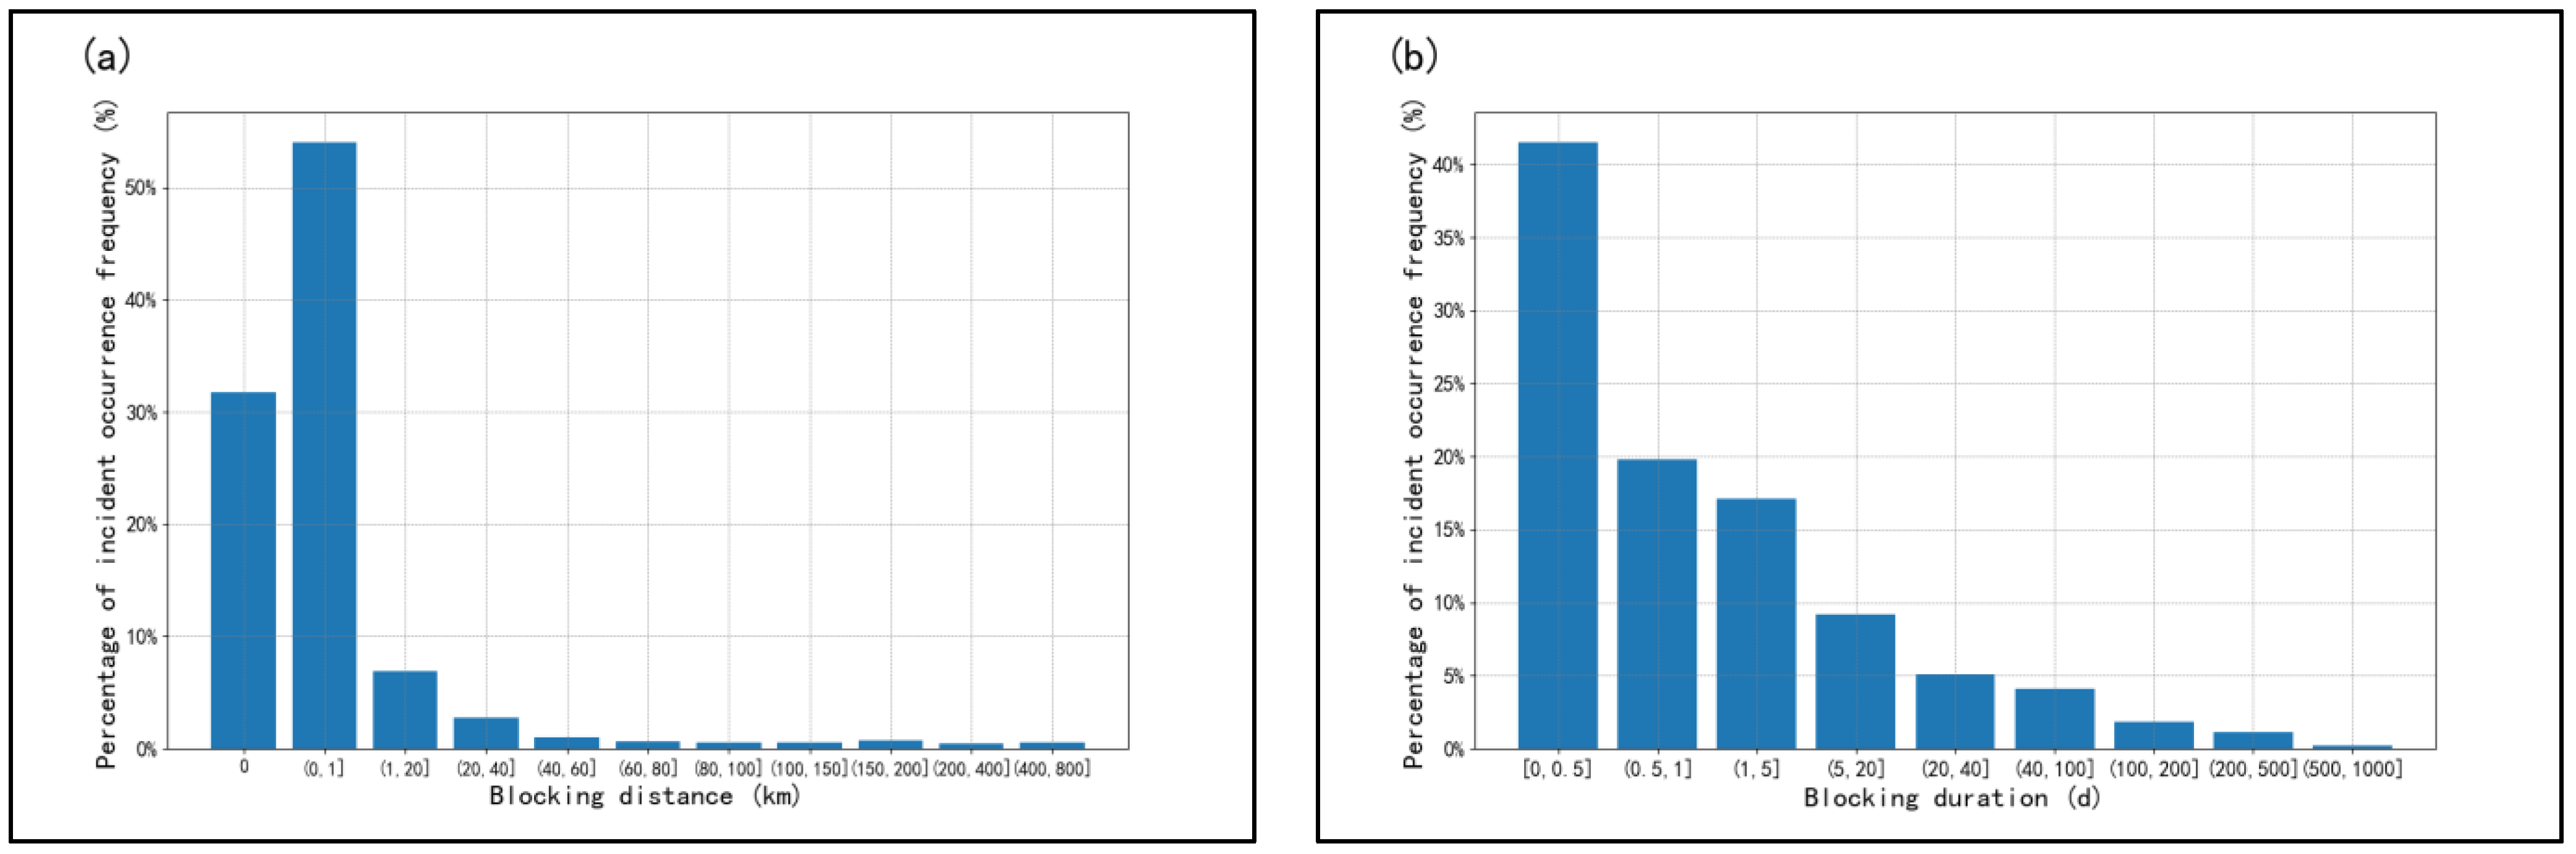
Figure 5.
Hourly precipitation variation chart for the 24 h preceding a geomorphological incident (average hourly rainfall, 50%, 75%, and 90% percentile lines corresponding to the left vertical axis labels; maximum hourly rainfall corresponding to the right vertical axis labels).
Figure 5.
Hourly precipitation variation chart for the 24 h preceding a geomorphological incident (average hourly rainfall, 50%, 75%, and 90% percentile lines corresponding to the left vertical axis labels; maximum hourly rainfall corresponding to the right vertical axis labels).
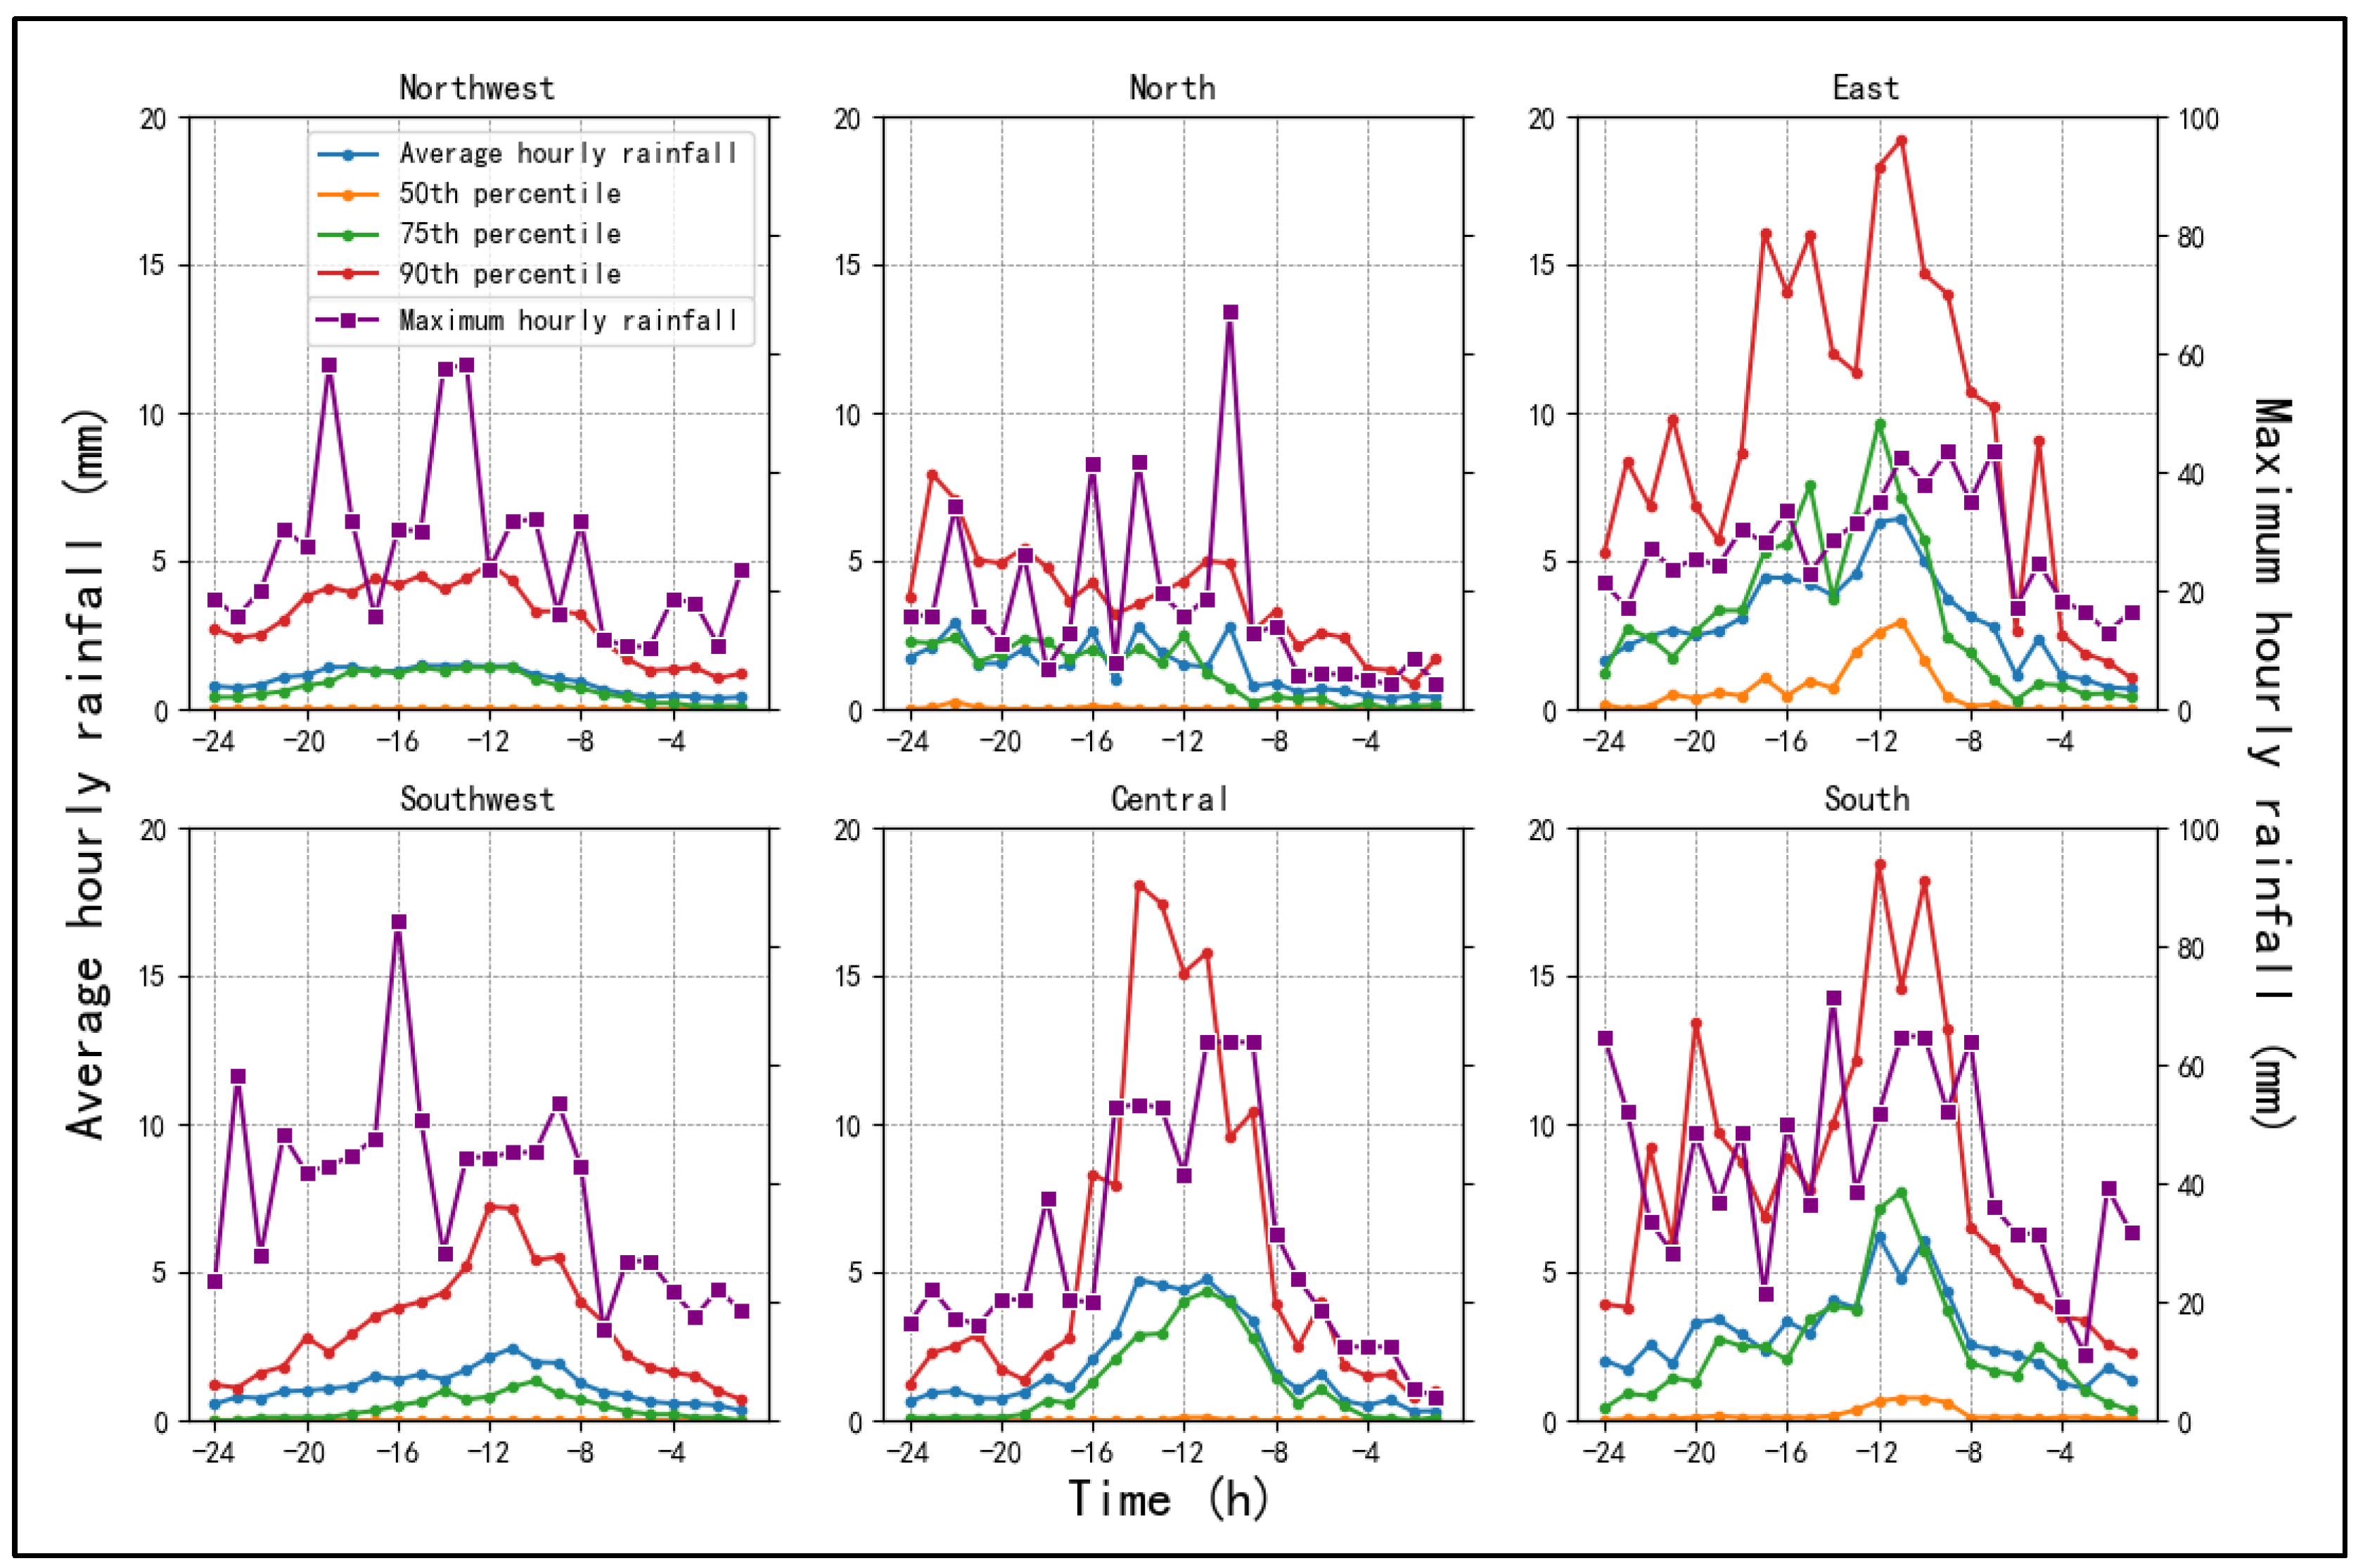
Figure 6.
Frequency chart of geomorphological incidents on Highways Induced by the Accumulative Precipitation for the Preceding 24 h.
Figure 6.
Frequency chart of geomorphological incidents on Highways Induced by the Accumulative Precipitation for the Preceding 24 h.
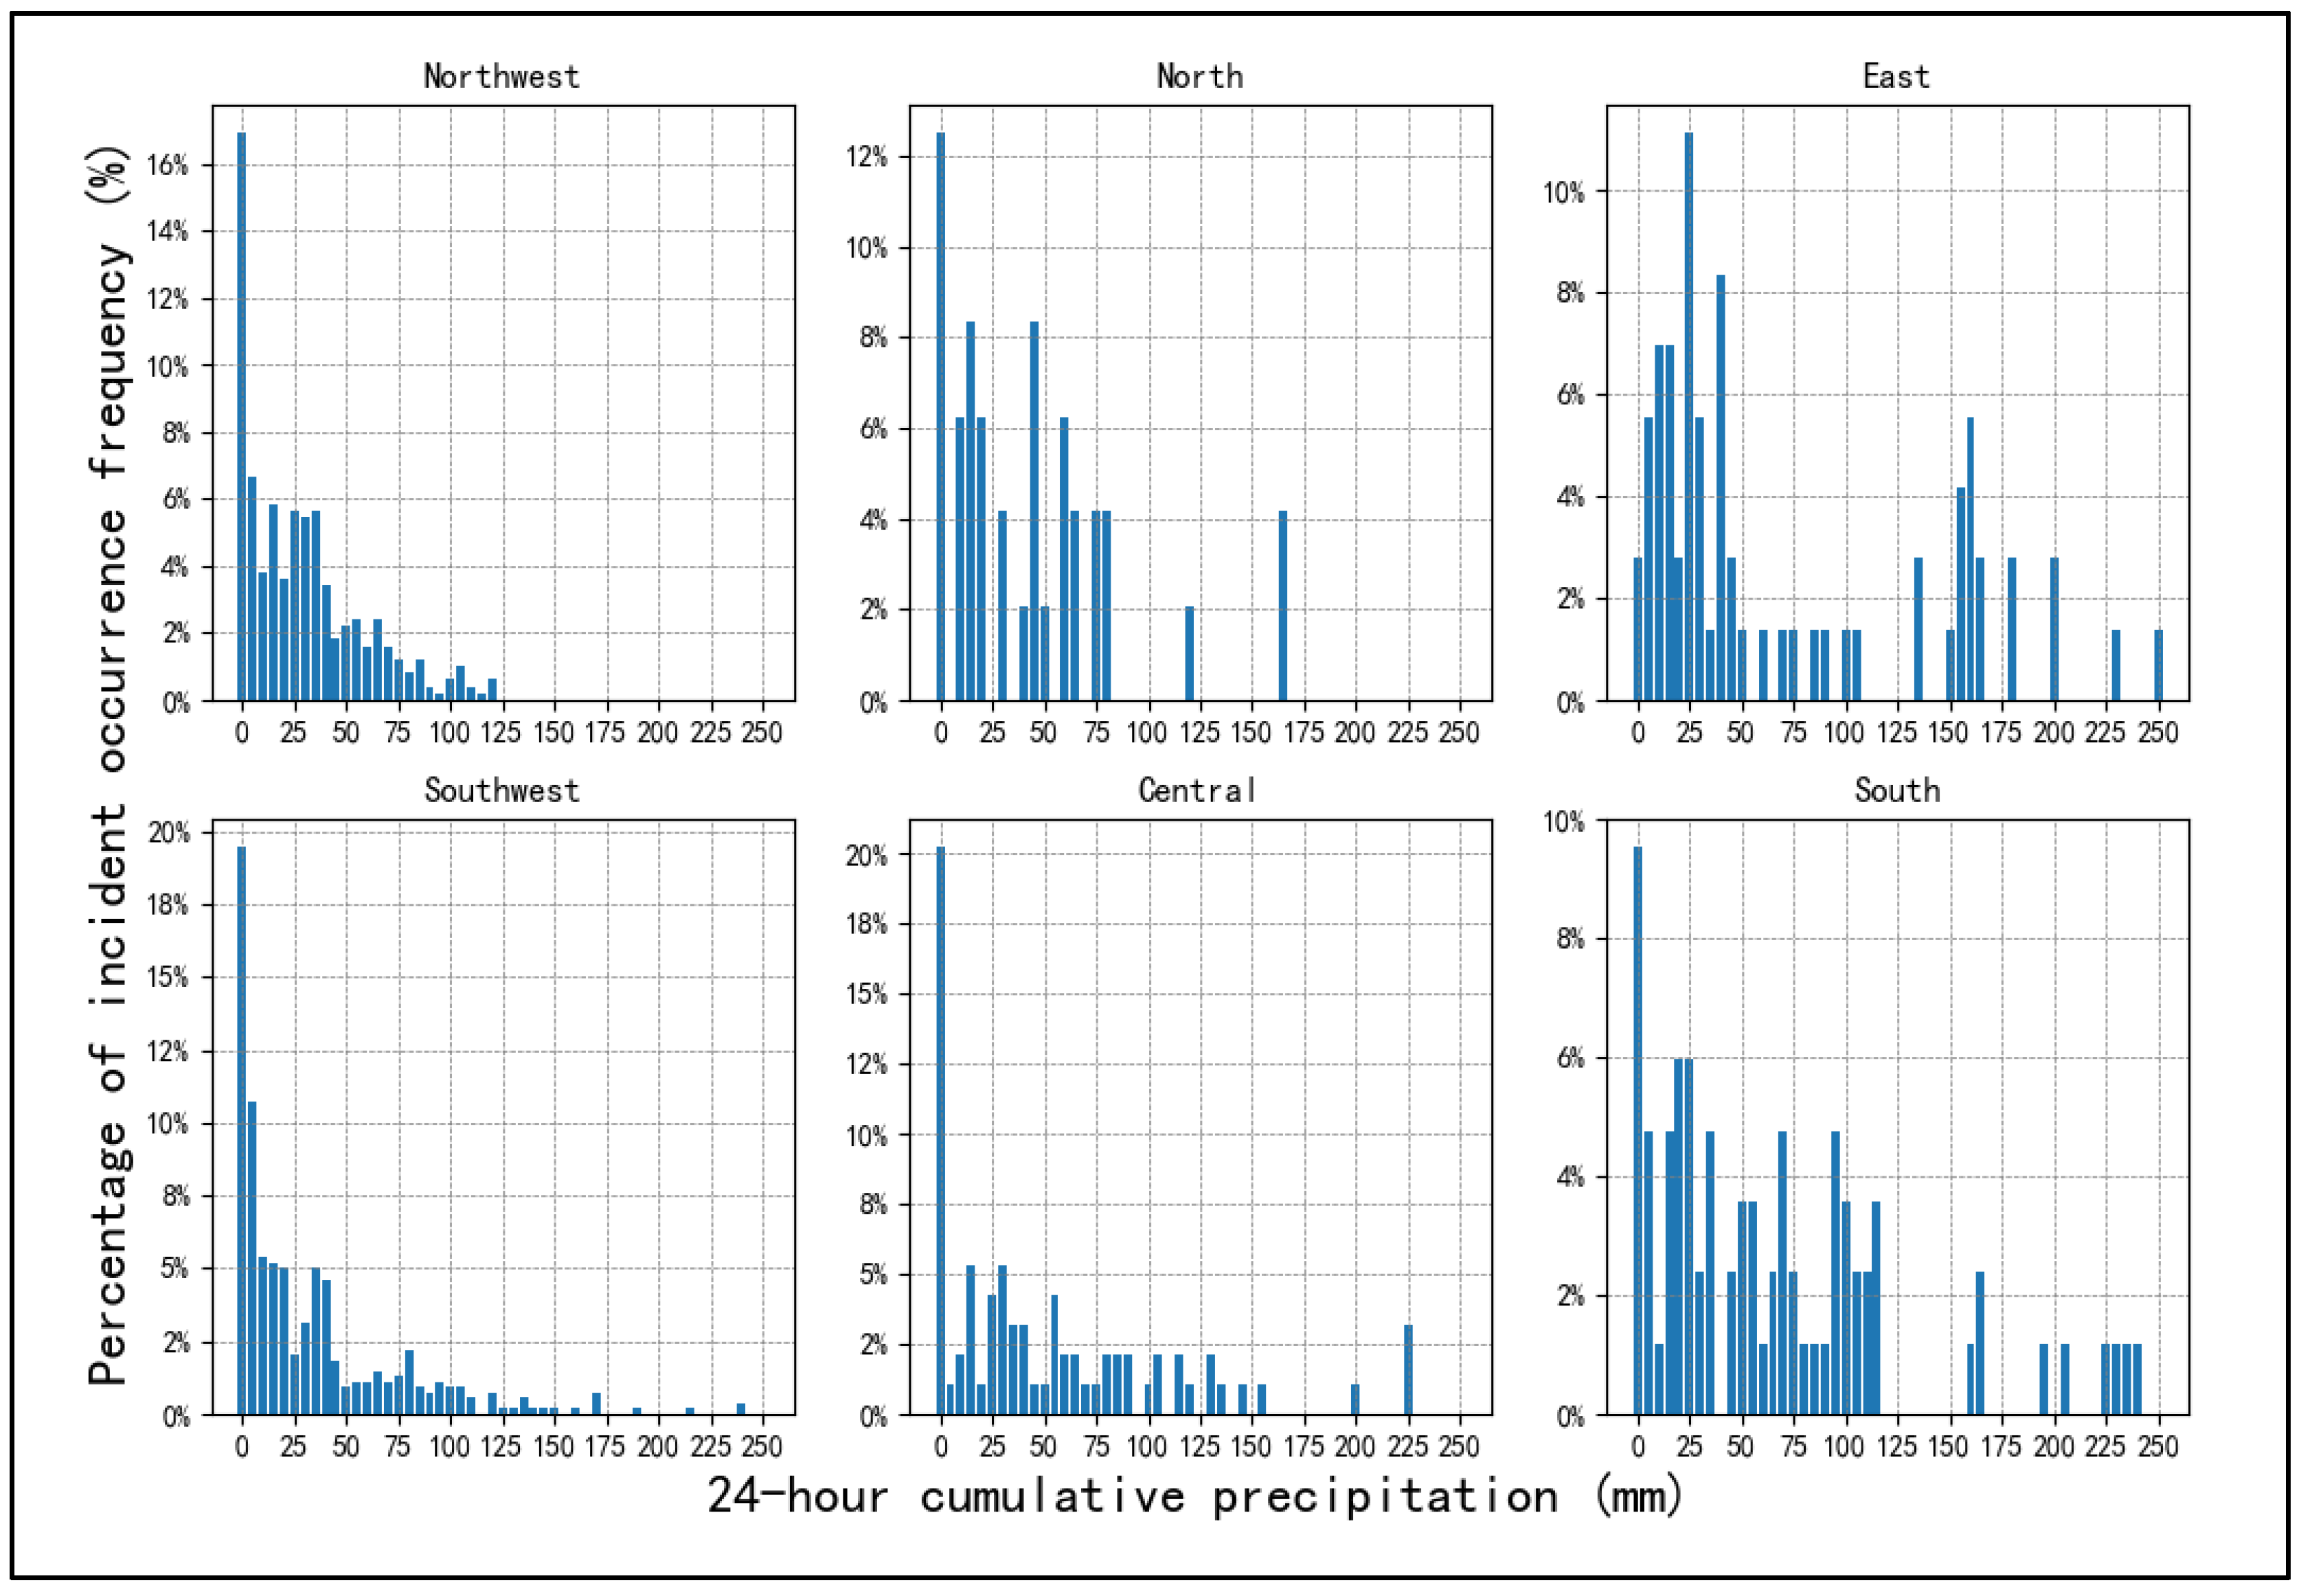
Figure 7.
Daily precipitation variation chart for the 15 days preceding a geomorphological incident (Average daily rainfall, 50%, 75%, and 90% percentile lines corresponding to the left vertical axis labels; maximum daily rainfall corresponding to the right vertical axis labels).
Figure 7.
Daily precipitation variation chart for the 15 days preceding a geomorphological incident (Average daily rainfall, 50%, 75%, and 90% percentile lines corresponding to the left vertical axis labels; maximum daily rainfall corresponding to the right vertical axis labels).
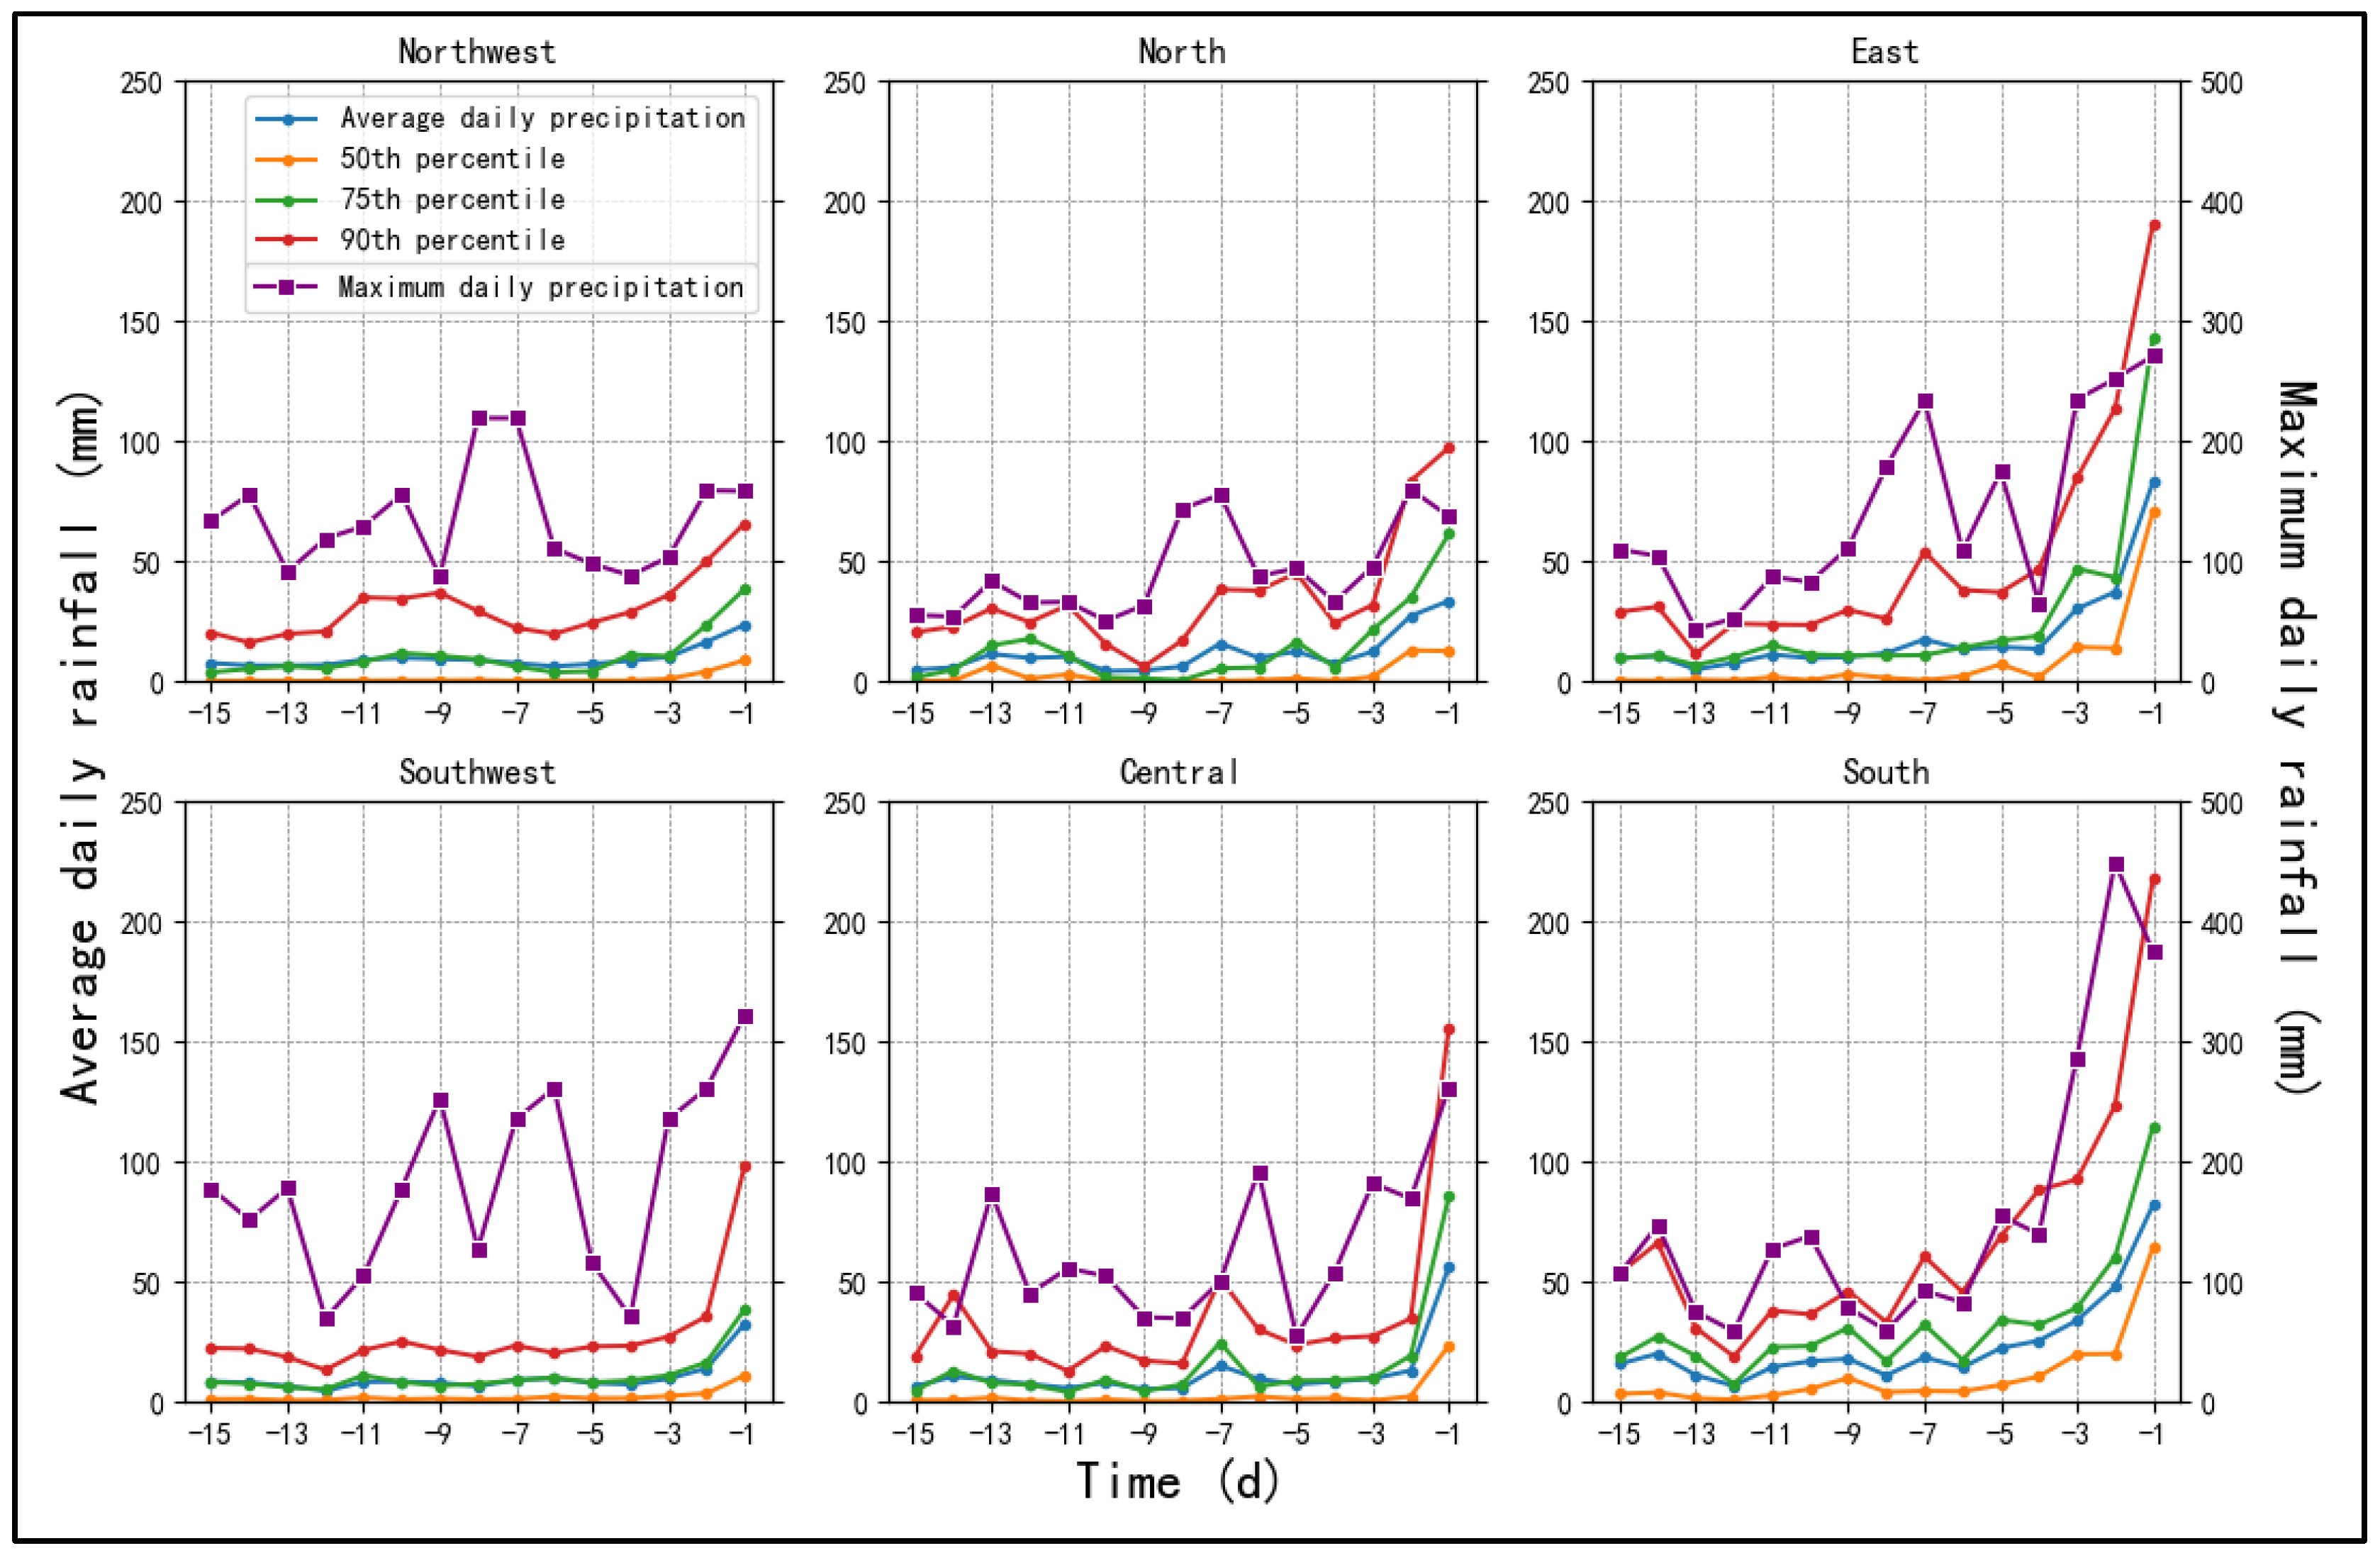
Figure 8.
Frequency Chart of geomorphological incidents on Highways Induced by Effective Precipitation for the Preceding 15 Days (where 25 mm denotes effective precipitation ≤25 mm, 50 mm denotes >25 mm and ≤50 mm, and 75 mm denotes >50 mm and ≤75 mm).
Figure 8.
Frequency Chart of geomorphological incidents on Highways Induced by Effective Precipitation for the Preceding 15 Days (where 25 mm denotes effective precipitation ≤25 mm, 50 mm denotes >25 mm and ≤50 mm, and 75 mm denotes >50 mm and ≤75 mm).
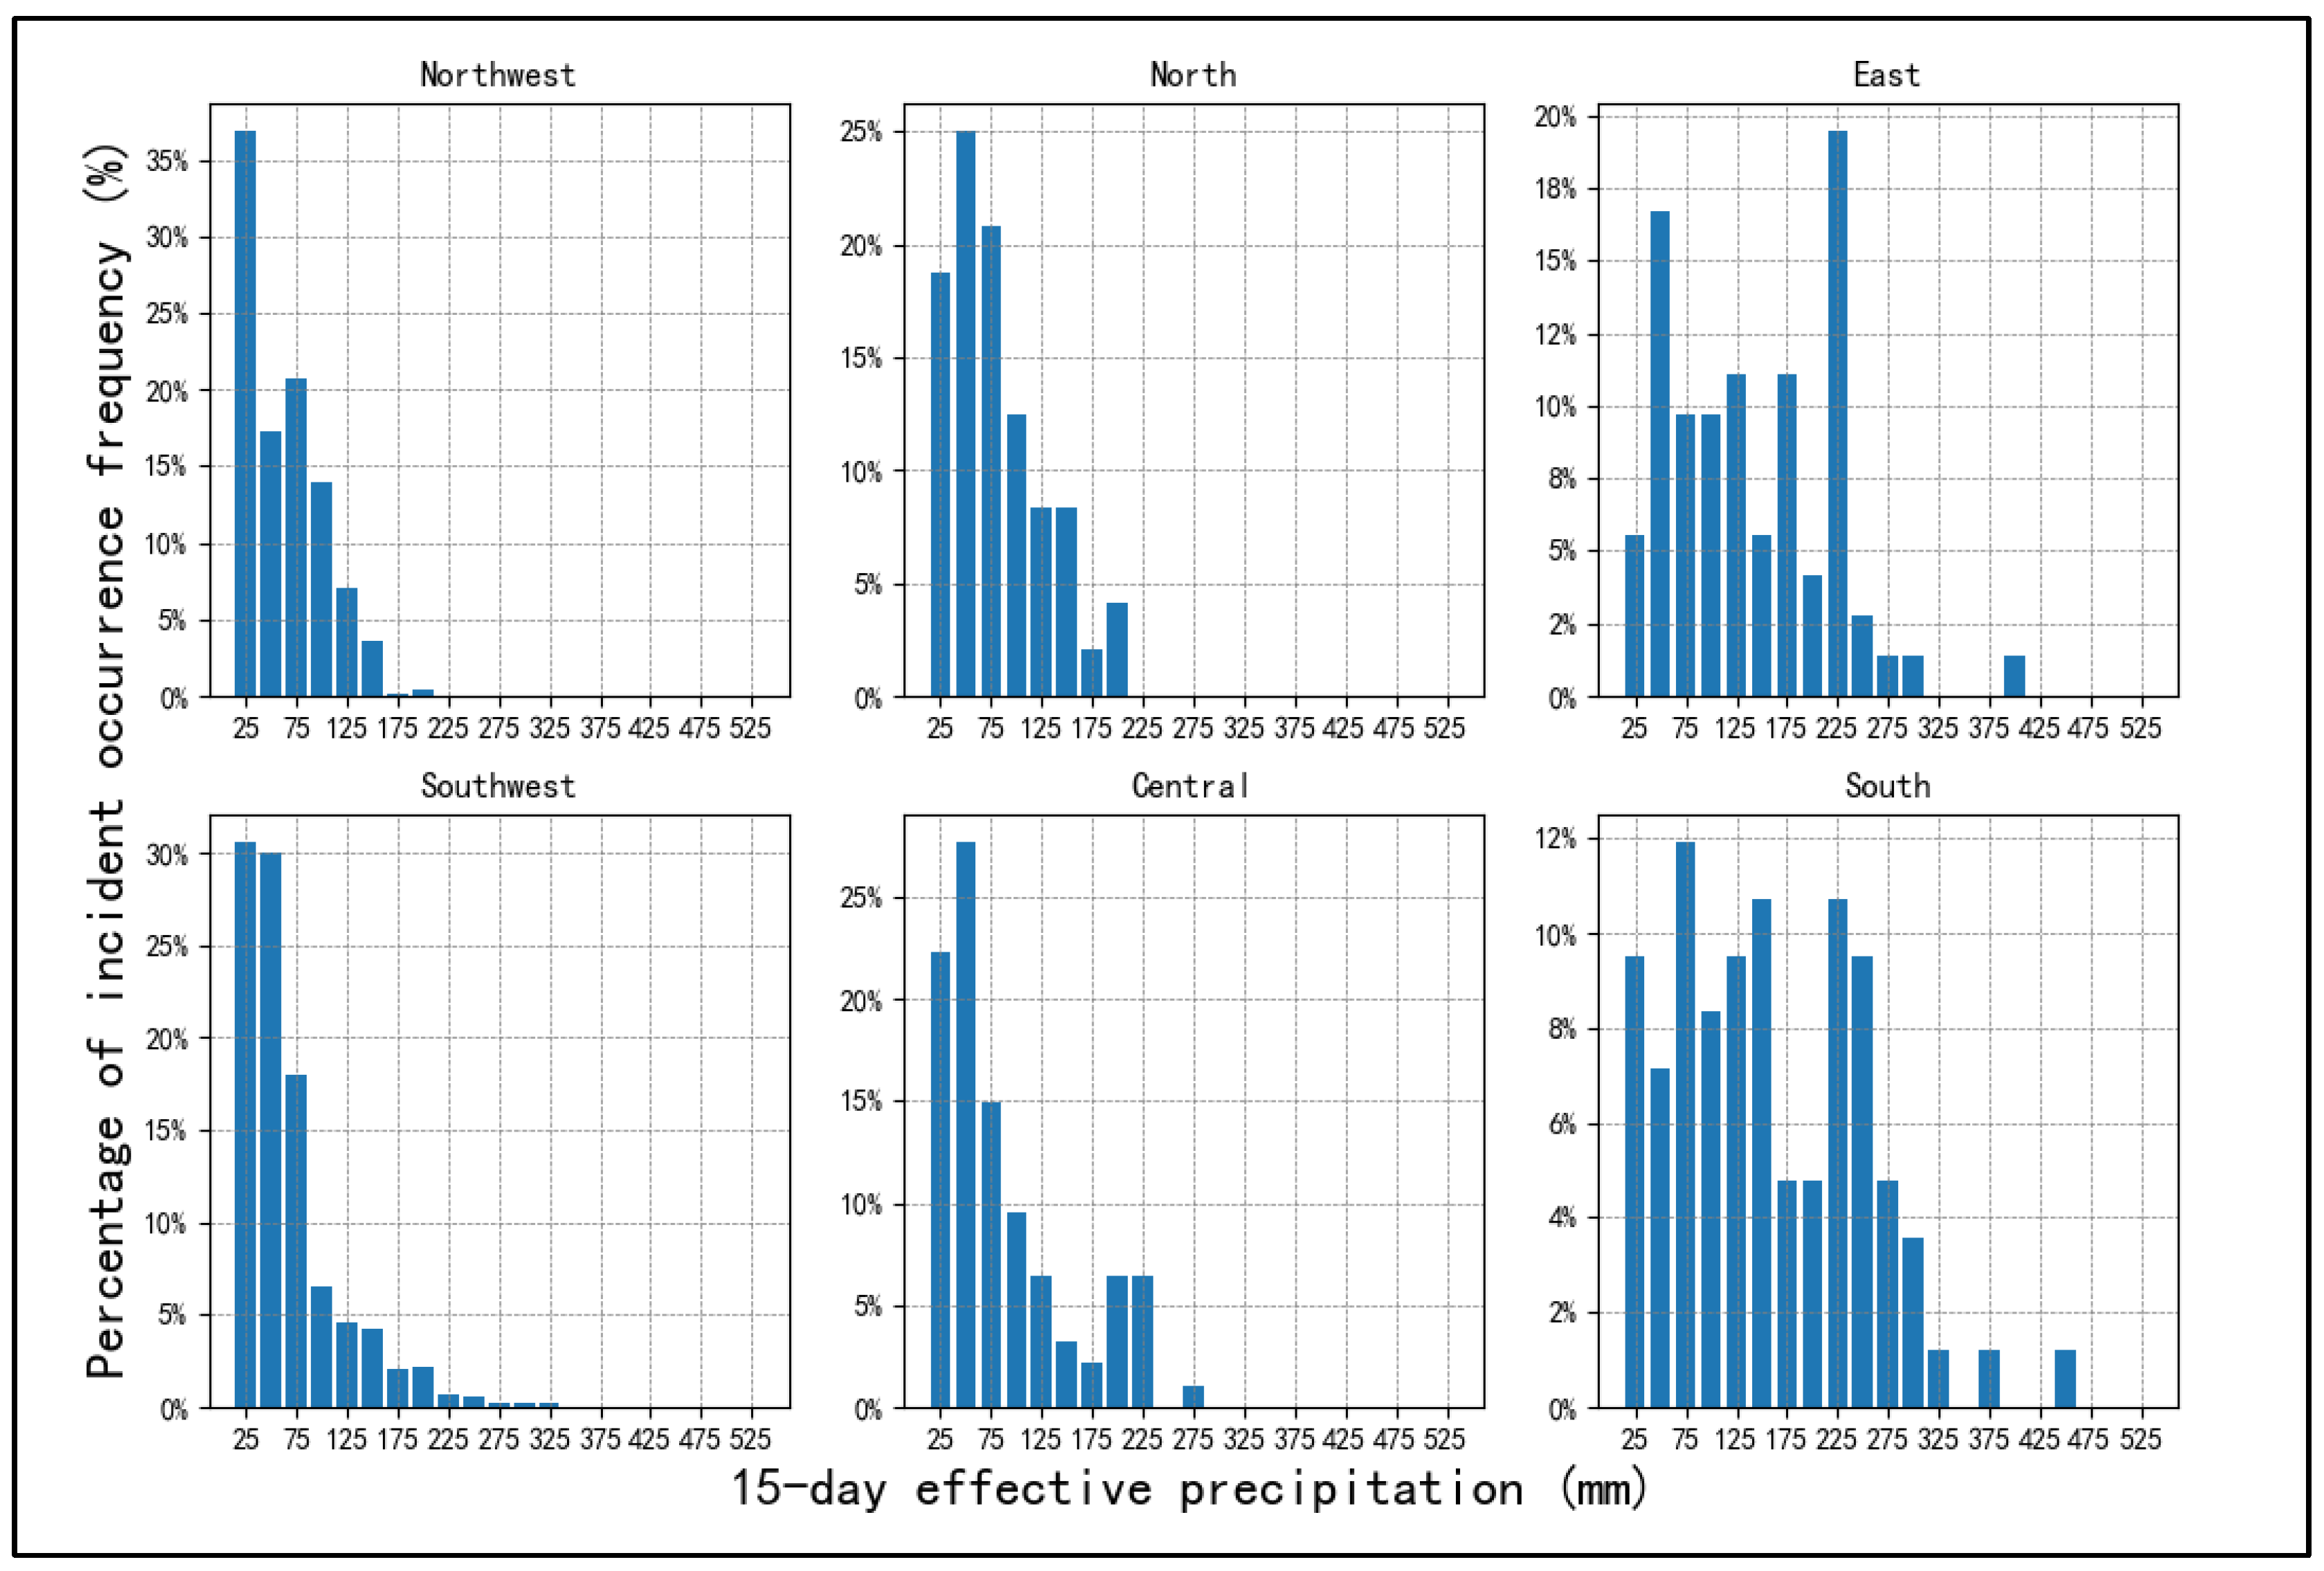
Figure 9.
Frequency Chart of geomorphological incidents on Highways Induced by the Longest Stretch of Continuous Rainfall Over the Past 15 Days.
Figure 9.
Frequency Chart of geomorphological incidents on Highways Induced by the Longest Stretch of Continuous Rainfall Over the Past 15 Days.

Table 1.
Hourly and Daily Rainfall Probability of Inducing geomorphological incidents Across Different Regions.
Table 1.
Hourly and Daily Rainfall Probability of Inducing geomorphological incidents Across Different Regions.
| Precipitation Type | Statistical Period | Region | |||||
|---|---|---|---|---|---|---|---|
| East | Central | Northwest | Southwest | North | South | ||
| Short-term light rain | Past 3 h | 0.7% | 0.4% | 0.5% | 0.5% | 0.5% | 0.7% |
| Past 6 h | 1.6% | 1.1% | 1.3% | 1.2% | 1.3% | 1.5% | |
| Past 12 h | 2.7% | 1.9% | 2.1% | 1.9% | 2.2% | 2.4% | |
| Past 24 h | 3.4% | 2.6% | 2.9% | 2.5% | 3.0% | 2.9% | |
| Short-term moderate rain | Past 3 h | 0.2% | 0.6% | 0.6% | 0.4% | 0.8% | 0.7% |
| Past 6 h | 0.7% | 1.9% | 1.6% | 1.4% | 1.8% | 2.8% | |
| Past 12 h | 3.4% | 5.4% | 4.3% | 3.7% | 4.9% | 5.5% | |
| Past 24 h | 9.4% | 11.0% | 10.3% | 7.7% | 15.5% | 10.3% | |
| Short-term heavy rain | Past 3 h | 0.2% | 0.6% | 0.3% | 0.5% | 0.4% | 0.5% |
| Past 6 h | 0.9% | 1.8% | 0.7% | 1.6% | 2.0% | 1.5% | |
| Past 12 h | 4.5% | 6.6% | 4.4% | 5.8% | 6.7% | 4.5% | |
| Past 24 h | 12.3% | 12.2% | 11.9% | 11.3% | 16.0% | 10.3% | |
| Short-term torrential rain | Past 3 h | 0.7% | 0.5% | 0.4% | 0.7% | 0.4% | 0.3% |
| Past 6 h | 2.0% | 2.3% | 0.8% | 1.4% | 0.4% | 1.2% | |
| Past 12 h | 9.5% | 12.0% | 5.6% | 7.9% | 2.5% | 7.2% | |
| Past 24 h | 20.2% | 22.4% | 15.5% | 16.3% | 12.2% | 12.9% | |
| Short-term downpours and above | Past 3 h | 0.0% | 0.0% | 0.0% | 0.1% | 0.0% | 0.6% |
| Past 6 h | 1.3% | 0.0% | 0.0% | 0.9% | 0.0% | 1.5% | |
| Past 12 h | 10.2% | 9.9% | 1.3% | 5.7% | 1.7% | 7.4% | |
| Past 24 h | 21.3% | 21.1% | 5.2% | 11.0% | 7.8% | 16.0% | |
| Light rain | Past 1 day | 1.8% | 2.0% | 3.1% | 2.6% | 3.2% | 1.9% |
| Past 3 days | 7.8% | 9.2% | 10.2% | 9.2% | 9.3% | 6.6% | |
| Past 3 days | 14.7% | 17.8% | 16.8% | 16.6% | 16.1% | 14.1% | |
| Past 3 days | 22.6% | 25.2% | 23.7% | 23.8% | 23.7% | 22.3% | |
| Moderate rain | Past 1 day | 5.7% | 3.2% | 4.9% | 4.5% | 3.7% | 3.3% |
| Past 3 days | 17.2% | 14.7% | 15.5% | 13.3% | 17.2% | 14.5% | |
| Past 3 days | 28.4% | 22.2% | 25.3% | 21.0% | 25.4% | 21.2% | |
| Past 3 days | 36.0% | 27.4% | 32.5% | 29.7% | 29.9% | 27.6% | |
| Heavy rain | Past 1 day | 2.2% | 6.0% | 10.0% | 9.1% | 6.8% | 2.6% |
| Past 3 days | 11.4% | 14.3% | 23.0% | 21.4% | 23.9% | 15.4% | |
| Past 3 days | 22.2% | 25.0% | 30.5% | 29.5% | 33.0% | 26.9% | |
| Past 3 days | 27.0% | 38.7% | 36.7% | 35.5% | 43.2% | 35.5% | |
| Torrential rain | Past 1 day | 9.6% | 17.9% | 17.2% | 15.5% | 21.3% | 11.6% |
| Past 3 days | 27.0% | 26.2% | 30.7% | 24.4% | 34.0% | 22.5% | |
| Past 3 days | 33.0% | 31.0% | 38.7% | 31.0% | 46.8% | 34.7% | |
| Past 3 days | 43.5% | 45.2% | 44.1% | 38.5% | 51.1% | 46.2% | |
| Downpours and above | Past 1 day | 45.9% | 67.7% | 19.4% | 41.7% | 26.7% | 35.5% |
| Past 3 days | 70.5% | 77.4% | 38.7% | 53.5% | 53.3% | 61.8% | |
| Past 3 days | 72.1% | 80.6% | 38.7% | 55.1% | 53.3% | 71.1% | |
| Past 3 days | 78.7% | 87.1% | 45.2% | 65.4% | 80.0% | 71.1% | |
Table 2.
Precipitation Percentiles and Averages for Various Regions for the Preceding 24 Hours.
| Region | Northwest | North | East | Southwest | Central | South |
|---|---|---|---|---|---|---|
| Mean | 23.5 | 33.9 | 73 | 27.9 | 45 | 70.2 |
| 90% | 65.8 | 78.9 | 178.8 | 82.4 | 120.5 | 168.1 |
| 75% | 37.4 | 53.6 | 142.3 | 39.6 | 67 | 99.3 |
| 50% | 12.5 | 18.8 | 38.8 | 10.2 | 27.8 | 53.6 |
| 25% | 0.1 | 1.4 | 17.7 | 0.9 | 0.3 | 18.6 |
Table 3.
Effective Precipitation Percentiles and Averages for Various Regions for the Preceding 15 Days.
Table 3.
Effective Precipitation Percentiles and Averages for Various Regions for the Preceding 15 Days.
| Region | Northwest | North | East | Southwest | Central | South |
|---|---|---|---|---|---|---|
| Mean | 48.9 | 67.6 | 129.4 | 54.5 | 74 | 148.4 |
| 90% | 103.9 | 126.6 | 217.3 | 126.3 | 181.4 | 261.7 |
| 75% | 75.2 | 97.2 | 201.7 | 69.2 | 103.7 | 218.6 |
| 50% | 44.8 | 57.9 | 122 | 40.1 | 50.9 | 129.8 |
| 25% | 14.8 | 29.2 | 61 | 19.6 | 28.4 | 71.3 |
Disclaimer/Publisher’s Note: The statements, opinions and data contained in all publications are solely those of the individual author(s) and contributor(s) and not of MDPI and/or the editor(s). MDPI and/or the editor(s) disclaim responsibility for any injury to people or property resulting from any ideas, methods, instructions or products referred to in the content. |
© 2024 by the authors. Licensee MDPI, Basel, Switzerland. This article is an open access article distributed under the terms and conditions of the Creative Commons Attribution (CC BY) license (https://creativecommons.org/licenses/by/4.0/).
Share and Cite
MDPI and ACS Style
Zhang, J.; Tian, H.; Song, J. Exploring the Spatio-Temporal Trends of Geomorphological Incidents Induced by Precipitation on Chinese Highways. Atmosphere 2024, 15, 391. https://doi.org/10.3390/atmos15040391
AMA Style
Zhang J, Tian H, Song J. Exploring the Spatio-Temporal Trends of Geomorphological Incidents Induced by Precipitation on Chinese Highways. Atmosphere. 2024; 15(4):391. https://doi.org/10.3390/atmos15040391
Chicago/Turabian StyleZhang, Jie, Hua Tian, and Jianyang Song. 2024. "Exploring the Spatio-Temporal Trends of Geomorphological Incidents Induced by Precipitation on Chinese Highways" Atmosphere 15, no. 4: 391. https://doi.org/10.3390/atmos15040391
Note that from the first issue of 2016, this journal uses article numbers instead of page numbers. See further details here.