Next Issue
Volume 15, May
Previous Issue
Volume 15, March


Atmosphere, Volume 15, Issue 4 (April 2024) – 126 articles

Cover Story (view full-size image): 
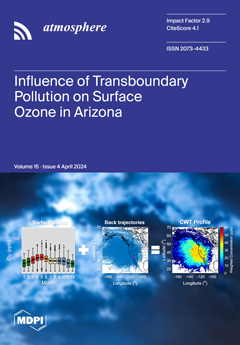
Arizona, one of the fastest-growing states in the U.S., encompasses several counties classified as O3 nonattainment areas influenced by non-local contributions. This study investigates the impact of pollution transport on O3 concentrations at six sites in Arizona, using a five-year dataset categorized into five seasons. Analysis of transport pathways and potential O3 source areas indicates that elevated O3 levels in Arizona are significantly influenced by regional and international transport, except for Phoenix and Tucson sites. This work emphasizes the role of pollution transport in O3 variability within the state, providing valuable insights for future pollution mitigation strategies. View this paper
  • Issues are regarded as officially published after their release is announced to the table of contents alert mailing list.
  • You may sign up for e-mail alerts to receive table of contents of newly released issues.
  • PDF is the official format for papers published in both, html and pdf forms. To view the papers in pdf format, click on the "PDF Full-text" link, and use the free Adobe Reader to open them.
Order results
Result details
Section
Select all
Export citation of selected articles as:
12 pages, 750 KiB  
Article
The Observed Changes in Climate Characteristics in the Trebinje Vineyard Area (Bosnia and Herzegovina)
by Tijana Banjanin, Zorica Ranković-Vasić, Milica Glišić and Zoran Pržić
Atmosphere 2024, 15(4), 514; https://doi.org/10.3390/atmos15040514 - 22 Apr 2024
Viewed by 226
Abstract
The productivity and quality of grapes and wine are significantly influenced by changing climate conditions in vineyard regions worldwide. This study assesses changes in temperature, precipitation, and viticultural indices between the periods of 1971–1990 and 2000–2019 in Trebinje, a vineyard area located in [...] Read more.
The productivity and quality of grapes and wine are significantly influenced by changing climate conditions in vineyard regions worldwide. This study assesses changes in temperature, precipitation, and viticultural indices between the periods of 1971–1990 and 2000–2019 in Trebinje, a vineyard area located in the Herzegovina region of Bosnia and Herzegovina. Between the two periods, mean annual temperature increased by 2 °C and mean vegetational temperature by 2.4 °C, while mean precipitation remained within the range of climatological variability, with annual values increasing by 6% and vegetational values decreasing by 4.6%. Warming resulted in a longer duration of the vegetation season by 23.7 days, a reduced risk of late spring frosts, and an increased risk of very high temperatures during summer. These changes led to the reclassification of Trebinje vineyards’ climate from Region III to Region V, based on the Winkler index values, from a “temperate warm” to a “warm” category, based on the Huglin heliothermic index, and from “cool nights” to “temperate nights” based on the cool nights index. The category of the dryness index remained unchanged between the two periods. The findings emphasize the necessity for a renewal of the viticultural zoning and the development of climate change-adaptation plans for this region. Full article
(This article belongs to the Special Issue Climate Change Impacts and Adaptation Strategies in Agriculture)
Show Figures

Figure 1

14 pages, 4681 KiB  
Article
Monitoring Snow Cover in Typical Forested Areas Using a Multi-Spectral Feature Fusion Approach
by Yunlong Wang and Jianshun Wang
Atmosphere 2024, 15(4), 513; https://doi.org/10.3390/atmos15040513 - 22 Apr 2024
Viewed by 302
Abstract
Accurate snow cover monitoring is greatly significant for research on the hydrology model and regional climate variation, especially in Northeast China where forests cover almost forty percent of the total area. However, effectively monitoring snow cover under the forest canopy is still challenging [...] Read more.
Accurate snow cover monitoring is greatly significant for research on the hydrology model and regional climate variation, especially in Northeast China where forests cover almost forty percent of the total area. However, effectively monitoring snow cover under the forest canopy is still challenging with either in situ or remote sensing observations. The global SNOWMAP algorithm pertinent to the fixed normalized difference snow index (NDSI) threshold is, therefore, no longer applicable in a typical forested region of Northeast China. In order to achieve the goal of improving the accuracy of monitoring snow cover in areas with forest, utilizing MOD09GA and MOD13A1 products, a new approach of snow mapping was developed in this study, and it exploits the fusion and coupling of spectral features by integrating and analyzing the normalized difference forest snow index (NDFSI), the normalized difference vegetation index (NDVI), and the NDSI index. Then, Landsat 8 OLI images of high resolution were used to evaluate snow cover mapping precision. The experimental results indicated that the NDFSI index combined with the NDVI index showed great potential for extracting the snow cover distribution in forested regions. Compared with the snow distribution obtained from the Landsat 8 images, the average bias and FAR (false alarm ratio) values of snow cover mapping obtained by this algorithm were 1.23 and 13.54%, which were reduced by 1.98 and 29.36%, respectively. The overall accuracy of 81.31% was reached, which is improved by 20.19%. Thus, the snow classification scheme combining multiple spectral features from MODIS data works effectively in improving the precision of automatic snow cover mapping in typical forested areas of Northeast China, which provides essential support and significant perspectives for the next step of establishing a runoff model and rationally regulating forest water resources. Full article
(This article belongs to the Special Issue Precipitation Monitoring and Databases)
Show Figures

Figure 1

15 pages, 10282 KiB  
Article
Investigation on the Sensitivity of Precipitation Simulation to Model Parameterization and Analysis Nudging over Hebei Province, China
by Yuanhua Li, Zhiguang Tian, Xia Chen, Xiashu Su and Entao Yu
Atmosphere 2024, 15(4), 512; https://doi.org/10.3390/atmos15040512 - 22 Apr 2024
Viewed by 272
Abstract
The physical parameterizations have important influence on model performance in precipitation simulation and prediction; however, previous investigations are seldom conducted at very high resolution over Hebei Province, which is often influenced by extreme events such as droughts and floods. In this paper, the [...] Read more.
The physical parameterizations have important influence on model performance in precipitation simulation and prediction; however, previous investigations are seldom conducted at very high resolution over Hebei Province, which is often influenced by extreme events such as droughts and floods. In this paper, the influence of parameterization schemes and analysis nudging on precipitation simulation is investigated using the WRF (weather research and forecasting) model with many sensitivity experiments at the cumulus “gray-zone” resolution (5 km). The model performance of different sensitivity simulations is determined by a comparison with the local high-quality observational data. The results indicate that the WRF model generally reproduces the distribution of precipitation well, and the model tends to underestimate precipitation compared with the station observations. The sensitivity simulation with the Tiedtke cumulus parameterization scheme combined with the Thompson microphysics scheme shows the best model performance, with the highest temporal correlation coefficient (0.45) and lowest root mean square error (0.34 mm/day). At the same time, analysis nudging, which incorporates observational information into simulation, can improve the model performance in precipitation simulation. Further analysis indicates that the negative bias in precipitation may be associated with the negative bias in relative humidity, which in turn is associated with the positive bias in temperature and wind speed. This study highlights the role of parameterization schemes and analysis nudging in precipitation simulation and provides a valuable reference for further investigations on precipitation forecasting applications. Full article
Show Figures

Figure 1

21 pages, 2573 KiB  
Article
Inactivation Mechanisms of Escherichia coli in Simulants of Respiratory and Environmental Aerosol Droplets
by Mara Otero-Fernandez, Richard J. Thomas, Henry Oswin, Robert Alexander, Allen Haddrell and Jonathan P. Reid
Atmosphere 2024, 15(4), 511; https://doi.org/10.3390/atmos15040511 - 22 Apr 2024
Viewed by 375
Abstract
The airborne transmission of disease relies on the ability of microbes to survive aerosol transport and, subsequently, cause infection when interacting with a host. The length of time airborne microorganisms remain infectious in aerosol droplets is a function of numerous variables. We present [...] Read more.
The airborne transmission of disease relies on the ability of microbes to survive aerosol transport and, subsequently, cause infection when interacting with a host. The length of time airborne microorganisms remain infectious in aerosol droplets is a function of numerous variables. We present measurements of mass and heat transfer from liquid aerosol droplets combined with airborne survival data for Escherichia coli MRE162, an ACDP category 1 microorganism used as a model system, under a wide range of environmental conditions, droplet compositions and microbiological conditions. In tandem, these companion measurements demonstrate the importance of understanding the complex relationship between aerosol microphysics and microbe survival. Specifically, our data consist of the correlation of a wide range of physicochemical properties (e.g., evaporation rates, equilibrium water content, droplet morphology, compositional changes in droplet solute and gas phase, etc.), with airborne viability decay to infer the impact of aerosol microphysics on airborne bacterial survival. Thus, a mechanistic approach to support prediction of the survival of microorganisms in the aerosol phase as a function of biological, microphysical, environmental, and experimental (aerosol-generation and sampling) processes is presented. Specific findings include the following: surfactants do not increase bacteria stability in aerosol, while both the bacteria growth phase and bacteria concentration may affect the rate at which bacteria decay in aerosol. Full article
(This article belongs to the Special Issue Atmospheric Bioaerosols: Detection, Characterization and Modelling)
Show Figures

Figure 1

10 pages, 1811 KiB  
Article
The Synergistic Effect of the Filtration Area Controlled by the Electromagnetic Valve and Injection Pressure on Pulse-Jet Dust Cleaning Performance
by Yu Fu, Juan Lǖ, Shenglong Huang, Longyuan Lin and Haiyan Chen
Atmosphere 2024, 15(4), 510; https://doi.org/10.3390/atmos15040510 - 22 Apr 2024
Viewed by 249
Abstract
In engineering pulse-jet dust collector applications, the filtration area and injection pressure are chosen mostly based on experience. The peak pressure is tested under different injection pressures and filtration areas controlled by an electromagnetic valve, and then comprehensively analyzes the effects of dust [...] Read more.
In engineering pulse-jet dust collector applications, the filtration area and injection pressure are chosen mostly based on experience. The peak pressure is tested under different injection pressures and filtration areas controlled by an electromagnetic valve, and then comprehensively analyzes the effects of dust intensity, uniformity, and air consumption on dust cleaning to obtain a better filtration area controlled by an electromagnetic valve and injection pressure. The results show that considering the uniformity and intensity of dust cleaning, the filtration area of 33 m2 under the injection pressure of 0.4 MPa should be preferentially selected, with a standard deviation of 0.246 and a variance of 0.061. The filtration area of 27 m2 under the injection pressure of 0.3 MPa should be preferentially selected considering the unit air consumption, uniformity, and intensity of dust cleaning, the standard deviation of 0.252, and the variance of 0.064. The paper presents a theoretical foundation for selecting the optimal injection pressure and filter area regulated by an electromagnetic valve in pulse-jet dust collector systems. Full article
(This article belongs to the Section Air Quality)
Show Figures

Figure 1

18 pages, 10542 KiB  
Article
Wavelet Analysis of Atmospheric Ozone and Ultraviolet Radiation on Solar Cycle-24 over Lumbini, Nepal
by Prakash M. Shrestha, Suresh P. Gupta, Usha Joshi, Morgan Schmutzler, Rudra Aryal, Babu Ram Tiwari, Binod Adhikari, Narayan P. Chapagain, Indra B. Karki and Khem N. Poudyal
Atmosphere 2024, 15(4), 509; https://doi.org/10.3390/atmos15040509 - 21 Apr 2024
Viewed by 264
Abstract
This research aims to comprehensively examine the clearness index (KT), total ozone column (TOC), and ultraviolet A (UVA) and ultraviolet B radiation (UVB) over Lumbini, Nepal (27°28’ N, 83°16’ E, and 150 m above sea level) throughout the 11 years of [...] Read more.
This research aims to comprehensively examine the clearness index (KT), total ozone column (TOC), and ultraviolet A (UVA) and ultraviolet B radiation (UVB) over Lumbini, Nepal (27°28’ N, 83°16’ E, and 150 m above sea level) throughout the 11 years of solar cycle 24 (2008 to 2018). The Lumbini, a highly polluted region, is important in advancing the identification and analysis of TOC variations across regions with similar geographical and climatic attributes. Data from the Ozone Monitoring Instrument (OMI) of the EOS-AURA satellite of NASA were used to analyze the daily, monthly, seasonal, and annual trends in the clearness index (KT), ultraviolet A (UVA), ultraviolet B (UVB), and TOC from the Comprehensive Environmental Data Archive (CEDA). The study found that the yearly averages for KT, TOC, UVA, and UVB were 0.55 ± 0.13, 272 ± 14 DU, 12.61 ± 3.50 W/m2, and 0.32 ± 0.11 W/m2, respectively. These values provide insights into the long-term variations in atmospheric parameters at Lumbini. The study also applied the continuous wavelet transform (CWT) to analyze KT, TOC, UVA, and UVB temporal variations. The power density peak of 35,000 DU2 in the TOC was observed from the end of 2010 to the end of 2011, within 8.5 years, underscoring the significance of analyzing TOC dynamics over extended durations to understand atmospheric behavior comprehensively. Full article
Show Figures

Figure 1

12 pages, 5189 KiB  
Article
Quantifying Urban Daily Nitrogen Oxide Emissions from Satellite Observations
by Tao Tang, Lili Zhang, Hao Zhu, Xiaotong Ye, Donghao Fan, Xingyu Li, Haoran Tong and Shenshen Li
Atmosphere 2024, 15(4), 508; https://doi.org/10.3390/atmos15040508 - 21 Apr 2024
Viewed by 463
Abstract
Urban areas, characterized by dense anthropogenic activities, are among the primary sources of nitrogen oxides (NOx), impacting global atmospheric conditions and human health. Satellite observations, renowned for their continuity and global coverage, have emerged as an effective means to quantify pollutant [...] Read more.
Urban areas, characterized by dense anthropogenic activities, are among the primary sources of nitrogen oxides (NOx), impacting global atmospheric conditions and human health. Satellite observations, renowned for their continuity and global coverage, have emerged as an effective means to quantify pollutant emissions. Previous bottom-up emission inventories exhibit considerable discrepancies and lack a comprehensive and reliable database. To develop a high-precision emission inventory for individual cities, this study utilizes high-resolution single-pass observations from the TROPOspheric Monitoring Instrument (TROPOMI) on the Sentinel-5 Precursor satellite to quantify the emission rates of NOx. The Exponentially Modified Gaussian (EMG) model is validated for estimating NOx emission strength using real plumes observed in satellite single-pass observations, demonstrating good consistency with existing inventories. Further analysis based on the results reveals the existence of a weekend effect and seasonal variations in NOx emissions for the majority of the studied cities. Full article
(This article belongs to the Special Issue Reactive Nitrogen and Halogen in the Atmosphere)
Show Figures

Figure 1

19 pages, 2443 KiB  
Article
Forecasting the Mitigation Potential of Greenhouse Gas Emissions in Shenzhen through Municipal Solid Waste Treatment: A Combined Weight Forecasting Model
by Xia Zhang, Bingchun Liu and Ningbo Zhang
Atmosphere 2024, 15(4), 507; https://doi.org/10.3390/atmos15040507 - 20 Apr 2024
Viewed by 315
Abstract
As a significant source of anthropogenic greenhouse gas emissions, the municipal solid waste sector’s greenhouse gas emission mode remains unknown, hampering effective decision-making on possible greenhouse gas emission reductions. Rapid urbanization and economic growth have resulted in massive volumes of municipal solid trash. [...] Read more.
As a significant source of anthropogenic greenhouse gas emissions, the municipal solid waste sector’s greenhouse gas emission mode remains unknown, hampering effective decision-making on possible greenhouse gas emission reductions. Rapid urbanization and economic growth have resulted in massive volumes of municipal solid trash. As a result, identifying emission reduction routes for municipal solid waste treatment is critical. In this research, we investigate the potential of municipal solid waste treatment methods in lowering greenhouse gas (GHG) emissions in Shenzhen, a typical Chinese major city. The results showed that the combined treatment of 58% incineration, 2% landfill, and 40% anaerobic digestion (AD) had the lowest greenhouse gas emissions of about 5.91 million tons under all scenarios. The implementation of waste sorting and anaerobic digestion treatment of organic municipal solid waste after separate collection can reduce greenhouse gas emissions by simply increasing the incineration ratio. Full article
(This article belongs to the Section Atmospheric Techniques, Instruments, and Modeling)
Show Figures

Figure 1

9 pages, 243 KiB  
Communication
Optimal Variables for Retrieval Products
by Simone Ceccherini
Atmosphere 2024, 15(4), 506; https://doi.org/10.3390/atmos15040506 - 20 Apr 2024
Viewed by 252
Abstract
The increase in satellite instruments sounding the atmosphere will increase the frequency of several instruments simultaneously measuring either the same vertical profile or vertical profiles related to nearby geo-locations, and users will consult fused products rather than individual measurements. Therefore, the retrieval products [...] Read more.
The increase in satellite instruments sounding the atmosphere will increase the frequency of several instruments simultaneously measuring either the same vertical profile or vertical profiles related to nearby geo-locations, and users will consult fused products rather than individual measurements. Therefore, the retrieval products should be optimized for use in data fusion operations, rather than for the representation of the profile. This change in paradigm raises the question of whether a more functional representation of the retrieval products exists. New variables for the retrieval products are proposed that have several advantages with respect to the standard retrieval products. These variables, in the linear approximation of the forward model, are independent of the a priori information used in the retrieval, allow us to represent the profile with any a priori information and can be used directly to perform the data fusion of a set of measurements. Furthermore, the use of these variables allows us to reduce the stored data to about one third of its volume with respect to the use of standard retrieval products. Full article
(This article belongs to the Section Atmospheric Techniques, Instruments, and Modeling)
33 pages, 9246 KiB  
Review
Meteor Radar for Investigation of the MLT Region: A Review
by Iain M. Reid
Atmosphere 2024, 15(4), 505; https://doi.org/10.3390/atmos15040505 - 20 Apr 2024
Viewed by 302
Abstract
This is an introductory review of modern meteor radar and its application to the measurement of the dynamical parameters of the Mesosphere Lower Thermosphere (MLT) Region within the altitude range of around 70 to 110 km, which is where most meteors are detected. [...] Read more.
This is an introductory review of modern meteor radar and its application to the measurement of the dynamical parameters of the Mesosphere Lower Thermosphere (MLT) Region within the altitude range of around 70 to 110 km, which is where most meteors are detected. We take a historical approach, following the development of meteor radar for studies of the MLT from the time of their development after the Second World War until the present. The application of the meteor radar technique is closely aligned with their ability to make contributions to Meteor Astronomy in that they can determine meteor radiants, and measure meteoroid velocities and orbits, and so these aspects are noted when required. Meteor radar capabilities now extend to measurements of temperature and density in the MLT region and show potential to be extended to ionospheric studies. New meteor radar networks are commencing operation, and this heralds a new area of investigation as the horizontal spatial variation of the upper-atmosphere wind over an extended area is becoming available for the first time. Full article
(This article belongs to the Special Issue Observations and Analysis of Upper Atmosphere)
Show Figures

Figure 1

12 pages, 229 KiB  
Project Report
A Mixed Method Study to Explore How Maintenance Personnel Can Enhance Wildfire Smoke Resilience at Long-Term Care Facilities in the US Mountain West
by Adhieu Arok, James Caringi, Sarah Toevs, Meredith Spivak and Luke Montrose
Atmosphere 2024, 15(4), 504; https://doi.org/10.3390/atmos15040504 - 20 Apr 2024
Viewed by 358
Abstract
Wildfire activity is increasing around the world, concurrent with climate change, and mitigation strategies for protecting vulnerable populations are desperately needed. Because inhaled particles are deleterious to respiratory health, particularly among older adults with co-morbidities, we engaged maintenance personnel working in long term [...] Read more.
Wildfire activity is increasing around the world, concurrent with climate change, and mitigation strategies for protecting vulnerable populations are desperately needed. Because inhaled particles are deleterious to respiratory health, particularly among older adults with co-morbidities, we engaged maintenance personnel working in long term care facilities located in the Western US. Our objective was to identify opportunities to build resilience during wildfire smoke events. We implemented a virtual workshop that addressed wildfire smoke health impacts as well as strategies to assess and maintain indoor air quality. A total of 24 maintenance personnel attended the virtual workshop and 14 participated in a quantitative survey. Workshop attendees found value in the material and there was enthusiasm for educational resources and enhancing indoor air quality. Four months later, four maintenance staff participated in a follow-up interview. Our qualitative assessment revealed the following themes: awareness and prioritization, application of knowledge, barriers, and educational resources. Access to real-time actionable air quality data was a consistent feature across these themes. Maintenance personnel could play a key role in a facility’s ability to prepare for and respond to wildfire smoke events, and this study highlights potential challenges and opportunities to involving them in resilience building strategies. Full article
(This article belongs to the Special Issue New Insights into Exposure and Health Impacts of Air Pollution)
15 pages, 4666 KiB  
Article
Characterization of Microbials in the Lung Induced by Allergenic Platanus Pollen Protein (Pla a3) and Ambient Fine Particulate Matter
by Jin Liu, Senlin Lu, Guoqing Hou, Wenwen Hu, Jiumei Zhao, Wei Zhang, Xinchun Liu, Enyoh Christian Ebere, Weiqian Wang and Qingyue Wang
Atmosphere 2024, 15(4), 503; https://doi.org/10.3390/atmos15040503 - 19 Apr 2024
Viewed by 410
Abstract
Ambient pollen proteins play key roles in the incidence of allergenic respiratory health, and numerous reports have focused on respiratory diseases caused by air pollutants. However, there is still a lack of understanding of the specific mechanisms underlying the involvement of microbiota in [...] Read more.
Ambient pollen proteins play key roles in the incidence of allergenic respiratory health, and numerous reports have focused on respiratory diseases caused by air pollutants. However, there is still a lack of understanding of the specific mechanisms underlying the involvement of microbiota in the respiratory tracts and effects induced by air pollutants. Therefore, an allergenic animal model was established to investigate the characterization of microbials in the lung induced by allergenic Platanus pollen protein (Pla a3) and ambient fine particulate matter. Our data showed that the mice exhibited strong immune and inflammatory responses after being exposed to PMs and Pla a3 protein. This included increased levels of immunoglobulins IgG and IgE, as well as elevated levels of cytokines TNF-α, IFN-γ, IL-4, and IL-13. Furthermore, the amounts of pathogenic bacteria, such as Desulfobacterota, Enterococcus, Ferruginibacter, and Pseudoxanthomonas, in the lung microbiota of the Pla a3 exposure group increased significantly. Correlation analysis revealed a strong association between specific lung bacteria and alterations in cytokines from the lung samples. Probiotic bacteria, Deferribacterota and Bifidobacterium, was associated with changes in the level of IgG and IgE. However, pathogenic bacteria, like Prevotella and Fusobacterium, were linked with the cytokines IL-4 and TNF-α. Full article
Show Figures

Figure 1

19 pages, 1666 KiB  
Article
Influence of Vertical Load, Inflation Pressure, and Driving Speed on the Emission of Tire–Road Particulate Matter and Its Size Distribution
by Stefan Schläfle, Meng Zhang, Hans-Joachim Unrau and Frank Gauterin
Atmosphere 2024, 15(4), 502; https://doi.org/10.3390/atmos15040502 - 19 Apr 2024
Viewed by 327
Abstract
As fleet electrification progresses, vehicles are continuously becoming heavier, while the used electric motors, with their high torques, enable longitudinal dynamics to be maintained or even increased. This raises the question of what effect electric vehicles have on the emission of tire–road particulate [...] Read more.
As fleet electrification progresses, vehicles are continuously becoming heavier, while the used electric motors, with their high torques, enable longitudinal dynamics to be maintained or even increased. This raises the question of what effect electric vehicles have on the emission of tire–road particulate matter (PM). To answer this question, investigations were carried out in this study on a tire internal drum test bench with real road surfaces. In addition to the vertical load, the tire inflation pressure and the driving speed were varied. PM emissions were recorded in real time, resulting in emission factors (emission per kilometer driven) for different load conditions. This allows statements to be made about both the effect on the total emission and on the particle size distribution. It was shown that the PM emission increases linearly with the vertical load at constant longitudinal dynamics. If the tire inflation pressure is increased, the emission also increases linearly, and the increases in emission are equally large for both influences. A clear influence of the driving speed on the emission factor could not be determined. With regard to the particle size distribution, the following correlations were found: higher vertical load and higher tire inflation pressure result in a larger mean particle diameter, while a higher driving speed reduces it. Thus, this study contributes to a better understanding of the expected changes in tire-road PM emissions as a result of electrification. Full article
(This article belongs to the Special Issue Traffic Related Emission (2nd Edition))
Show Figures

Figure 1

19 pages, 9127 KiB  
Article
Impact of a New Radiation Scheme on Simulated Climate in the Global–Regional Integrated SysTem Model under Varying Physical Parameterization Schemes
by Chang Yuan, Hua Zhang, Xianwen Jing, Shuyun Zhao and Xiaohan Li
Atmosphere 2024, 15(4), 501; https://doi.org/10.3390/atmos15040501 - 19 Apr 2024
Viewed by 222
Abstract
In this study, the radiation scheme BCC-RAD (Beijing Climate Center RADiative transfer model) developed for global climate models is implemented into the Global–Regional Integrated SysTem (GRIST) model as an alternative to the default RRTMG (general circulation model (GCM) version of the Rapid Radiative [...] Read more.
In this study, the radiation scheme BCC-RAD (Beijing Climate Center RADiative transfer model) developed for global climate models is implemented into the Global–Regional Integrated SysTem (GRIST) model as an alternative to the default RRTMG (general circulation model (GCM) version of the Rapid Radiative Transfer Model) scheme. Its impact on the simulated climate is comprehensively evaluated under different physics parametrization packages, in comparison with both the CERES (partly from ERA5 reanalysis) observations and multi-model results from CMIP6. The results indicate that under the default physics parameterization package of GRIST (PhysC), BCC-RAD improved the simulated global mean cloud cover by ~3% and the clear-sky outgoing longwave radiation by ~5.6 W/m2. Upon the inclusion of the PhysCN parameterization package, BCC-RAD exhibited further improvement in simulated cloud cover and radiative forcing (particularly longwave radiative forcing, the bias of which decreases from −9.2 W/m2 to −1.8 W/m2), leading it to be closer to observations than RRTMG. Additionally, BCC-RAD improved the simulation of atmospheric temperature and hence notably diminished the apparent overestimation of atmospheric humidity seen in RRTMG. This study demonstrates the advantages of BCC-RAD over RRTMG in certain aspects of the GRIST-simulated climate, verifying its capability for the climate-oriented configuration of GRIST. Full article
(This article belongs to the Special Issue Ozone Pollution and Effects in China)
Show Figures

Figure 1

18 pages, 16362 KiB  
Article
Global El Niño–Southern Oscillation Teleconnections in CMIP6 Models
by Ilya V. Serykh and Dmitry M. Sonechkin
Atmosphere 2024, 15(4), 500; https://doi.org/10.3390/atmos15040500 - 19 Apr 2024
Viewed by 342
Abstract
The results of a piControl experiment investigating general circulation models participating in the sixth phase of the Coupled Model Intercomparison Project (CMIP6) were examined. The global interannual variability in the monthly surface temperature (ST) and sea level pressure (SLP) anomalies was considered. The [...] Read more.
The results of a piControl experiment investigating general circulation models participating in the sixth phase of the Coupled Model Intercomparison Project (CMIP6) were examined. The global interannual variability in the monthly surface temperature (ST) and sea level pressure (SLP) anomalies was considered. The amplitudes of the fluctuations in the anomalies of these meteorological fields between opposite phases of the El Niño–Southern Oscillation (ENSO) were calculated. It was shown that most CMIP6 models reproduced fluctuations in the ST and SLP anomalies between El Niño and La Niña not only in the equatorial Pacific, but also throughout the tropics, as well as in the middle and high latitudes. Some of the CMIP6 models reproduced the global structures of the ST and SLP anomaly oscillations quite accurately between opposite phases of ENSO, as previously determined from observational data and reanalyses. It was found that the models AS-RCEC TaiESM1, CAMS CAMS-CSM1-0, CAS FGOALS-f3-L, CMCC CMCC-ESM2, KIOST KIOST-ESM, NASA GISS-E2-1-G, NCAR CESM2-WACCM-FV2, and NCC NorCPM1 reproduced strong ENSO teleconnections in regions beyond the tropical Pacific. Full article
Show Figures

Figure 1

17 pages, 5425 KiB  
Article
Data-Driven Prediction of Severe Convection at Deutscher Wetterdienst (DWD): A Brief Overview of Recent Developments
by Richard Müller and Axel Barleben
Atmosphere 2024, 15(4), 499; https://doi.org/10.3390/atmos15040499 - 19 Apr 2024
Viewed by 381
Abstract
Thunderstorms endanger life and infrastructure. The accurate and precise prediction of thunderstorms is therefore helpful to enable protection measures and to reduce the risks. This manuscript presents the latest developments to improve thunderstorm forecasting in the first few hours. This includes the description [...] Read more.
Thunderstorms endanger life and infrastructure. The accurate and precise prediction of thunderstorms is therefore helpful to enable protection measures and to reduce the risks. This manuscript presents the latest developments to improve thunderstorm forecasting in the first few hours. This includes the description and discussion of a new Julia-based method (JuliaTSnow) for the temporal extrapolation of thunderstorms and the blending of this method with the numerical weather prediction model (NWP) ICON. The combination of ICON and JuliaTSnow attempts to overcome the limitations associated with the pure extrapolation of observations with atmospheric motion vectors (AMVs) and thus increase the prediction horizon. For the blending, the operational ICON-D2 is used, but also the experimental ICON-RUC, which is implemented with a faster data assimilation update cycle. The blended products are evaluated against lightning data. The critical success index (CSI) for the blended RUC product is higher for all forecast time steps. This is mainly due to the higher resolution of the AMVs (prediction hours 0–2) and the rapid update cycle of ICON-RUC (prediction hours 2–6). The results demonstrate the potential of the rapid update cycle to improve the short-term forecasts of thunderstorms. Moreover, the transition between AMV-driven nowcasting to NWP is much smoother in the blended RUC product, which points to the advantages of fast data assimilation for seamless predictions. The CSI is well above the critical value of 0.5 for the 0–2 h forecasts. Values below 0.5 mean that the number of hits (correct informations) is lower than the number of failures, which results from the missed cells plus false alarms. The product is then no longer useful in forecasting thunderstorms with a spatial accuracy of 0.3 degrees. Unfortunately, with RUC, the CSI also drops below 0.5 when the last forecast is more than 3 h away from the last data assimilation, indicating the lack of model physics to accurately predict thunderstorms. This lack is simply a result of chaos theory. Within this context, the role of NWP in comparison with artificial intelligence (AI) is discussed, and it is concluded that AI could replace physical short-term forecasts in the near future. Full article
Show Figures

Figure 1

27 pages, 8647 KiB  
Article
An Update of the NeQuick-Corr Topside Ionosphere Modeling Based on New Datasets
by Michael Pezzopane, Alessio Pignalberi, Marco Pietrella, Haris Haralambous, Fabricio Prol, Bruno Nava, Artem Smirnov and Chao Xiong
Atmosphere 2024, 15(4), 498; https://doi.org/10.3390/atmos15040498 - 18 Apr 2024
Viewed by 283
Abstract
A new analytical formula for H0, one of the three parameters (H0, g, and r) on which the NeQuick model is based to describe the altitude profile of the electron density above the F2-layer peak height [...] Read more.
A new analytical formula for H0, one of the three parameters (H0, g, and r) on which the NeQuick model is based to describe the altitude profile of the electron density above the F2-layer peak height hmF2, has recently been proposed. This new analytical representation of H0, called H0,corr, relies on numerical grids based on two different types of datasets. On one side, electron density observations by the Swarm satellites over Europe from December 2013 to September 2018, and on the other side, IRI UP (International Reference Ionosphere UPdate) maps over Europe of the critical frequency of the ordinary mode of propagation associated with the F2 layer, foF2, and hmF2, at 15 min cadence for the same period. The new NeQuick topside representation based on H0,corr, hereafter referred to as NeQuick-corr, improved the original NeQuick topside representation. This work updates the numerical grids of H0,corr by extending the underlying Swarm and IRI UP datasets until December 2021, thus allowing coverage of low solar activity levels, as well. Moreover, concerning Swarm, besides the original dataset, the calibrated one is considered, and corresponding grids of H0,corr calculated. At the same time, the role of g is investigated, by considering values different from the reference one, equal to 0.125, currently adopted. To understand what are the best H0,corr grids to be considered for the NeQuick-corr topside representation, vertical total electron content data for low, middle, and high latitudes, recorded from five low-Earth-orbit satellite missions (COSMIC/FORMOSAT-3, GRACE, METOP, TerraSAR-X, and Swarm) have been analyzed. The updated H0,corr grids based on the original Swarm dataset with a value for g = 0.15, and the updated H0,corr grids based on the calibrated Swarm dataset with a value for g = 0.14, are those for which the best results are obtained. The results show that the performance of the different NeQuick-corr models is reliable also for low latitudes, even though these are outside the spatial domain for which the H0,corr grids were obtained, and are dependent on solar activity. Full article
Show Figures

Figure 1

18 pages, 15144 KiB  
Article
Quantifying the Atmospheric Water Balance Closure over Mainland China Using Ground-Based, Satellite, and Reanalysis Datasets
by Linghao Zhou, Yunchang Cao, Chuang Shi, Hong Liang and Lei Fan
Atmosphere 2024, 15(4), 497; https://doi.org/10.3390/atmos15040497 - 18 Apr 2024
Viewed by 372
Abstract
Quantifying the atmospheric water balance is critical for the study of hydrological processes in significant regions. This study quantified atmospheric water balance closure at 205 stations in mainland China on a monthly timescale from 2009 to 2018 using datasets from ground- and satellite-based [...] Read more.
Quantifying the atmospheric water balance is critical for the study of hydrological processes in significant regions. This study quantified atmospheric water balance closure at 205 stations in mainland China on a monthly timescale from 2009 to 2018 using datasets from ground- and satellite-based observations and reanalysis data. The closure performances were firstly quantified using the mean and root mean square (RMS) of the residuals, and the possible influencing factors were explored, as well as the influence of different water balance components (WBCs) using different datasets. In the closure experiment using ERA5, the mean and residuals were 6.26 and 12.39 mm/month, respectively, on average, which indicated a closure uncertainty of 12.8%. Using ERA5 analysis as a reference, the closure experiment using different combinations revealed average mean residuals of 8.73, 11.50, and 15.89 mm/month, indicating a precipitation closure uncertainty of 22.0, 23.7, and 24.4% for the ground- and satellite-based observations and reanalysis data, respectively. Two possible influencing factors, station latitude and the climatic zone in which the station is located, were shown to be related to closure performance. Finally, the analysis of the impact from different WBCs showed that precipitation tended to have the most significant impact, which may have been due to larger observation uncertainties. Generally, the atmospheric water balance in mainland China can be closed using datasets from different observational techniques. Full article
Show Figures

Figure 1

9 pages, 3254 KiB  
Communication
Application of Lattice Boltzmann Approach for Teaching a Rock Mass Seepage Mechanics Course
by Yanan Miao, Guangchuan Li, He Ma, Gang Zhou and Haoran Li
Atmosphere 2024, 15(4), 496; https://doi.org/10.3390/atmos15040496 - 18 Apr 2024
Viewed by 319
Abstract
The technology of CO2 geological storage and CH4 intensive mining (CO2-ECBM) in coal seams integrates greenhouse gas emission reduction and new fossil energy development and has great development prospects. The CO2 injection, CO2 sequestration mechanism and storage [...] Read more.
The technology of CO2 geological storage and CH4 intensive mining (CO2-ECBM) in coal seams integrates greenhouse gas emission reduction and new fossil energy development and has great development prospects. The CO2 injection, CO2 sequestration mechanism and storage capacity, and CH4 stimulation effect constitute the core content of the effectiveness of CO2-ECBM, among which CO2 injection is the most critical. Traditional seepage analysis methods often struggle to tackle flow-related issues influenced by microscale effects and intricate channels. This paper highlights the advantages of employing lattice Boltzmann (LBM) numerical simulations to study CO2 seepage behaviors when teaching a Rock Mass Seepage Mechanics Course. This course primarily covers topics such as the pore structure of rock, unstable liquid seepage, gas seepage theory and related subjects. Its goal is to provide students with a solid theoretical foundation to address the complexities of fluid seepage in pours media encountered in practical scenarios. A novel LBM-based methodology was employed to estimate the CO2 seepage capacity by incorporating the effects of different concentrations of [Bmin]Cl solution (0 wt%, 1 wt%, 3 wt%, and 5 wt%). The CO2 velocity distribution cloud map of each coal sample was simulated; the average velocity distribution curve of each coal sample was obtained; and the velocity profile of the seepage channel of each coal sample was described. This study can provide theoretical guidance for the technology of CO2 geological storage and CH4 intensive mining in coal seams. Full article
(This article belongs to the Special Issue CO2 Geological Storage and Utilization (2nd Edition))
Show Figures

Figure 1

19 pages, 8377 KiB  
Article
Research on a Rainfall Prediction Model in Guizhou Based on Raindrop Spectra
by Fuzeng Wang, Xuejiao An, Qiusong Wang, Zixin Li, Lin Han and Debin Su
Atmosphere 2024, 15(4), 495; https://doi.org/10.3390/atmos15040495 - 17 Apr 2024
Viewed by 257
Abstract
Our study and analysis of the distribution differences in raindrop spectra in a Guizhou precipitation prediction model were of great significance for understanding precipitation microphysical processes and improving radar quantitative precipitation prediction. This article selected the Dafang, Majiang, and Luodian stations at different [...] Read more.
Our study and analysis of the distribution differences in raindrop spectra in a Guizhou precipitation prediction model were of great significance for understanding precipitation microphysical processes and improving radar quantitative precipitation prediction. This article selected the Dafang, Majiang, and Luodian stations at different altitudes in Guizhou and analyzed the distribution characteristics of precipitation particles at different altitudes. This article used precipitation data from the new-generation Doppler weather radar, OTT-Parsivel laser raindrop spectrometer, and automatic meteorological observation stations in Guiyang via M-P and GAMMA and established methods to fit the particle size of raindrop spectrum precipitation. Based on the LSTM neural network method, we constructed a precipitation prediction model for Guizhou and conducted performance testing. The results show that (1) the precipitation particles at the three stations are all concentrated in small particle size areas, with a peak value of 0.312 mm and a final falling velocity of 1–5 m/s, and the particle size increases with a decreasing altitude. The contribution rate to the density of particles with a precipitation particle size of less than 1 mm exceeds 80% and decreases with a decreasing altitude. The average volume diameter of precipitation particles has the highest correlation with the precipitation intensity. (2) In the fitting of the raindrop spectrum distribution, the GAMMA distribution fitted by the three stations has a better effect and the fitting effect gradually improves with an increasing altitude. (3) In precipitation prediction for convective clouds and stratiform clouds, the 60 min prediction results are the most consistent with the actual precipitation, with correlation coefficients of 0.9287 and 0.9257, respectively, indicating that the prediction has high reliability. Full article
Show Figures

Figure 1

33 pages, 6490 KiB  
Review
Some Early Studies of Isotropic Turbulence: A Review
by John Z. Shi
Atmosphere 2024, 15(4), 494; https://doi.org/10.3390/atmos15040494 - 17 Apr 2024
Viewed by 308
Abstract
A re-examination of some early classic turbulence literature, mainly of isotropic turbulence, is given in this selective review. Some early studies, including original concepts and points, are reviewed or highlighted. Two earliest studies and six major original concepts are found: (i) Lord Kelvin’s [...] Read more.
A re-examination of some early classic turbulence literature, mainly of isotropic turbulence, is given in this selective review. Some early studies, including original concepts and points, are reviewed or highlighted. Two earliest studies and six major original concepts are found: (i) Lord Kelvin’s pioneering elementary studies of homogeneous, isotropic turbulence; (ii) Kelvin’s early introduction of Fourier Principles into turbulence studies; (iii) the Kelvin elementary concept of the direct energy cascade; (iv) the Kelvin early concept of the symmetry of turbulence; (v) the Taylor concept of the coefficient of eddy viscosity; (vi) the Taylor concept of the ‘age’ of the eddy; (vii) the Taylor–Fage–Townend concept of small eddies or microturbulence or small scale turbulence; and (viii) the Obukhov concept of a function of the inner Reynolds number (i.e., Re dependent coefficient) in both the balance equation and the energy distribution equation (the two-thirds law). Both Kelvin and Taylor should be regarded as the co-founders of the statistical theory of homogeneous, isotropic turbulence. The notion, ‘the Maxwell–Reynolds decomposition of turbulent flow velocity’, should be used. The Kolmogorov–Obukhov scaling laws are reviewed in detail. Heisenberg’s inverse seventh power spectrum is briefly reviewed. The implications or significances of these early studies, original concepts and points are briefly discussed, with special reference to their possible links with modern approaches and theories. Full article
(This article belongs to the Special Issue Isotropic Turbulence: Recent Advances and Current Challenges)
Show Figures

Figure 1

13 pages, 3986 KiB  
Article
Characteristics of Atmospheric Pollutants in Paddy and Dry Field Regions: Analyzing the Oxidative Potential of Biomass Burning
by Myoungki Song, Minwook Kim, Sea-Ho Oh, Geun-Hye Yu, Seoyeong Choe, Hajeong Jeon, Dong-Hoon Ko, Chaehyeong Park and Min-Suk Bae
Atmosphere 2024, 15(4), 493; https://doi.org/10.3390/atmos15040493 - 17 Apr 2024
Viewed by 369
Abstract
This study aimed to identify the characteristics of atmospheric pollutants emitted by agricultural activities and to evaluate factors that may cause harm to human health. For the research, atmospheric pollutants were measured over the course of a year in representative rice farming and [...] Read more.
This study aimed to identify the characteristics of atmospheric pollutants emitted by agricultural activities and to evaluate factors that may cause harm to human health. For the research, atmospheric pollutants were measured over the course of a year in representative rice farming and field crop farming areas in South Korea. The results confirmed that the characteristics of atmospheric pollutants in agricultural areas are influenced by the nature of agricultural activities. Specifically, when comparing rice paddies and field crop areas, during summer, the correlation between oxidative potential and levoglucosan—a marker for biomass burning—weakens due to less burning activity in the rice-growing season, leading to lower oxidative potential despite different PM2.5 across areas. The study also finds that methyl sulfonic acid, indicating marine influence, plays a big role in keeping oxidative potential low in summer. This suggests that the main causes of PM2.5-related health risks in the area are from biomass burning and external sources, with burning being a significant factor in increasing oxidative potential. Based on these results, it is hoped that measures can be taken in the future to reduce atmospheric pollutants in agricultural areas. Full article
(This article belongs to the Special Issue Novel Insights into Air Pollution over East Asia)
Show Figures

Graphical abstract

15 pages, 11891 KiB  
Article
Identification of Actual Irrigated Areas in Tropical Regions Based on Remote Sensing Evapotranspiration
by Haowei Xu, Hao Duan, Qiuju Li and Chengxin Han
Atmosphere 2024, 15(4), 492; https://doi.org/10.3390/atmos15040492 - 16 Apr 2024
Viewed by 298
Abstract
Amidst global climate change and unsustainable human exploitation of water resources, water has emerged as a critical factor constraining global agricultural food production and ecological environments. Particularly in agricultural powerhouses like China, irrigation water accounts for a significant portion of freshwater resource utilization. [...] Read more.
Amidst global climate change and unsustainable human exploitation of water resources, water has emerged as a critical factor constraining global agricultural food production and ecological environments. Particularly in agricultural powerhouses like China, irrigation water accounts for a significant portion of freshwater resource utilization. However, the inefficiency of irrigation water usage has become a weak link in water resource management. To better assess irrigation water efficiency, an accurate estimation of regional irrigated areas is urgently needed. This study proposes a method for identifying actual irrigated areas based on remote sensing-derived evapotranspiration (ET) to address the challenge of accurately interpreting irrigated areas in tropical regions. Using Yunnan Province’s Yuanmou irrigation district as a case study, this research combined ground monitoring data and remote sensing data to identify actual irrigated areas through ET inversion and downscaling methods using the Penman–Monteith–Leuning (PML) model. In 2023, the total irrigated area interpreted from remote sensing in the study area was approximately 15,000 hm2, with a comparison against validation points revealing an extraction error of 16%. The small error indicates that this method can effectively enhance the reliability of monitoring actual irrigated areas, thus providing valuable data support for agricultural irrigation water management. Full article
(This article belongs to the Special Issue Agriculture-Climate Interactions in Tropical Regions)
Show Figures

Figure 1

18 pages, 15060 KiB  
Article
Spatiotemporal Dynamics of Vegetation Productivity and Its Response to Meteorological Factors in China
by Enjun Gong, Zhijin Ma, Zhihui Wang and Jing Zhang
Atmosphere 2024, 15(4), 491; https://doi.org/10.3390/atmos15040491 - 16 Apr 2024
Viewed by 351
Abstract
Climate is one of the key factors driving changes in vegetation, and the response of the vegetation to climate often occurs with a time delay. However, research on the cumulative lagged response of the vegetation to meteorological factors in large-scale regions is limited. [...] Read more.
Climate is one of the key factors driving changes in vegetation, and the response of the vegetation to climate often occurs with a time delay. However, research on the cumulative lagged response of the vegetation to meteorological factors in large-scale regions is limited. Therefore, this study first evaluated the performance of the Gross Primary Productivity (GPP) products provided by Moderate Resolution Imaging Spectroradiometer (MODIS) and Penman–Monteith–Leuning (PML) over the past 20 years in China and then determined the lagged relationships between the GPP and major meteorological factors in different regions and land-use types in China based on a partial correlation analysis. The results indicate that (1) GPP_PML outperforms GPP_MODIS products in the regional context of China; (2) China’s regional GPP has shown a fluctuating upward trend over the past 20 years, with a stepwise increase in the multi-year average from the northwest inland to the southeast coastal regions, and a higher contribution from the southern regions than the northern ones; (3) unlike the recent upward trend in regional temperatures, both precipitation and radiation have decreased, with these two factors showing completely opposite multi-year trends in most regions; and (4) the proportion of regions with lagged effects of the GPP on meteorological factors is higher than those with cumulative effects in China. Among these, GPP exhibits a higher proportion of a 3-month lagged response to precipitation, which is particularly pronounced at altitudes between 500 and 2500 m and above 5500 m. the proportion of the areas with no lag cumulative response to temperature and radiation with GPP in China is the highest due to the influence of more barren land and grassland in the northwest interior. Simultaneously, grassland and barren land have a higher proportion of the non-lagged cumulative responses to temperature and precipitation. This study contributes to our understanding of vegetation dynamics in the context of global climate change and provides a theoretical foundation for regional ecological conservation and high-quality coordinated development. Full article
(This article belongs to the Section Climatology)
Show Figures

Figure 1

28 pages, 81499 KiB  
Article
Mid- and High-Latitude Electron Temperature Dependence on Solar Activity in the Topside Ionosphere through the Swarm B Satellite Observations and the International Reference Ionosphere Model
by Alessio Pignalberi, Vladimir Truhlik, Fabio Giannattasio, Igino Coco and Michael Pezzopane
Atmosphere 2024, 15(4), 490; https://doi.org/10.3390/atmos15040490 - 16 Apr 2024
Viewed by 374
Abstract
This study focuses on the open question of the electron temperature (Te) variation with solar activity in the topside ionosphere at mid- and high latitudes. It takes advantage of in situ observations taken over a decade (2014–2023) from Langmuir probes [...] Read more.
This study focuses on the open question of the electron temperature (Te) variation with solar activity in the topside ionosphere at mid- and high latitudes. It takes advantage of in situ observations taken over a decade (2014–2023) from Langmuir probes on board the low-Earth-orbit Swarm B satellite and spanning an altitude range of 500–530 km. The study also includes a comparison with Te values modeled using the International Reference Ionosphere (IRI) model and with Millstone Hill (42.6° N. 71.5° W) incoherent scatter radar observations. The largest Te variation with solar activity was found at high latitudes in the winter season, where Te shows a marked decreasing trend with solar activity in the polar cusp and auroral regions and, more importantly, at sub-auroral latitudes in the nightside sector. Differently, in the summer season, Te increases with solar activity in the polar cusp and auroral regions, while for equinoxes, variations are smaller and less clear. Mid-latitudes generally show negligible Te variations with solar activity, which are mostly within the natural dispersion of Te observations. The comparison between measured and modeled values highlighted that future implementations of the IRI model would benefit from an improved description of the Te dependence on solar activity, especially at high latitudes. Full article
(This article belongs to the Special Issue Effect of Solar Activities to the Earth's Atmosphere)
Show Figures

Figure 1

27 pages, 9410 KiB  
Article
Investigating the Relationship between Precipitation and Vegetation Dynamics with Emphasis on Agricultural Land Cover in the Atrak Basin Area
by Iman Rousta, Fatemeh Shakiba, Haraldur Olafsson, Edgar Ricardo Monroy Vargas, Anna Siedliska and Jaromir Krzyszczak
Atmosphere 2024, 15(4), 489; https://doi.org/10.3390/atmos15040489 - 15 Apr 2024
Viewed by 270
Abstract
The present study aimed to analyze the dynamics of vegetation within the Atrak catchment area, as well as its interplay with precipitation patterns. Moreover, additional emphasis was placed on exploring the impact of these dynamics on agricultural land cover type. To achieve this [...] Read more.
The present study aimed to analyze the dynamics of vegetation within the Atrak catchment area, as well as its interplay with precipitation patterns. Moreover, additional emphasis was placed on exploring the impact of these dynamics on agricultural land cover type. To achieve this objective, the Enhanced Vegetation Index (EVI) derived from MODIS data and the Comprehensive Historical and Real-Time Satellite-based Precipitation (CHRIPS) data were utilized for the period from 2003 to 2021. Additionally, the Vegetation Condition Index (VCI) and Standardized Precipitation Index (SPI) were employed to discern various degrees of drought and pluvial years within the Atrak basin. The study revealed that the years 2008, 2014, 2017, and 2021 exhibited the lowest vegetation coverage, while the years 2010, 2016, and 2019 showcased the most extensive vegetation extent. Notably, it was revealed from the VCI index that the year 2008 was the driest, and the year 2016 was the wettest. Furthermore, based on the SPI index findings, the years 2007, 2019, and 2020 were identified as pluvial years, while in the years 2008, 2014, and 2021 drought conditions occurred. All other years were classified as exhibiting normal conditions. Regarding seasonality, the observations ascertain that the spring season substantiates the most extensive vegetation cover, and a high correlation between spring precipitation and vegetation coverage was observed. Additionally, the anomaly detection outcomes indicate that the eastern regions of the basin have experienced an upward trend compared to the average of the first decade of the studied period. Full article
(This article belongs to the Section Biosphere/Hydrosphere/Land–Atmosphere Interactions)
Show Figures

Figure 1

14 pages, 11063 KiB  
Article
Impact of Climate Change on Extreme Rainfall Events and Pluvial Flooding Risk in the Vojvodina Region (North Serbia)
by Jovana Bezdan, Atila Bezdan, Boško Blagojević, Sanja Antić, Amela Greksa, Dragan Milić and Aleksa Lipovac
Atmosphere 2024, 15(4), 488; https://doi.org/10.3390/atmos15040488 - 15 Apr 2024
Viewed by 425
Abstract
Extreme precipitation events, which are common natural hazards, are expected to increase in frequency due to global warming, leading to various types of floods, including pluvial floods. In this study, we investigated the probabilities of maximum 3-day precipitation amount (Rx3day) occurrences during spring [...] Read more.
Extreme precipitation events, which are common natural hazards, are expected to increase in frequency due to global warming, leading to various types of floods, including pluvial floods. In this study, we investigated the probabilities of maximum 3-day precipitation amount (Rx3day) occurrences during spring in the Vojvodina region, covering both past (1971–2019) and future (2020–2100) periods. We utilized an ensemble of eight downscaled, bias-corrected regional climate models from the EURO-CORDEX project database, selecting the RCP8.5 scenario to examine future Rx3day amounts. The probabilities of occurrences of Rx3day were modeled using the GEV distribution, while the number of events where Rx3day in spring exceeds specific thresholds was modeled using the Poisson distribution. The results indicate that Rx3day with a ten-year return period during the spring months is expected to increase by 19% to 33%. Additionally, the probabilities of having more than one event where Rx3day exceeds thresholds are projected to rise by 105.6% to 200.0% in the future compared to the historical period. The analysis comparing the design values of Rx3day with future projections for the period 2020–2100 revealed that 51 drainage systems are likely to function without difficulties under future climate conditions. However, for the remaining 235 drainage systems, an increased risk of pluvial flooding was identified, as their design precipitation amounts are lower than the future projections. This study reveals that analyzing extreme rainfall events in the context of climate change yields crucial information that facilitates effective planning and policy making in water management, particularly flood protection. Full article
(This article belongs to the Special Issue Climate Change Impacts and Adaptation Strategies in Agriculture)
Show Figures

Figure 1

21 pages, 7477 KiB  
Article
Analyzing the Microscopic Production Characteristics of CO2 Flooding after Water Flooding in Tight Oil Sandstone Reservoirs Utilizing NMR and Microscopic Visualization Apparatus
by Junjie Xue, Hui Gao, Zhanguo Ma, Huaqiang Shi, Xiaoling Li, Teng Li, Zhilin Cheng, Chen Wang, Pan Li and Nan Zhang
Atmosphere 2024, 15(4), 487; https://doi.org/10.3390/atmos15040487 - 15 Apr 2024
Viewed by 443
Abstract
The microscopic pore structure of tight sandstone reservoirs significantly influences the characteristics of CO2 flooding after water flooding. This research was conducted using various techniques such as casting thin sections, high-pressure mercury injection, scanning electron microscopy, nuclear magnetic resonance (NMR) testing, and [...] Read more.
The microscopic pore structure of tight sandstone reservoirs significantly influences the characteristics of CO2 flooding after water flooding. This research was conducted using various techniques such as casting thin sections, high-pressure mercury injection, scanning electron microscopy, nuclear magnetic resonance (NMR) testing, and a self-designed high-temperature and high-pressure microscopic visualization displacement system. Three types of cores with different pore structures were selected for the flooding experiments and the microscopic visualization displacement experiments, including CO2 immiscible flooding, near-miscible flooding, and miscible flooding after conventional water flooding. The characteristics of CO2 flooding and the residual oil distribution after water flooding were quantitatively analyzed and evaluated. The results show the following: (1) During the water flooding process, the oil produced from type I and type III samples mainly comes from large and some medium pores. Oil utilization of all pores is significant for type II samples. The physical properties and pore types have a greater impact on water flooding. Type I and II samples are more suitable for near-miscible flooding after water flooding. Type III samples are more suitable for miscible flooding after water flooding. (2) In CO2 flooding, oil recovery increases gradually with increasing pressure for all three types of samples. Type II core samples have the highest recovery. Before miscibility, the oil recovered from type I and type II samples is primarily from large pores; however, oil recovery mainly comes from medium pores when reaching miscibility. As for the type III samples, the oil produced in the immiscible state mainly comes from large and medium pores, and the enhanced oil recovery mainly comes from medium and small pores after reaching the near-miscible phase. (3) It can be seen from the microscopic residual oil distribution that oil recovery will increase as the petrophysical properties of the rock model improve. The oil recovery rate of near-miscible flooding after water flooding using the type II model is up to 68.11%. The oil recovery of miscible flooding after water flooding with the type III model is the highest at 74.57%. With increasing pressure, the proportion of flake residual oil gradually decreases, while the proportion of droplet-like and film-like residual oil gradually increases. Type II samples have a relatively large percentage of reticulated residual oil in the near-miscible stage. Full article
(This article belongs to the Special Issue CO2 Geological Storage and Utilization (2nd Edition))
Show Figures

Figure 1

16 pages, 7952 KiB  
Article
Cloud Characteristics in South China Using Ka-Band Millimeter Cloud Radar Datasets
by Haowen Li, Chengyan Mao, Huaiyu Li, Jieyi Li, Binghong Chen, Lin Zeng, Jiawen Zheng and Mingtuan Liu
Atmosphere 2024, 15(4), 486; https://doi.org/10.3390/atmos15040486 - 15 Apr 2024
Viewed by 442
Abstract
In this study, we investigate the seasonal and diurnal variations in cloud occurrence frequency, as well as cloud vertical structure (CVS) characteristics under different seasons and precipitation intensities over the Guangzhou region in South China, based on the analysis of millimeter-wave cloud radar [...] Read more.
In this study, we investigate the seasonal and diurnal variations in cloud occurrence frequency, as well as cloud vertical structure (CVS) characteristics under different seasons and precipitation intensities over the Guangzhou region in South China, based on the analysis of millimeter-wave cloud radar (MMCR) and ground automatic weather station rainfall observations from May 2019 to August 2021. The results showed that the occurrence frequency of clouds exhibits a bimodal distribution throughout the year, with peaks in March to June and October, reaching its highest occurrence in May at approximately 80% and its lowest from December to February at around 40%. Additionally, there are distinct diurnal variations in occurrence frequency, with the lowest rates occurring around 0005 LST, rapidly increasing after 0006 LST, and peaking during the afternoon to evening hours. Cloud top height (CTH) shows bimodal distributions during the pre-flood and post-flood seasons. The most frequently occurring range of CTH during the pre-flood season is below 3 km, accounting for approximately 43%, while during the post-flood season, it ranges from 11 to 14 km, constituting about 37%. For precipitation clouds, CTH can extend beyond 12 km, with the radar reflectivity decreasing gradually with increasing height. The highest frequencies of radar echoes are observed below 2 km and between 4 and 7 km, exhibiting clear diurnal variations, with echoes mainly below 2 km and between 4 to 6 km during the early morning, intensifying and shifting to higher altitudes during the day and reaching their maximum below 4 km during the afternoon to nighttime hours, while both the frequency and intensity increase in the height range of 4 to 12 km. Vertical profiles of radar reflectivity and cloud ice/liquid water content (IWC/LWC) exhibit similar trends under different precipitation intensities. The main differences are observed below 4 km, where both radar reflectivity and IWC/LWC generally increase with increasing precipitation intensity. These findings contribute to a better understanding of cloud characteristics in the South China region, enhance the accuracy of model simulations, and provide a scientific basis for accurate forecasting and warning of meteorological disasters. Full article
(This article belongs to the Special Issue Cloud Remote Sensing: Current Status and Perspective)
Show Figures

Figure 1

20 pages, 2433 KiB  
Article
The Spatiotemporal Evolution of the Growing Degree Days Agroclimatic Index for Viticulture over the Northern Mediterranean Basin
by Ioannis Charalampopoulos, Iliana Polychroni, Fotoula Droulia and Panagiotis T. Nastos
Atmosphere 2024, 15(4), 485; https://doi.org/10.3390/atmos15040485 - 14 Apr 2024
Viewed by 609
Abstract
The agricultural sector faces significant challenges worldwide due to climate change. The pressure exerted by altered thermal conditions drives the zonal shift for various cultivations. This study aims to analyze and present the spatiotemporal evolution of the growing degree days (GDD) index in [...] Read more.
The agricultural sector faces significant challenges worldwide due to climate change. The pressure exerted by altered thermal conditions drives the zonal shift for various cultivations. This study aims to analyze and present the spatiotemporal evolution of the growing degree days (GDD) index in the northern Mediterranean Basin (NMB). More specifically, this research presents the multiyear analysis of the GDD index, which is focused on a high-value vine cultivation derived from the E-OBS dataset. The investigated time period spans from 1969 to 2018, and the performed analysis indicates a broad shift/expansion in areas with GDDs exceeding 2000 heat units. This is present in traditional winemaker countries such as France and Italy. Still, it is also evident that there is a high positive change in countries such as Serbia, Bulgaria, and other Balkans countries. The findings may be helpful in the strategic planning of the agricultural sector in these countries or on a vinery scale. Full article
(This article belongs to the Section Biometeorology)
Show Figures

Figure 1

Previous Issue
Next Issue
Back to TopTop