Article

Connection between Barents Sea Ice in May and Early Summer Monsoon Rainfall in the South China Sea and Its Possible Mechanism

1
Key Laboratory of Meteorological Disaster, Ministry of Education, Collaborative Innovation Center on Forecast and Evaluation of Meteorological Disasters (CIC-FEM), Joint International Research Laboratory of Climate and Environment Change (ILCEC), Nanjing University of Information Science and Technology, Nanjing 210044, China
2
Department of Astronomy and Meteorology, Omdurman Islamic University, Omdurman 14415, Sudan
*
Author to whom correspondence should be addressed.
Atmosphere 2024, 15(4), 433; https://doi.org/10.3390/atmos15040433
Submission received: 13 February 2024 / Revised: 10 March 2024 / Accepted: 27 March 2024 / Published: 30 March 2024
(This article belongs to the Special Issue Precipitation Monitoring and Databases)

Abstract

:
The impacts of Arctic sea ice on climate in middle and high latitudes have been extensively studied. However, its effects on climate in low latitudes, particularly on summer monsoon rainfall in the South China Sea (SCS), have received limited attention. Thus, this study investigates the connection between the Arctic sea ice concentration (SIC) anomaly and the early summer monsoon rainfall (ESMR) in the SCS and its underlying physical mechanism. The results reveal a significant positive correlation between the Barents Sea (BS) SIC in May and the ESMR in the SCS. When there is more (less) SIC in the Barents Sea (BS) during May, this results in a positive (negative) anomaly of the local turbulent heat flux, which lasts until June. This, in turn, excites an upward (downward) air motion anomaly in the vicinity of the BS, causing a corresponding downward (upward) motion anomaly over the Black Sea. Consequently, this triggers a wave train similar to the Eurasian (SEU) teleconnection, propagating eastward towards East Asia. The SEU further leads to an (a) upward (downward) motion anomaly and weakens (strengthens) the western Pacific subtropical high (WPSH) over the SCS, which is accompanied by a southwest adequate (scarce) water vapor anomaly transporting from the Indian Ocean, resulting in more (less) precipitation in the SCS. Furthermore, the response of ESMR in the SCS to the SIC in the BS is further verified by using the Community Atmosphere Model version 5.3 (CAM5.3). This study introduces novel precursor factors that influence the South China Sea summer monsoon (SCSSM), presenting a new insight for climate prediction in this region, which holds significant implications.

1. Introduction

Under the background of enhanced global warming, Arctic surface air temperature has a significant warming trend that is twice that of the global average [1,2]. Correspondingly, Arctic sea ice has changed dramatically, experiencing a trend from flat to abrupt [3]. The IPCC Sixth Report (AR6) notes that in the context of global warming, Arctic sea ice in the late 20th century experienced a sharp decadal-scale melting, which could lead to an ice-free period in the summer of the mid-21st century in the Arctic [4]. Dramatic changes in sea ice can lead to significant repercussions, including the extinction of rare species, the disruption of ecosystems, and the exertion of severe impacts on the climate in various regions across the globe.
Many studies have demonstrated that the anomalies of Arctic sea ice have notable impacts on the climate and weather in the mid-high latitudes of Eurasia, e.g., Eurasian atmospheric circulation, spring snowfall in Eurasia, precipitation in East Asia, extreme low-temperature events, and rainfall events in China [2,5,6,7,8,9]. Arctic sea ice is closely linked to the East Asian monsoon; for example, a decrease in winter sea ice in the Davis Strait or an increase in sea ice in the Bering Strait could lead to a weaker East Asian winter monsoon (EAWM) [10,11]. Yang et al. [12] conducted numerical experiments and discovered that an abundance of sea ice in the Greenland Sea–Barents Sea region of the Arctic triggers intensified circulation of the East Asian monsoon. Conversely, excessive sea ice in the East Siberian Sea–Beaufort Sea area weakens East Asian monsoon circulation and heightened monsoon activity over the Indian Peninsula. Zhao et al. [13] and Guo et al. [14] conducted research dedicated to investigating the East Asian summer monsoon (EASM). Specifically, they explored the impact of the spring Arctic sea ice concentration (SIC) on the EASM, highlighting the role of European land and anomalous North Pacific Sea surface temperature (SST) as connecting factors. Their work served as a source of inspiration for our study.
Recently, a study has reported that the impact of Arctic sea ice changes also reaches the tropics, which has attracted widespread attention [15]. Although a considerable number of studies have revealed the impact of Arctic sea ice on the weather and climate in mid-high latitudes, only a few studies have identified connections between the Arctic and the tropics: the El Niño-Southern Oscillation (ENSO), the location of the intertropical convergence zone, and the frequency of tropical cyclones in the northwest Pacific Ocean may have a close relation with Arctic sea ice [16,17,18]. Furthermore, regarding the monsoon in the tropics, Chatterjee et al. [19] noted that the abnormal meridional circulation induced by Arctic sea ice affects the blocking pattern in northwestern Eurasia, thereby exerting an ultimate impact on the extreme precipitation of the Indian summer monsoon. This impact is manifested through its influence on East Asia’s subtropical high and high-altitude and low-altitude configuration.
The South China Sea summer monsoon (SCSSM) is a crucial element of the EASM. Its onset serves as a signal for the shift in atmospheric circulation from winter to summer patterns, marking the commencement of the EASM and the start of the rainy season in China [20,21,22,23]. Hu et al. [24] indicated that ENSO, which is considered the most important influencing factor, has weakened its relationship with SCSSM in recent decades. Thus, more attention should be paid to the relationship between extratropical factors and SCSSM. Hu et al. [23] mentioned that Arctic oscillation (AO) in March contributed to a warm sea surface by forming a low-level cyclone anomaly over the northwest Pacific Ocean, and the cyclonic anomaly sustained throughout the whole spring and moved towards the equator, favoring the conditions for the onset of SCSSM. However, the relationship between Arctic sea ice and the SCSSM is still not fully understood.
Overall, previous studies have predominantly approached the response of the weather and climate in middle and high latitudes to Arctic sea ice anomalies, while there is a scarcity of studies examining the response in the tropics and the possible physical mechanisms, particularly concerning the relationship between Arctic sea ice and the SCSSM, which remains unclear. Hence, it is essential to establish a connection between the Arctic and the tropics. In the present study, we find a significant correlation between the May SIC in the Barents Sea (BS) and the following early summer monsoon rainfall (ESMR) in the South China Sea (SCS). This finding implies that the May SIC in the BS may serve as a potential prediction source of the ESMR in the SCS. Meanwhile, the mechanism between them will also be examined. The remainder of this paper is structured as follows: Section 2 introduces the data, methods, and numerical model. Section 3 focuses on the influence of sea ice on ESMR in the SCS. The linkage between sea ice in the BS and ESMR in the SCS is discussed in Section 3.1. Section 3.2 shows the mechanisms of how sea ice anomalies in BS influence the ESMR in the SCS. The numerical simulation results are given in Section 3.3. Finally, the summary and discussion are presented in Section 4.

2. Materials and Methods

2.1. Data

The monthly reanalysis datasets used in this study are from the National Centers for Environmental Prediction–National Center for Atmospheric Research (NCEP–NCAR), with a horizontal resolution of 2.5° × 2.5° and 17 vertical layers extending from 1000 to 10 hPa [25] for seven parameters, namely, geopotential height (GPH), zonal (U) and meridional (V) winds, vertical velocity (Omega), specific humidity (q), latent heat net flux, and sensible heat net flux. Monthly SIC data are from the Met Office Hadley Centre, with a horizontal resolution of 1.0° × 1.0° [26]. Monthly precipitation data are from the Center for Climate Prediction (CPC) Merged Analysis of Precipitation (CMAP) data, with a horizontal resolution of 2.5° × 2.5° [27]. This global monthly precipitation dataset, established by CPC, integrates diverse sources of precipitation data such as ground rainfall observations, satellite-based precipitation measurements, and NCEP–NCAR reanalysis data. Encompassing a comprehensive global coverage, this dataset exhibits enhanced quality compared to individual data sources. All datasets span from 1979 to 2023.

2.2. Definition of the SCSSM Index

Various definitions of the SCSSM index have been proposed, including the wind field, the average wind field between the high (200 hPa) and low (850 hPa) levels, convection, outgoing long-wave radiation (OLR), divergence difference between high (200 hPa) and low (850 hPa) levels, and the combined definition of these meteorological elements [22,28,29,30]. Each method of definition has its drawbacks, leading to discrepancies in the results. Due to its location in the tropics, it is widely accepted that all summer monsoon precipitation within the tropical monsoon area is regarded as monsoon precipitation. Parthasarathy et al. [31] used the amount of summer rainfall to define the intensity of the Indian summer monsoon. Based on previous studies [32,33] and monitoring by the National Climate Center of China Meteorological Administration, the average onset time of the SCSSM is around the fourth pentad of May, the standardized series of total precipitation in June in the South China Sea (105°–122° E, 5°–22° N) is used as the early summer monsoon rainfall index of the South China Sea (ESMRSCS) in this study.

2.3. Plumb’s Wave Activity Flux

Wave activity flux (WAF) proposed by Plumb [34] is used to detect the propagation of Rossby waves. Based on the method, we calculated the two-dimensional Plumb’s WAF. The WAF formula is as follows:
F s = P P 0 cos φ × v 2 1 2 Ω asin 2 φ v ϕ λ u v + 1 2 Ω asin 2 φ u ϕ λ
where F s denotes the horizontal stationary WAF ( m 2 s 2 ). P is the pressure, P 0 is the baseline pressure (1000 hPa), and ( φ ,   λ ) represents (latitude, longitude). ( a , Ω ) indicate the radius of the Earth and the Coriolis parameter, respectively. The variables marked with a superscript of “′” represent zonal deviation, which means u and v are the zonal deviation of zonal wind and meridional wind, respectively, while ϕ is the zonal deviation of GPH.

2.4. Vertical Integral of Water Vapour Flux

According to Ding et al. [35], the formula for calculating the vertical integral of water vapor flux is as follows:
Q = P 2 P 1 V q g d p
Vector Q can be decomposed into latitudinal water vapor transport component Q λ and meridional water vapor transport component Q ψ :
Q λ = P 2 P 1 u q g d p   Q ψ = P 2 P 1 v q g d p
where ( φ , λ) represents (latitude, longitude), and ( u , v ) are the latitudinal and meridional winds, respectively. P 2 symbolizes the surface air pressure at 1000 hPa while P 1 is set as 300 hPa. Additionally, g denotes gravitational acceleration, and q represents the specific humidity of each atmospheric layer.

2.5. Composite Analysis and Student’s t-Test

In this paper, the composite analysis is computed by subtracting the year of abnormally negative sea ice (NSIC) from the year of positive sea ice (PSIC) years. The significance tests have been conducted on the results of both composite and regression analyses. The calculation formula is as follows:
t = X ¯ 1 X ¯ 2 n 1 1 s 1 2 + n 2 1 s 2 2 n 1 + n 2 2 + ( 1 n 1 + 1 n 2 )
Among them, X ¯ 1 ,   X ¯ 2 s 1 2 ,   s 2 2 , n 1 , n 2 represent the mean, variance, and sample size of two samples, respectively. The aforementioned formula follows a t-distribution with n 1 + n 2 2 degrees of freedom, for the confidence level α ; if | t   | t α , it can be inferred that there exists a statistically significant disparity in the mean values between the two populations [36].

2.6. Numerical Model

To verify the possible physical mechanism of SIC changes influencing the SCSSM obtained from the observed analysis, this study utilizes the Community Atmosphere Model version 5.3 (CAM5.3) within the Community Earth System Model (CESM) [37], which was developed and released by the NCAR in 2012. This flexible model not only functions independently but also allows coupling with various components, including the ocean, land, and sea ice. Compared with previous versions, CAM5.3 incorporates a refined physical parameterization scheme characterized by a novel shallow convection approach that enhances the precision of convective precipitation representation [38]. Numerous studies demonstrate the robust suitability of CAM for regional climate studies for Eurasia [39,40]. The finite-volume dynamical core configured with a horizontal resolution of 1.9°latitude × 2.5°longitude (f19_f19), and 30 vertical hybrid levels are selected. More details about the model can be found in the research conducted by Neale et al. [37].

3. Results

3.1. Relationship between Arctic Sea Ice and the ESMRSCS

Firstly, the Empirical Orthogonal Function (EOF) analysis used here is to capture the primary spatiotemporal variations of ESMRSCS (Figure 1). The first mode of EOF (EOF1) is significantly separated and accounts for 37.63% of the total variance, which passes the North test [41]. EOF1 reflects the primary variation characteristics of ESMRSCS, exhibiting a spatial distribution pattern that is relatively uniform across the SCS (Figure 1a). The corresponding principal component (PC1) shows a substantial interannual variation of ESMRSCS (Figure 1b).
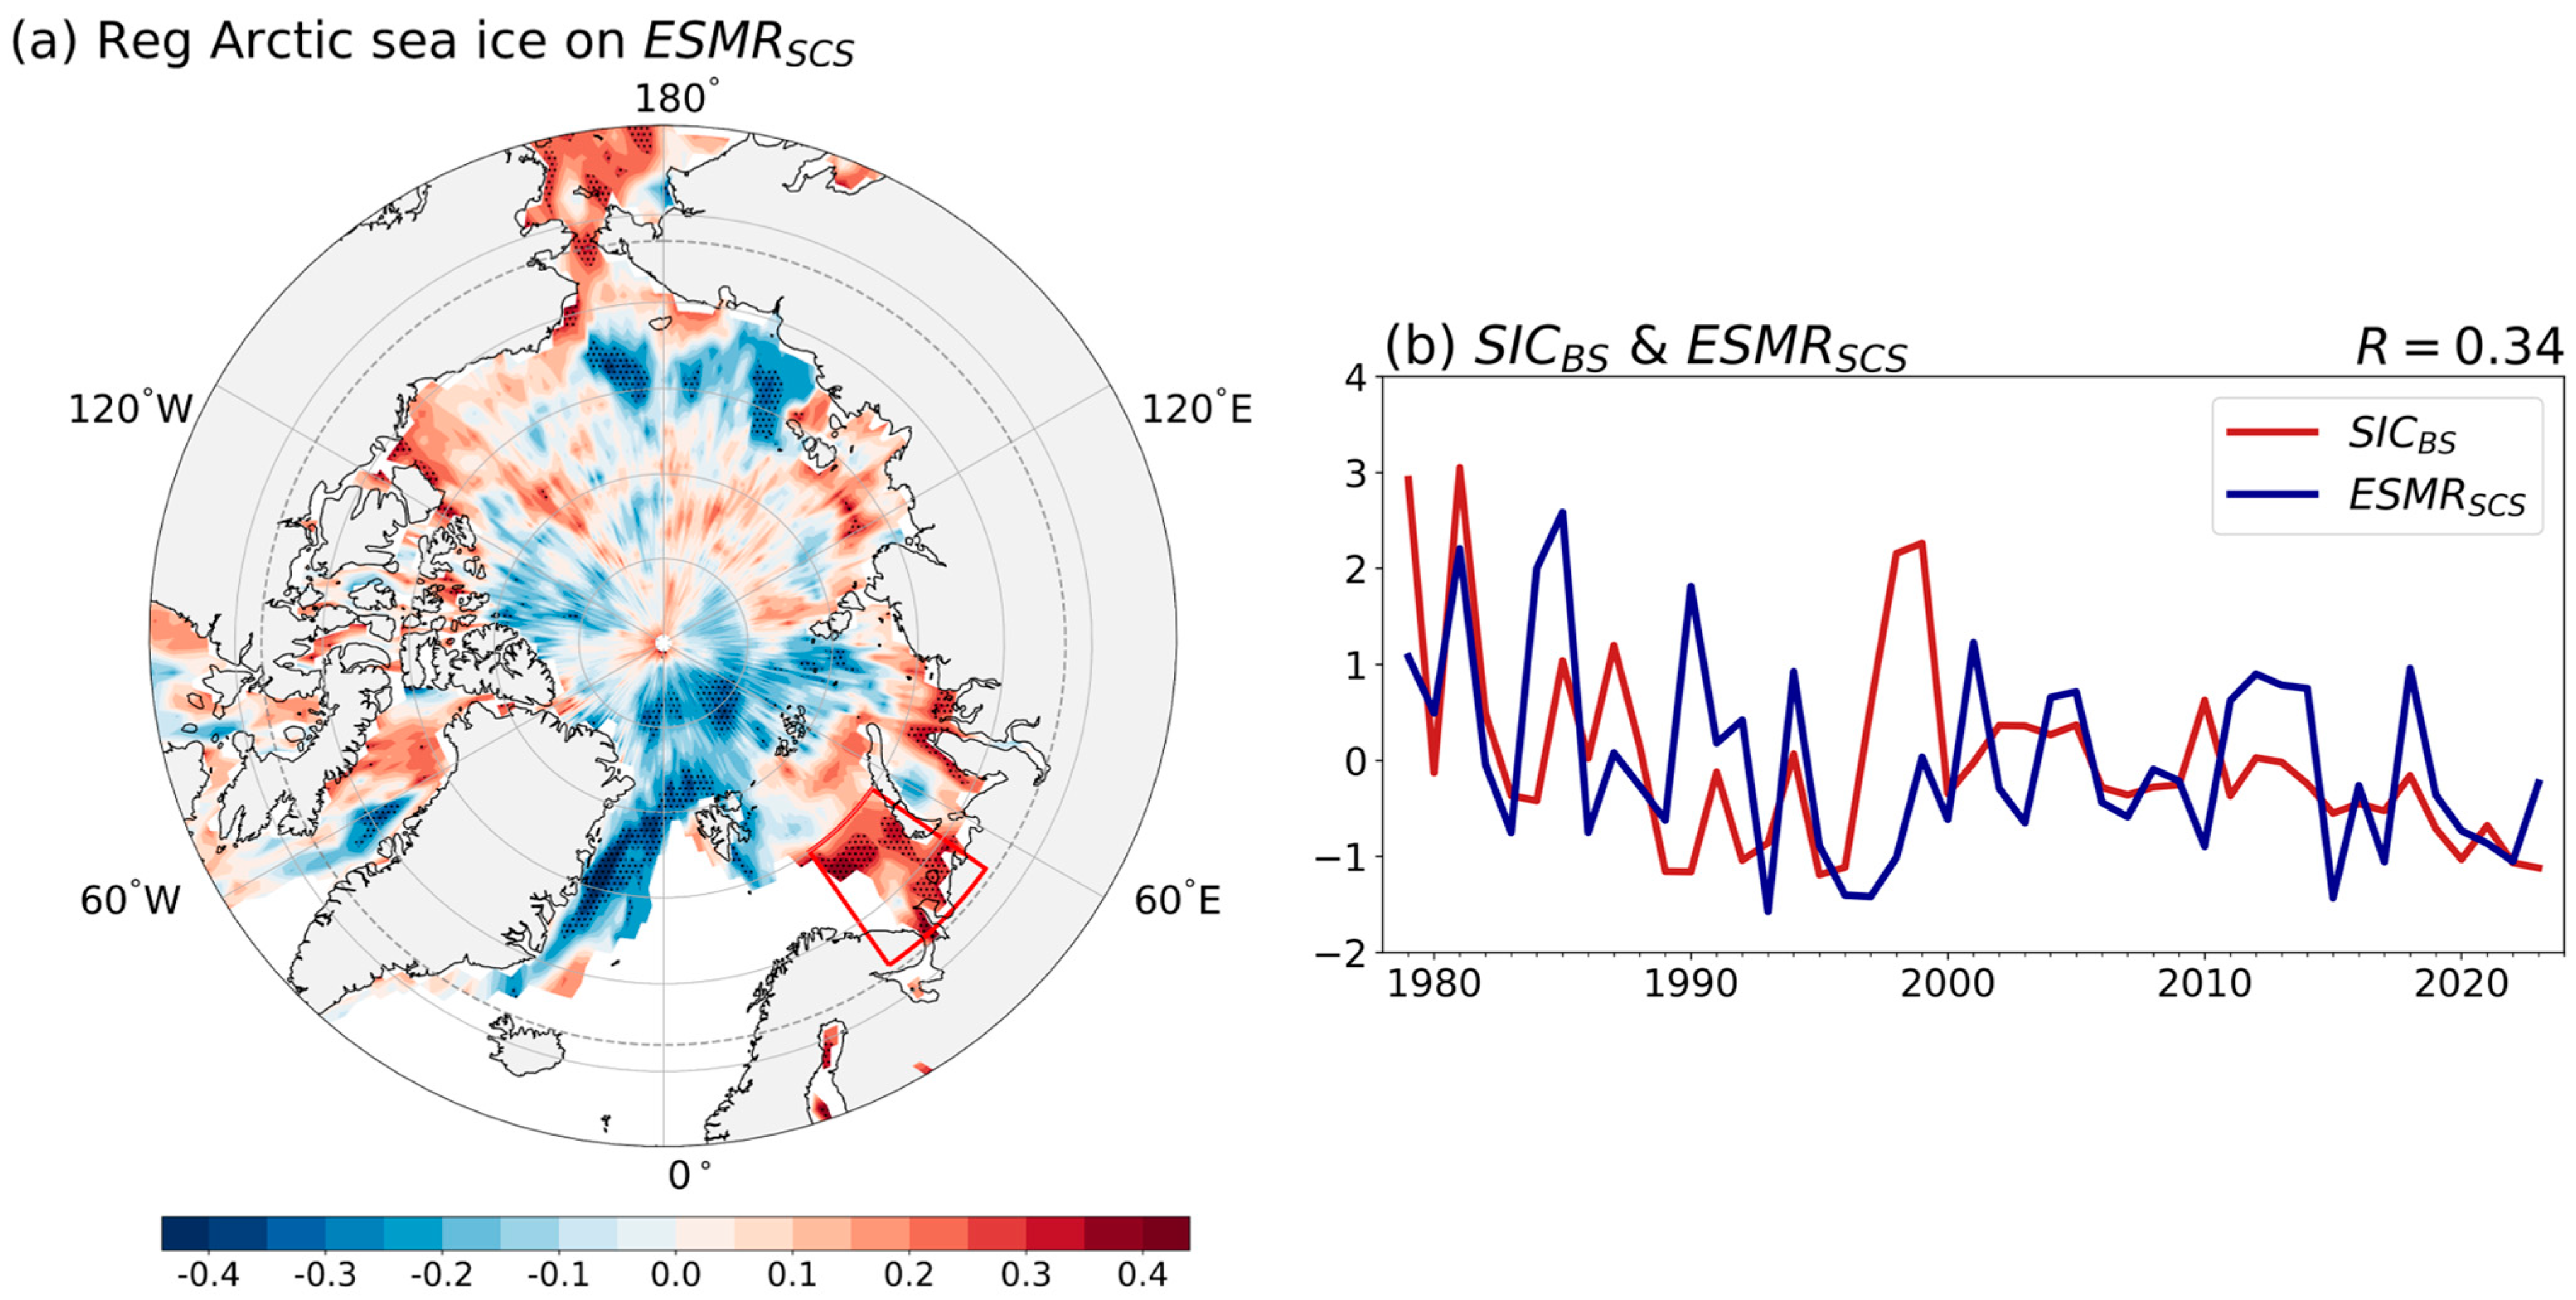
To investigate the relationship between the ESMRSCS and Arctic sea ice, Figure 2a shows the regression of the ESMRSCS onto the Arctic SIC in May from 1979 to 2023. The existence of a notable correlation between ESMRSCS and Arctic SIC in May, preceding the monsoon onset, is particularly evident in the Barents Sea (BS) region. On this basis, calculate the correlation coefficients between SIC in the BS from July of the previous year to June of the current year and ESMRSCS, respectively (Figure omitted). The result reveals that the correlation coefficient between the anomaly of May SICBS (the Sea ice concentration in Barents Sea) and the ESMRSCS has reached a value of 0.34, which is significant at the 95% confidence level (Figure 2b). Consequently, this study specifically selects the May SIC in the BS region (66°–75° N, 35°–55° E) as the key region to investigate the influence on the ESMRSCS.
The correlation analysis results indicate that more SICBS in May is associated with increased ESMRSCS and vice versa. Six years of positive SICBS (PSIC, greater than 1 standard deviation of the normalized SICBS in Figure 1b) including 1979, 1981, 1985, 1987, 1998, and 1999, and eight years of negative SIC (NSIC, lower than −1 standard deviation of the normalized SICBS in Figure 1b) including 1989, 1990, 1992, 1995, 1996, 2020, 2022, and 2023 are selected to further investigate composite analysis. Figure 3 shows the differences in the atmospheric circulation over the SCS between PSIC and NSIC years. The presence of cyclones signifies local convergence, and the coexistence of low-level and high-level convergence creates favorable conditions for precipitation. The noticeable anomalies in wind divergence (convergence) at 200 hPa (Figure 3a) and a (an) cyclonic (anticyclone) anomaly at 850 hPa over the region (Figure 3b) are concurrently accompanied by a substantial upward (downward) motion of air throughout the troposphere over the SCS (Figure 3c) during abnormally positive (negative) SICBS years. Many studies found that the western Pacific subtropical high (WPSH) was closely related to the monsoon activities and corresponding precipitation change in East Asia [42,43,44]. Figure 3b shows the positions of the WPSH characteristic lines 5880 gpm for the PSIC years, climate state, and NSIC years, respectively. In comparison to the climatology of the WPSH, the WPSH in the NSIC years is located westward towards the SCS, whereas it is located eastward during the PSIC years. This finding is consistent with the results of Yu et al. [45], which demonstrated that the SCSSM was weaker (stronger) during the western (eastern) years of the WPSH. With respect to the climatology, there are two notable water vapor transport channels for the SCS, with one from the Bay of Bengal region of the Indian Ocean in the southwest and another from the northwest Pacific region (Figure 4a). The water vapor transporting from the Indian Ocean is especially pronounced when the SICBS exhibits positive anomalies (Figure 4b). Such atmospheric circulation anomalies provide favorable conditions for more rainfall in June in the SCS.

3.2. Possible Mechanism of SICBS in May Affecting the ESMRSCS

Exploring the mechanism of the SICBS in May influencing the ESMRSCS is crucial for further confirming the linkage between them. Screen et al. [46] suggested that the reduction in sea ice may lead to changes in surface heat fluxes and further potentially affect the atmospheric circulation. Figure 5a,b shows the difference in turbulent heat flux (THF, sum of sensible heat flux and latent heat flux) in May and June in the Arctic region between PSIC and NSIC years. The positive anomaly observed over the BS indicates that the May SIC can significantly influence the atmosphere (Figure 5a) and vice versa. The positive anomaly of THF extends westward and covers the western area of the BS, which indicates that the net THF is upward in these regions (Figure 5b). Consequently, thermal conditions around the BS have changed, which is a process of sea ice affecting the atmosphere. For additional clarity, Figure 5c depicts the anomaly in isobaric vertical velocity. The THF anomaly at high latitudes induces ascending air motion in the BS, while descending air motion predominates in the mid-latitudes around the Black Sea region. This leads to the establishment of a meridional circulation cell anomaly.
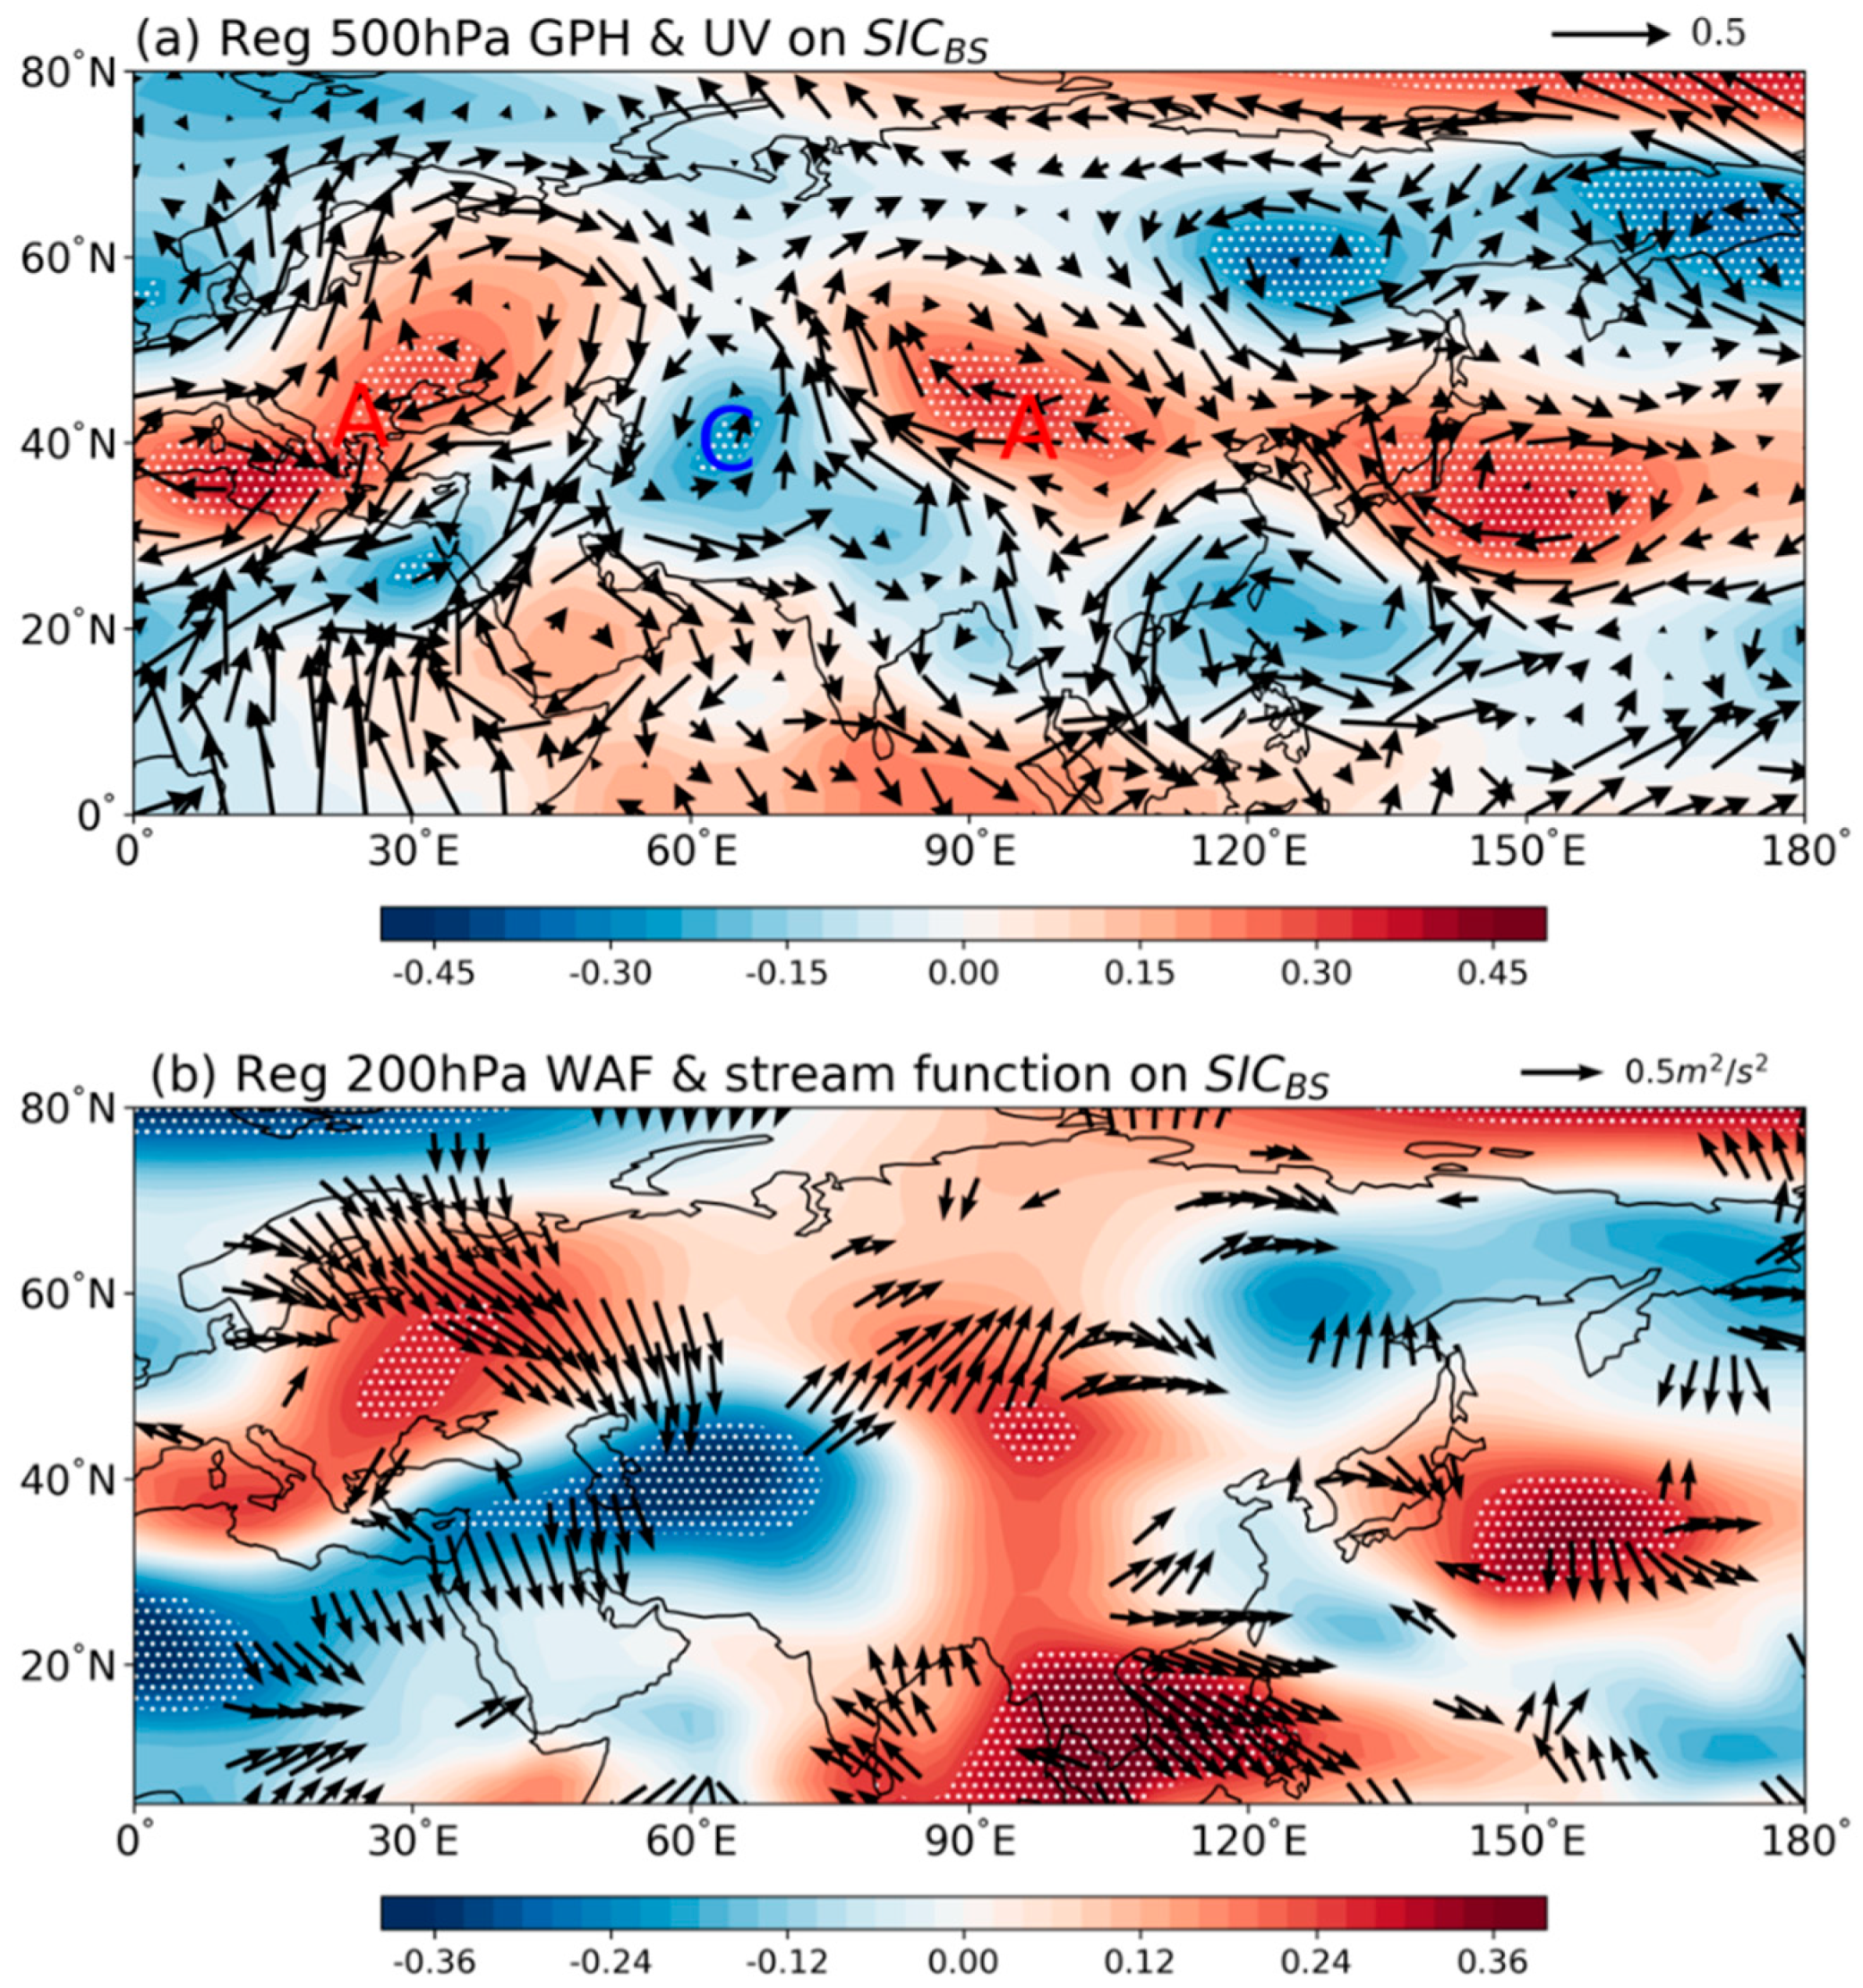
Figure 6 depicts the regression of circulation anomalies at 500 hPa and Rossby wave propagation at 200 hPa on SICBS. Three centers of atmospheric circulation anomalies are situated in the Black Sea region, the Iranian Plateau, the Tibetan Plateau region, and the Mongolian Plateau region, showing a “positive, negative, positive” anomalies pattern from west to east, respectively, which is similar to the structure of the Eurasian pattern (EU) teleconnection (Figure 6a). The anticyclonic anomaly over the Black Sea acts as the source, and the eastward propagation of the wave activity flux (WAF) corresponds to the precipitation anomaly in the SCS (Figure 6b). The positions of the anomaly centers align closely with those in Figure 6a.
In the middle latitudes of Eurasia, considering the “positive, negative, positive“ pattern of atmospheric circulation anomalies, we applied the methodology for defining the EU teleconnection index adopted by Wallace et al. [47] to define the similar-EU teleconnection index for identifying the Similar-Eurasian teleconnection pattern (SEU):
S E U = 1 4 G P H 35 ° N , 15 ° E 1 2 G P H 30 ° N , 55 ° E + 1 4 G P H ( 45 ° N , 90 ° E )
where GPH denotes the geopotential height anomaly at 500 hPa. The relationships between the SEU index, the SICBS, and the ESMRSCS were investigated, revealing correlation coefficients of 0.38 and 0.30, respectively, significant at the 95% and 90% confidence levels. This suggests that the SEU exhibits a certain correlation with SICBS and ESMRSCS, potentially serving as a “bridge” linking the Arctic and the tropic in this study.
To further explain the formation of the rainfall anomalies over the SCS, the vertical velocity anomalies associated with the SICBS and SEU are shown in Figure 7. It can be found that the SICBS and SEU are closely related to the vertical velocity over the SCS (Figure 7a,b). Thus, we defined the vertical velocity index OmegaSCS for the whole layer (1000 hPa–100 hPa) in the SCS and computed its correlation with SICBS, SEU, and ESMRSCS as −0.35, −0.52, and −0.77, respectively. All these correlations are significant at the 95% confidence level, and their time series are depicted in Figure 7c. Evidently, the sea ice anomaly affects the vertical velocity over the SCS by exciting the SEU teleconnection wave train, which subsequently influences the precipitation of the summer monsoon in the SCS. Furthermore, according to the monthly average 500 hPa Western Pacific Subtropical High Area (WPSHA) index and Western Pacific Subtropical High Intensity (WPSHI) index released by the Climate Diagnosis Office of the National Climate Center of China Meteorological Administration, their correlations with the SEU and ESMRSCS are shown in Table 1. The findings indicate a significant negative correlation between the SEU and ESMRSCS with both the area and intensity of the WPSH. These results suggest that the SEU influences the atmospheric circulation and precipitation over the SCS by impacting the extent and strength of the WPSH. Additionally, the correlation coefficient between the SEU and the GPH of the cyclonic anomaly in the SCS at 500 h Pa is −0.53. These findings further confirm that the SEU serves as a “bridge”, connecting Arctic sea ice and monsoon rainfall.
All the correlation coefficients in Table 1 are significant at the 90% confidence level.

3.3. Numerical Experiments

To investigate the response of atmospheric circulation anomalies to SICBS, the CAM5.3, the atmospheric module of the Community Earth System Model 1.2.2 (CESM 1.2.2), with a horizontal resolution of 1.9° × 2.5° and a total of 30 vertical layers [37], was used to verify the physical mechanism proposed based on the observed analysis. Firstly, we ran a control experiment for 30 years by the forcings of seasonal-varying climatology. Then, we conducted two sensitivity experiments named HBS and LBS for 12 months from January to December. For each sensitivity experiment, the abnormal increase and decrease in sea ice in the BS in May are respectively forced, and all other external variables are held constant. On January 1, the initial conditions were different, and the average results of 30 sets of ensemble tests were obtained for analysis. The detailed simulation scheme and SIC forcing distribution are given in Table 2.
We present the experimental results by HBS minus LBS, in which the circulation anomalies respond to SICBS in the sensitivity experiment and the comparison with the observed results is shown in Figure 8. The results show that the positive anomaly SIC in the BS will lead to a “positive, negative, positive“ anomaly pattern structure in the middle latitudes of Eurasia. Coincidentally, there is a cyclonic anomaly at 850 hPa in the SCS with a positive rainfall anomaly. For the key mechanisms for SICBS influencing ESMRSCS, in which the SEU serves as the bridge to link them, the numerical simulations are consistent with the observational results, albeit with deviations in the central locations. The above illustrates that the experiments simulated the atmospheric circulation links between SIC changes in the BS and the ESMR in the SCS.

4. Conclusions and Discussion

4.1. Conclusions

Based on the NCEP/NCAR reanalysis dataset, the CAMP precipitation dataset, and the Hadley Center SIC dataset, we found that there is a certain positive correlation between the May SICBS and the ESMRSCS, and we further analyzed the specific influence mechanism of the two as follows: When the SICBS is abnormally positive (negative) in May, the local net THF anomaly is directed upwards (downwards), causing the ocean to release energy to the atmosphere, which is a process of ice affecting the atmosphere and vice versa. This initiates an upward (downward) air motion anomaly around the BS region at high latitudes, accompanied by a downward (upward) air motion anomaly in the mid-latitudes of the Black Sea region, resulting in the formation of a meridional circulation cell anomaly. Subsequently, this circulation pattern facilitates the transmission of Arctic signals to East Asia through the SEU teleconnection at mid-latitudes. The teleconnection of the SEU influences the vertical upward (downward) motion and the extent and intensity of the WPSH in the SCS. These changes impact the atmospheric circulation, resulting in the development of a (an) cyclone (anticyclone) anomaly in the middle and lower layers, and the southwest water vapor anomaly transport from the Indian Ocean served as an extra vapor source for ESMRSCS. Collectively, these factors all ultimately lead to the positive (negative) anomaly of ESMRSCS. To gain a deeper understanding of the observations, numerical experiments were performed using the CAM5.3. The results support the observed physical mechanism in which the SEU in the middle latitudes of Eurasia plays a crucial bridge role.

4.2. Discussion

Previous studies on the relationship between Arctic sea ice and monsoons mostly focused on subtropical monsoons such as EAWM [10,11] and EASM [12,13,14]. It has been suggested that European land, anomalous North Pacific SST, and the Silk Road tele-connection could potentially act as conduits for transmitting the Arctic sea ice influence on regions at mid-to-low latitudes [13,14,39]. This study pays special attention to the linkage between the tropical SCSSM and the Arctic SIC in the pre-monsoon period and the possible mechanisms of their connection, proposing the result of the SEU teleconnection as a “bridge”, which establishes the connection between the Arctic and the tropics, and provides a new insight for forecasting the SCSSM.
The above diagnostic analysis revealed the influence of the Arctic sea ice anomaly on the ESMR in the SCS through the SEU teleconnection. Nevertheless, a more specific mechanism needs to be further analyzed, and it is unclear whether there are other influencing factors. Meanwhile, it is essential to note that the melting rate of SIC has substantially accelerated due to the intensifying global warming. Thus, further analysis is needed to explore whether the close connection between the SICBS and ESMRSCS will change in the future before the ice-free condition occurs in the BS and then consider the potential impact of Arctic regional circulation and whether new “connecting bridges” will emerge after the ice-free condition occurs in the BS in the future, which would be an interesting issue.

Author Contributions

Formal analysis, F.L. and G.Z.; writing—original draft, F.L. and G.Z.; writing—review and editing, F.L., G.Z., S.Z. and M.H. All authors have read and agreed to the published version of the manuscript.

Funding

This research was funded by the National Key Research and Development Program of China (2022YFF0801704) and the National Natural Science Foundations of China (42175035), as well as the National Key Scientific and Technological Infrastructure project “Earth System Numerical Simulation Facility” (EarthLab).

Institutional Review Board Statement

Not applicable.

Informed Consent Statement

Not applicable.

Data Availability Statement

CPC Merged Analysis of Precipitation (CMAP) data and NCEP-NCAR Reanalysis data are both provided by the NOAA PSL, can be found at: https://psl.noaa.gov, accessed on 12 February 2024. The monthly sea ice concentration data are obtained from the Met Office Hadley Centre website: https://www.metoffice.gov.uk/hadobs/index.html, accessed on 12 February 2024.

Acknowledgments

We acknowledge the High Performance Computing Center of Nanjing University of Information Science and Technology provides support for the numerical simulations of this study, and we also thank two anonymous reviewers for valuable comments and suggestions.

Conflicts of Interest

The authors declare no conflicts of interest.

References

  1. Bekryaev, R.V.; Polyakov, I.V.; Alexeev, V.A. Role of polar amplification in long-term surface air temperature variations and modern Arctic warming. J. Clim. 2010, 23, 3888–3906. [Google Scholar] [CrossRef]
  2. Gao, Y.; Sun, J.; Li, F.; He, S.; Sandven, S.; Yan, Q.; Zhang, Z.; Lohmann, K.; Keenlyside, N.; Furevik, T.; et al. Arctic Sea ice and Eurasian climate: A review. Adv. Atmos. Sci. 2015, 32, 92–114. [Google Scholar] [CrossRef]
  3. Zhang, L.; Zhang, Z.; Li, Q.; Wu, H. Abnormal change trend of Arctic Sea ice in recent 30 years. Chin. J. Polym. Sci. 2009, 21, 344–352. (In Chinese) [Google Scholar]
  4. IPCC. Climate Change 2021: The Physical Science Basis. Contribution of Working Group Ito the Sixth Assessment Report of the Intergovernmental Panel on Climate Change; IPCC: Geneva, Switzerland, 2021. [Google Scholar]
  5. Song, H.; Sun, Z. Temporal and spatial distribution of summer drought and flood in North China and its relationship with Arctic Sea ice. Trans. Atmos. Sci. 2003, 26, 289–295. (In Chinese) [Google Scholar]
  6. Wu, B.; Zhang, R.; D’Arrigo, R.; Sun, J. On the Relationship between Winter Sea Ice and Summer Atmospheric Circulation over Eurasia. J. Clim. 2013, 26, 5523–5536. [Google Scholar] [CrossRef]
  7. You, C.; Li, Y.; Song, W. Effects of autumn Arctic sea ice on winter extreme low temperature events over China from 1978 to 2017. J. Lanzhou Univ. (Nat. Sci. Ed.) 2022, 58, 510–527. (In Chinese) [Google Scholar]
  8. Zhang, M.; Sun, J.; Gao, Y. Possible influence and prediction value of sea ice anomaly in Davis Channels-Baffin Bay region on spring extreme precipitation frequency in eastern China. Earth Sci. Front. 2022, 29, 401–409. (In Chinese) [Google Scholar]
  9. Zhang, X.; Ding, S.; Pang, X.; Zhang, X.; Liu, L. Relationship between Arctic sea ice melt and spring precipitation over East Asia. J. Glaciol. Geocryol. 2023, 45, 655–664. (In Chinese) [Google Scholar]
  10. Zeng, G.; Sun, Z.; Min, J. Study on the relationship between interannual variation of sea ice extent in winter Davis Strait and East Asian climate. J. Nanjing Inst. Meteorol. 2001, 24, 476–482. (In Chinese) [Google Scholar]
  11. Li, F.; Wang, H. Relationship between Bering Sea Ice Cover and East Asian Winter Monsoon Year-to-Year Variations. Adv. Atmos. Sci. 2013, 30, 48–56. [Google Scholar] [CrossRef]
  12. Yang, X.; Xie, Q.; Huang, S. Numerical simulation of the impact of Arctic ice anomalies on the Asian summer monsoon. Acta Oceanol. Sin. 1994, 16, 34–40. (In Chinese) [Google Scholar]
  13. Zhao, P.; Zhang, X.; Zhou, X.; Ikeda, M.; Yin, Y. The sea ice extent anomaly in the North Pacific and its impact on the East Asian summer monsoon rainfall. J. Clim. 2004, 17, 3434–3447. [Google Scholar] [CrossRef]
  14. Guo, D.; Gao, Y.; Bethke, I.; Gong, D.; Johannessen, O.M.; Wang, H. Mechanism on how the spring Arctic Sea ice impacts the East Asian summer monsoon. Theor. Appl. Climatol. 2014, 115, 107–119. [Google Scholar] [CrossRef]
  15. England, M.R.; Polvani, L.M.; Sun, L.; Deser, C. Tropical climate responses to projected Arctic and Antarctic sea-ice loss. Nature Geosci. 2020, 13, 275–281. [Google Scholar] [CrossRef]
  16. Wang, K.; Deser, C.; Sun, L.; Tomas, R.A. Fast Response of the Tropics to an Abrupt Loss of Arctic Sea Ice via Ocean Dynamics. Geophys. Res. Lett. 2018, 45, 4264–4272. [Google Scholar] [CrossRef]
  17. Sun, L.; Deser, C.; Tomas, R.A.; Alexander, M. Global Coupled Climate Response to Polar Sea Ice Loss: Evaluating the Effectiveness of Different Ice-Constraining Approaches. Geophys. Res. Lett. 2023, 47, e2019GL085788. [Google Scholar] [CrossRef]
  18. Chen, S.; Chen, W.; Yu, B.; Wu, L.; Chen, L.; Li, Z.; Aru, H.; Huangfu, J. Impact of the winter Arctic sea ice anomaly on the following summer tropical cyclone genesis frequency over the western North Pacific. Clim. Dyn. 2023, 61, 3971–3988. [Google Scholar] [CrossRef]
  19. Chatterjee, S.; Ravichandran, M.; Murukesh, N.; Raj, N.P.; Johannessen, O.M. A possible relation between Arctic sea ice and late season Indian Summer Monsoon Rainfall extremes. Npj Clim. Atmos. Sci. 2021, 4, 36. [Google Scholar] [CrossRef]
  20. Lau, K.M.; Yang, S. Climatology and interannual variability of the southeast Asian summer monsoon. Adv. Atmos. Sci. 1997, 14, 141–162. [Google Scholar] [CrossRef]
  21. Wang, B.; Lin, H.; Zhang, Y.; Lu, M.M. Definition of South China Sea monsoon onset and commencement of the East Asia summer monsoon. J. Clim. 2004, 17, 699–710. [Google Scholar] [CrossRef]
  22. Zheng, B.; Li, C.; Lin, A.; Gu, D.; He, C. Definition and application of activity indicators for the South China Sea summer monsoon. J. Trop. Meteorol. 2016, 32, 433–443. (In Chinese) [Google Scholar]
  23. Hu, P.; Chen, W.; Chen, S.; Liu, Y.; Huang, R. Impact of the March Arctic Oscillation on the South China Sea summer monsoon onset. Int. J. Climatol. 2020, 41, E3239–E3248. [Google Scholar] [CrossRef]
  24. Hu, P.; Chen, W.; Chen, S.; Wang, L.; Liu, Y. The Weakening Relationship between ENSO and the South China Sea Summer Monsoon Onset in Recent Decades. Adv. Atmos. Sci. 2022, 39, 443–455. [Google Scholar] [CrossRef]
  25. Kalnay, E.; Kanamitsu, M.; Kistler, R.; Collins, W.G. The NCEP/NCAR 40-year reanalysis project. Bull. Amer. Meteor. Soc. 1996, 77, 437–472. [Google Scholar] [CrossRef]
  26. Rayner, N.A.; Parker, D.E.; Horton, E.B.; Folland, C.K.; Alexander, L.V.; Rowell, D.P.; Kent, E.C.; Kaplan, A. Global analyses of sea surface temperature, sea ice, and night marine air temperature since the late nineteenth century. J. Geophys. Res. 2003, 108, 1063–1082. [Google Scholar] [CrossRef]
  27. Xie, P.; Arkin, P.A. Global precipitation: A 17-year monthly analysis based on gauge observations, satellite estimates, and numerical model outputs Bull. Am. Meteor Soc. 1997, 78, 2539–2558. [Google Scholar] [CrossRef]
  28. Webster, P.J.; Yang, S. Monsoon and ENSO: Selectively interactive systems. Quart. J. Roy. Meteor. Soc. 1992, 118, 877–926. [Google Scholar] [CrossRef]
  29. Li, C.; Zhang, L. Summer Monsoon Activities in the South China Sea and Its Impacts. Chin. J. Atmos. Sci. 1999, 23, 257–266. (In Chinese) [Google Scholar] [CrossRef]
  30. Wu, S.; Liang, J. Intensity index of the South China Sea summer monsoon and its variation characteristics. J. Trop. Meteorol. 2001, 17, 337–344. [Google Scholar]
  31. Parthasarathy, B.; Munot, A.A.; Kothawale, D.R. All-India monthly and seasonal rainfall series: 1871–1993. Theor. Appl. Climatol. 1994, 49, 217–224. [Google Scholar] [CrossRef]
  32. Liang, J.; Wu, S. A Study of Southwest Monsoon Onset Date over the South China Sea and Its Impact Factors. Chin. J. Atmos. Sci. 2002, 26, 829–844. (In Chinese) [Google Scholar]
  33. Li, D.; Jiang, Y.; Zhang, L.; Wang, H.; Li, X. Onset and retreat dates of the South China Sea summer monsoon and their relationships with the monsoon intensity in the context of climate warming. J. Trop. Meteorol. 2016, 22, 362–373. (In Chinese) [Google Scholar]
  34. Plumb, R.A. On the three-dimensional propagation of stationary waves. J. Atmos. Sci. 1985, 42, 217–229. [Google Scholar] [CrossRef]
  35. Ding, Y. Advanced Weather Science; China Meteorological Press: Beijing, China, 2005; 585p. [Google Scholar]
  36. Fisher, B. Guinness, Gosset, Fisher, and Small Samples. Stat. Sci. 1987, 1, 45–52. [Google Scholar]
  37. Neale, R.B.; Gettelman, A.; Park, S.; Conley, A.J.; Kinnison, D.; Marsh, D.; Smith, A.; Vitt, F.; Morrison, H.; Cameron-smith, P.; et al. Description of the NCAR Community Atmosphere Model (CAM 5.0). In NCAR Tech. Note NCAR/TN-486+ STR; NCAR Publication Office: Boulder, CO, USA, 2010; 274p. [Google Scholar]
  38. Bretherton, C.S.; Park, S. A new moist turbulence parameterization in the community atmosphere model. J. Clim. 2009, 12, 3422–3448. [Google Scholar] [CrossRef]
  39. Duan, S.; Jiang, Z. Sensitivity of Northern Hemisphere atmosphere in winter to sea ice anomalies in the Barents Sea in autumn and winter. Acta Meteorol. Sin. 2021, 79, 209–228. (In Chinese) [Google Scholar]
  40. He, S.; Gao, Y.; Furevik, T.; Wang, H.; Li, F. Teleconnection between sea ice in the Barents Sea in June and the Silk Road, Pacific–Japan and East Asian rainfall patterns in August. Adv. Atmos. Sci. 2018, 35, 52–64. [Google Scholar] [CrossRef]
  41. North, G.R.; Bell, T.L.; Cahalan, R.F.; Moeng, F.J. Sampling errors in the estimation of empirical orthogonal functions. Mon. Weather Rev. 1982, 110, 699–706. [Google Scholar] [CrossRef]
  42. Huang, S. Study on the east-west movement of the subtropical high and its forecast. Acta Meteorol. Sin. 1963, 33, 320–332. (In Chinese) [Google Scholar]
  43. Tao, S.; Wei, J. The Westward, Northward Advance of the Subtropical High over the West Pacific in Summer. J. Appl. Meteor. 2006, 05, 513–525. [Google Scholar]
  44. Zhao, J.; Feng, G.; Yang, J.; Zhi, R.; Wang, Q. Analysis of the distribution of the large scale drought/flood of summer in China under different types of the western Pacific subtropical high. Acta Meteorol. Sin. 2012, 70, 1021–1031. (In Chinese) [Google Scholar]
  45. Yu, D.; Zhang, Y.; Zhao, C.; Wan, L.; Guo, X. Correlation between the subtropical high abnormal longitudinal position and the East Asian summer monsoon system. Trans. Atmos. Sci. 2014, 37, 304–312. (In Chinese) [Google Scholar]
  46. Screen, J.A.; Simmonds, I.; Deser, C.; Tomas, R. The atmospheric response to three decades of observed Arctic sea ice loss. J. Clim. 2013, 26, 1230–1248. [Google Scholar] [CrossRef]
  47. Wallace, J.M.; Gutzler, D.S. Teleconnections in the geopotential height field during the Northern Hemisphere winter. Mon. Weather Rev. 1981, 109, 784–812. [Google Scholar] [CrossRef]
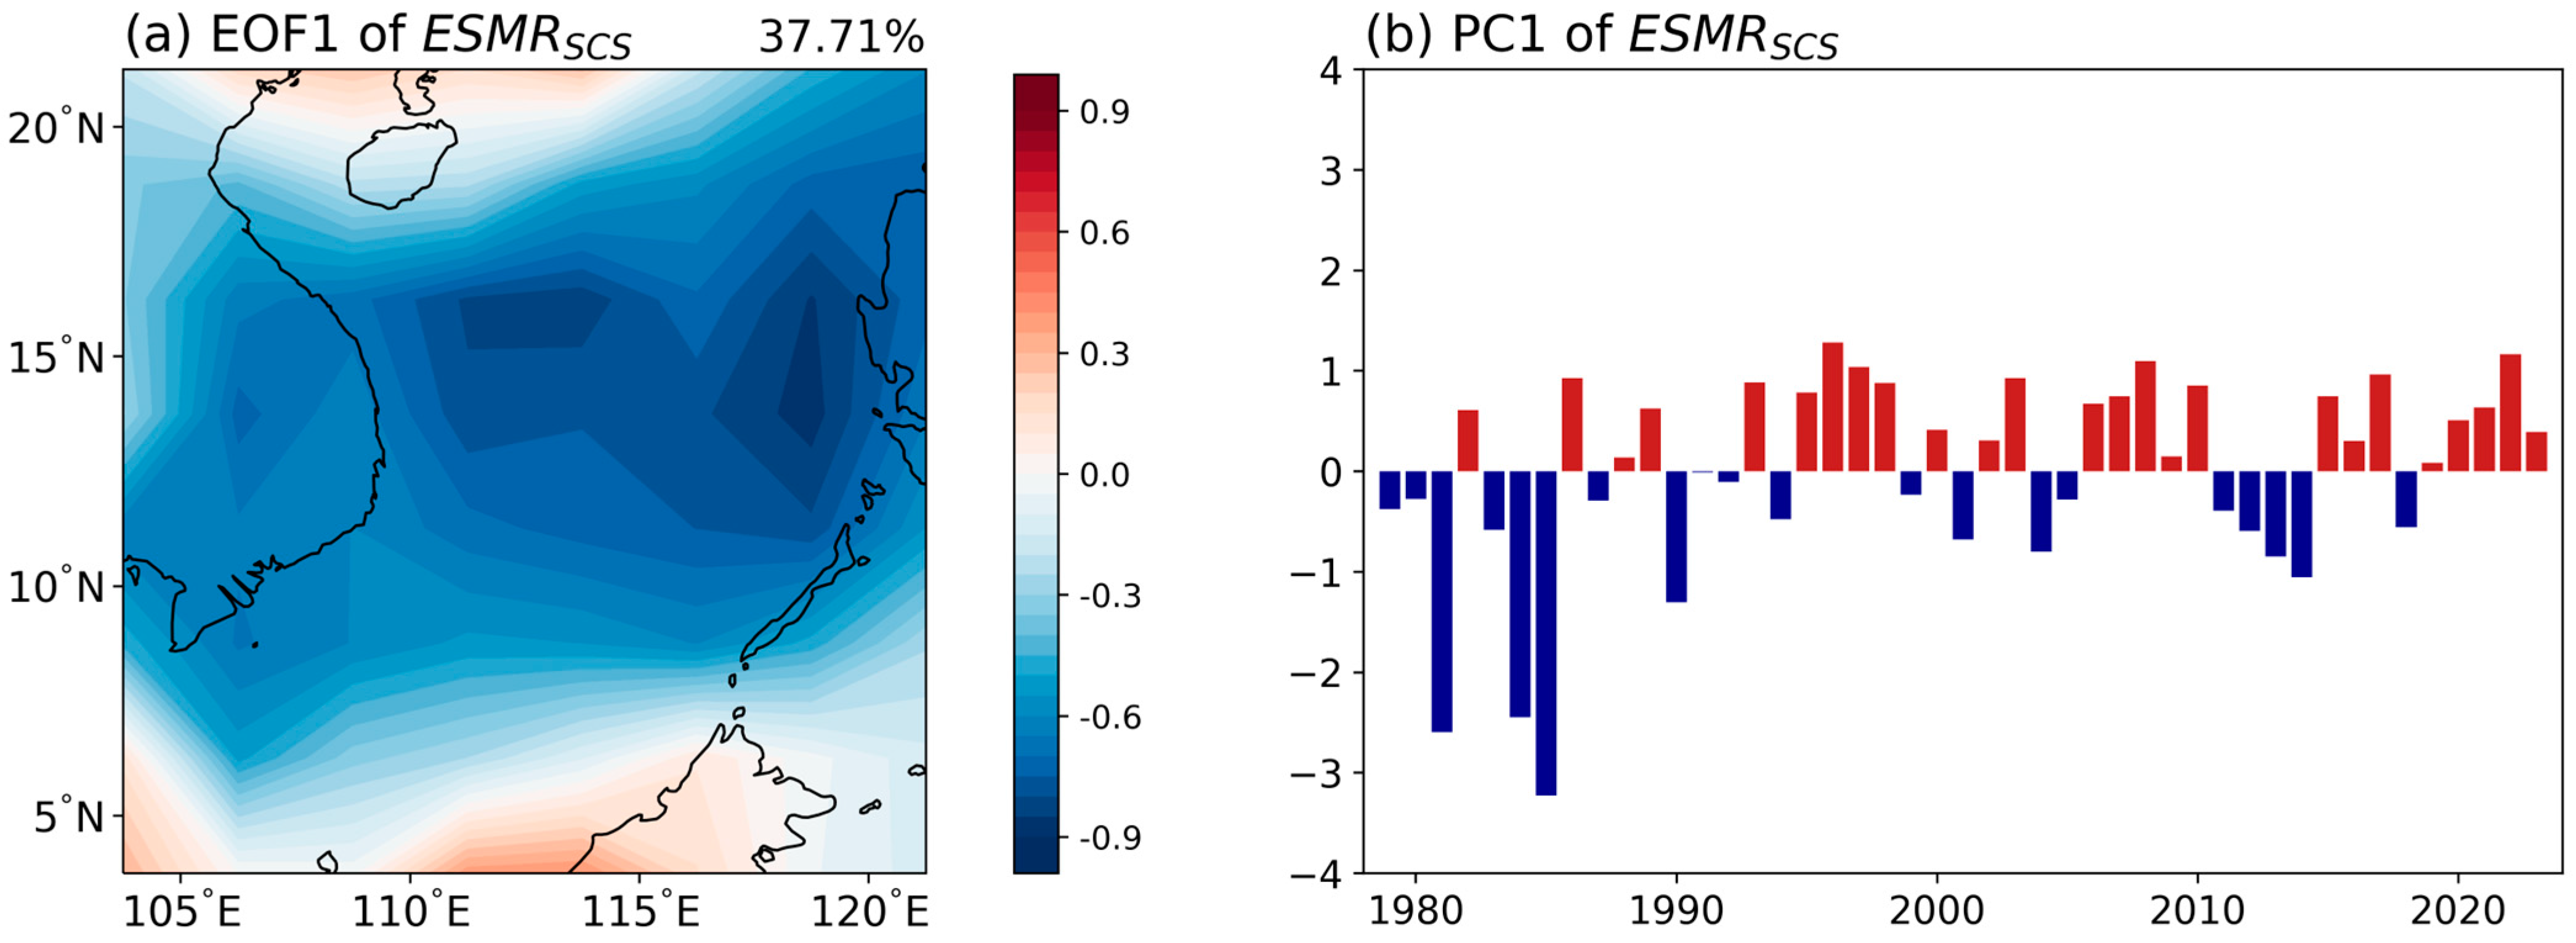
Figure 1. The (a) spatial distribution and (b) principal component of the leading EOF mode for ESMRSCS.
Atmosphere 15 00433 g001
Figure 2. (a) Regression of the May Arctic SIC (shadings; %) onto the ESMRSCS (Dotted areas are significant at 90% confidence level; The red box denotes the BS region: 66°–75° N, 35°–55° E); (b) time series of ESMRSCS (blue line) and SICBS (red line).
Atmosphere 15 00433 g002
Figure 3. The differences of velocity potential (shadings; 10 6   m 2 s 1 ) and divergence wind (vectors; m s 1 ) at 200 hPa (a), GPH (shadings; g p m ) and horizontal winds (vectors; m s 1 ) at 850 hPa (b), and isobaric vertical velocity ( P a   s 1 , negative values indicate upward air movement and positive values indicate downward air movement) averaged over 100°–130° E (c) between PSIC and NSIC years. The lines in (b) represent the PSIC (red line), climatology (black line), and NSIC (blue line) years WPSH characteristic line of 5880 gpm, respectively. The isobaric vertical velocity is scaled by 1000. Dotted areas are significant at the 90% confidence level.
Atmosphere 15 00433 g003
Figure 4. (a) Climatology of the vertical integral of water vapor flux (from 1000–300 hPa, k g   m 1 s 1 ) in June; (b) differences of the vertical integral of water vapor flux between PSIC and NSIC years. (The red box is the SCS area studied in this paper, and the dotted areas are significant at the 90% confidence level).
Atmosphere 15 00433 g004
Figure 5. The differences of turbulent heat flux ( W · m 2 ) in May (a) and June (b) between PSIC and NSIC years; (c) The difference isobaric vertical velocity ( P a   s 1 ) averaged over 10°–50° E between PSIC and NSIC years. The isobaric vertical velocity is scaled by 1000. Dotted areas are significant at the 90% confidence level.
Atmosphere 15 00433 g005
Figure 6. Regression of (a) GPH (shadings; g p m ) and horizontal wind (vectors; m s 1 ) at 500 hPa and (b) stream function (shadings; 10 6 ) and WAF (vectors; m 2  s 2 ) at 200 hPa on the SICBS (The dotted area indicates that the GPH and stream function were statistically significant at the confidence level of 90%. Red “A” and blue “C” in (a) represent anticyclonic and cyclonic circulations, respectively. Vectors in (b) represent that the WAF was statistically significant at the confidence level of 90%.)
Atmosphere 15 00433 g006
Figure 7. Regression of vertical velocity (shadings; m s 1 ) averaged over 100°–130° E on the (a) SICBS and (b) SEU (The dotted areas are statistically significant at the confidence level of 90%); (c) time series of ESMRSCS, SICBS, SEU, and OmegaSCS.
Atmosphere 15 00433 g007
Figure 8. The observed (a,c)/simulated (b,d) differences of GPH (shadings; g p m ) and horizontal wind (vectors; m s 1 ) at 500 h Pa and horizontal wind (vectors; m s 1 ) at 850 h Pa and rainfall (shadings; m m   d a y 1 ) between the PSIC and NSIC years/HBS and LBS experiments.
Atmosphere 15 00433 g008
Table 1. Correlation coefficients of the area and intensity of WPSH with SEU and ESMRSCS.
SEUESMRSCS
WPSHA−0.36−0.32
WPSHI−0.33−0.28
Table 2. Descriptions of numerical experiments using the CAM5.3 atmospheric model.
ExperimentsNumbersYearsDescription
HBS301The May SIC in the BS (66°–75° N,35° E–55° E) is the mean SIC of PSIC years, while other regions are climatological SIC/SST. For other seasons, the model is forced by climatological SIC/SST.
LBS301Same as the HBS, but the May SIC in the BS is the mean SIC of NSIC years.
Disclaimer/Publisher’s Note: The statements, opinions and data contained in all publications are solely those of the individual author(s) and contributor(s) and not of MDPI and/or the editor(s). MDPI and/or the editor(s) disclaim responsibility for any injury to people or property resulting from any ideas, methods, instructions or products referred to in the content.