
Different Mechanisms for the Northern and Southern Winter Fog Events over Eastern China
1
State Key Laboratory of Geo-Information Engineering, Xi’an 710054, China
2
Beijing Zhongke Meteorological Intelligence LLC., Beijing 100084, China
*
Author to whom correspondence should be addressed.
Atmosphere 2024, 15(5), 528; https://doi.org/10.3390/atmos15050528
Submission received: 25 March 2024
/
Revised: 17 April 2024
/
Accepted: 20 April 2024
/
Published: 26 April 2024
(This article belongs to the Section Meteorology)
Abstract
:Northern and southern fog events are identified over eastern China across 40 winters from 1981 to 2021. By performing composite analysis on these events, this study reveals that the formation of fog events is controlled by both dynamic and thermodynamic processes. The fog events were induced by Rossby wave trains over the Eurasian continent, leading to the development of surface wind and pressure anomalies, which favor the formation of fog events. The Rossby wave trains in northern and southern fog events are characterized by their occurrence in northern and southern locations, respectively, with different strengths. The water vapor fluxes that contribute to the enhancement of the northern fog events originate from the Yellow Sea and the East China Sea, whereas the southern fog events are characterized by water vapor from the East China Sea and the South China Sea. In both northern and southern fog events, dew point depression and positive A and K index anomalies are found in northern and southern regions of eastern China, which are indicative of supersaturated air and the unstable atmospheric saturation from the low to the middle troposphere, thus providing favorable conditions for the establishment of fog events in northern and southern regions of eastern China.
1. Introduction
Fog is characterized as a phenomenon consisting of suspended water vapor such as water droplets and ice crystals in the boundary layer, which leads to low visibility [1,2]. The occurrence of fog and the accompanying visibility reduction can disrupt air traffic and navigation in marine ports [3,4,5,6]. Aerosols can be concentrated during fog events, leading to severe air pollution and harm to human health [7]. The occurrence of the fog can modify the surface moisture and energy budget, which is important to the weather and climate forecast [4,8].
The formation of the fog is associated with complex interactions between various local meteorological processes such as low-level air temperature, humidity, wind speed, and atmospheric stability [6,9,10]. Extreme fog events happen when the wind speed is low, the humidity is high, and atmospheric stratification is stable; these conditions lead to the accumulation of pollutants and, thus, to severe air pollution [11,12,13,14]. Based on its formation mechanisms, the fog can be classified into four types [15]. Advection fog is formed when the humid air covers a colder surface, and the air temperature drops below the dew point temperature. When the air near the surface cools down due to longwave radiation loss during clear and windless nights, radiation fog occurs. The descent of cloud base fog is caused by the descent of the cloud base down to the surface. Precipitation fog is observed during precipitation or within 1 h after the end of precipitation.
The occurrence of fog over eastern China manifests evident seasonality, with the strongest fog events in winter and the presence of weak fog in summer [16]. Over the past 30 years, the occurrence of the fog events over eastern China has increased twice, and is associated with the weakening of the East Asian winter monsoon (EAWM) [9]. The weakened EAWM leads to warmer temperatures, weaker surface wind, and moister air, producing suitable conditions for fog formation [1]. It has been suggested by other studies that the frequency of fog manifests as a decadal shift, with the fog days increasing and then decreasing around the 1980s [17]. Fu et al. [11] found that the prevalence of fog increased before 1995 and then entered into steady conditions from 1995 to 2003. The long-term variation in the fog is characterized by three interconnected factors: climate change, urbanization, and air pollution. It is found that fog prevalence increased due to the enhancement of aerosols before 1985 and then decreased because of urbanization. Anthropogenic factors such as urbanization and aerosols contribute at least 1.6 times more than climate change to variations in fog occurrence, with urbanization as the dominant factor [17].
The fog events over eastern China are influenced by the Arctic Oscillation (AO). The AO can modulate the mid- and high-latitude circulation and exert influence upon the Siberian high, the East Asian trough, and the jet stream [18,19]. During the positive phase of the AO, the East Asian trough is weakened [20], which leads to weaker surface wind [19]. This prevents the southward intrusion of the northerly wind, resulting in warmer air temperature and humidification over eastern China. Therefore, fog events are more frequent during the positive phase of the AO [2,21]. During the negative AO phase, the fog events are less frequent over eastern China.
The El Niño–Southern Oscillation (ENSO) can affect the East Asian climate by regulating the western North Pacific anticyclone [22,23]. During El Niño years, the anomalous southwesterlies associating with the anticyclonic anomaly over the western Pacific prevents the occurrence of northerly winds over East Asia, transporting moisture and warmer air into eastern China from the ocean, which is favorable for the occurrence of fog events there [2,10,16,24]. The influence of the La Niña on the fog events over eastern China is opposite to that of El Niño. During the eastern Pacific (EP) El Niño, the winter fog frequency is increased, but this does not occur during the central Pacific (CP) El Niño. The winter fog frequency during the CP El Niño is associated with its zonal locations, which are impacted by the different large-scale atmospheric circulations, as well as the differences between air temperature and dew point temperature anomalies [16].
Most of the previous studies about the fog over eastern China were focused on the long-time trend of fog occurrence over the whole region, and the associated interannual variability. It is possible that the mechanism modulating the formation of fog over the northern and southern regions of eastern China is different. Therefore, the analysis of the different processes of the occurrence of fog events over southern and northern parts of eastern China is important for the accurate prediction of fog events over eastern China, which will benefit both disaster prevention and economic development. This paper is organized as follows. In Section 2, the datasets information and methodology are presented. The main findings are described in Section 3. A brief summary and some discussions are given in Section 4.
2. Materials and Methods
The daily observation station visibility and precipitation data obtained from the National Meteorological Information Center of China Meteorological Administration (CMA) (https://data.cma.cn/, accessed on 1 October 2022) in the period from 1981 to 2021 are used in this study. The visibility data are interpolated into a 0.1° × 0.1° horizontal resolution. This study uses daily outputs from the ERA5 reanalysis [25] in the period from 1981 to 2021. The pressure level variables from the ERA5 dataset include geopotential height, meridional and zonal winds, air temperature, and relative humidity. The surface variables include sea-level pressure (SLP), surface air temperature, and surface winds. The variables from ERA5 reanalysis are on a horizontal resolution of 2.5° × 2.5°, with 17 vertical layers from 1000 to 10 hPa for pressure level variables.
The topography of eastern China is characterized by the North China Plain and the Yangtze Plain (Figure 1a,b). The mountainous regions such as the Qinling Mountains, Dabie Mountains, and Wuyi Mountains are situated to the west and southwest of these plains, which provide natural barriers of climates. The climate in the northern part of eastern China is manifested as a temperate continental climate with cold and dry winters. The climate in the region to the south of the Yangtze River is subtropical, with mild and humid winters.
The standard deviation of the daily visibility during winter is presented in Figure 1c. The variability in daily visibility over eastern China (110° E–120° E, 25° N–40° N) is evident compared with other regions. It can be noticed that a smaller value of standard deviation appears around 30° N, separating the region into northern (110° E–120° E, 30° N–40° N) and southern (110° E–120° E, 25° N–30° N) subregions. Therefore, we focus on the daily fog variabilities over the northern and southern regions separately in this study. We define fog events across 40 winters (December–January–February) from 1981 to 2021 in both regions when the regional mean visibility is less than 1000 m (https://glossary.ametsoc.org/wiki/Fog, accessed on 1 December 2022) for at least three consecutive days and the relative humidity is larger than 80% for the southern region and 70% for the northern region, with no precipitation to exclude other low-visibility weather such as rain, snow, or dust storms [10]. We choose different relative humidity thresholds for northern and southern regions because, in the northern region, the relative humidity is generally lower compared with the southern region. If we set the threshold in the northern region the same as the southern region, the number of northern fog events would be too few, which makes the statistical significance of the composite analysis less confident. The requirement of three consecutive days can exclude those events that are too regional or short living. The day with minimum visibility within a fog event is marked as day 0 of this event. In the 40 winters from 1981 to 2021, we have identified 52 events for the northern region and 50 events for the southern region (Table 1 and Table 2). We perform composite analysis on these events to show the process for the occurrence of fog events over the northern and southern eastern China. The significance test of the composite analysis is evaluated by Student’s t-test.
The Rossby wave activity flux [26] is used in this study to illustrate the propagation of the Rossby wave train during the evolution of the fog events. The wave activity flux can be written as:
In the above equation, represents climatological mean horizontal wind in the winter, where is horizontal wind anomaly, is geostrophic stream function anomaly, is the gas constant of dry air, is the Coriolis parameter at 45° N, denotes the square of the buoyancy frequency, is the perturbation air temperature, represents the pressure divided by 1000 hPa, and is the scale height. The subscripts and are zonal and meridional partial derivatives, respectively. Prime represents the value with the climatological mean removed.
In order to diagnose the thermodynamic instability of the atmosphere during the fog events, the K index and A index are used [7]. The K index and A index can be written as:
where T and Td are air temperature and dewpoint, and the subscripts of 500, 700, and 850 represent the corresponding levels. In the weather forecast operations, both K and A indices are frequently used to judge the stability of atmospheric stratification, which is important to the formation of the fog. Furthermore, the effects of vertical temperature gradients in lower and middle troposphere are considered in both K and A indices. For the purpose of judging the stability of atmospheric stratification, both indices take the saturation conditions of water vapor in the entire lower and middle troposphere into account, which makes it useful in the diagnosis of the thermodynamical process for fog formation.
3. Results
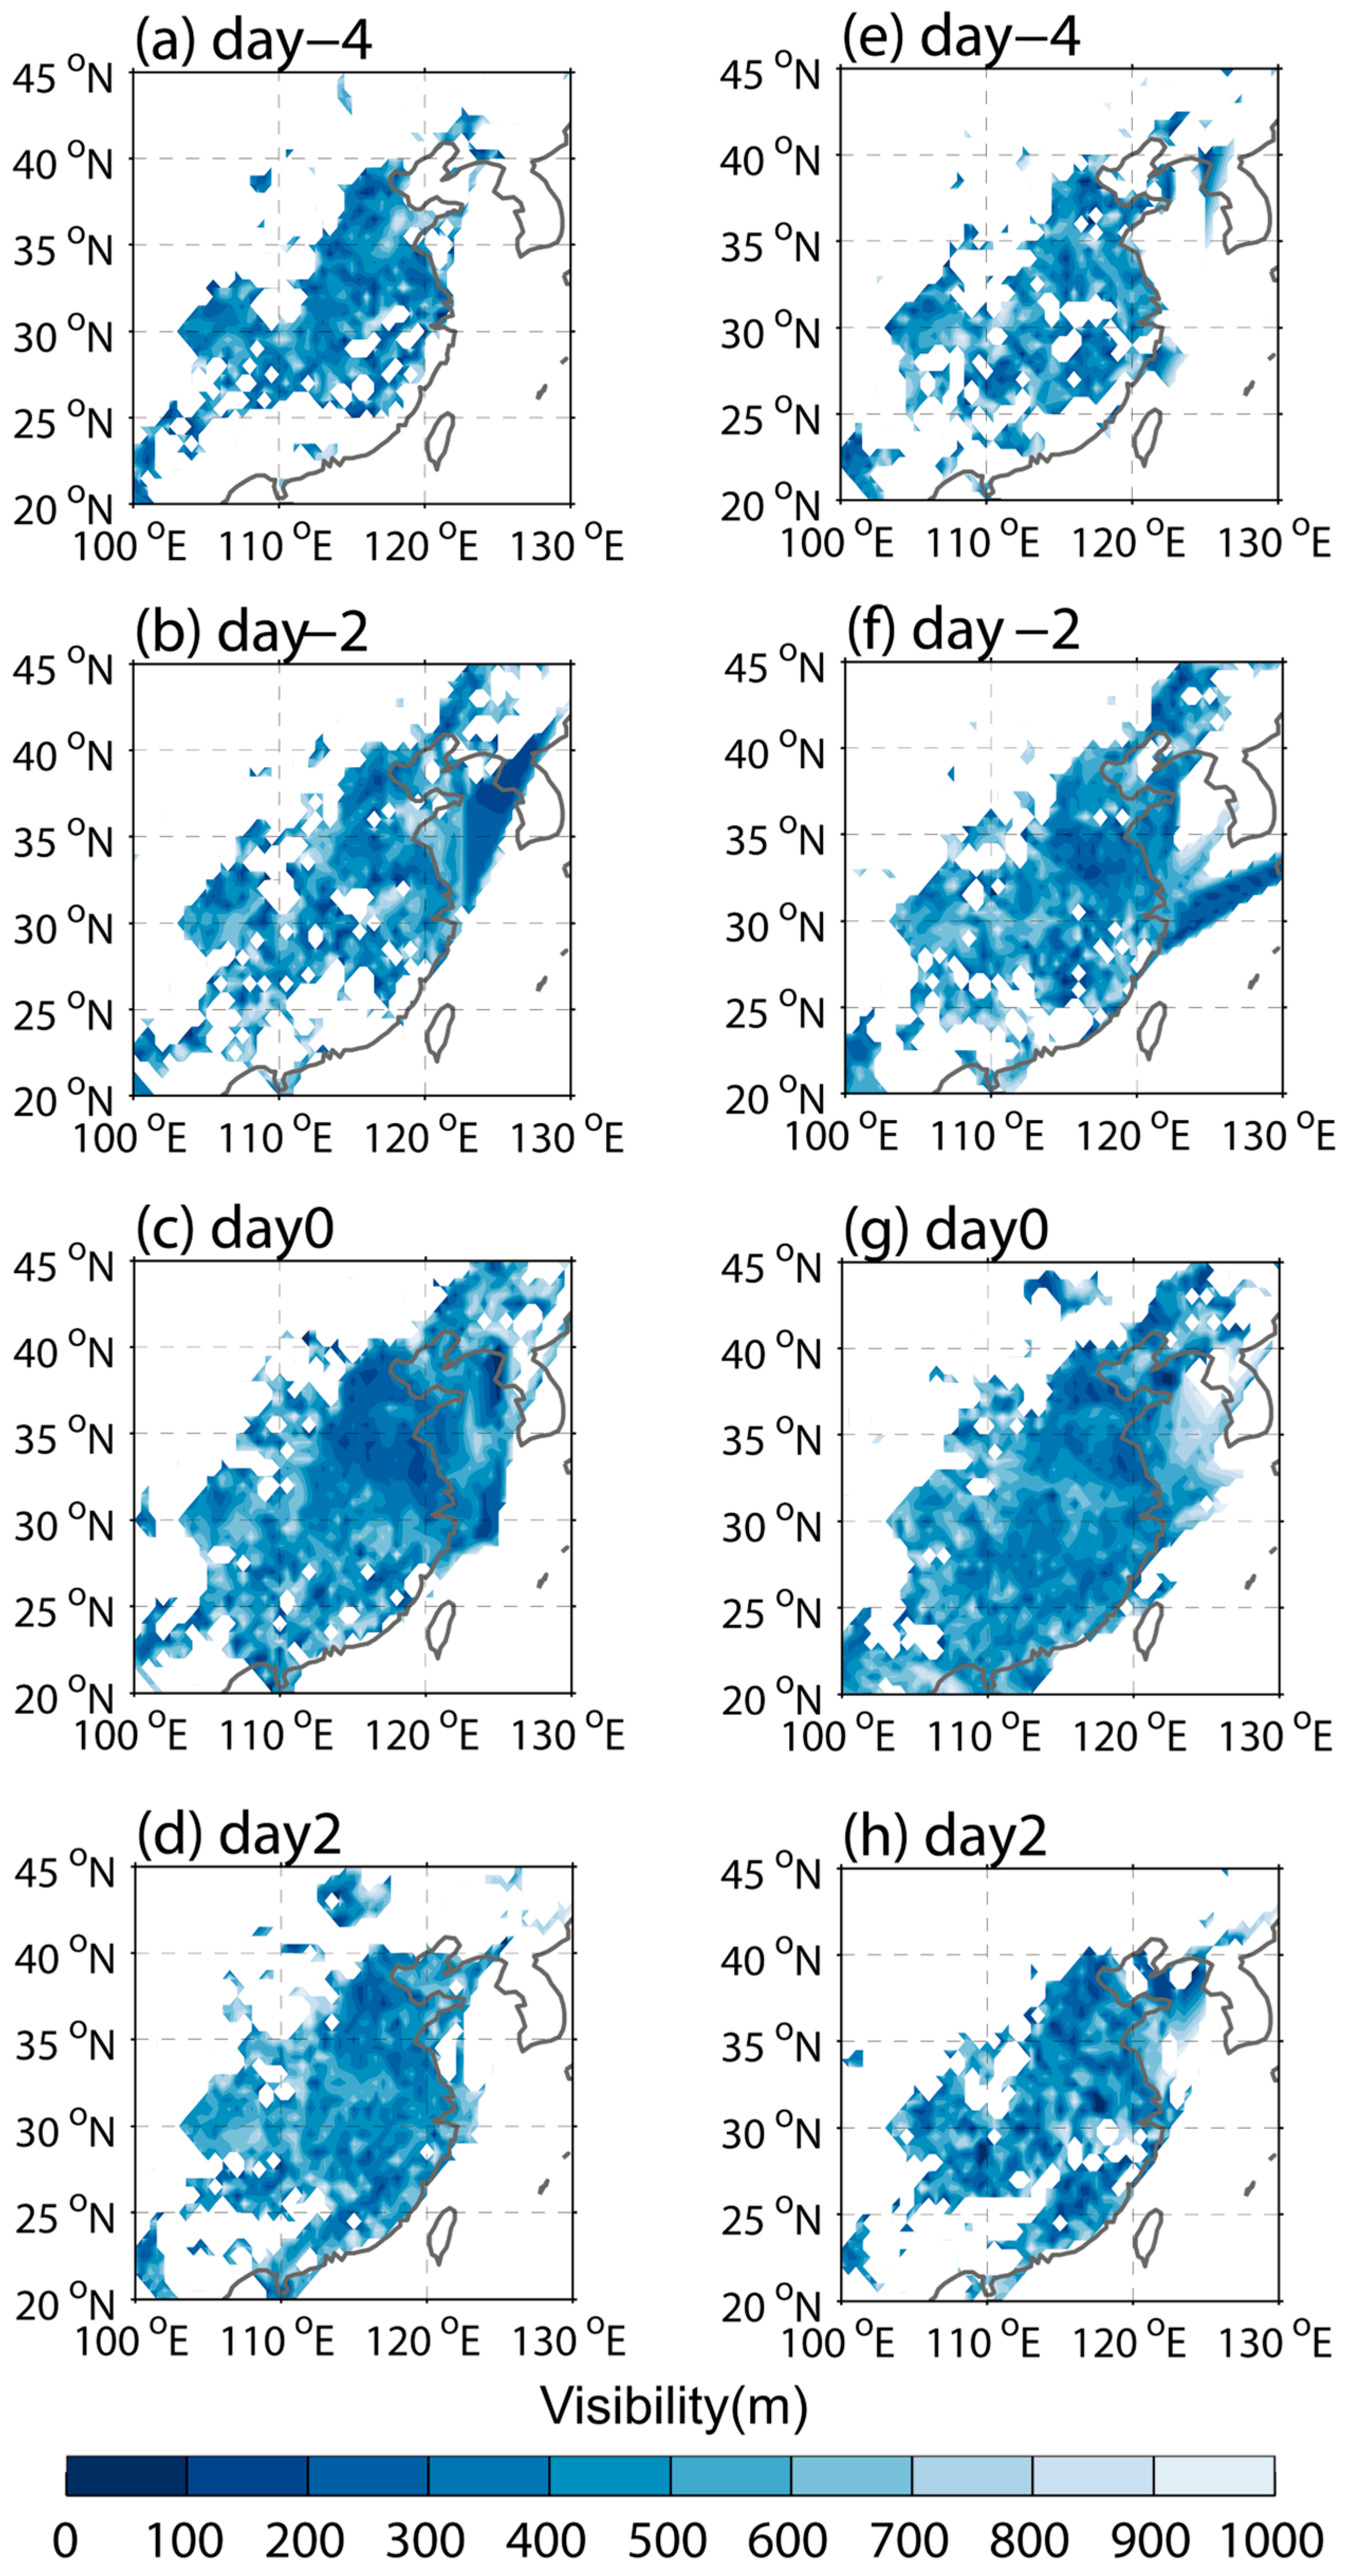
The evolutions of visibility during both northern and southern fog events are presented in Figure 2. On day −4 of northern fog events (Figure 2a), low visibility is present over the region located between 30° N and 40° N. In the following days, the low visibility area expands and the visibility continues decreasing. On day 0, the visibility over northern eastern China drops below 500 m, indicating the occurrence of large-scale fog events (Figure 2c). After day 0, the visibility increases, indicative of the clearing of the fog. The development of southern fog events is characterized as the southward expansion of the low-visibility area. On day −4 of the southern fog events (Figure 2e), visibility is reduced to around 30° N. In the following days, the low visibility area extends southward, and on day 0 of the southern fog events, visibility over the region located between 25° N and 30° N is under 500 m, which suggests the occurrence of fog events. After day 0, the low visibility over the southern region is reduced (Figure 2h).
The occurrence of fog over eastern China is closely associated with lower-level temperatures [9]. On day −4 of the northern fog events (Figure 3a), warm anomalies are located to the west of Lake Baikal. The warm anomalies move southeastward in the following days (Figure 3b,c). On day 0, a strong warm center appears over the region south of 40° N (Figure 3c), which is consistent with the location of the low visibility in the northern fog events (Figure 2c), suggesting that warm anomalies favor the occurrence of fog events. After day 0, the warm anomalies over eastern China are weakened (Figure 3d). The evolution of warm anomalies during southern fog events is similar to that of the northern fog events, except for the more southward location of the warm center on day 0 of the southern fog events (Figure 3g), which corresponds to the location of low visibility of southern fog events (Figure 2g).
Lower-level winds can also contribute to the development of fog events [10]. On day −4 of the northern fog events, cyclonic anomalies situate over the west of Lake Baikal (Figure 4a), and southerly wind anomalies prevail on the southeastern flank of the anomalous cyclone. The cyclonic anomalies move southeastward after day −4 (Figure 4b), which are accompanied by the enhancement of the anticyclonic anomalies over Japan, leading to the development of southeast wind anomalies over eastern China, consistent with the enhancement of the warm anomalies there (Figure 3b). On day 0 (Figure 4c), cyclonic anomalies dominate eastern China, accompanied by southerlies over southern China, which prevent southward development of the warm temperature and the southward intrusion of low-visibility conditions (Figure 2c). The weak wind anomalies over the region located between 30° N and 40° N are associated with weakened outward transport of the fog, which provides a favorable situation for the fog formation (Figure 4b,c). For the southern fog events, the cyclonic anomalies move more southward compared with the northern fog events (Figure 4f,g), which leads to the more southward location of the low-wind-speed area between 25° N and 30° N. The low speed of the surface wind over this region favors the formation of fog events.
The development of the surface wind and pressure anomalies are closely linked to the propagation of the Rossby wave train over the upper troposphere. The Rossby wave activity fluctuates, and the geopotential height anomalies at 300 hPa are presented in Figure 5 to reveal the large-scale atmospheric circulation in the development of the fog events. On day −4 of the northern fog events (Figure 5a), an anomalous anticyclone–cyclone–anticyclone pattern is located over the Eurasian continent. The wave activity fluxes emit from the anticyclonic anomalies over the Scandinavian Peninsula and travel southeastward toward East Asia, indicating the southeastward propagation of wave energy which leads to the development of the anticyclonic anomalies over northeastern China on day −2 (Figure 5b). On day 0, anomalous cyclonic and anticyclonic anomalies are located over western Siberia and Korea, respectively (Figure 5c), indicative of a baroclinic wave structure, leading to the development of surface pressure anomalies (Figure 4c). After day 0, the wave train diminishes (Figure 5d), corresponding to the weakening of the fog events. The wave pattern in the southern fog events is weaker and more southward than that in the northern fog events. The cyclonic anomalies on day −2 are located over Lake Baikal (Figure 5f), which is associated with the southward location of the surface cyclonic anomalies (Figure 4f). The weaker anticyclonic anomalies over Korea on day 0 of the southern fog events (Figure 5g) are consistent with the weakened anomalous southerlies over eastern China (Figure 4g), which leads to the development of weakened surface wind and low visibility over southern China (Figure 2g and Figure 4g).
The transportation of water vapor is associated with the development of fog events. During −4 to day −2 of the northern fog events (Figure 6a,b), northwestward moisture fluxes bring water vapor to the region located between 30° N and 40° N from the Yellow Sea and the East China Sea, with a convergence of water vapor fluxes, leading to positive anomalies of specific humidity there (Figure 7a,b). For the southern fog events, the water vapor fluxes are more southward on day −2 (Figure 6f), bringing moisture from the East China Sea and the South China Sea. The convergence of the water vapor fluxes from the oceans appears over the region located between 25° N and 30° N, which leads to the enhancement of the specific humidity (Figure 7f) and the condensing of the water vapor, resulting in the development of low visibility there.
The occurrence of the fog events is controlled by the water vapor condensation [24,27]. The degree of the air saturation can be evaluated by the difference between temperature (T) and dew point temperature (Td). The smaller the T-Td, the more saturated the air is, which favors the condensation of the fog [24]. On day −2 of the northern fog events (Figure 8b), negative T-Td anomalies appear over the region located between 30° N and 40° N, which indicates that the air over this region tends to be supersaturated. The negative T-Td anomalies on day −2 correspond well to the positive specific humidity anomalies on the same day (Figure 7b), suggesting the dominant role of the moisture transportation for fog formation. On day −2 of the southern fog events, negative T-Td anomalies are situated over the region located between 25° N and 30° N (Figure 8f), which are consistent with the positive specific humidity anomalies (Figure 7f). This is indicative of the supersaturated air, leading to the development of the low visibility and fog events there.
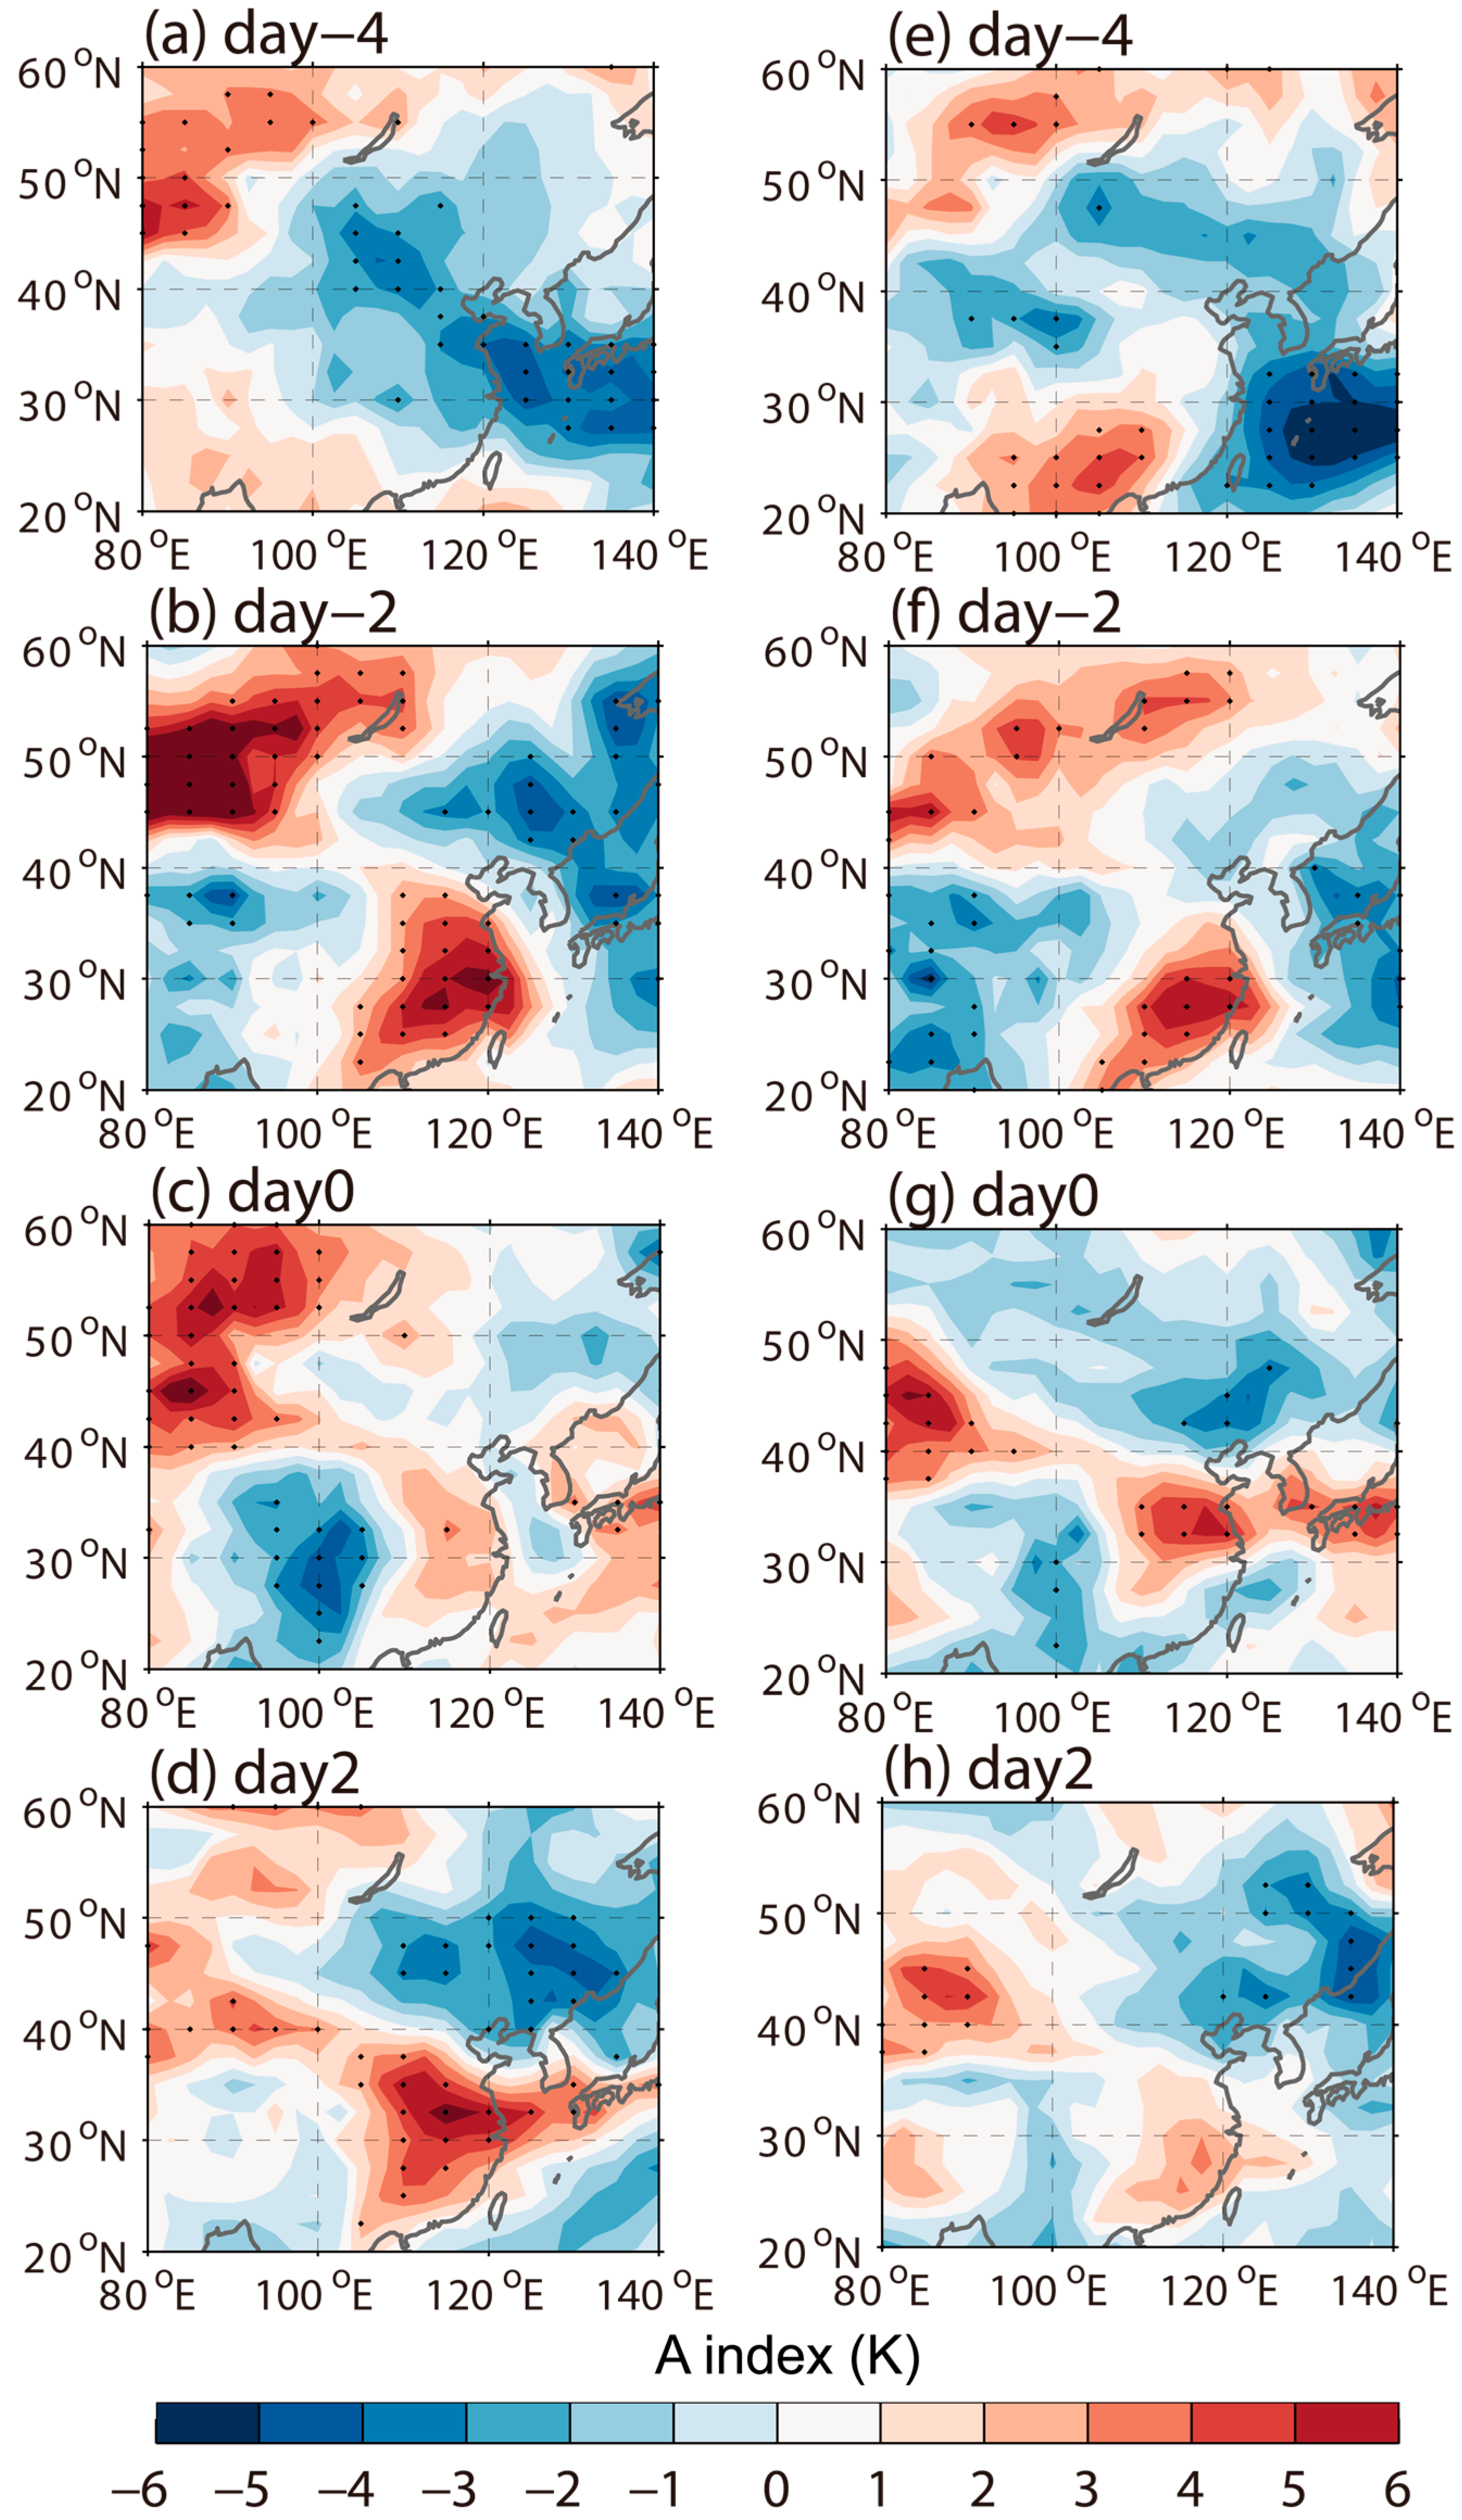
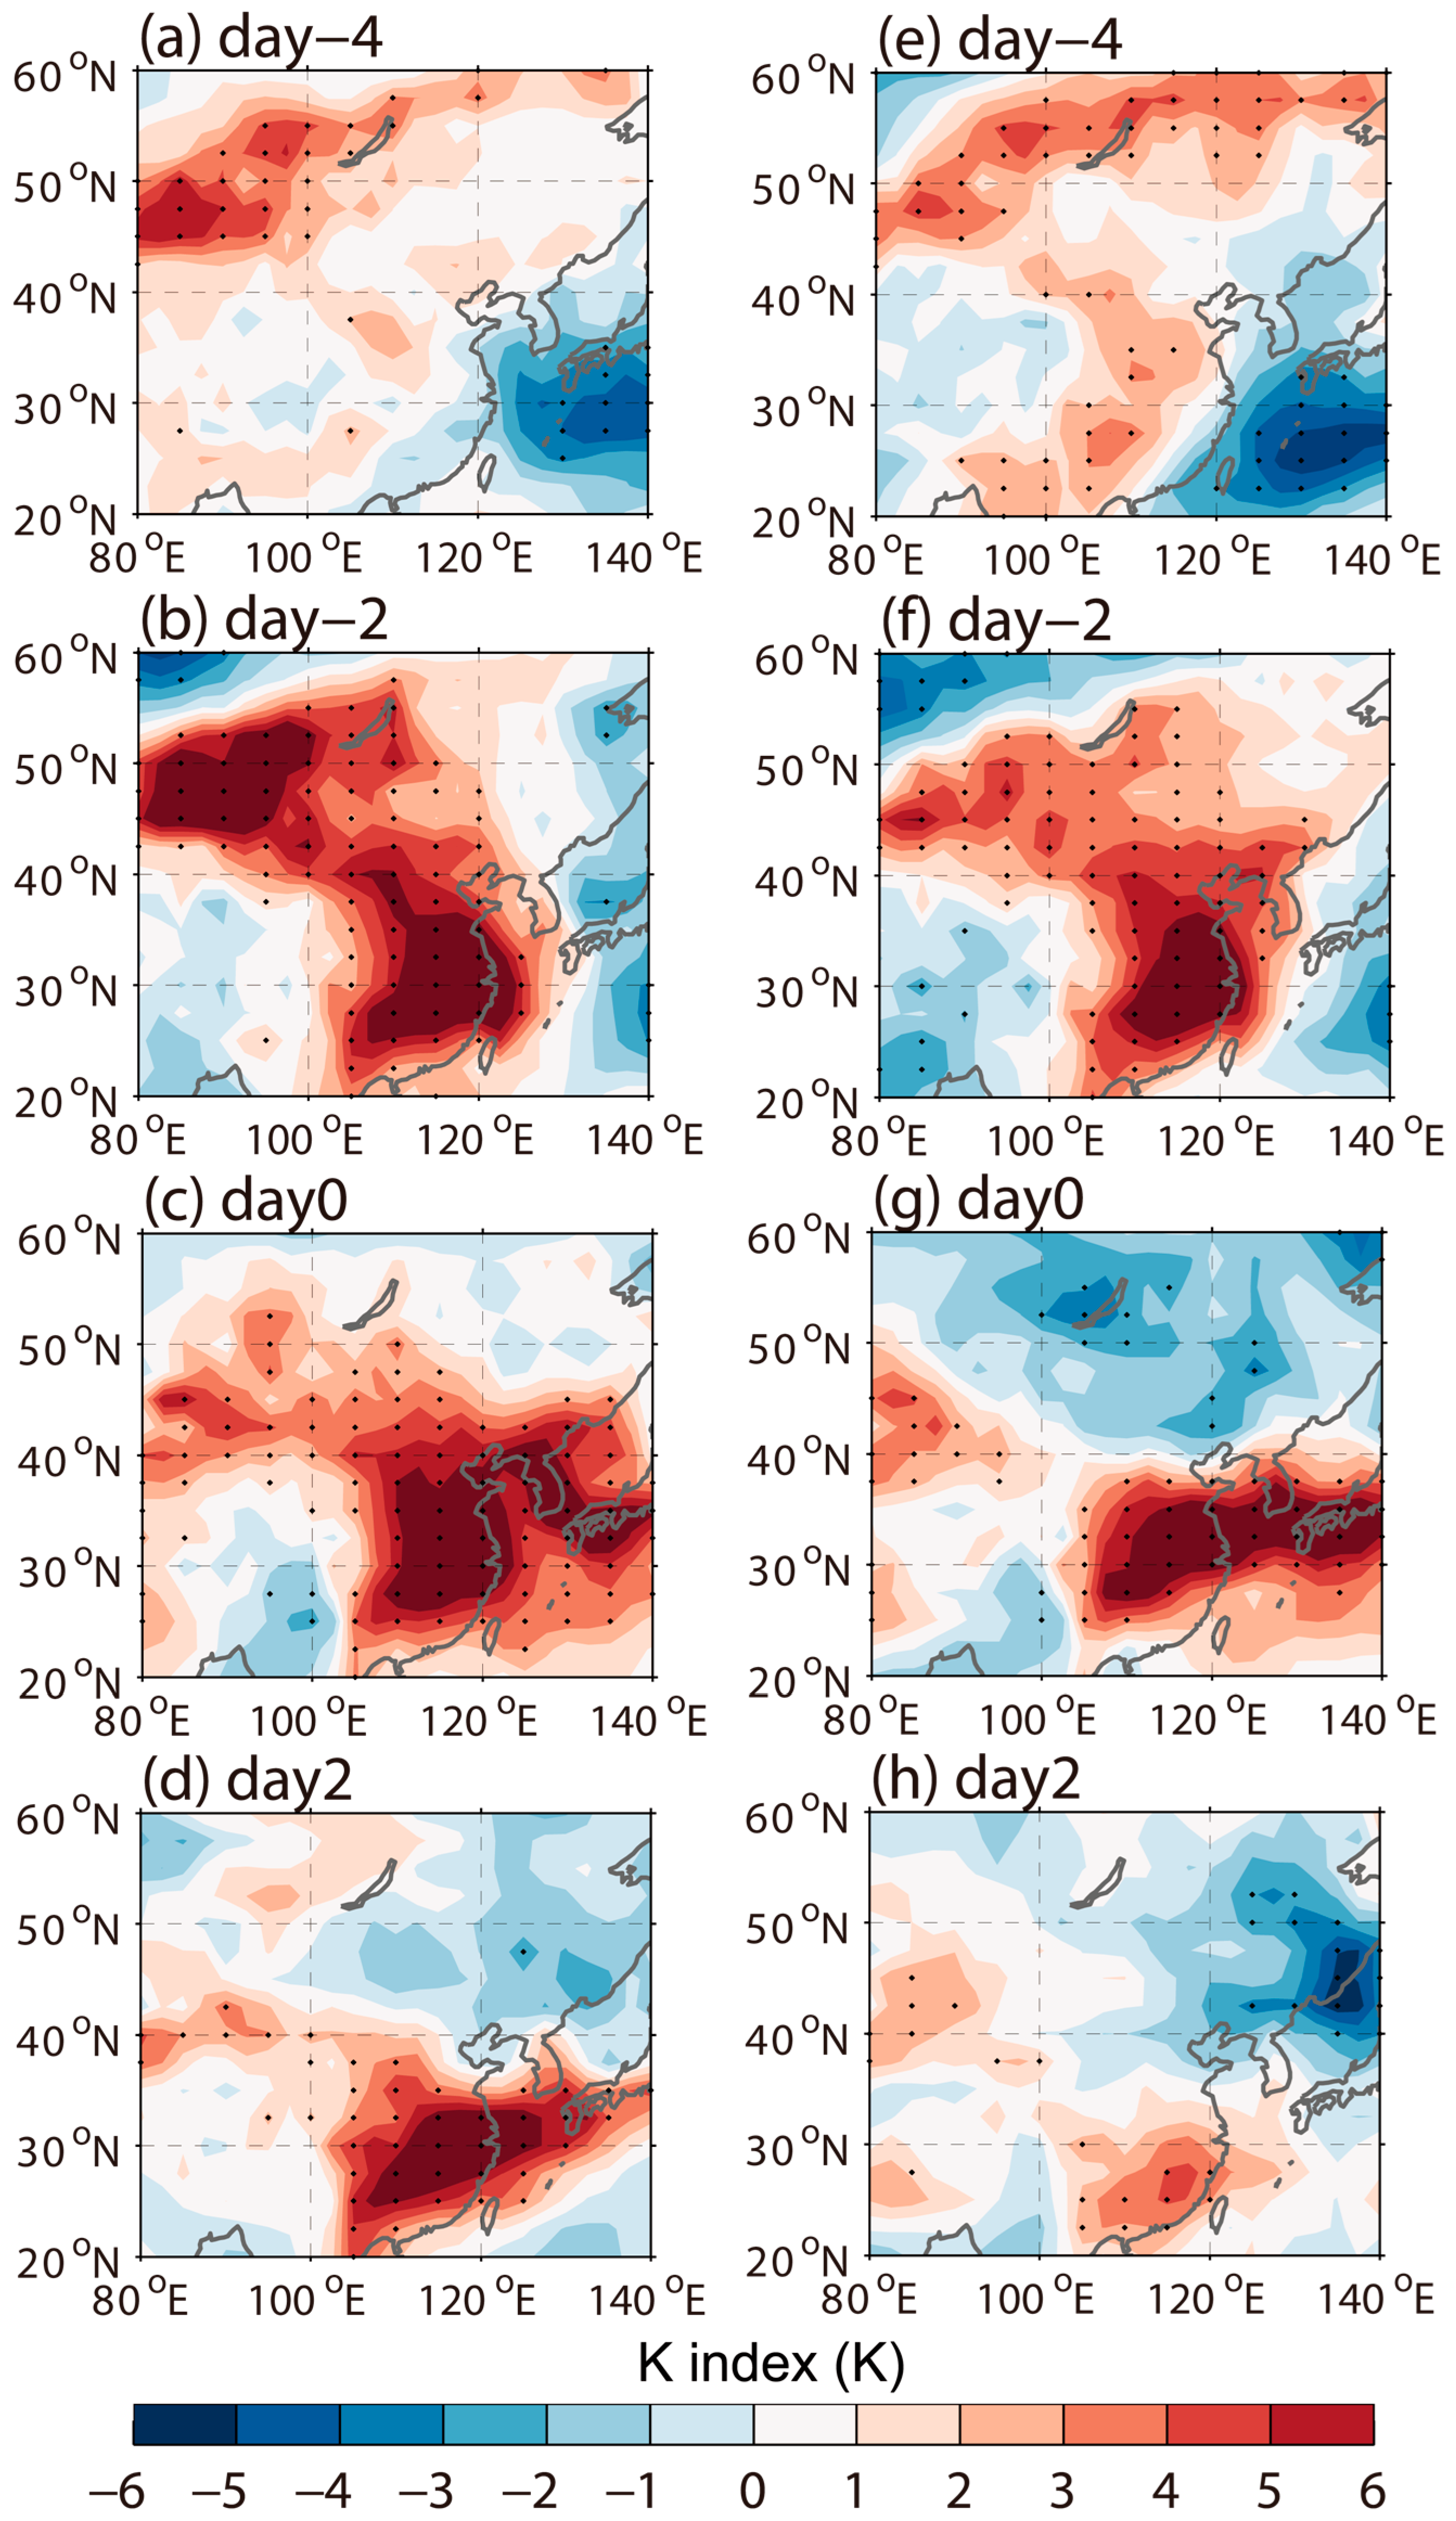
The visibility and the occurrence of fog events are associated with the stability of low and middle tropospheric stratification [7]. The K and A indices are used to evaluate the stability of the lower and middle tropospheric stratification. The K index considers the air saturation at 700 hPa and the water vapor at 850 hPa. The A index corresponds to the air saturation from the lower to the middle troposphere. The enhancement of the fog events is closely linked to the unstable atmospheric saturation from the lower to the middle troposphere, which is indicated by the large K and A index values. The negative (positive) anomalies of the K and A indices are linked to the larger (smaller) vertical difference of pseudo-equivalent potential temperatures, and the more stable (unstable) atmospheric stratification in the lower and middle troposphere. The instability of the lower and middle tropospheric stratification leads to low visibility and enhanced fog. On day −4 of the northern fog events, the A index manifests negative anomalies over eastern China (Figure 9a), whereas the anomaly of the K index is small (Figure 10a). Evident positive A and K indices anomalies appear over the region loacted between 30° N and 40° N on day −2 (Figure 9b and Figure 10b), which corresponds to the convergence of the water vapor from the ocean (Figure 6b), the enhancement of the specific humidity (Figure 7b), and the evident saturated air (Figure 8b). The positive A and K indices anomalies indicate the unstable atmospheric saturation from the low to the middle troposphere, which favors the development of the low visibility and fog events. After day −2, the positive A and K indices anomalies are weakened (Figure 9c,d and Figure 10c,d). The development of the A and K indices anomalies during southern fog events is similar to that of the northern fog events, except for the more southward position. On day −2 of the southern fog events, positive A and K indices anomalies are situated over the region located between 25° N and 30° N (Figure 9f and Figure 10f), corresponding to the enhancement of the low visibility and fog events there. After day −2, the A and K indices anomalies diminish (Figure 9g,h and Figure 10g,h). Therefore, the thermodynamic process plays a major role in the occurrence of both the northern and southern fog events.
4. Discussion and Conclusions
Fog events over the northern and southern regions of eastern China are identified across 40 winters from 1981 to 2021. Composite analysis is conducted upon these events to reveal the different processes associated with northern and southern fog events. The evolution of the northern fog events is characterized as the development of low visibility in the region located between 30° N and 40° N, whereas the southern fog events are manifested as southward expansion of the low visibility from 30° N to 25° N. The development of low visibility during both northern and southern fog events is accompanied by warm anomalies, which favor the occurrence of the fog.
The formation of fog events is controlled by both dynamic and thermodynamic mechanisms. The surface wind is one of the main dynamic contributors that contributes to the fog events. During the northern fog events, cyclonic anomalies move southeastward from Lake Baikal toward eastern China, dominating eastern China. The anomalous southerlies on the southern flank of the cyclonic anomalies prevent southward intrusion of the fog, leading to the formation of fog. During the southern fog events, the anomalous cyclonic anomalies are situated more southward, which leads to the formation of fog over southern China. The propagation of the Rossby wave train in the upper troposphere contributes to the development of surface wind anomalies. During the developing episode of the northern fog events, an anomalous anticyclone–cyclone–anticyclone pattern is located over the Eurasian continent, which generates the anticyclonic anomalies over northeastern China, corresponding to the development of the surface pressure and wind anomalies. During the southern fog events, the wave pattern over the Eurasian continent is weaker and more southward than that in the northern fog events, leading to the southward location of the surface wind and low visibility over southern China.
The thermodynamic processes that lead to the formation of fog events include water vapor transportation, air saturation, and the stability of the tropospheric stratification. During the northern fog events, the northwestward moisture fluxes convey water vapor from the Yellow Sea and the East China Sea to northern China, which leads to the development of positive specific humidity, negative T-Td anomalies, and positive A and K indices over northern China; these are indicative of supersaturated air and the unstable atmospheric saturation from the low to the middle troposphere over this region, favoring the composition of fog. However, in the southern fog events, the water vapor comes from the East China Sea and the South China Sea, contributing to the enhancement of specific humidity, negative T-Td anomalies, and positive A and K indices over southern China, inducing the establishment of fog events over southern China.
In this study, we have focused on the development of winter fog events by using composite analysis, and revealed the role of mid-latitude atmospheric circulation in inducing fog events in both northern and southern China. This is the difference in the position of the mid-latitude Rossby wave train that contributes to the different locations of fog events across northern and southern China. Previous studies have indicated that tropical circulation is closely linked to fog formation over China [2,10,15,24]. Future studies will be conducted on the mechanisms of tropical circulation in influencing different fog events over northern and southern regions of China. Arctic sea ice, the snow cover over the Eurasian continent, and the heating over the Tibetan Plateau can influence the fog variability over eastern China [16]. It is possible that these factors can impact the northern and southern fog events, which will be discussed in future study.
Author Contributions
Conceptualization, methodology, formal analysis, X.S. and S.L.; investigation, resources, and data curation, Y.Z. and J.C.; writing—original draft, X.S. and S.L.; writing—review and editing: M.M. and P.L. All authors have read and agreed to the published version of the manuscript.
Funding
Independent Research Project of State Key Laboratory of Geo-Information Engineering (SKLGIE2022-ZZ2-06).
Institutional Review Board Statement
Not applicable.
Informed Consent Statement
Not applicable.
Data Availability Statement
The data presented in this study are available on request. The data are not publicly available due to privacy.
Acknowledgments
We would like to give our thanks to those who have made efforts to advance this work, and the fellow travelers along the way.
Conflicts of Interest
The authors declare no conflicts of interest.
References
- Li, Q.; Zhang, R.; Wang, Y. Interannual variation of the wintertime fog-haze days across central and eastern China and its relation with East Asian winter monsoon. Int. J. Clim. 2016, 36, 346–354. [Google Scholar] [CrossRef]
- Yu, H.; Liu, P.; Zhang, Y. The combined effects of ENSO and Arctic Oscillation on wintertime fog days in eastern China. Theor. Appl. Clim. 2021, 144, 1233–1251. [Google Scholar] [CrossRef]
- Tardif, R.; Rasmussen, R.M. Event-Based Climatology and Typology of Fog in the New York City Region. J. Appl. Meteorol. Clim. 2007, 46, 1141–1168. [Google Scholar] [CrossRef]
- Ye, H. The influence of air temperature and atmospheric circulation on winter fog frequency over Northern Eurasia. Int. J. Clim. 2008, 29, 729–734. [Google Scholar] [CrossRef]
- Li, Z.; Liu, D.; Yan, W.; Wang, H.; Zhu, C.; Zhu, Y.; Zu, F. Dense fog burst reinforcement over Eastern China: A review. Atmos. Res. 2019, 230, 104639. [Google Scholar] [CrossRef]
- Wang, H.; Zhang, Z.; Liu, D.; Zhu, Y.; Zhang, X.; Yuan, C. Study on a Large-Scale Persistent Strong Dense Fog Event in Central and Eastern China. Adv. Meteorol. 2020, 2020, 8872334. [Google Scholar] [CrossRef]
- RenHe, Z.; Li, Q.; Zhang, R. Meteorological conditions for the persistent severe fog and haze event over eastern China in January 2013. Sci. China Earth Sci. 2014, 57, 26–35. [Google Scholar] [CrossRef]
- Chen, S.; Liu, D.; Kang, Z.; Shi, Y.; Liu, M. Anomalous Atmospheric Circulation Associated with the Extremely Persistent Dense Fog Events over Eastern China in the Late Autumn of 2018. Atmosphere 2021, 12, 111. [Google Scholar] [CrossRef]
- Niu, F.; Li, Z.; Li, C.; Lee, K.; Wang, M. Increase of wintertime fog in China: Potential impacts of weakening of the Eastern Asian monsoon circulation and increasing aerosol loading. J. Geophys. Res. Atmos. 2010, 115, D00K20. [Google Scholar] [CrossRef]
- Hu, S.; Zhang, W.; Turner, A.G.; Sun, J. How does El Niño-Southern Oscillation affect winter fog frequency over eastern China? Clim. Dyn. 2020, 54, 1043–1056. [Google Scholar] [CrossRef]
- Fu, G.Q.; Xu, W.Y.; Yang, R.F.; Li, J.B.; Zhao, C.S. The distribution and trends of fog and haze in the North China Plain over the past 30 years. Atmos. Chem. Phys. 2014, 14, 11949–11958. [Google Scholar] [CrossRef]
- Ye, X.; Song, Y.; Cai, X.; Zhang, H. Study on the synoptic flow patterns and boundary layer process of the severe haze events over the North China Plain in January 2013. Atmos. Environ. 2016, 124, 129–145. [Google Scholar] [CrossRef]
- Xu, J.; Chang, L.; Yan, F.; He, J. Role of climate anomalies on decadal variation in the occurrence of wintertime haze in the Yangtze River Delta, China. Sci. Total Environ. 2017, 599–600, 918–925. [Google Scholar] [CrossRef]
- Zhu, Y.; Li, Z.; Zu, F.; Wang, H.; Liu, Q.; Qi, M.; Wang, Y. The propagation of fog and its related pollutants in the Central and Eastern China in winter. Atmos. Res. 2021, 265, 105914. [Google Scholar] [CrossRef]
- Tuncay Özdemir, E.; Deniz, A.; Sezen, İ.; Menteş, Ş.S.; Yavuz, V. Fog analysis at Istanbul Ataturk International Airport. Weather 2016, 71, 279–284. [Google Scholar] [CrossRef]
- Hu, S.; Zhang, W.; Geng, X.; Sun, J. Dominant modes of interannual variability of winter fog days over eastern China and their association with major SST variability. Clim. Dyn. 2021, 58, 413–426. [Google Scholar] [CrossRef]
- Yan, S.; Zhu, B.; Kang, H. Long-Term Fog Variation and Its Impact Factors Over Polluted Regions of East China. J. Geophys. Res. Atmos. 2019, 124, 1741–1754. [Google Scholar] [CrossRef]
- Park, T.-W.; Ho, C.-H.; Yang, S.; Jeong, J.-H. Influences of Arctic Oscillation and Madden-Julian Oscillation on cold surges and heavy snowfalls over Korea: A case study for the winter of 2009–2010. J. Geophys. Res. Atmos. 2010, 115, D23122. [Google Scholar] [CrossRef]
- Song, L.; Wu, R. Processes for Occurrence of Strong Cold Events over Eastern China. J. Clim. 2017, 30, 9247–9266. [Google Scholar] [CrossRef]
- Gong, D.; Wang, S.; Zhu, J. East Asian Winter Monsoon and Arctic Oscillation. Geophys. Res. Lett. 2001, 28, 2073–2076. [Google Scholar] [CrossRef]
- Liu, P.; Tang, M.; Yu, H.; Zhang, Y. Influence of Arctic Oscillation on Frequency of Wintertime Fog Days in Eastern China. Atmosphere 2020, 11, 162. [Google Scholar] [CrossRef]
- Wang, B.; Wu, R.; Fu, X. Pacific–East Asian teleconnection: How does ENSO affect East Asian climate? J. Clim. 2000, 13, 1517–1536. [Google Scholar] [CrossRef]
- Wu, R.; Wang, B. A contrast of the East Asian summer monsoon—ENSO relationship between 1962–77 and 1978–93. J. Clim. 2002, 15, 3266–3279. [Google Scholar] [CrossRef]
- Yu, H.; Li, T.; Liu, P. Influence of ENSO on frequency of wintertime fog days in Eastern China. Clim. Dyn. 2019, 52, 5099–5113. [Google Scholar] [CrossRef]
- Hersbach, H.; Bell, B.; Berrisford, P.; Hirahara, S.; Horányi, A.; Muñoz-Sabater, J.; Nicolas, J.; Peubey, C.; Radu, R.; Schepers, D.; et al. The ERA5 global reanalysis. Q. J. R. Meteorol. Soc. 2020, 146, 1999–2049. [Google Scholar] [CrossRef]
- Takaya, K.; Nakamura, H. A formulation of a phase-independent wave-activity flux for stationary and migratory quasigeostrophic eddies on a zonally varying basic flow. J. Atmos. Sci. 2001, 58, 608–627. [Google Scholar] [CrossRef]
- Ding, Y.; Liu, Y. Analysis of long-term variations of fog and haze in China in recent 50 years and their relations with atmospheric humidity. Sci. China Earth Sci. 2014, 57, 36–46. [Google Scholar] [CrossRef]
Figure 1.
Topographic maps of China (a); the topography of the study domain (m) (b) and standard deviation of daily visibility (m) during December–February (DJF) (c).
Figure 1.
Topographic maps of China (a); the topography of the study domain (m) (b) and standard deviation of daily visibility (m) during December–February (DJF) (c).

Figure 2.
Composite visibility (m) on day −4 (a), day −2 (b), day 0 (c), and day 2 (d) of northern fog events, and day −4 (e), day −2 (f), day 0 (g), and day 2 (h) of southern fog events.
Figure 2.
Composite visibility (m) on day −4 (a), day −2 (b), day 0 (c), and day 2 (d) of northern fog events, and day −4 (e), day −2 (f), day 0 (g), and day 2 (h) of southern fog events.

Figure 3.
Composite surface air temperature anomalies (°C) on day −4 (a), day −2 (b), day 0 (c), and day 2 (d) of northern fog events, and day −4 (e), day −2 (f), day 0 (g), and day 2 (h) of southern fog events. The black dots indicate that the surface air temperature anomalies are significant at the 95% confidence level.

Figure 4.
Composite surface wind anomalies (vector, scale at right bottom) and sea-level pressure (shading, hPa) on day −4 (a), day −2 (b), day 0 (c), and day 2 (d) of northern fog events, and day −4 (e), day −2 (f), day 0 (g), and day 2 (h) of southern fog events. Black vectors indicate surface wind anomalies significant at the 95% confidence level.

Figure 5.
Composite geopotential height anomalies at 300 hPa (shading, gpm) and wave activity fluxes (vector, scale at right bottom) on day −4 (a), day −2 (b), day 0 (c), and day 2 (d) of northern fog events, and day −4 (e), day −2 (f), day 0 (g), and day 2 (h) of southern fog events. The black contours denote the geopotential height anomalies significant at the 95% confidence level.

Figure 6.
Water vapor flux integral from 1000 to 100 hPa (vector, scale at right bottom) and its divergence (shading, ×10−5) on day −4 (a), day −2 (b), day 0 (c), and day 2 (d) of northern fog events, and day −4 (e), day −2 (f), day 0 (g), and day 2 (h) of southern fog events. The black vectors indicate water vapor flux anomalies significant at the 95% confidence level.

Figure 7.
Composite specific humidity anomalies (shadings, g/kg) on day −4 (a), day −2 (b), day 0 (c), and day 2 (d) of northern fog events, and day −4 (e), day −2 (f), day 0 (g), and day 2 (h) of southern fog events. The significance test at 95% confidence level for specific humidity is marked by black dots.

Figure 8.
Composite T-Td anomalies at 850 hPa (shadings, K) on day −4 (a), day −2 (b), day 0 (c), and day 2 (d) of northern fog events, and day −4 (e), day −2 (f), day 0 (g), and day 2 (h) of southern fog events. The significance test at 95% confidence level for the T-Td is marked by black dots.
Figure 8.
Composite T-Td anomalies at 850 hPa (shadings, K) on day −4 (a), day −2 (b), day 0 (c), and day 2 (d) of northern fog events, and day −4 (e), day −2 (f), day 0 (g), and day 2 (h) of southern fog events. The significance test at 95% confidence level for the T-Td is marked by black dots.

Figure 9.
Composite A index anomalies (shadings, K) on day −4 (a), day −2 (b), day 0 (c), and day 2 (d) of northern fog events, and day −4 (e), day −2 (f), day 0 (g), and day 2 (h) of southern fog events. The significance test at 95% confidence level for the A index is marked by black dots.
Figure 9.
Composite A index anomalies (shadings, K) on day −4 (a), day −2 (b), day 0 (c), and day 2 (d) of northern fog events, and day −4 (e), day −2 (f), day 0 (g), and day 2 (h) of southern fog events. The significance test at 95% confidence level for the A index is marked by black dots.

Figure 10.
Composite K index anomalies (shadings, K) on day −4 (a), day −2 (b), day 0 (c), and day 2 (d) of northern fog events, and day −4 (e), day −2 (f), day 0 (g), and day 2 (h) of southern fog events. The significance test at 95% confidence level for the K index is marked by black dots.
Figure 10.
Composite K index anomalies (shadings, K) on day −4 (a), day −2 (b), day 0 (c), and day 2 (d) of northern fog events, and day −4 (e), day −2 (f), day 0 (g), and day 2 (h) of southern fog events. The significance test at 95% confidence level for the K index is marked by black dots.


Table 1.
The year and peak day of northern fog events.
| Year | Peak Day | Year | Peak Day |
|---|---|---|---|
| 1981–1982 | 22 January; 21 February | 1999–2000 | 6 February |
| 1983–1984 | 23 February | 2000–2001 | 8 December; 30 December; 11 January; 21 February |
| 1984–1985 | 5 February | 2001–2002 | 14 January |
| 1985–1986 | 19 January | 2002–2003 | 8 February |
| 1986–1987 | 20 January | 2005–2006 | 2 January; 27 January; 1 February; 12 February |
| 1987–1988 | 13 January | 2006–2007 | 26 December |
| 1988–1989 | 2 January; 20 January | 2007–2008 | 20 December; 9 January |
| 1989–1990 | 6 December; 16 January; 6 February; 10 February | 2008–2009 | 5 February |
| 1990–1991 | 9 December; 10 February; 15 February | 2009–2010 | 10 December; 23 February |
| 1991–1992 | 16 December; 27 January | 2013–2014 | 8 December |
| 1992–1993 | 7 December; 29 December | 2015–2016 | 10 December |
| 1993–1994 | 5 January; 14 February | 2016–2017 | 20 December; 3 January |
| 1994–1995 | 7 December; 29 December | 2017–2018 | 29 December |
| 1996–1997 | 27 December; 20 January | 2019–2020 | 23 January |
| 1997–1998 | 18 December | 2020–2021 | 22 January |
| 1998–1999 | 21 December |
Table 2.
The year and peak day of southern fog events.
| Year | Peak Day | Year | Peak Day |
|---|---|---|---|
| 1983–1984 | 15 December | 2001–2002 | 14 January; 16 January; 6 February; 18 February |
| 1985–1986 | 16 January | 2002–2003 | 10 February |
| 1986–1987 | 24 February | 2003–2004 | 30 January |
| 1987–1988 | 2 February; 20 February | 2005–2006 | 29 January |
| 1988–1989 | 24 December; 3 January; 17 February | 2007–2008 | 9 January |
| 1989–1990 | 14 December | 2008–2009 | 30 January; 7 February |
| 1990–1991 | 5 February; 15 February | 2009–2010 | 18 January; 10 February |
| 1991–1992 | 6 December; 16 December | 2012–2013 | 23 January |
| 1992–1993 | 13 December; 3 January; 17 February; 21 February | 2013–2014 | 8 December |
| 1994–1995 | 6 December; 23 December; 17 January; 9 February | 2015–2016 | 23 December; 5 January; 29 January |
| 1997–1998 | 12 February | 2016–2017 | 20 December; 28 January |
| 1998–1999 | 17 February | 2018–2019 | 22 December; 6 February |
| 2000–2001 | 10 December; 1 January; 10 February; 23 February | 2020–2021 | 28 December; 2 February |
Disclaimer/Publisher’s Note: The statements, opinions and data contained in all publications are solely those of the individual author(s) and contributor(s) and not of MDPI and/or the editor(s). MDPI and/or the editor(s) disclaim responsibility for any injury to people or property resulting from any ideas, methods, instructions or products referred to in the content. |
© 2024 by the authors. Licensee MDPI, Basel, Switzerland. This article is an open access article distributed under the terms and conditions of the Creative Commons Attribution (CC BY) license (https://creativecommons.org/licenses/by/4.0/).
Share and Cite
MDPI and ACS Style
Shen, X.; Zhou, Y.; Chen, J.; Liu, S.; Ma, M.; Lin, P. Different Mechanisms for the Northern and Southern Winter Fog Events over Eastern China. Atmosphere 2024, 15, 528. https://doi.org/10.3390/atmos15050528
AMA Style
Shen X, Zhou Y, Chen J, Liu S, Ma M, Lin P. Different Mechanisms for the Northern and Southern Winter Fog Events over Eastern China. Atmosphere. 2024; 15(5):528. https://doi.org/10.3390/atmos15050528
Chicago/Turabian StyleShen, Xiaojing, Yuanlong Zhou, Jian Chen, Shuang Liu, Ming Ma, and Pengfei Lin. 2024. "Different Mechanisms for the Northern and Southern Winter Fog Events over Eastern China" Atmosphere 15, no. 5: 528. https://doi.org/10.3390/atmos15050528
Note that from the first issue of 2016, this journal uses article numbers instead of page numbers. See further details here.