


Analyzing Urban Climatic Shifts in Annaba City: Decadal Trends, Seasonal Variability and Extreme Weather Events

1
Department of Architecture, Institute of Architecture and Urbanism, Saad Dahlab University—Blida 1 (SDUB), Blida 9000, Algeria
2
Department of Architecture, Faculty of Engineering and Architecture, Umm Al-Qura University, Makkah 24381, Saudi Arabia
*
Author to whom correspondence should be addressed.
Atmosphere 2024, 15(5), 529; https://doi.org/10.3390/atmos15050529
Submission received: 14 March 2024
/
Revised: 23 April 2024
/
Accepted: 23 April 2024
/
Published: 26 April 2024
(This article belongs to the Special Issue Climate and Weather Extremes in the Mediterranean)
Abstract
:Global warming is one of the most pressing challenges of our time, contributing to climate change effects and with far-reaching implications for built environments. The main aim of this study is to assess the extent to which Annaba city, Algeria, as part of the Mediterranean region, is affected by global climate change and its broader influences. The study investigated climatic shifts in Annaba city, using a multi-step methodology integrating data collection and analysis techniques. Data collection included 23 years of climate data (2000–2023) from Annaba’s meteorological station, on-site measurements of microclimatic variations, and a questionnaire survey. The collected data underwent four main analyses: a time series analysis to describe climate parameters over 23 years, a statistical analysis to predict potential future climatic conditions (2024–2029) and the correlation of various climatic variables using specialized bioclimate tools to highlight seasonal variability, a spatial study of the urban heat island (UHI) phenomenon and perceived climatic shifts, and an analysis of extreme weather events characterizing heat atmospheric events in the context of urban climate change in the Mediterranean region. The findings revealed a consistent warming trend in Annaba city, with prolonged extreme climate conditions observed, particularly in the last four years (2020–2023). Significant temperature fluctuations were emphasized, notably in July 2023, with record-breaking maximum temperatures reaching 48.2 °C, the hottest on record with an increase of 3.8 °C, and presenting challenges amplified by the urban heat island effect, causing temperature differentials of up to 6 °C within built-up areas. Projections for 2029 suggest a tendency towards heightened aridity with a significant shift towards a new climate seasonality featuring two distinct main seasons—moderate and hot challenging. The abrupt disruption of calm weather conditions in Annaba on 24 July 2023 highlighted the influence of atmospheric circulation within the Mediterranean region featured for both anticyclones and atmospheric blocking phenomena on local weather patterns.
1. Introduction
Global climate change is one of the most pressing challenges of our time, with far-reaching implications for the planet’s ecosystems, human societies, and built environments. As the Earth’s average temperature continues to rise due to greenhouse gas emissions primarily from human activities, the impacts of climate change are becoming increasingly evident, affecting both natural landscapes and urban areas [1,2,3]. Urban areas are at the forefront of climate change impacts, facing unique challenges due to their dense populations, concentrated infrastructure, and specific geographical features. Global warming exacerbates these challenges, leading to a myriad of environmental, social, and economic consequences in urban settings [4,5]. One of the most noticeable effects of global warming in urban areas is the rise in temperatures, commonly known as the urban heat island (UHI) effect. Urban areas tend to be several degrees warmer than their rural surroundings due to factors like the concentration of buildings, roads, and other heat-absorbing materials, as well as reduced vegetation [6,7,8]. This increase in temperature intensifies heatwaves, exacerbates air pollution, and contributes to health issues such as heat-related illnesses and respiratory problems [9,10]. Moreover, global warming influences precipitation patterns, leading to more intense and erratic rainfall events in urban areas. This can result in flooding, overwhelmed drainage systems, and water contamination, posing risks to both infrastructure and public health. Additionally, higher temperatures contribute to the expansion of diseases, impacting urban agriculture and public hygiene [11,12,13]. Rising sea levels, another consequence of global warming, pose a significant threat to coastal cities. Urban areas situated near coastlines are vulnerable to flooding, erosion, and saltwater intrusion into freshwater supplies [14,15,16]. This not only endangers infrastructure but also compromises the livelihoods and well-being of millions of urban dwellers. Despite the overall trend of global warming, it is important to highlight the complexity of climate dynamics, including periods where the rate of global surface warming appears to slow down or pause temporarily, often referred to as a “hiatus” [17,18]. While such observations led to discussions about the drivers and implications of such a hiatus, subsequent research has highlighted various factors influencing global temperature trends, including natural variability, ocean heat uptake, and data inconsistencies [19]. However, it is crucial to note that the overall trend of anthropogenic climate change remains unequivocal, with the overwhelming majority of scientific evidence supporting the continued warming of the planet due to human activities such as greenhouse gas emissions [20].
To address climate change in urban areas effectively, it is imperative to investigate the extent to which these regions are impacted by global climate change and the degree to which local climatic variations align with statistical trends reported by the World Meteorological Organization (WMO). The 2023 Annual Climate Summary provides a comprehensive overview of global climate highlights for the year [21]. It confirms that 2023 is the warmest year on record globally, with temperatures surpassing previous records. Notably, the global-average temperature for 2023 was 14.98 °C, marking a significant increase from the pre-industrial level. The summary highlights the unprecedented warmth experienced across various regions, with each month from June to December recording higher temperatures than any previous years. Furthermore, the report discusses the factors contributing to this warmth, including high sea surface temperatures and reduced aerosols. Looking ahead, forecasts suggest that 2024 could be even warmer than 2023. Additionally, the summary addresses the widespread impact of extreme events such as heatwaves, floods, droughts, and wildfires, underscoring the urgent need for climate action.
Different climate contexts, such as temperate, tropical, arid, polar, and Mediterranean regions, present unique challenges and opportunities for addressing urban climate change. Urban areas across different climate contexts are facing distinct challenges related to climate change. In temperate regions, cities are experiencing more frequent and intense heatwaves and changes in precipitation patterns, exacerbated by urban heat islands. Tropical cities are grappling with rising sea levels, extreme weather events, and heat stress, which particularly affects vulnerable populations. Arid regions are facing water scarcity and desertification due to low rainfall and high temperatures, while polar urban areas are experiencing rapid rates of climate change, including melting permafrost and thawing sea ice [22,23,24,25]. Mediterranean cities are facing increasing temperatures, decreasing precipitation, and are vulnerable to droughts, water scarcity, wildfires, and sea-level rise [12,20,22,24,26]. Addressing urban climate change requires tailored strategies focusing on water management, sustainable agriculture, coastal protection, green infrastructure, energy efficiency, and renewable energy sources, emphasizing collaboration between stakeholders at all levels for building resilience and promoting sustainable development [27,28,29].
2. Materials and Methods
2.1. Study Area
The Mediterranean climate is renowned for its distinctive seasonal variations, featuring hot, dry summers and mild, wet winters. This climate pattern is prevalent across regions bordering the Mediterranean Sea, encompassing Southern Europe, North Africa and parts of the Middle East [30]. During the summer months, temperatures in Mediterranean areas can soar, often exceeding 30 °C, while winters are characterized by milder temperatures and increased precipitation, including occasional snowfall in higher elevations. Moreover, the transition between seasons in the Mediterranean climate is marked by noticeable shifts in temperature and precipitation, with spring and autumn characterized by moderate temperatures and increasing rainfall as the region transitions from one extreme to another [31,32,33]. As part of the global climate change effects, urban areas within Mediterranean regions are facing challenges related to global warming, where built-up areas tend to retain heat and stagnant atmospheric conditions, resulting in higher temperatures compared to surrounding rural areas [16,34,35]. These effects are compounded by other factors such as reduced green spaces and increased energy consumption, contributing to heatwaves and elevated temperatures within Mediterranean cities [36,37]. This study addresses the issue of climate change in Annaba city. It is a North African city located in the northeast of Algeria, 600 km from the capital Algiers, within the Mediterranean region (Figure 1). The Mediterranean climate is characterized by mild, wet winters and hot, dry summers and has long been a defining feature of Annaba. Despite its classification as possessing a subhumid and moderate climate [38], in recent years, the city has witnessed a discernible departure from this norm, experiencing unprecedented weather phenomena, particularly instances of excessive heat phenomena such as the urban heat island (UHI) effect [39,40]. In tandem with these local disturbances, the World Meteorological Organization (WMO) has been at the forefront of monitoring and analyzing global climate trends, consistently reporting an alarming increase in average global temperatures over the past few decades and specifically in summer 2023, serving as a poignant indicator of global climate change trends [21]. This rise in temperature is attributed, as aforementioned, to various anthropogenic factors, including greenhouse gas emissions, deforestation, and industrial activities. This anomaly prompts critical inquiries into the extent to which broader global climate change influences the Mediterranean region. Against this backdrop, it is imperative to assess the extent to which Annaba city is affected by global climate change and to what degree local climatic variations align with the statistical trends reported by the WMO. Addressing this research problem requires a multi-faceted approach that combines empirical analyses of historical climate data, predictions of future conditions, and comparative assessments of global climate change statistics.
2.2. Scientific Methodology
This study aims to investigate the climatic shifts in Annaba city (situated in the Mediterranean region of Algeria) by utilizing a multi-step methodology that integrates data collection and analysis techniques, as presented in Figure 2. The main goal is to highlight decadal trends and seasonal variability and characterize extreme weather events within the broader context of urban climate change in the Mediterranean region. To achieve these objectives, data collection involved gathering 24 years of climate data from Annaba’s meteorological station, on-site measurements, and a questionnaire survey conducted during summer 2023. The collected data are then subjected to four main analyses. First, a time series analysis is conducted to describe climate parameters over 24 years. This analysis involves examining decadal trends from 2000 to 2019 and a 4-year series from 2020 to 2023 to identify the significant changes and patterns of air temperature, precipitation, and wind speed within Annaba city. Second, a statistical analysis is performed to identify the potential predictors for future climatic conditions from 2024 to 2029 using a linear regression model. The statistical analysis is also particularly focused on correlating various climatic variables using specialized bioclimate tools, with the aim to highlight the seasonal variability of the time frame 2000 to 2023. Furthermore, a third analysis focuses on a spatial study of the urban heat island (UHI) phenomenon and the perceived dimension of climatic shifts within Annaba city during the last decade. Data from on-site measurements, meteorological records, static data, and the questionnaire survey were integrated to provide a comprehensive understanding of the climate change aspects from the perspective of users, as well as the heat and the UHI phenomenon’s distribution within the agglomeration of Annaba. Finally, an analysis of extreme weather events was conducted, examining heat atmospheric events such as anticyclones and atmospheric blocking. This analysis aimed to characterize extreme weather events within the broader context of urban climate change in the Mediterranean region based on the three aforementioned analyses, to globally provide important insights into the potential impacts of climatic shifts on Annaba city.
2.2.1. Data Collection
The data collection process encompassed the gathering of diverse information sources. Initially, a dataset spanning 24 years (2000–2023) of climatic records was acquired from the meteorological station of Annaba city. The collected data included various parameters such as temperature (maximum, minimum and mean), relative humidity, wind speed and direction, atmospheric pressure, precipitation, cloud cover, and visibility. This dataset facilitated the compilation of a detailed historical overview of climatic patterns, crucial for contextualizing current observations and future projections. Furthermore, it is important to highlight that the obtained records encompass very narrow temporal intervals, often reaching increments as fine as 3 h. This level of temporal detail offered a detailed insight into short-term climatic fluctuations, thereby enriching the dataset with valuable information for subsequent analysis and interpretation. Moreover, the aforementioned parameters were sourced from the meteorological station situated at the city’s airport “Annaba Rabah Bitat International Airport”, approximately 15.4 km distant from the downtown area. This station is strategically located in a flat terrain characterized by short grass, lacking any significant obstructions such as trees, buildings, walls, or steep slopes. Such environmental characteristics ensure minimal interference with meteorological measurements, thus enhancing the reliability and accuracy of the acquired data [41]. Subsequently, a field measurement was undertaken in downtown Annaba during the 2023 summer overheating, specifically, from 5 to 7 July and 14 to 16 August 2023. A data collection campaign was conducted from 8 a.m. to 8 p.m. using a portable multifunctional device, the “Air Quality Monitoring Particle Counter PCE-MPC 20”. This device functions beyond mere particle counting, facilitating the measurement of air temperature and relative humidity with precisions of ±1.0 °C and ±3.5%, respectively, enabling a comprehensive environmental assessment. To ensure unbiased data acquisition, the instrument was consistently positioned at a height of 1.5 m on a white support to mitigate any potential influence on measurements. Concurrently, wind speed measurements were obtained using the “PROVA AVM-07 Anemometer” at a height of 2.2 m, which is designed for measuring wind speeds, temperatures, and environmental parameters within a range of 0.0 to 45.0 m/s, with an accuracy of ±0.3 m/s. All measurements were conducted under optimal conditions, characterized as clear skies, high solar irradiance, and maximal thermal stress. Additionally, a questionnaire survey titled “Questionnaire on the Climate of Annaba City for the time period 2013–2023” was conducted during the summer of 2023 within Annaba city. The survey was administered online due to unsuccessful attempts to conduct it on-site. It was distributed through social media platforms, particularly on the city’s Facebook pages with large followings, catering to both Arabic- and French-speaking inhabitants of the city, reflecting its bilingual nature. The questionnaire comprised two main sections. The first section focused on respondent identification, where participants were required to provide information including age, gender, address (to be selected from six options), and duration of residence at the provided address. The second section encompassed several questions categorized into three rubrics: general perception of climate, extreme weather events, and comparison with the previous decade. Following data screening, a total of 712 respondents were included in the analysis that was greatly facilitated by the use of Google Forms, as the responses were automatically organized into graphs.
2.2.2. Linear Regression Model
The statistical analysis conducted in this study employs a linear regression model utilizing data spanning from 2020 to 2023 as input. Previous studies have extensively utilized linear regression models to predict climatic data, owing to their established reliability in capturing and forecasting patterns in environmental variables [9,42]. Such models have been instrumental in various climatological research, providing significant results for predicting trends and fluctuations of different climatic parameters [43,44]. Drawing upon the reliability of these models, our study seeks to predict monthly values for three key climatic variables—air temperature, precipitation, and relative humidity—for the prospective period spanning from 2024 to 2029. The linear regression model serves as a pivotal tool in extrapolating future monthly climatic conditions based on historical data, thereby facilitating a comprehensive examination of potential climatic shifts within Annaba city. The linear regression model is expressed as (1)
where Y is the dependent variable to be predicted, X is the independent variable or the predictor used to predict Y, β0 is the intercept representing the value of Y when X is zero, β1 is the slopes indicating the change in Y for a unit change in X, and ε is the error term.
In this model, the coefficients β0 (intercept) and β1 (slope) are estimated using the method of least squares. The slope represents the rate of change or the trend over time. By calculating the slope for each year separately, we were able to assess the year-to-year variations in the data and capture any fluctuations or trends that occurred annually. The goal is to find the values of β0 and β1 that minimize the sum of squared differences between the observed values of the dependent variable (Y) and the values predicted by the regression equation. The formula for β1 is as follows:
The formula for β0 is as follows:
The predicted value of Y can then be calculated using the following formula:
The error term ε for each data point is the difference between the observed value of Y and the predicted value of Y:
where and are the means of the independent variable X and the dependent variable Y, respectively, and represent individual data points in the dataset, and represents the error term for each data point, which is the difference between the observed value Y and the predicted value based on the regression equation.
2.2.3. Bioclimate Tools
After utilizing linear regression to predict data for the time period from 2024 to 2029, our next step is to incorporate data spanning three decades from 2000 to 2029 into our statistical analysis within Annaba city. By extending the dataset, this analysis aims to enhance the accuracy and reliability of the predictions. Furthermore, the study offers an extended analysis by examining the correlation between climatic variables using specialized bioclimate tools designed for the Mediterranean climate, including the aridity index and Emberger method. Additionally, we will leverage the thermal state using a climatogram tool and psychrometric chart for Annaba city to deepen the understanding of the complex relationships between climatic factors.
De Martonne aridity index: This index was developed by the French geographer Emmanuelle De Martonne and is a method used to assess the aridity or dryness of a climate based on the relationship between precipitation and temperature (2). The index was developed to categorise climates based on their aridity level [45], as shown in Table 1. The De Martonne aridity index provides a quantitative measure of the balance between precipitation and potential evapotranspiration in a particular region, which is valuable for understanding the water availability and environmental conditions of an area.
where I aridity is the De Martonne aridity index, P is the average annual precipitation in millimetres, and T is the average annual temperature in degrees Celsius.
Emberger method: The Emberger method, specifically designed for Mediterranean regions, utilizes precise meteorological data spanning multiple years. This method involves calculating aridity based on annual precipitation and temperatures recorded in a given city for a given decade, denoted as Q (3). The results are then graphically represented on a two-axis graph. In our study, the Emberger method will be applied to analyze three separate decades from 2000 to 2029 to discern shifts in Annaba’s climatic floor. Emberger identifies five climatic floors: Saharan, arid, semi-arid, sub-humid, and humid.
where Q represents the rainfall quotient plotted on the y-axis, P stands for the average annual precipitation over a 10-year period, M signifies the maximum mean temperature of the hottest month, and m represents the minimum average temperature of the coldest month in degrees Celsius, plotted on the x-axis.
Climatogram tool: The climatogram is a fundamental tool in our statistical analysis, serving as a graphical representation depicting temperature and precipitation data over three decades, from 2000 to 2029 in Annaba city. Our analysis utilizes climatograms to discern dry periods and observe any shifts that occurred within the city’s climate. By examining the climatogram, we can effectively identify the duration and severity of dry spells, crucial for understanding the region’s climatic patterns. Additionally, this tool aids in determining the frequency and intensity of “hard days”, providing valuable insights into the climatic challenges faced by the city on an annual basis.
Psychometric chart: The analysis of Annaba’s climate over the three-decade period from 2000 to 2029 utilizes a psychometric chart to examine climate periods and make recommendations tailored to each specific period. By leveraging the psychometric chart, we aim to delve deeper into the nuances of the city’s climate, identifying distinct seasonal patterns and variations in temperature and humidity. This detailed analysis allows us to offer targeted recommendations for mitigating climate-related risks and optimizing resource allocation based on the unique characteristics of each climate period. Furthermore, our examination of psychometric charts applied to the three mentioned decades enables us to illuminate any significant changes or shifts in cold and hot conditions over the study period, offering important insights into the evolving climate dynamics of Annaba city.
3. Results
This section presents the outcomes of our research, which specifically addresses the climatic shifts within Annaba city, situated in the Mediterranean region of Algeria. As described in the methodology section, the conducted analyses are all geared towards investigating decadal trends, seasonal variability, and characterizing extreme weather events within Annaba city, all situated within the broader context of urban climate change in the Mediterranean region. Therefore, the results obtained from our research are undeniably and specifically climatic in nature, elucidating the specific climatic dynamics shaping Annaba’s environment and its implications for the broader region.
3.1. Time-Series Analysis
In order to provide a comprehensive understanding of the temporal dynamics of Annaba’s climate, including trends and climatic variations, a time series analysis of climate data spanning from 2000 to 2023 was conducted for Annaba city, focusing on air temperature, precipitation, and wind speed. The analysis entailed examining decadal trends from 2000 to 2019 and a 4-year series from 2020 to 2023 (inclusive) to identify significant changes and patterns within the city’s climate.
3.1.1. Air Temperature
The analysis began with an examination of air temperature, comparing the mean temperatures across the same times series from 2000 to 2023. The results are illustrated in the comparative graph below (Figure 3). The comparison reveals notable differences in temperature trends over these intervals. Across the entire studied period, there is a discernible increase in mean temperatures, with a slight uptick observed between the first (2000–2009) and the second decade (2010–2019). Notably, this overall increase is particularly pronounced in the month of May, reaching a maximum of 0.6 °C. However, when focusing specifically on the four-year time series, the observed temperature rises vary more widely. The 4-year series from 2020 to 2023 records higher increases, ranging between 0.1 °C and 1.1 °C. The most significant rises are recorded in July and August, with respective increases of 0.9 °C and 1.1 °C. Comparing the mean temperatures changes between the first two decades and the last four years reveals a noteworthy disparity. Thus, the highest increase is observed in July, where temperatures have risen by 1.6 °C. Overall, the analysis of temperature trends in Annaba city over the past 23 years reveals a consistent warming trend, with notable increases observed, particularly in the last four years. The findings indicate that temperatures have steadily risen over the study period, with January identified as the coldest month while July stands out as the hottest month, with both experiencing a remarkable increase in temperatures. Notably, the highest temperature increase is attributed to July, underscoring its significance in driving overall temperature shifts. Such results underscore the necessity for further analysis, particularly into the dynamics influencing July temperatures, to better understand and address the implications of this warming trend.
3.1.2. Precipitation
The conducted analysis examines the mean precipitation levels across two distinct temporal spans: the two decades from 2000 to 2019, and the subsequent four-year period from 2020 to 2023. In addition to the temperature analysis, the precipitation analysis forms an integral component of the investigation into temporal variations within the climate of Annaba city. The results are presented in Figure 4. Upon comparing the three time series, notable patterns emerge. Despite December registering the highest precipitation quantity throughout the entire study period, reaching 1158.5 mm and exhibiting high precipitation levels for 8 months from September to April during the first decade from 2000 to 2009, the highest cumulative precipitation is observed in the second decade from 2010 to 2019. This heightened precipitation primarily stems from significant quantities recorded in February, March, October, and November, ranging between 747.3 mm and 1027.2 mm, with a mean deference of 323.9 mm compared to the first decade. Furthermore, the findings underscore a discernible trend towards drier conditions in the most recent four-year period from 2020 to 2023. Mean precipitation quantities during this period fail to surpass the threshold of 400 mm. By comparing the averaged mean quantities, it becomes evident that the first two decades, with respective averages of 515.3 mm and 542.7 mm, fall within a normal range, albeit displaying a slight disparity in precipitation volumes. In essence, the analysis reveals dynamic shifts in precipitation patterns over the examined periods, emphasizing a notable increase in precipitation levels during the second decade and a subsequent decline in the most recent years, thus highlighting the evolution of some anomalies in Annaba’s climate.
3.1.3. Wind Speed
In the scope of analyzing the climate of Annaba city, the mean wind speeds were compared over two decades from 2000 to 2019 and the four-year series from 2020 to 2023, as shown in Figure 5. The comparison of the three time series reveals a notable disruption in the wind regime. Across the entire period from 2000 to 2023, the mean wind speeds fluctuated between 11 km/h and 15 km/h, exhibiting an approximate decrease of 1 km/h between the respective periods. Specifically, a peak value of 14.9 km/h was recorded in the month of February during the first decade, while the maximum speed in the second decade, reaching 14 km/h, occurred in the month of July. Notably, the last four years experienced lower speeds, ranging between 11.2 km/h and 13.5 km/h. It is essential here to acknowledge that wind speed is influenced by various parameters, including surface roughness, building geometry, and broader global climatic factors. Given that the data were obtained from the city’s meteorological station, it is important to consider extraneous forces, particularly the impact of global climate phenomena, as the most influential factors shaping these observed wind speeds.
While the time series analysis provides valuable insights into the climate dynamics of Annaba city, it is clear that a more comprehensive approach, including statistical analysis and consideration of broader climatic factors, is necessary to effectively examine climate shifts in Annaba city. Conducting further research to predict climate data for the continuing decade (2020–2029) and to understand the underlying drivers of temperature, precipitation, and wind patterns will be of high significance in addressing the implications of climate change in the Mediterranean region.
3.2. Statistical Analysis
3.2.1. Future Potential Climatic Variations
In light of observed anomalies in climate conditions over the recent four-year period from 2020 to 2023 when compared to the preceding decade spanning from 2010 to 2019, the statistical analysis aims to examine future potential climatic shifts within Annaba city. To achieve this, a simple linear regression model is employed to predict air temperature, precipitation, and relative humidity for the subsequent period extending from 2024 to 2029. Different climatic variables were incorporated as plugins within the linear regression model, resulting in the formulation detailed in Table 2. Despite discerning a global pattern of higher precipitation at the beginning and end of the year, the dynamic shifts in precipitation patterns within Annaba city pose a challenging obstacle to predicting this climatic variable compared to air temperature. The difficulty in accurately predicting precipitation, especially in cold months with no clear trend, underscores the complexity of precipitation forecasting, due to diverse factors such as atmospheric conditions, geographical features, and climate variability. To address this issue, we opted to employ a linear regression model for each month spanning four years from 2020 to 2023. Using a four-year period for training the model to provide accurate predictions for the forthcoming period from 2024 to 2029 aligns with the observation that precipitation prediction accuracy varies across different months and seasons.
3.2.2. Linear Regression Model Validation
The validation of the linear regression model for air temperature, precipitation, and relative humidity was conducted by assessing the correlation between predicted and observed values. Specifically, the validation of the air temperature and relative humidity models encompassed the calculation of the coefficient R2 for mean, maximum, and minimum temperatures, and relative humidity, with the results depicted in Figure 6. Meanwhile, the validation process for precipitation involved calculating the mean monthly R2 as follows: First, calculate the covariance between the predicted and the observed precipitation, which measures the degree to which the two values change together, using the Formula (4). Second, calculate the standard deviation of predicted and observed values that measures the dispersion of data points in a series around their mean. using the formulas for standard deviation (5) and (6). Then, calculate the correlation coefficient R2 by dividing the covariance by the product of the standard deviations of the two series, as shown in Formula (7). The correlation coefficient measure of the linear relationship between the predicted and the observed variables ranges from −1 to 1. The obtained R2 values as well as the covariance and the deviation for the entire months are presented in Table 3 serving as a comprehensive assessment of the model’s performance in predicting precipitation patterns.
The regression model used for predicting air temperatures has demonstrated a high level of adequacy and reliability for climatic variation in Annaba city, as indicated by the calculated R2 values. Across the years 2020 to 2023, the model consistently achieved high R2 values, with an average R2 of approximately 0.95 for mean temperatures. Specifically, the R2 values for each individual year were impressive, with 2020 recording 0.97, 2021 with 0.90, 2022 with 0.95, and 2023 with 0.95. These values indicate that the model explains a significant proportion of the variability in the observed temperatures. With such strong performance in capturing temperature variations, the regression model is deemed suitable for predicting temperatures for the period from 2024 to 2029. Its accuracy is validated through the mean R2, instilling confidence in its ability to provide reliable forecasts for future temperature trends (Figure 6a). In contrast, the correlation between predicted and observed relative humidity unveils a more nuanced picture of model performance. For mean humidity, the R2 of 0.36 suggests that approximately 36% of the observed variability in humidity can be explained by the predicted values. This indicates a moderate correlation, implying that the model captures some but not all factors influencing mean humidity. For maximum humidity, the higher R2 of 0.6 indicates a stronger correlation, with approximately 60% of observed variability explained by the predicted values. This suggests a better performance of the model in predicting maximum humidity compared to mean humidity. Conversely, the R2 of 0.4 for minimum humidity indicates a moderate correlation, falling between the values for mean and maximum humidity (Figure 6b). Overall, the model performs moderately well for maximum humidity prediction, but its performance is weaker for mean and minimum humidity.
The correlation coefficient R2 values calculated for each month between the observed and predicted precipitation values for the years 2020 to 2023 indicate that the accuracy of the predictions varies across different months, as depicted in Table 3. Some months exhibit higher correlation coefficients and R2 values ranging between 0.77 and 0.99, indicating a stronger linear relationship between the observed and predicted precipitation values, while other months have lower values going down to 0.01, indicating a weaker relationship. This means that the accuracy of precipitation predictions using simple linear regression model varies with the season. For example, months like June, July, and August show relatively higher R2 values, with respective correlation coefficients of 0.85, 0.77, and 0.99, indicating that the model performs better in predicting precipitation during these warmer months compared to colder months. While the simple linear regression model provides some predictive power for precipitation, especially during certain months or seasons, the overall R2 values are moderate for other months, specifically, January, February, and April, with a R2 values of 0.43, 0.51, and 0.37, respectively. The mean R2 of 0.56 suggest that the model may not fully capture the complexity of precipitation patterns for Annaba city, which can be influenced by various parameters and may not follow a clear trend, especially during cold months such as March and October. In sum, the linear regression model exhibits strong reliability in predicting air temperatures for Annaba city, making it suitable for forecasting from 2024 to 2029. However, its performance varies for humidity and precipitation, showing moderate correlations with observed values. Despite this variability, the model remains acceptable for the study’s purpose, though a moderate use of the obtained data.
3.2.3. Bioclimate Analysis
The bioclimate analysis, as detailed in the methodology section, extends beyond referenced conventional methods [46,47]. The mean aridity index for each decade is prominently featured within the graph in Figure 7, providing a comprehensive overview of Annaba city climatic trends over this extended period. The aridity index values over consecutive decades from 2000 to 2029 reveal notable fluctuations in climatic conditions within Annaba city during the specified time frame. The first decade spanning from 2000 to 2009 exhibited a range of aridity index values between 13 and 35, with the lowest and highest values observed in 2001 and 2010, respectively. Conversely, during the subsequent decade from 2010 to 2019, the aridity index fluctuated between 16.9, recorded in 2017, and 30.3, observed in 2020. The heightened aridity during the first decade is attributed to decreased precipitation levels compared to the second decade. Despite both decades containing four years within the 10-year timeframe categorized as moderate arid, their mean aridity indices of 23 and 22, respectively, position them within the semi-arid classification, according to the De Martonne aridity categorization (Table 2). However, with a mean index of 13.4, the last decade from 2020 to 2029 falls outside the De Martonne categorization. Notably, only the year 2023 is identified as experiencing moderate aridity, with an index of 25.8. Projections using predicted data indicate a trend towards increased aridity from 2024 onwards, suggesting a shift towards drier conditions beyond both moderate and semi-arid classifications for the city’s climate.
To enhance the precision of aridity assessments for Annaba city spanning the period from 2000 to 2029, we implemented the Emberger method or the climate floor calculation, specifically tailored for Mediterranean regions. This method integrates various climatic parameters beyond precipitation and mean temperature, including the maximum mean temperature of the hottest month and the minimum average temperature of the coldest month. The results obtained from applying this methodology are visually depicted in Figure 8. The examination of the decades spanning from 2000 to 2009 and 2010 to 2019 revealed distinctive climatic characteristics, elucidated by respective rainfall quotients (Q) of 89.5 and 96, coupled with a categorization of having a moderate winter. These attributes position both decades within the sub-humid floor, indicating a climatic context marked by sufficient moisture levels. However, noteworthy distinctions emerge, as the first decade leans towards the semi-arid floor, signifying a tendency towards heightened aridity. Projections for the subsequent decade, spanning from 2020 to 2029, suggest a perceptible shift towards the semi-arid floor. This transformation is elucidated by a diminished rainfall quotient of 70.4 and a subtle decrease in cold temperatures.
The climatograms applied to Annaba city over the three-decade period from 2000 to 2029 serve the primary purpose of highlighting the duration and severity of dry spells within the region. By analyzing these climatograms, our study aimed to discern the frequency and intensity of “hard days” within different decades. The findings of this analysis are visually represented in Figure 9, which provides a graphical depiction of the observed trends and variations in mean dry period for three decades. Over the course of three decades, a discernible pattern emerged, characterized by alternating periods of climatic variation. These decades exhibited two distinct phases: a comparatively shorter wet period spanning 4 to 5 cold months, and a notably longer dry period extending over 6 to 8 months, renowned for its exceptionally high temperatures and limited precipitation. In the first decade from 2000 to 2009, the wet phase typically started from mid-November and persisted until the end of February, encompassing approximately 110 days. This decade was distinguished by a transitional phase from the wet to the dry period, specifically spanning from the end of February to the end of April. This transitional interval was characterized by moderate temperatures ranging between 20 and 24 °C and mean precipitation levels ranging from 600 to 700 mm, rendering it a period of climatic comfort. Subsequently, a protracted dry period unfolded from mid-May to mid-November, comprising an extensive span of challenging conditions marked by a substantial number of scorching days exceeding 210 in total (Figure 9a). During the subsequent decade spanning from 2010 to 2019, the climatic pattern in Annaba city exhibited a distinct seasonal variation. The wet season, extending from October to mid-April, was characterized by substantial precipitation levels ranging between 700 and 1100 mm and moderate temperatures ranging from 15 to 25 °C, encompassing approximately 185 days. Following this period, a dry season prevailed from mid-April to October, constituting the remainder of the year. Notably, July emerged as the hottest month, with temperatures soaring to 35 °C, accompanied by negligible precipitation (Figure 9b). Over the current decade spanning from 2020 to 2029, inclusive of the projected six-year period from 2024 to 2029, a discernible climatic trend has emerged, marked by distinct wet and dry seasons. Beginning from the first week of October and extending through the first days of March, a wet period has been observed, characterized by relatively low precipitation levels juxtaposed with elevated temperatures compared to preceding decades. Notably, the maximum predicted precipitation during this phase exceeds 1100 mm in November, spanning approximately 95 days. Subsequently, this wet season transitions into a dry and arid period persisting from March to October, encompassing the remaining 170 days of the year (Figure 9c). Of particular significance are the months of July and August, identified as the hottest months, with temperatures surpassing 35 °C and devoid of almost any recorded precipitation. This climatic pattern delineates a pronounced seasonal dichotomy, underscoring shifts in precipitation levels and temperature dynamics over the specified timeframe.
Our study employed the psychometric chart to deeply delve into the intricacies of Annaba’s climate, uncovering distinct seasonal patterns and nuanced variations in the temperature and humidity of the three decades spanning from 2000 to 2029, with the findings presented in the diagrams below (Figure 10). The application of the psychrometric chart for the first decade from 2000 to 2009 revealed the presence of four distinct periods. The initial phase is characterized by cold temperatures ranging from 7 °C to 20 °C and humidity levels between 55% and 95%, predominantly impacting the months of January, February, and December, and partially extending into March, April, November, and some days of October. During this period, recommendations lean towards passive solutions such as internal modifications, occupant adaptation, and passive solar heating. The subsequent phase is identified as neutral, affecting a limited duration within January, February, and March, and a significant portion of April, November, and October, with temperatures ranging from 20 °C to 25 °C. This period falls comfortably within the green color-coded comfort zone of the chart, requiring no specific adjustments or occupants’ adaptation. The third period emerges as hot, demanding strategies like substantial thermal mass, natural cooling, and mechanical ventilation, impacting approximately half of May and June, along with portions of October, March, and April, with temperatures ranging between 25 °C and 32 °C. Lastly, the most critical phase is denoted as very hot, encompassing a considerable portion of June and the entirety of July, August, and September, distinguished by temperatures exceeding 34 °C. Recommendations for this intense period include the implementation of conventional air conditioning systems (Figure 10a). During the second decade from 2010 to 2019, the climatic analysis of Annaba city maintains the identification of four primary periods. The first period is cold, with temperatures ranging from 9 °C to 20 °C and a humidity range of 55% to 95%. This period significantly touched the months of January, February, and December, and extends partially into March, April, November, October, and some days of May. Passive solutions and human adaptation strategies are recommended to cope with these climatic conditions. The second period, identified as neutral, affects a considerable portion of February, March, October, November, and December, and a smaller fraction of January and April, with temperatures ranging from 20 °C to 25 °C. No corrections or occupant adjustments are warranted during this period, as it falls comfortably within the comfort zone presented in the chart. The third period is categorized as hot, affecting the month of May and spanning several days of the hotter months from June to September, along with a portion of November and October, with temperatures ranging between 25 and 34 °C, necessitating the utilization of large thermal mass, natural cooling, and mechanical ventilation. The final period is classified as very hot, significantly impacting a considerable portion of May and June, as well as the hot months of July, August, and September, characterized by temperatures exceeding 34 °C. Recommendations during this challenging period include the implementation of mechanical ventilation and conventional air conditioning systems, as indicated by the psychrometric chart (Figure 10b). The last decade from 2020 to 2029 witnesses a notable global trend towards the upper zoning of the psychrometric chart, consequently reshaping the climatic periods observed in Annaba city. Two main seasons emerge from this shift. The first season is moderate and encompasses two distinct periods: a moderately cold phase characterized by temperatures ranging from 13 to 20 °C and a humidity range of 60% to 95%, followed by a cooler period with temperatures capped at 24 °C. This season predominantly affects the initial months of the year, including January, February, March, and April, and a portion of December, along with some days in October. It generally necessitates minimal corrections or physical recommendations, relying instead on adaptive human mechanisms to cope with varying climatic severities. Notably, projections to 2029 indicate a shift in the cold period towards December rather than January. The second season is notably more challenging, comprising two periods, hot and very hot, akin to the preceding decades. Recommendations during this season emphasize the utilization of large thermal mass, natural cooling, and mechanical ventilation. It extensively impacts the month of May and spans several days of the hotter months from June to September, along with a portion of November and October, with temperatures ranging between 25 and 34 °C. The final period within this season is characterized by very hot temperatures exceeding 35 °C, predominantly affecting half of May and June and the hot months of July, August, and September. Recommendations during this intense period include the implementation of mechanical ventilation and conventional air conditioning systems. A defining characteristic of this season is the prolonged duration of extreme climate conditions and the notable similarity in conditions between October and April, which are included within the hot period (Figure 10c).
3.3. Spatial Analysis
Based on the observed warming trend of Annaba city from the climate analysis spanning the period of 2020 to 2023, and considering the projections for 2024 to 2029, we conducted a spatial analysis of the city. Employing a diverse range of methodologies, our study meticulously scrutinized the spatial distribution and intensity of the urban heat island (UHI) phenomenon within Annaba city. Incorporating data derived from on-site measurements, meteorological records, static datasets, and a comprehensive questionnaire survey, this analysis aimed to furnish a global understanding of the UHI characteristics and underlying drivers within the context of the Mediterranean climate of the city.
3.3.1. UHI Quantification over the Agglomeration of Annaba
The quantification of UHI intensity across the city agglomeration was pursued through two distinct methodologies. Firstly, an on-site approach was adopted, involving a field measurement undertaken in downtown Annaba during the 2023 summer overheating from 5 to 7 July and 14 to 16 August 2023. After data screening, we selected the 6th of July and 14 August 2023, for calculating the temperature differentials difference from 8 a.m. to 8 p.m. This method compared temperature readings recorded in downtown Annaba with those recorded at a meteorological station situated in the city’s periphery, specifically at the airport of Annaba city. Secondly, we used the static method proposed by Oke in Geneva in 1982 was employed. This method focuses on the direct influence of wind speed on heat intensity, as well as the role of urban population in determining city size. Oke’s Formula (8) for estimating temperature differentials within urban areas, based on the resident population and reference wind speed, was utilized for this purpose.
where represents the maximum temperature differential within the urban area, P is the resident population esteemed at 263,913 inhabitants in 2020, and U signifies the wind speed in meters per second obtained from the meteorological station of the city.
The ensuing results of both methods are delineated in Figure 11. An analysis of urban temperatures was conducted for the first day, 7 July 2023, and the positive difference of urban temperatures, determined through the on-site method, was recorded at 4.7 °C, with a maximum difference reaching 6.6 °C observed at 12 p.m. The trend exhibited an ascending pattern from the morning until the peak at noon, followed by a descent to a minimum difference observed at 5 p.m. Additionally, the statistic method indicated noticeable differences ranging between 4 °C and 6.6 °C, with a peak observed during the hottest hours from 12 p.m. to 2 p.m. The mean difference for this method showed an increase of 0.6 °C compared to the on-site method, totaling 5.3 °C. Figure 11a. On the second day, 14 August 2023, a similar trend was observed with an ascending pattern leading to a peak of 6.9 °C at 12 p.m., followed by a descent to 4.5 °C at 4 p.m. before ascending again for the remaining hours. The mean difference of urban temperatures was calculated to be 4.8 °C. The results of the statistical approach for this day revealed a significant mean difference of 5.4 °C, with a maximum difference of 6.6 °C registered from noon to 3 p.m., followed by a period of decrease before rising again in the evening hours (Figure 11b). For both days, and using both methods, the critical period extended for three hours from 12 p.m. to 2 p.m., with respective mean differences of 6.4 °C and 6.6 °C. These findings suggest a consistent trend of increasing urban temperatures during midday hours, indicative of the pronounced effect of the urban heat island (UHI) phenomenon. The elevated temperatures observed in the midday hours highlight the intensified heat retention and absorption within Annaba city. Furthermore, the subsequent slight decrease in temperatures during the late afternoon suggests a temporary dissipation of heat as the day progresses. However, the rise observed again towards the evening hours indicates that the UHI effects persist and extend into nighttime, contributing to warmer urban temperatures even after sunset.
3.3.2. Perceived Climate of Annaba City
The spatial analysis conducted in Annaba city integrated a questionnaire survey to provide a comprehensive understanding of climate change aspects from the perspective of users, as well as to analyze the distribution of heat and urban heat island (UHI) phenomena within the city. The questionnaire was carefully designed to serve the study’s purpose, focusing on key areas such as the general perception of climate among residents, experiences with extreme weather events (EWE), and comparisons with climate conditions from the previous decade. Specifically, participants were asked to provide their perception of air temperature, precipitation, and relative humidity, as well as to report on the presence and evolution of extreme weather events. By involving five-option response scale answers, these questions aimed to capture residents’ firsthand experiences and observations related to climate change. The results of the questionnaire are presented in Figure 12. The perception of air temperature among participants in the survey was assessed through a structured question with multiple-choice responses. Specifically, respondents were asked to select one of the following options: “temperatures have risen considerably, temperatures have increased slightly, temperatures remained relatively stable, temperatures have decreased slightly, and temperatures have dropped considerably”. Analysis of the responses revealed that the substantial majority (75.2%) of participants indicated that temperatures have risen considerably. Additionally, a notable proportion (20.4%) reported perceiving a slight increase in temperatures, while the minority (3.1%) indicated that temperatures remained relatively stable. Negligible votes were recorded for the options suggesting a decrease in temperatures. For the example of air temperature, the perception of precipitation among survey respondents was evaluated using a scale consisting of five response options: “precipitation has decreased considerably, precipitation decreased slightly, precipitation remained relatively stable, precipitation increased slightly, precipitation has increased significantly”. Participant votes revealed that a majority (53.9%) indicated a perception of considerable decrease in precipitation over recent years. Additionally, a substantial proportion (27%) reported perceiving a slight decrease in precipitation levels. A smaller percentage of participants (5.5%) perceived precipitation as remaining relatively stable, while 4.5% indicated a slight increase in precipitation. Notably, a larger proportion of respondents (9%) perceived a significant increase in precipitation within the city. The perception of variations in relative humidity within the city was conducted through a survey question presenting respondents with five response options: “the relative humidity has increased significantly, the relative humidity increased slightly, the relative humidity remained relatively stable, the relative humidity decreased slightly, the relative humidity has decreased considerably”. The responses revealed that a majority (68.9%) of respondents perceived a significant increase in relative humidity. Additionally, a notable proportion (20.4%) indicated a perception of a slight increase in relative humidity levels while a smaller percentage of participants (9.7%) indicated perceiving relative humidity as remaining relatively stable. Negligible percentages of respondents, 0.6% and 0.4%, respectively, perceived a slight decrease and a considerable decrease in relative humidity. In order to assess the perceived occurrence of extreme weather events within the city during the current decade, participants were asked a specific question: “Have you noticed any extreme weather events such as storms, floods, or droughts over the current decade?” The question provided respondents with five response options to choose from: “Extreme events have clearly appeared, there has been a slight occurrence of extreme events, there has been no presence of extreme events, there has been no slight occurrence of extreme events, no significant occurrence of extreme events”. As a result, we gathered information into residents’ perceptions regarding the presence of extreme weather events over the past decade. The majority of participants confirmed the presence of extreme weather events, with 41.4% indicating that the events have clearly occurred within the city’s climate, while 35.1% perceived a slight presence of extreme events. Additionally, 17.7% reported no extreme events occurred in the city. The remaining percentages of responses indicated neither slight nor significant occurrence of extreme events. The final question of the survey aimed to investigate the perceived evolution of extreme weather events compared to the previous decade. Respondents were presented with a set of response options, as follows: “Yes, extreme events have clearly increased in frequency and intensity. Yes, there has been a slight increase in extreme events. No, there has been no significant change in extreme events. No, there has been a slight decrease in extreme events. No, extreme events have significantly decreased”. An analysis of participant responses revealed that the majority confirmed the presence of extreme weather events, with 52% indicating a clear increase in frequency and intensity, while 32.8% perceived a slight increase in extreme events. Additionally, 7.9% of respondents perceived no significant change in extreme events. The remaining percentages of responses indicated a decrease in extreme events, with 5.1% perceiving a slight decrease and 2.3% indicating a significant decrease.
The comparison of climatic shifts between the current decade and the previous decade revealed that a significant majority of respondents, accounting for 82.2%, indicated that the climatic shifts within the city have been more pronounced and rapid in the current decade. As a continuation of the study, specific aspects of climate change observed to be more marked during the decade 2013–2023 compared to the previous decade were investigated. The results of this investigation are presented in the graph below (Figure 13). The findings of the study revealed several aspects of climate change observed by residents of Annaba city during the current decade. The most prominent aspect identified was the rapid increase in summer temperatures, with over 500 votes from participants. Following closely, the second aspect noted was the heightened occurrence of prolonged droughts, which garnered more than 350 votes. Additionally, participants highlighted an increased frequency of prolonged heat waves as the third aspect characterizing climate change within the city, with 332 votes. Changes in the seasonality of climatic phenomena, including early spring and less harsh winters, were ranked as the fourth aspect contributing to climatic shifts in recent years within Annaba city. Lastly, the increased frequency of extreme precipitation events was noted as the least prominent aspect of climate change, with 101 votes. It is noteworthy that 44.5% of the participants in the study reside in the periphery of the city, while 14% reside in the city’s north side (seafront), and only 9.6% are residents of the downtown area. Through a simple correlation of the participants’ addresses and the responses obtained regarding climatic shifts, it can be inferred that conditions are more severe in the periphery compared to downtown. This suggests that heat is distributed more intensely in the periphery of the city, leading to a more pronounced urban heat island (UHI) effect in the surrounding areas characterized by dense and compact urban geometries compared to downtown, which features a checkerboard pattern with medium density where the UHI effect was quantified. In sum, the perceived dimension of Annaba’s climate highlighted significant shifts in temperature, precipitation, relative humidity, and extreme weather events over the past decade, with a majority of participants indicating pronounced changes. Notably, the findings underscored a rapid increase in summer temperatures and heightened occurrences of prolonged droughts as the most prominent aspects of climate change observed within the city. Additionally, shifts in the seasonality of climatic phenomena and increased frequency of extreme precipitation events were noted. Furthermore, the climatic conditions are more severe in the periphery compared to downtown, with a more intense distribution of heat leading to a more pronounced urban heat island (UHI) effect in densely populated areas surrounding the city, further contributing to a comprehensive understanding of local climate shifts and global climate change effects.
3.4. Extreme Weather Events Analysis
The analysis of extreme weather events in Annaba city based on diverse findings from previous analyses includes anomalies observed in climate conditions over the recent four-year span from 2020 to 2023 and the noticeable warming trend from the projections for the period spanning 2024 to 2029. The climate trend in Annaba city featured prolonged extreme climate conditions, notably during July, with deviated temperatures from the typical elevated levels. This pattern revealed significant shifts in precipitation and temperature dynamics, supported by spatial analysis showing a consistent increase in urban temperatures due to urban heat island effects in addition to the perceived occurrence of extreme weather events by the residents of Annaba city, indicating changes in seasonality and an increased frequency of extreme events.
3.4.1. The Rapid Increase in Summer Temperatures
For a more accurate analysis of extreme weather events in Annaba city, particularly regarding the rapid increase in summer temperatures reported by residents, we conducted an in-depth investigation into the deviations of July temperatures from the typical elevated levels. The results of the daily variation of July temperatures from 2000 to 2023 are presented in Figure 14. The findings indicated an increasing trend into the variability and extremity of summer temperatures in Annaba city over a span of 24 years. The observed trend of increasing mean maximum temperatures revealed that the highest mean maximum temperature was observed over a 24-year period occurred in the year 2023, with a value of 35.2 °C. The second highest mean maximum temperature was recorded as 33 °C in the year 2003. Conversely, the lowest mean maximum temperature was observed in July 2003, with a value of 29.5 °C. Further analysis beyond the highest mean maximum temperatures indicates that July 2003 experienced temperature ranges between 29 °C and 43.4 °C, with respective recordings on July 5th and July 22nd. In contrast, July 2023 witnessed the hottest temperatures, ranging between 27.9 °C and 48 °C, recorded on 1 July and 24 July, respectively. The temperature of 48.2 °C is the highest maximum temperature recorded in Annaba city over the 23-year period, beating the previous record of 45.7 °C recorded on 3 July 2014. The occurrence of these exceptional fluctuations in temperature extremes pose significant challenges, necessitating a deep understanding of the temporal distribution and intensity of heat events, particularly, a characterization of the heat atmospheric events over the agglomeration of Annaba, such as anticyclones and atmospheric blocking.
3.4.2. Characterization of Heat Atmospheric Events
Anticyclones and atmospheric blocking are particular weather conditions that can contribute to global warming in built-up areas as well as to the prolonged extreme climate conditions. Our study focused on the characterization of heat atmospheric events that occurred in July 2023 in Annaba city. Specifically, we aimed to characterize the presence of anticyclones and atmospheric blocking phenomena over the agglomeration of Annaba during the occurrence period of exceptionally high fluctuations in temperature extremes on 24 July 2023. This characterization of anticyclones and atmospheric blocking phenomena is performed based on analyzing a two-week summary of Annaba’s weather conditions, including the 24th of July. The weather conditions were obtained from the city’s meteorological station, including temperature, precipitation, wind speed and direction, atmospheric pressure and cloud cover. Additionally, we utilized a 3-hourly graphic weather summary to supplement our analysis and provide a comprehensive understanding of the atmospheric dynamics influencing the observed heat events in Annaba city. A summary of Annaba’s weather conditions, including the 24th of July, is presented in Table 4. The analysis of a two-week summary of weather conditions in Annaba, including the 24th of July, revealed overall similar atmospheric conditions before and after this date, characterized globally by calm conditions. However, notable differences were observed in temperature and humidity levels. Specifically, temperatures were higher in the first week, with a maximum temperature difference of 5.9 °C, whereas humidity was lower during this period. Other meteorological parameters remained relatively consistent throughout the observed period. The mean sea-level pressure remained stable at 1014 hPa, indicating a lack of significant atmospheric pressure changes. Precipitation was absent during both weeks, contributing to the dry weather conditions observed. The total cloud cover was minimal, with values ranging from 0 to 1.4 okta, further indicating predominantly clear skies and minimal cloudiness. Horizontal visibility at the surface remained consistently high at 10 km, indicating good visibility and a lack of atmospheric obstructions. These findings were corroborated by 3-hourly weather summaries, which consistently reported calm weather conditions with no significant deviations from the observed trends. Additionally, wind directions varied slightly, with predominantly northerly and northeasterly winds observed during both weeks. However, there were differences in wind speeds between the two weeks, with speeds of 9.5 km/h and 13.2 km/h recorded for the weeks before and after the 24th of July, respectively. Despite these variations in wind speed, overall weather conditions remained calm and consistent throughout the analyzed period, characterized by dry, clear skies and stagnant atmospheric conditions. The calm weather conditions that prevailed in Annaba were abruptly disrupted on 24 July 2023, by a significant deviation in temperatures from the typical elevated levels experienced during this period despite clear skies and nearly identical visibility and atmospheric pressure to previous days. The maximum temperatures soared by 10 °C compared to the first week and were notably higher by 15.9 °C compared to the week following 24 July. Moreover, the mean temperature deviation on this day was 36 °C, indicating an increase of 5.3 °C and 8.4 °C, respectively, compared to the weeks before and after. This sudden shift in weather conditions was accompanied by high wind speeds reaching 14 km/h, with winds predominantly from the south and southwest directions. The combination of extreme temperature deviations and increased wind speeds contributed to the disruptive nature of the weather event experienced on 24 July 2023, marking a departure from the previously calm and consistent atmospheric conditions.
Considering the urban morphology of Annaba city and the pronounced urban heat island (UHI) effects, particularly the temperature differentials exceeding 6 °C, the significant deviation in July’s temperatures may be amplified within the built-up areas of the city, reaching 54 °C and more. Therefore, delving deeper into the weather conditions of 24 July 2023 is crucial for characterizing and identifying which heat atmospheric event is most pronounced within the climate of Annaba city, whether it be anticyclones or atmospheric blocking phenomena. The figures below present a 3-hourly summary of Annaba’s weather conditions on 24 July 2023, including temperature, relative humidity, wind speed, and visibility (Figure 15), as well as the pressure and its trend of the same day (Figure 16). The results of the analysis revealed a consistent trend in weather conditions from 12 a.m. to 6 a.m., characterized by temperatures ranging from 27 °C to 29.7 °C, relative humidity fluctuating between 42% and 29%, wind speeds ranging from 9.3 km/h to 7.4 km/h, and a mean horizontal visibility at the surface of 10 km. However, a notable shift occurred during the 3-hourly period covering 6 a.m., initiating a global change in all conditions over the subsequent 9 h extending from 6 a.m. to 3 p.m. During this period, temperatures and wind speeds exhibited a parallel increase, peaking at 47.7 °C and 29.7 km/h, respectively, between 12 p.m. and 3 p.m. In contrast, relative humidity decreased significantly, reaching 11%, while horizontal visibility at the surface was limited to 6 km due to forest fires and industrial smoke in Annaba city, as shown in Table 4 and Figure 15. Notably, atmospheric pressure during this timeframe exhibited a low-pressure system, with a decreasing tendency of −2.1 and −2.3 (Figure 16). Additionally, wind directions were completely opposite compared to the week before and after, predominantly from the south during the period from 6 p.m. to 9 p.m., which witnessed a return to initial weather conditions, characterized by decreasing temperatures, increasing relative humidity, and steady trends in visibility and wind speeds. Furthermore, the pressure at sea level exhibited a steady increase, reaching 1008.9 hPa at 9 p.m. with a trend of 1.1.
4. Discussion
Our study was designed within the context of understanding the impact of global climate change on the Mediterranean region, focusing specifically on Annaba city, Algeria. Adopting a multi-step methodology, we aimed to address key aspects of this issue. Firstly, we explored decadal trends in climate data to discern long-term patterns and changes. Additionally, we investigated potential climatic shifts to anticipate future conditions and their implications. Furthermore, we examined seasonal variability to understand how climate patterns fluctuate throughout the year. Delving deeper, we analyzed extreme weather events to assess their intensity within the city.
4.1. Decadal Trends
The analysis conducted on the climate of Annaba city spans 24 years, focusing on air temperature, precipitation levels, and mean wind speeds. Notable findings include a consistent warming trend with maximum and minimum temperatures steadily rising, particularly in the last four years (2020–2023). This observed increase in temperatures aligns with global climate change trends, indicating the influence of broader climatic factors on the local climate of Annaba. Moreover, the warming trend observed in Annaba is consistent with the broader patterns of climate change observed globally [1,48]. The increase in temperatures, especially in the last four years, suggests a potential acceleration of climate change impacts in the region. This trend has significant implications for various aspects of life, particularly in Annaba city as a case study and in the Mediterranean region overall, including infrastructure planning, public health, and more. Such findings were found in similar contexts of the Mediterranean region, specifically in Spain and Italy [24,31,49]. January was identified as the coldest month, while July stands out as the hottest, experiencing the highest increase in temperatures. This seasonal variation in temperature is typical for many regions and is influenced by factors such as solar radiation, atmospheric circulation patterns, and proximity to large bodies of water [31,50]. The observed increase in temperatures during July could exacerbate heat-related issues in Annaba, including heatwaves and heat-related illnesses. Precipitation patterns show an increase in the second decade (2010–2019) compared to the first (2000–2009), with a subsequent decline in the most recent four-year period (2020–2023). This fluctuation in precipitation levels has significant implications for water resource management, urban life, and ecosystem dynamics in Annaba. In fact, the observed decline in precipitation in the most recent years is exacerbating water scarcity issues in the region, specifically in potable water supply and management, highlighting the need for sustainable water management practices, as recommended in previous studies [51,52]. Mean wind speeds fluctuated between 11 km/h and 15 km/h over the entire period, with lower speeds recorded in the last four years, attributed to rapid urbanisation and continuous urban growth and density, which agrees with a large number of studies [53,54]. Such changes in wind patterns can influence various aspects of life in Annaba, including air quality and the amplification of urban heat phenomena such as heatwaves and urban heat islands.
A subsequent investigation using a linear regression model predicted air temperature, precipitation, and humidity shifts from 2024 to 2029 based on anomalies observed from 2020 to 2023. The analysis of climatograms revealed alternating wet and dry seasons with distinct characteristics over three decades. The first decade (2000–2009) depicted a wet phase from mid-November to February, a transitional period until April, and a long dry period until mid-November with high temperatures. This pattern indicates a typical Mediterranean climate with wet winters and dry summers. The second decade (2010–2019) exhibited a wet season from October to mid-April and a dry season from mid-April to October, with July being the hottest month. This decade saw a continuation of the Mediterranean climate pattern, with slight variations in the timing and duration of wet and dry seasons. The current decade (2020–2029) portrays a wet period with higher temperatures and lower precipitation compared to previous decades. This shift in precipitation levels and temperature dynamics suggests a potential alteration in the regional climate pattern, possibly influenced by various factors of climate change, local land-use changes, and urbanization. The decadal climate trends in Annaba city over the past three decades have exhibited a consistent warming trend, supported by insights gleaned from a recent questionnaire survey aimed at capturing residents’ perspectives on climate change dynamics. Participants in the survey reported notable shifts in the city’s climate dimensions in the last four years and specifically in the year 2023, with a majority indicating a significant rise in air temperature (75.2%), a considerable decrease in precipitation (53.9%), and a noteworthy increase in relative humidity (68.9%). In short, the decadal analysis of climate trends in Annaba city spanning from 2000 to 2029, including projections from 2024 to 2029, revealed significant shifts in temperature and precipitation patterns. The consistent warming trend observed, particularly in the last four years, aligns with global climate change patterns and presents challenges for various sectors including infrastructure planning, public health, and water resource management [16,55]. The fluctuations in precipitation levels and declining mean wind speeds underscore the need for adaptive measures to address the evolving climate dynamics in the region [56,57]. Furthermore, residents’ perceptions captured through the questionnaire survey provide important insights into the local impacts of climate change, emphasizing the urgency for proactive strategies to enhance climate resilience in Annaba city and beyond the Mediterranean region.
4.2. Potential Climatic Shifts and Seasonal Variability
By utilizing specialized bioclimate tools, our focus was on discerning seasonal variability and phase changes in the climate flow over a 30-year period from 2000 to 2029, with projections extending from 2024 to 2029. Expanding upon the assessment of Annaba city’s aridity, both the De Martonne and Emberger methods shed light on the impacts of climate change in urban areas, particularly in Mediterranean regions. The first decade, characterized by heightened aridity, experienced a range of index values between 13 and 35. This heightened aridity was primarily attributed to decreased precipitation levels compared to the subsequent decade. Conversely, the second decade displayed a narrower range of aridity index values, fluctuating between 16.9 and 30.3. Despite both decades containing four years categorized as moderately arid, their mean aridity indices positioned them within the semi-arid classification. However, the last decade from 2020 to 2029 deviated from the De Martonne categorization, with a mean index falling outside the established classifications. Only the year 2023 was identified as experiencing moderate aridity, with projections indicating a trend towards increased aridity from 2024 onwards. Such significant fluctuations in the aridity index over three decades indicate a changing climate pattern, with the first decade experiencing heightened aridity, attributed to decreased precipitation levels, compared to the subsequent decade. This trend aligns with projections of increased aridity from 2024 onwards, suggesting a potential shift towards drier conditions beyond established classifications, which incorporates challenges for Annaba city’s climate resilience in the coming years. The Emberger method provides a more comprehensive understanding of Annaba’s climatic dynamics. The examination of the decades spanning from 2000 to 2009 and 2010 to 2019 revealed distinctive climatic characteristics elucidated by respective rainfall quotients (Q) of 89.5 and 96, coupled with a categorization of having a moderate winter. These attributes positioned both decades within the sub-humid floor, indicating sufficient moisture levels. However, noteworthy distinctions emerged as the first decade leaned towards the semi-arid floor, signifying a tendency towards heightened aridity. Projections for the subsequent decade, spanning from 2020 to 2029, suggested a perceptible shift towards the semi-arid floor. This transformation was elucidated by a diminished rainfall quotient of 70.4 and a subtle decrease in cold temperatures. The Emberger method identified distinctive climatic characteristics and revealed a perceptible shift towards the semi-arid floor in the subsequent decade, indicating the evolving impacts of climate change on Annaba’s climate. Overall, these findings are consistent with previous studies within different climates, including the Mediterranean regions, which is supported by several research works [22,45,58] recommending long-term climate planning and adaptation strategies in urban areas.
The extrapolation of Annaba’s psychrometric chart from 2000 to 2029 provided a comprehensive understanding of the city’s climatic seasonality over three decades. During the first decade (2000–2009), the identified climatic periods and corresponding recommendations underscore the importance of adapting architectural designs and occupant behaviours to suit varying environmental conditions. For instance, the cold period calls for passive solutions such as internal modifications and passive solar heating, emphasizing the need for buildings to incorporate thermal insulation and efficient heating systems. In contrast, the very hot period necessitates the implementation of conventional air conditioning systems, highlighting the importance of energy-efficient cooling technologies and building envelope design to mitigate heat gain. Similarly, the second decade (2010–2019) maintained the identification of distinct climatic periods, reaffirming the relevance of tailored design strategies and adaptive measures. The neutral period underscores the significance of maintaining thermal comfort within the green comfort zone of the psychrometric chart, advocating for building designs that promote natural ventilation and daylight to reduce reliance on mechanical systems. During the first two decades (2000–2009 and 2010–2019), the identified climatic periods can be regrouped within four seasons, with marked departures from the traditional seasonal variations experienced throughout the year. This observation underscores the abnormal rhythm of climatic changes and provides a familiar framework for understanding and adapting to seasonal fluctuations in temperature and humidity. In contrast, the last decade (2020–2029) fully departed from the traditional seasonal variations experienced throughout the year, reflecting a notable shift in climatic seasonality characterized by two main seasons—moderate and challenging—and reflecting the evolving climatic conditions, emphasizing the need for adaptive design solutions that prioritize occupant comfort, energy efficiency, and environmental sustainability [16,59]. The prolonged duration of extreme climate conditions underscores the importance of implementing robust building performance standards and integrating renewable energy systems to enhance building resilience and reduce greenhouse gas emissions.
4.3. Extreme Weather Events
The analysis of extreme weather events in Annaba city revealed a noticeable warming trend in Annaba city, with prolonged extreme climate conditions observed particularly during July, as well as significant shifts in temperature dynamics and increased urban temperatures attributed to the urban heat island effect. This warming trend is consistent with global climate change patterns observed worldwide, aligning with different climates [12,15,60,61]. The increase in temperatures over the recent four-year span from 2020 to 2023, and the projected warming trend from 2024 to 2029, globally suggest a significant shift in climate dynamics in the Mediterranean region, which is already found in previous studies [62,63]. Residents also reported changes in seasonality and increased frequency of extreme events. Moreover, the study highlighted extreme fluctuations in temperature, with July 2023 experiencing exceptionally high maximum temperatures, including a record-breaking maximum temperature of 48.2 °C, surpassing previous records. This extreme fluctuation posed challenges, especially considering the urban heat island effect, which amplified temperature differentials within built-up areas to a maximum of 6 °C. The UHI effect exacerbated the impact of temperature extremes, particularly during heatwaves. Similar findings were found in an important number of researches [64,65,66,67], highlighting the importance of urban planning and mitigation strategies to alleviate heat-related risks with the city. The study further explored specific atmospheric phenomena, such as anticyclones and atmospheric blocking, to understand their influence on extreme weather events. The analysis of weather conditions on 24 July 2023 revealed a significant deviation in temperatures and atmospheric conditions compared to preceding and subsequent weeks. The abrupt disruption of calm weather conditions in Annaba on 24 July 2023 highlighted the influence of atmospheric circulation within the Mediterranean region featured for both anticyclones and atmospheric blocking phenomena on local weather patterns. Anticyclones, characterized by stable atmospheric conditions and clear skies, typically lead to fair weather conditions. However, when these high-pressure systems become stationary or slow-moving, they can disrupt the normal flow of weather systems and lead to prolonged periods of extreme weather conditions. They are responsible for creating temperature inversions, where warmer air aloft traps cooler air near the surface. These characteristics align with the calm weather conditions observed in Annaba before 24 July 2023. Atmospheric blocking phenomena occur when persistent high-pressure systems disrupt the normal flow of the jet stream, leading to prolonged periods of unusual weather conditions. Unlike anticyclones, atmospheric blocking events can cause significant disruptions to the normal progression of weather systems, resulting in extreme weather conditions such as heatwaves and droughts. In the context of Annaba’s weather on 24 July 2023, the sudden deviation in temperatures from calm weather conditions and increased wind speeds align with the disruptive effects associated with atmospheric blocking phenomena. The significant temperature deviations, coupled with the increased wind speeds from the south and southwest directions, suggest the presence of atmospheric blocking that impeded the usual atmospheric flow and resulted in the observed extreme weather conditions, highlighting the influence of atmospheric circulation featured on Annaba’s local weather patterns. Additionally, external factors, including forest fires and industrial smoke, also contributed to atmospheric conditions and visibility, particularly during extreme weather events [35,49,60]. These findings emphasized the complex interplay of climate trends, urbanization effects, atmospheric phenomena, and external influences in shaping extreme weather events in Annaba city.
4.4. Urban and Architectural Recommendations
In sum, the study underscores the urgent need to address architectural and urban strategies to fight different effects of climate change in Annaba city and similar Mediterranean urban centres. The consistent warming trend and prolonged extreme climate conditions observed highlight the vulnerability of built environments to the impacts of global warming [29,64,66]. The exacerbation of temperature differentials within urban areas due to the urban heat island effect underscores the importance of urban planning and architectural design interventions aimed at mitigating heat stress and improving thermal comfort for residents [25,68,69]. Furthermore, the projected shift towards heightened aridity and altered climate seasonality necessitates adaptive measures in urban planning and architectural design to ensure resilience against future climate challenges. Incorporating green infrastructure, such as green roofs and permeable surfaces, can help mitigate the urban heat island effect and improve urban microclimates [70,71,72]. Additionally, promoting energy-efficient building designs and utilizing sustainable materials can contribute to reducing greenhouse gas emissions and mitigating the urban heat island effect [37,73,74,75]. Overall, addressing the architectural and urban aspects of climate change in Annaba city requires a holistic approach that integrates climate-responsive design principles, sustainable urban planning strategies, and community engagement to foster resilience and enhance the quality of life for residents in the face of evolving climatic conditions.
4.5. Study Limitations and Future Perspectives
Our study, while contributing to investigate climatic shifts in the Mediterranean region and specifically in Annaba city, encountered certain limitations that warrant acknowledgment. The examination of climatic shifts from 2024 to 2029 using a linear regression model successfully predicted future climate trends, yet the study revealed limitations concerning the model’s high reliability in predicting air temperatures but moderate performance in forecasting humidity and precipitation, underscoring the need for further refinement. Our findings revealed an increase in the urban temperature differential towards the evening hours, suggesting that UHI effects persist and extend into nighttime, thereby contributing to elevated urban temperatures post-sunset. However, it is important to note a limitation in our UHI quantification during nighttime, which may impact the credibility of such assessments. Nevertheless, this observation presents a promising avenue for future studies on the nocturnal UHI phenomenon, particularly within Mediterranean contexts. Moreover, the investigation into the extent to which Annaba city is affected by global climate change and the degree to which local climatic variations align with statistical trends reported by the WMO has revealed a complex interplay of factors. Our findings suggest that climate trends, urbanization effects, atmospheric phenomena, and external influences collectively shape extreme weather events in Annaba city. This nuanced understanding opens doors to new studies that can examine each aspect separately or collectively, aiming to dissect their individual contributions and interactions in shaping extreme weather events not only in Annaba city but also in other cities with similar Mediterranean climate conditions. Future studies could be directed towards investigating shifts in winter seasons, which have also experienced a global warming trend, especially since recent reports indicate that February 2024 has been globally identified as the warmest on record [76].
5. Conclusions
The present study investigated the climate change effects on Annaba city, Algeria, within the broader context of the Mediterranean region. Through a multi-step methodology encompassing decadal trend analysis, examination of potential climatic shifts, seasonal variability assessment, and an exploration of extreme weather events, we comprehensively analyzed the Climatic Shifts in Annaba city.
The yielded findings on potential climatic shifts and seasonal variability in Annaba city reveal a clear correlation with the global climate trends outlined in the 2023 Annual Climate Summary. Our findings demonstrate that Annaba, as part of the Mediterranean region, is significantly impacted by global climate change, experiencing unprecedented warmth, extreme weather events, and notable shifts in climatic patterns. The analysis of climatic shifts over a 30-year period highlights a discernible trend towards increased aridity, particularly pronounced in the last decade from 2020 to 2029. This aligns with the global observation of rising temperatures and decreased aerosols contributing to extreme climatic conditions. The identification of extreme weather events in Annaba, such as prolonged heatwaves and temperature fluctuations, mirrors the widespread impacts observed globally, underscoring the interconnectedness of regional and global climate dynamics. Moreover, our study emphasizes the role of atmospheric phenomena, including anticyclones and atmospheric blocking, in shaping local weather patterns and exacerbating extreme events. The influence of urbanization, exemplified by the urban heat island effect, further amplifies temperature differentials and underscores the importance of urban planning and mitigation strategies in adapting to changing climatic conditions.
Overall, our study provides meaningful insights into the extent to which Annaba city is affected by global climate change and its broader influences. The findings underscore the need for concerted efforts at local, regional, and global levels, focusing on urban and architectural aspects to mitigate the impacts of climate change and enhance resilience in vulnerable urban areas like Annaba.
Author Contributions
Conceptualization, B.S. and O.A.O.; methodology, B.S.; model, A.M.B. and W.S.Q.; validation, O.A.O. and B.S.; formal analysis, B.S. and A.M.B.; investigation, W.S.Q. and O.A.O.; resources, B.S.; data curation, B.S.; writing—original draft preparation, A.M.B. and W.S.Q.; writing—review and editing, O.A.O. and A.M.B.; visualization, B.S.; supervision, B.S.; project administration, B.S.; funding acquisition, B.S., O.A.O., A.M.B. and W.S.Q. All authors of this research article contributed equally to the conception, design, and execution of the study. Each author played a significant role in the data analysis, interpretation, and manuscript preparation. All authors have read and agreed to the published version of the manuscript.
Funding
This research received no external funding.
Informed Consent Statement
The original contributions presented in the study are included in the article, further inquiries can be directed to the corresponding author.
Data Availability Statement
The data presented in this study are available on request from the corresponding author.
Conflicts of Interest
The authors declare no conflicts of interest.
References
- Yuan, J.; Lin, Q.; Chen, S.; Zhao, H.; Xie, X.; Cai, Z.; Zhang, J.; Cheng, T.; Hua, M.; Zhang, R. Influence of global warming and urbanization on regional climate of Megacity: A case study of Chengdu, China. Urban Clim. 2022, 44, 101227. [Google Scholar] [CrossRef]
- Reichle, D.E. Anthropogenic alterations to the global carbon cycle and climate change. In The Global Carbon Cycle and Climate Change; Elsevier: Amsterdam, The Netherlands, 2020; pp. 209–251. [Google Scholar] [CrossRef]
- Nash, N.; Whitmarsh, L.; Capstick, S.; Gouveia, V.; Araújo, R.d.C.R.; dos Santos, M.; Palakatsela, R.; Liu, Y.; Harder, M.K.; Wang, X. Local climate change cultures: Climate-relevant discursive practices in three emerging economies. Clim. Chang. 2019, 163, 63–82. [Google Scholar] [CrossRef] [PubMed]
- Mateos, R.M.; Sarro, R.; Díez-Herrero, A.; Reyes-Carmona, C.; López-Vinielles, J.; Ezquerro, P.; Martínez-Corbella, M.; Bru, G.; Luque, J.A.; Barra, A.; et al. Assessment of the Socio-Economic Impacts of Extreme Weather Events on the Coast of Southwest Europe during the Period 2009–2020. Appl. Sci. 2023, 13, 2640. [Google Scholar] [CrossRef]
- Prall, M.; Olazabal, M.; Lehmann, M. Socio-economic projections in urban climate change adaptation planning: Practices and prospects for just adaptation. Habitat Int. 2023, 142, 102946. [Google Scholar] [CrossRef]
- Nuruzzaman, M. Urban Heat Island: Causes, Effects and Mitigation Measures—A Review. Int. J. Environ. Monit. Anal. 2015, 3, 67–73. [Google Scholar] [CrossRef]
- Yang, L.; Qian, F.; Song, D.-X.; Zheng, K.-J. Research on Urban Heat-Island Effect. Procedia Eng. 2016, 169, 11–18. [Google Scholar] [CrossRef]
- Ponraj, M.; Lee, Y.Y.; Din, M.F.M.; Noor, Z.Z.; Iwao, K.; Chelliapan, S. Overview of Urban Heat Island (UHI) phenomenon towards human thermal comfort. Environ. Eng. Manag. J. 2017, 16, 2097–2111. [Google Scholar] [CrossRef]
- Oukawa, G.Y.; Krecl, P.; Targino, A.C. Fine-scale modeling of the urban heat island: A comparison of multiple linear regression and random forest approaches. Sci. Total Environ. 2022, 815, 152836. [Google Scholar] [CrossRef] [PubMed]
- de Almeida, C.R.; Teodoro, A.C.; Gonçalves, A. Study of the urban heat island (Uhi) using remote sensing data/techniques: A systematic review. Environments 2021, 8, 105. [Google Scholar] [CrossRef]
- Udara, P. Air pollution in urban areas and health effects. J. Antarabangsa Alam Tamadun Melayu 2016, 4, 25–33. [Google Scholar]
- Puigserver, D.; Giménez, J.; Gràcia, F.; Granell, À.; Carmona, J.M.; Torrandell, A.; Fornós, J.J. Effects of global and climate change on the freshwater-seawater interface movement in a Mediterranean karst aquifer of Mallorca Island. Sci. Total Environ. 2024, 912, 169246. [Google Scholar] [CrossRef] [PubMed]
- Hameed, H.M. Estimating the effect of urban growth on annual runoff volume using GIS in the Erbil Sub-Basin of the Kurdistan Region of Iraq. Hydrology 2017, 4, 12. [Google Scholar] [CrossRef]
- Tomczyk, A.M.; Mendel, K. Characteristics of Biometeorological Conditions in Poland during the Long May Weekend Based on the Universal Thermal Climate Index. Atmosphere 2023, 14, 1334. [Google Scholar] [CrossRef]
- Tesselaar, M.; Botzen, W.J.W.; Aerts, J.C. Impacts of climate change and remote natural catastrophes on eu flood insurance markets: An analysis of soft and hard reinsurance markets for flood coverage. Atmosphere 2020, 11, 146. [Google Scholar] [CrossRef]
- Salata, F.; Falasca, S.; Ciancio, V.; Curci, G.; de Wilde, P. Climate-change related evolution of future building cooling energy demand in a Mediterranean Country. Energy Build. 2023, 290, 113112. [Google Scholar] [CrossRef]
- Carrasco, J.F.; Bozkurt, D.; Cordero, R.R. A review of the observed air temperature in the Antarctic Peninsula. Did the warming trend come back after the early 21st hiatus? Polar Sci. 2021, 28, 100653. [Google Scholar] [CrossRef]
- Swingedouw, D.; Mignot, J.; Guilyardi, E.; Nguyen, S.; Ormières, L. Tentative reconstruction of the 1998–2012 hiatus in global temperature warming using the IPSL–CM5A–LR climate model. Comptes Rendus Geosci. 2017, 349, 369–379. [Google Scholar] [CrossRef]
- Li, N.; Cuo, L.; Zhang, Y.; Ding, J. The synthesis of potential factors contributing to the asynchronous warming between air and shallow ground since the 2000s on the Tibetan Plateau. Geoderma 2024, 441, 116753. [Google Scholar] [CrossRef]
- Scafetta, N. Impacts and risks of “realistic” global warming projections for the 21st century. Geosci. Front. 2024, 15, 101774. [Google Scholar] [CrossRef]
- European Commission—Copernicus. The 2023 Annual Climate Summary Global Climate Highlights 2023; European Commission: Luxembourg, 2024. [Google Scholar]
- Dilinuer, T.; Yao, J.-Q.; Chen, J.; Mao, W.-Y.; Yang, L.-M.; Yeernaer, H.; Chen, Y.-H. Regional drying and wetting trends over Central Asia based on Köppen climate classification in 1961–2015. Adv. Clim. Chang. Res. 2021, 12, 363–372. [Google Scholar] [CrossRef]
- Adeyeri, O.E.; Zhou, W.; Ndehedehe, C.E.; Wang, X.; Ishola, K.A.; Laux, P. Minimizing uncertainties in climate projections and water budget reveals the vulnerability of freshwater to climate change. One Earth 2024, 7, 72–87. [Google Scholar] [CrossRef]
- Di Bernardino, A.; Falasca, S.; Iannarelli, A.M.; Casadio, S.; Siani, A.M. Effect of heatwaves on urban sea breeze, heat island intensity, and outdoor thermo-hygrometric comfort in Rome (Italy). Urban Clim. 2023, 52, 101735. [Google Scholar] [CrossRef]
- Mentaschi, L.; Duveiller, G.; Zulian, G.; Corbane, C.; Pesaresi, M.; Maes, J.; Stocchino, A.; Feyen, L. Global long-term mapping of surface temperature shows intensified intra-city urban heat island extremes. Glob. Environ. Chang. 2021, 72, 102441. [Google Scholar] [CrossRef]
- Bolan, S.; Padhye, L.P.; Jasemizad, T.; Govarthanan, M.; Karmegam, N.; Wijesekara, H.; Amarasiri, D.; Hou, D.; Zhou, P.; Biswal, B.K.; et al. Impacts of climate change on the fate of contaminants through extreme weather events. Sci. Total Environ. 2024, 909, 168388. [Google Scholar] [CrossRef] [PubMed]
- Sebestyén, V.; Dörgȍ, G.; Ipkovich, Á.; Abonyi, J. Identifying the links among urban climate hazards, mitigation and adaptation actions and sustainability for future resilient cities. Urban Clim. 2023, 49, 101557. [Google Scholar] [CrossRef]
- Du, H.; Wang, M.; Liu, Y.; Guo, M.; Peng, C.; Li, P. Responses of autumn vegetation phenology to climate change and urbanization at northern middle and high latitudes. Int. J. Appl. Earth Obs. Geoinf. 2022, 115, 103086. [Google Scholar] [CrossRef]
- Técher, M.; Haddou, H.A.; Aguejdad, R. Urban Heat Island’s Vulnerability Assessment by Integrating Urban Planning Policies: A Case Study of Montpellier Méditerranée Metropolitan Area, France. Sustainability 2023, 15, 1820. [Google Scholar] [CrossRef]
- Mediterranean Climate—Wikipedia. Available online: https://en.wikipedia.org/wiki/Mediterranean_climate (accessed on 14 March 2024).
- Goudeau, M.-L.S.; Reichart, G.-J.; Wit, J.; de Nooijer, L.; Grauel, A.-L.; Bernasconi, S.; de Lange, G. Seasonality variations in the Central Mediterranean during climate change events in the Late Holocene. Palaeogeogr. Palaeoclim. Palaeoecol. 2015, 418, 304–318. [Google Scholar] [CrossRef]
- Kotsias, G.; Lolis, C.J.; Hatzianastassiou, N.; Lionello, P.; Bartzokas, A. An objective definition of seasons for the Mediterranean region. Int. J. Clim. 2021, 41, E1889–E1905. [Google Scholar] [CrossRef]
- Mediterranean Climate—An Overview|ScienceDirect Topics. Available online: https://www.sciencedirect.com/topics/agricultural-and-biological-sciences/mediterranean-climate (accessed on 14 March 2024).
- Colangelo, M.; Camarero, J.J.; Gazol, A.; Piovesan, G.; Borghetti, M.; Baliva, M.; Gentilesca, T.; Rita, A.; Schettino, A.; Ripullone, F. Mediterranean old-growth forests exhibit resistance to climate warming. Sci. Total Environ. 2021, 801, 149684. [Google Scholar] [CrossRef]
- Founda, D.; Katavoutas, G.; Pierros, F.; Mihalopoulos, N. The Extreme Heat Wave of Summer 2021 in Athens (Greece): Cumulative Heat and Exposure to Heat Stress. Sustainability 2022, 14, 7766. [Google Scholar] [CrossRef]
- Jumari, N.A.S.K.; Ahmed, A.N.; Huang, Y.F.; Ng, J.L.; Koo, C.H.; Chong, K.L.; Sherif, M.; Elshafie, A. Analysis of urban heat islands with landsat satellite images and GIS in Kuala Lumpur Metropolitan City. Heliyon 2023, 9, e18424. [Google Scholar] [CrossRef] [PubMed]
- Tseliou, A.; Melas, E.; Mela, A.; Tsiros, I. Environmental Impact of Urban Design Elements in a Mediterranean City. Environ. Sci. Proc. 2023, 26, 76. [Google Scholar] [CrossRef]
- TUDE DE TYPOLOGIE ET D’EVALUATION DES PERFORMANCES DES VILLES EN MATIERE DE DEVELOPPEMENT DURABLE. Annaba.
- Sayad, B.; Helmi, M.R.; Osra, O.A.; Abed, A.M.; Alhubashi, H.H. Microscale Investigation of Urban Heat Island (UHI) in Annaba City: Unveiling Factors and Mitigation Strategies. Sustainability 2024, 16, 747. [Google Scholar] [CrossRef]
- Boussaidi, K.; Djaghrouri, D.; Benabbas, M.; Altan, H. Assessment of Outdoor Thermal Comfort in Urban Public Space, during the Hottest Period in Annaba City, Algeria. Sustainability 2023, 15, 11763. [Google Scholar] [CrossRef]
- Standards and Requirements for Climate Observations|World Meteorological Organization. Available online: https://community.wmo.int/en/standards-and-requirements-climate-observations (accessed on 14 March 2024).
- Checa, M.F.; Rodriguez, J.; Willmott, K.R.; Liger, B. Microclimate variability significantly affects the composition, abundance and phenology of butterfly communities in a highly threatened neotropical dry forest. Fla. Èntomol. 2014, 97, 1–13. [Google Scholar] [CrossRef]
- Papadopoulos, G.; Keppas, S.C.; Parliari, D.; Kontos, S.; Papadogiannaki, S.; Melas, D. Future Projections of Heat Waves and Associated Mortality Risk in a Coastal Mediterranean City. Sustainability 2024, 16, 1072. [Google Scholar] [CrossRef]
- Yang, X.; Zhao, L.; Bruse, M.; Meng, Q. Evaluation of a microclimate model for predicting the thermal behavior of different ground surfaces. J. Affect. Disord. 2013, 60, 93–104. [Google Scholar] [CrossRef]
- Pellicone, G.; Caloiero, T.; Guagliardi, I. The De Martonne aridity index in Calabria (Southern Italy). J. Maps 2019, 15, 788–796. [Google Scholar] [CrossRef]
- Olgyay, V. Design with Climate: Bioclimatic Approach to Architectural Regionalism: New and Expanded Edition; Princeton University Press: Princeton, NJ, USA, 1963. [Google Scholar]
- Givoni, B. Man, Climate and Architecture, 2nd ed.; Elsevier: Amsterdam, The Netherlands, 1982. [Google Scholar]
- Wang, M.; Chen, Z.; Zhang, D.; Liu, M.; Yuan, H.; Chen, B.; Rao, Q.; Zhou, S.; Wang, Y.; Li, J.; et al. Changes in Concurrent Meteorological Extremes of Rainfall and Heat under Divergent Climatic Trajectories in the Guangdong–Hong Kong–Macao Greater Bay Area. Sustainability 2024, 16, 2153. [Google Scholar] [CrossRef]
- Moreno, M.; Bertolín, C.; Arlanzón, D.; Ortiz, P.; Ortiz, R. Climate change, large fires, and cultural landscapes in the mediterranean basin: An analysis in southern Spain. Heliyon 2023, 9, e16941. [Google Scholar] [CrossRef] [PubMed]
- Yao, R.; Wang, L.; Huang, X.; Zhang, W.; Li, J.; Niu, Z. Interannual variations in surface urban heat island intensity and associated drivers in China. J. Environ. Manag. 2018, 222, 86–94. [Google Scholar] [CrossRef]
- Zagaria, C.; Schulp, C.J.; Malek, Ž.; Verburg, P.H. Potential for land and water management adaptations in Mediterranean croplands under climate change. Agric. Syst. 2023, 205, 103586. [Google Scholar] [CrossRef]
- Filipe, A.F.; Lawrence, J.E.; Bonada, N. Vulnerability of stream biota to climate change in mediterranean climate regions: A synthesis of ecological responses and conservation challenges. Hydrobiologia 2013, 719, 331–351. [Google Scholar] [CrossRef]
- Khanh, D.N.; Varquez, A.C.; Kanda, M. Impact of urbanization on exposure to extreme warming in megacities. Heliyon 2023, 9, e15511. [Google Scholar] [CrossRef]
- Kang, S.-W.; Lee, M.-S.; Jung, J.-C. Analysis of sustainable urban forms for climate change adaptation and mitigation. Environ. Sustain. Indic. 2024, 22, 100337. [Google Scholar] [CrossRef]
- Pumo, D.; Alongi, F.; Cannarozzo, M.; Noto, L.V. Climate adaptive urban measures in Mediterranean areas: Thermal effectiveness of an advanced multilayer green roof installed in Palermo (Italy). J. Affect. Disord. 2023, 243, 110731. [Google Scholar] [CrossRef]
- Pietrapertosa, F.; Olazabal, M.; Simoes, S.G.; Salvia, M.; Fokaides, P.A.; Ioannou, B.I.; Viguié, V.; Spyridaki, N.-A.; Hurtado, S.D.G.; Geneletti, D.; et al. Adaptation to climate change in cities of Mediterranean Europe. Cities 2023, 140, 104452. [Google Scholar] [CrossRef]
- Chen, W.; Yi, L.; Wang, J.; Zhang, J.; Jiang, Y. Evaluation of the livability of arid urban environments under global warming: A multi-parameter approach. Sustain. Cities Soc. 2023, 99, 104931. [Google Scholar] [CrossRef]
- Najah, F.T.; Abdullah, S.F.K.; Abdulkareem, T.A. Urban Land Use Changes: Effect of Green Urban Spaces Transformation on Urban Heat Islands in Baghdad. Alex. Eng. J. 2023, 66, 555–571. [Google Scholar] [CrossRef]
- Malikah, S.; Avila, S.; Garcia, G.; Lakhankar, T. Historical Climate Trends and Extreme Weather Events in the Tri-State Area: A Detailed Analysis of Urban and Suburban Differences. Climate 2024, 12, 32. [Google Scholar] [CrossRef]
- Marí-Dell’olmo, M.; Oliveras, L.; Barón-Miras, L.E.; Borrell, C.; Montalvo, T.; Ariza, C.; Ventayol, I.; Mercuriali, L.; Sheehan, M.; Gómez-Gutiérrez, A.; et al. Climate Change and Health in Urban Areas with a Mediterranean Climate: A Conceptual Framework with a Social and Climate Justice Approach. Int. J. Environ. Res. Public Health 2022, 19, 12764. [Google Scholar] [CrossRef] [PubMed]
- Aksoy, K. Predicting the Potential Distribution Area of the Platanus orientalis L. in Turkey Today and in the Future. Sustainability 2022, 14, 11706. [Google Scholar] [CrossRef]
- Talhi, A.; Barlet, A.; Bruneau, D.; Aichour, B. Towards a prediction of outdoor human thermal comfort adapted for designers of urban spaces: Examining UTCI and APCI in the context of Algiers (Algeria). Int. J. Biometeorol. 2020, 64, 651–662. [Google Scholar] [CrossRef] [PubMed]
- Wemegah, C.S.; Yamba, E.I.; Aryee, J.N.; Sam, F.; Amekudzi, L.K. Assessment of urban heat island warming in the greater accra region. Sci. Afr. 2020, 8, e00426. [Google Scholar] [CrossRef]
- Shen, P.; Zhao, S. Intensifying urban imprint on land surface warming: Insights from local to global scale. iScience 2024, 27, 109110. [Google Scholar] [CrossRef] [PubMed]
- Soltani, A.; Sharifi, E. Understanding and analysing the urban heat island (UHI) effect in micro-scale. Int. J. Soc. Ecol. Sustain. Dev. 2019, 10, 14–28. [Google Scholar] [CrossRef]
- Sayad, B.; Menni, Y.; Imam, A.A.; Fallatah, A.; Faisal, K.S.; Abed, A.M.; Alhubashi, H.H.; Hegazy, I.R. Diurnal Characterization of the Atmospheric Urban Heat Island over Urban Hot Agglomerations. Int. J. Low-Carbon Technol. 2023, 18, 449–456. [Google Scholar] [CrossRef]
- Saneinejad, S.; Moonen, P.; Carmeliet, J. Comparative assessment of various heat island mitigation measures. J. Affect. Disord. 2014, 73, 162–170. [Google Scholar] [CrossRef]
- Turhan, C.; Atalay, A.S.; Akkurt, G.G. An Integrated Decision-Making Framework for Mitigating the Impact of Urban Heat Islands on Energy Consumption and Thermal Comfort of Residential Buildings. Sustainability 2023, 15, 9674. [Google Scholar] [CrossRef]
- Taleghani, M. Outdoor thermal comfort by different heat mitigation strategies—A review. Renew. Sustain. Energy Rev. 2018, 81, 2011–2018. [Google Scholar] [CrossRef]
- Yuan, C.; Ng, E.; Norford, L.K. Improving air quality in high-density cities by understanding the relationship between air pollutant dispersion and urban morphologies. Build. Environ. 2014, 71, 245–258. [Google Scholar] [CrossRef] [PubMed]
- Sayad, B.; Alkama, D.; Rebhi, R.; Menni, Y.; Ahmad, H.; Inc, M.; Sharifpur, M.; Lorenzini, G.; Azab, E.; Elnaggar, A.Y. Outdoor thermal comfort optimization through vegetation parameterization: Species and tree layout. Sustainability 2021, 13, 11791. [Google Scholar] [CrossRef]
- Aram, F.; García, E.H.; Solgi, E.; Mansournia, S. Urban green space cooling effect in cities. Heliyon 2019, 5, e01339. [Google Scholar] [CrossRef]
- Elnabawi, M.H.; Hamza, N. Behavioural Perspectives of Outdoor Thermal Comfort in Urban Areas: A Critical Review. Atmosphere 2019, 11, 51. [Google Scholar] [CrossRef]
- Abdel-Aziz, D.M.; Al Shboul, A.; Al-Kurdi, N.Y. Effects of Tree Shading on Building’s Energy Consumption—The Case of Residential Buildings in a Mediterranean Climate. Am. J. Environ. Eng. 2015, 5, 131–140. [Google Scholar] [CrossRef]
- Al-Hafiz, B.; Musy, M.; Hasan, T. A Study on the Impact of Changes in the Materials Reflection Coefficient for Achieving Sustainable Urban Design. Procedia Environ. Sci. 2017, 38, 562–570. [Google Scholar] [CrossRef]
- Copernicus: February 2024 Was Globally the Warmest on Record—Global Sea Surface Temperatures at Record High|Co-Pernicus. Available online: https://climate.copernicus.eu/copernicus-february-2024-was-globally-warmest-record-global-sea-surface-temperatures-record-high (accessed on 14 March 2024).
Figure 1.
Location of Annaba city, Algeria.
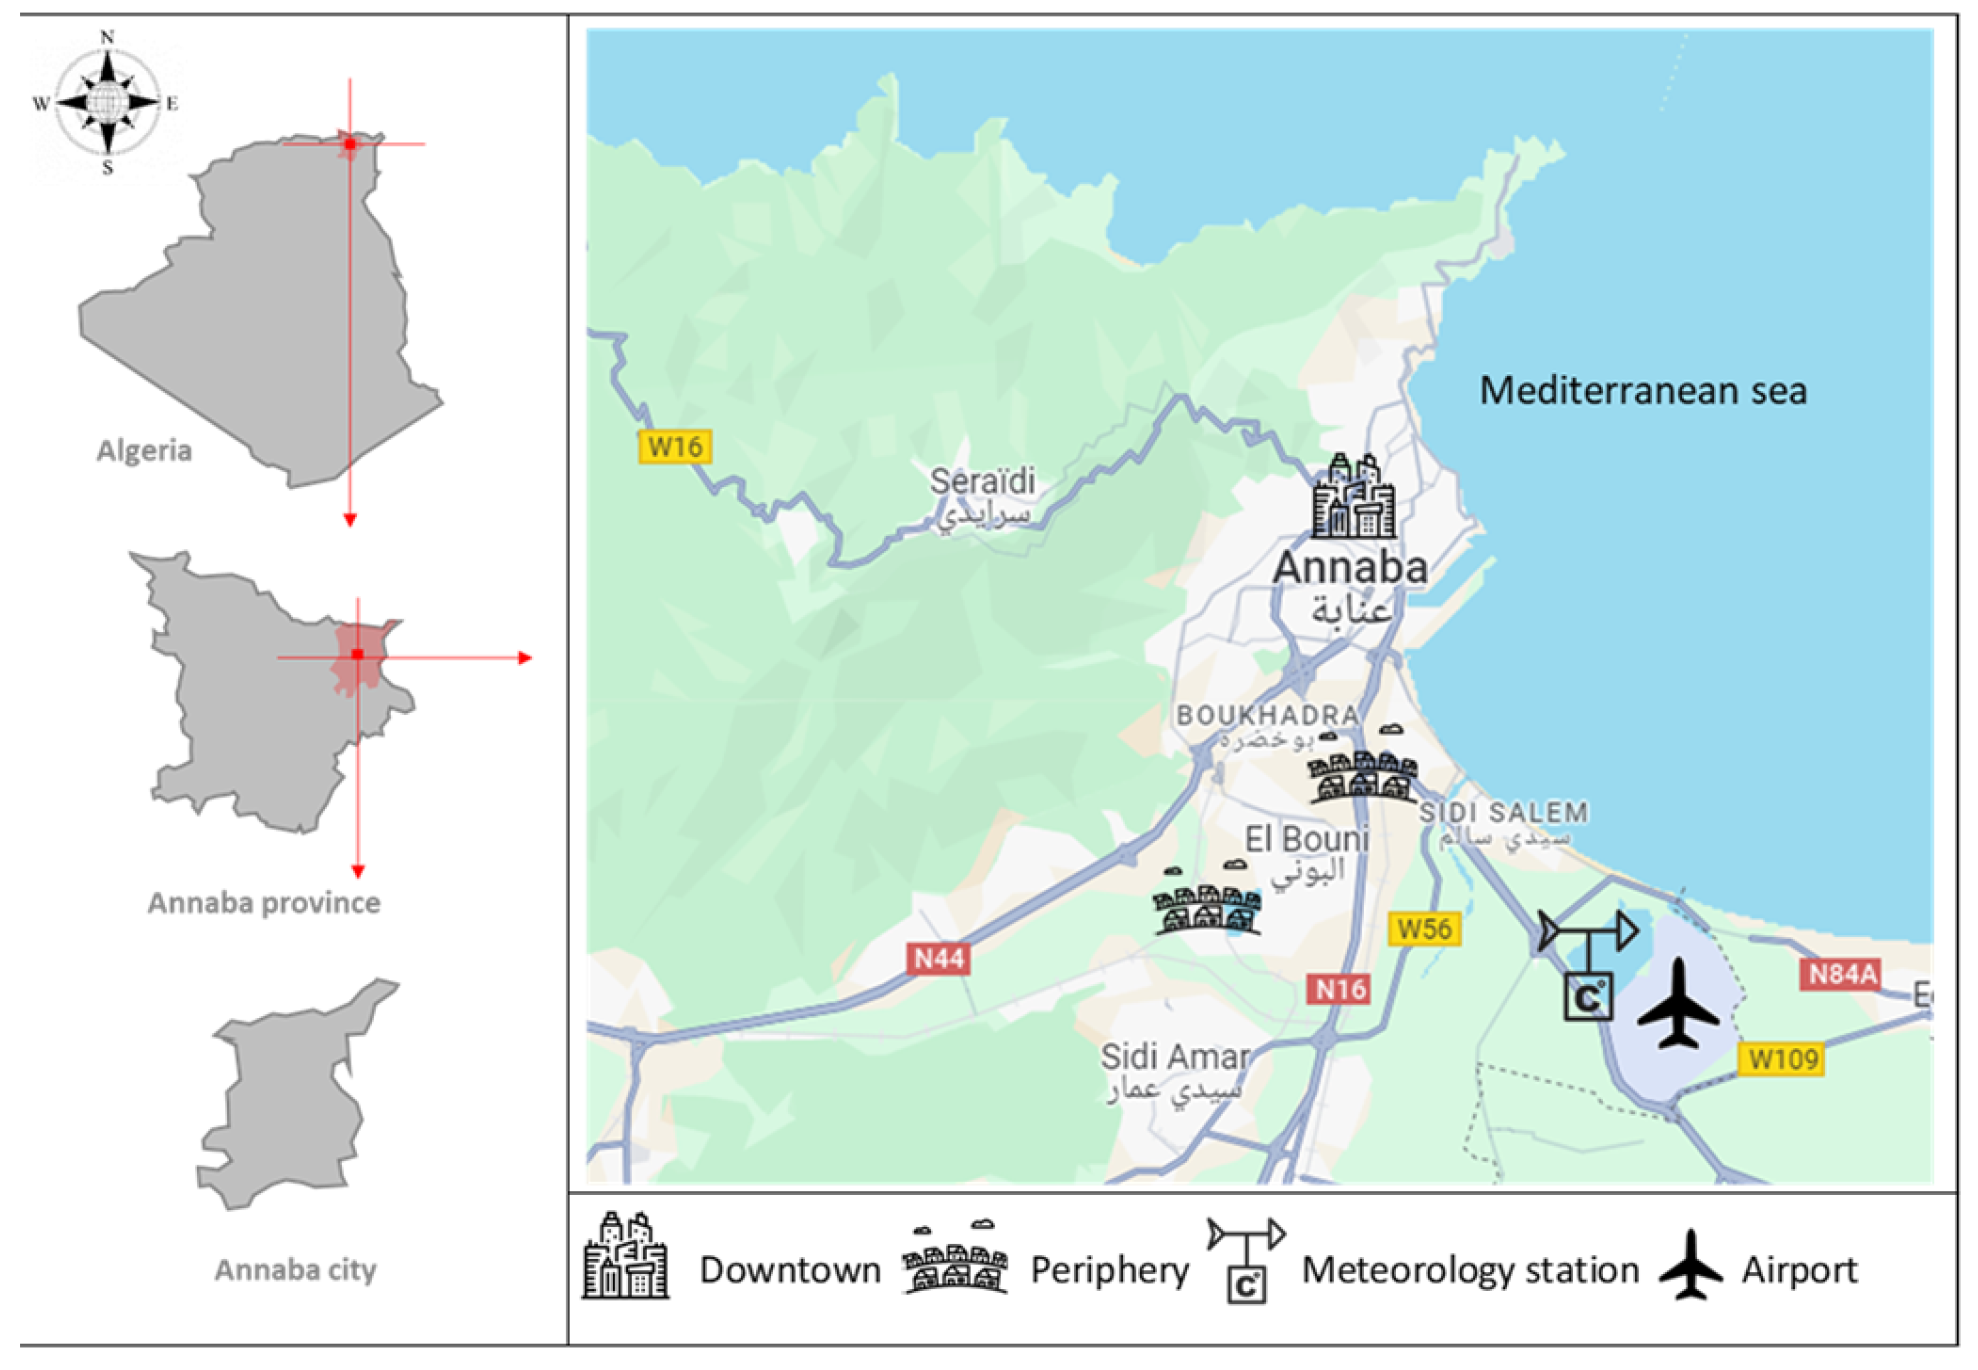
Figure 2.
Scientific methodology chart.

Figure 3.
Comparison of mean air temperature for the periods 2000–2009, 2010–2019, and 2020–2023.

Figure 4.
Comparison of mean precipitation for the periods 2000–2009, 2010–2019, and 2020–2023.
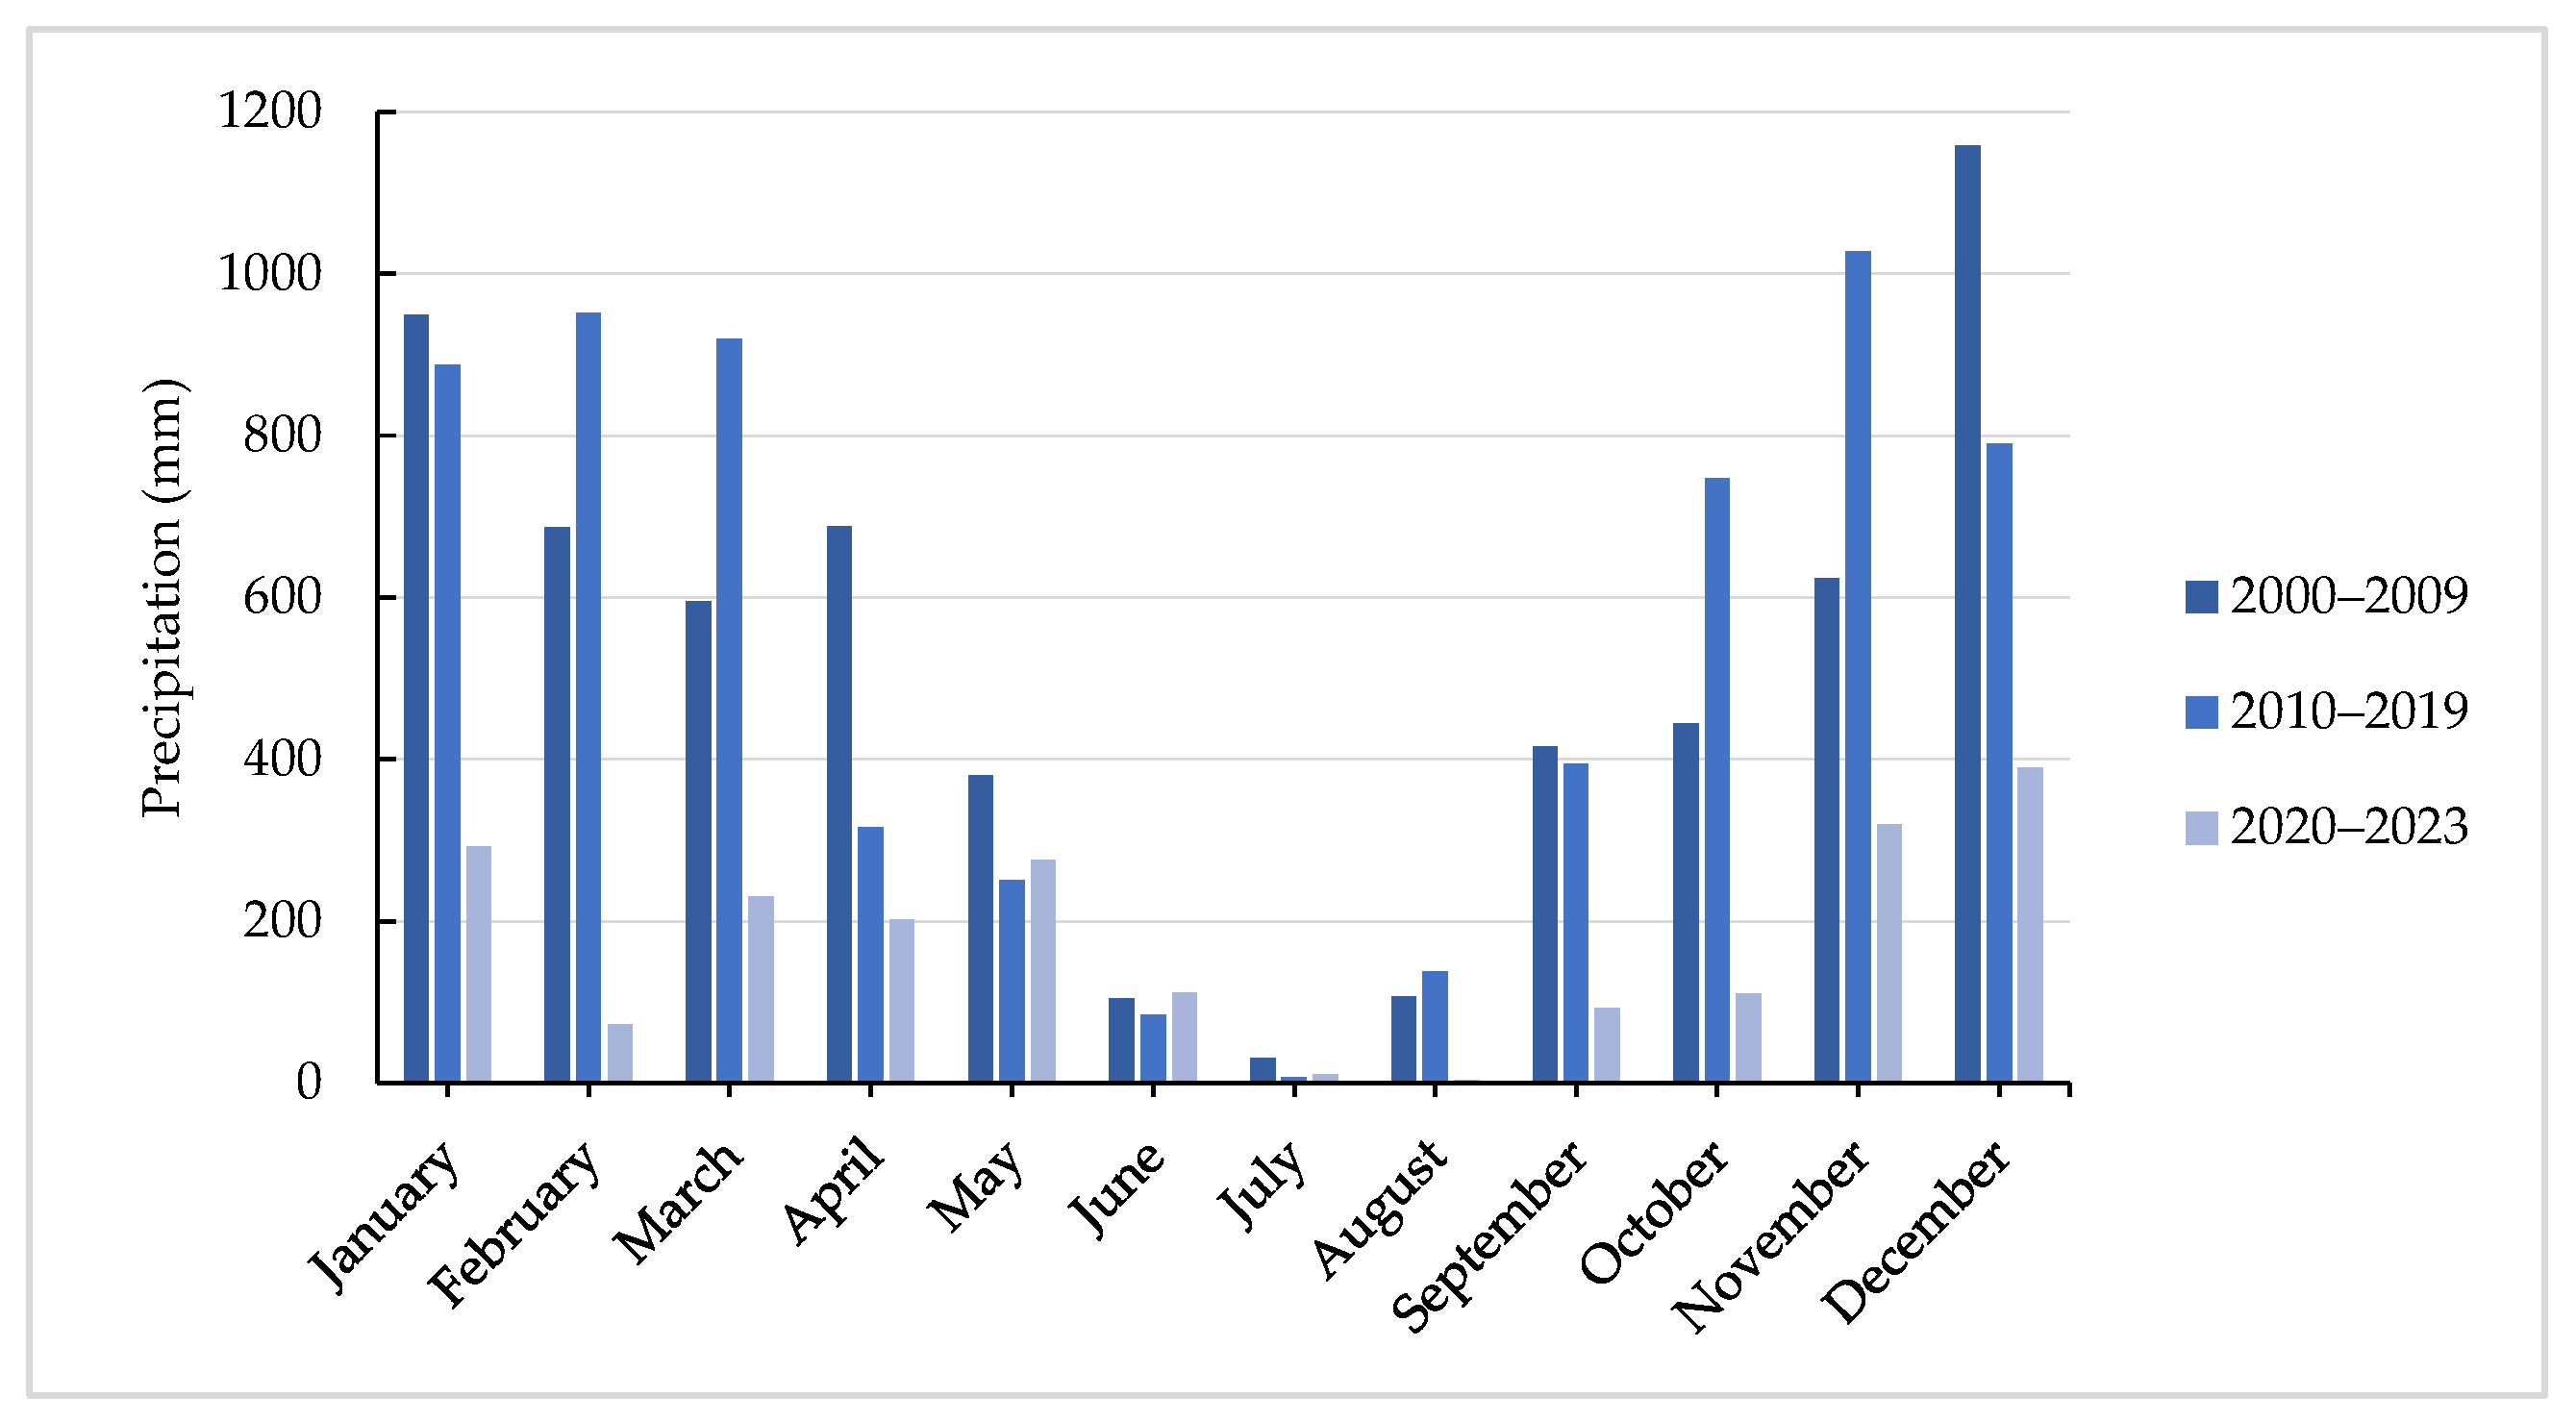
Figure 5.
Comparison of mean wind speeds for the periods 2000–2009, 2010–2019, and 2020–2023.
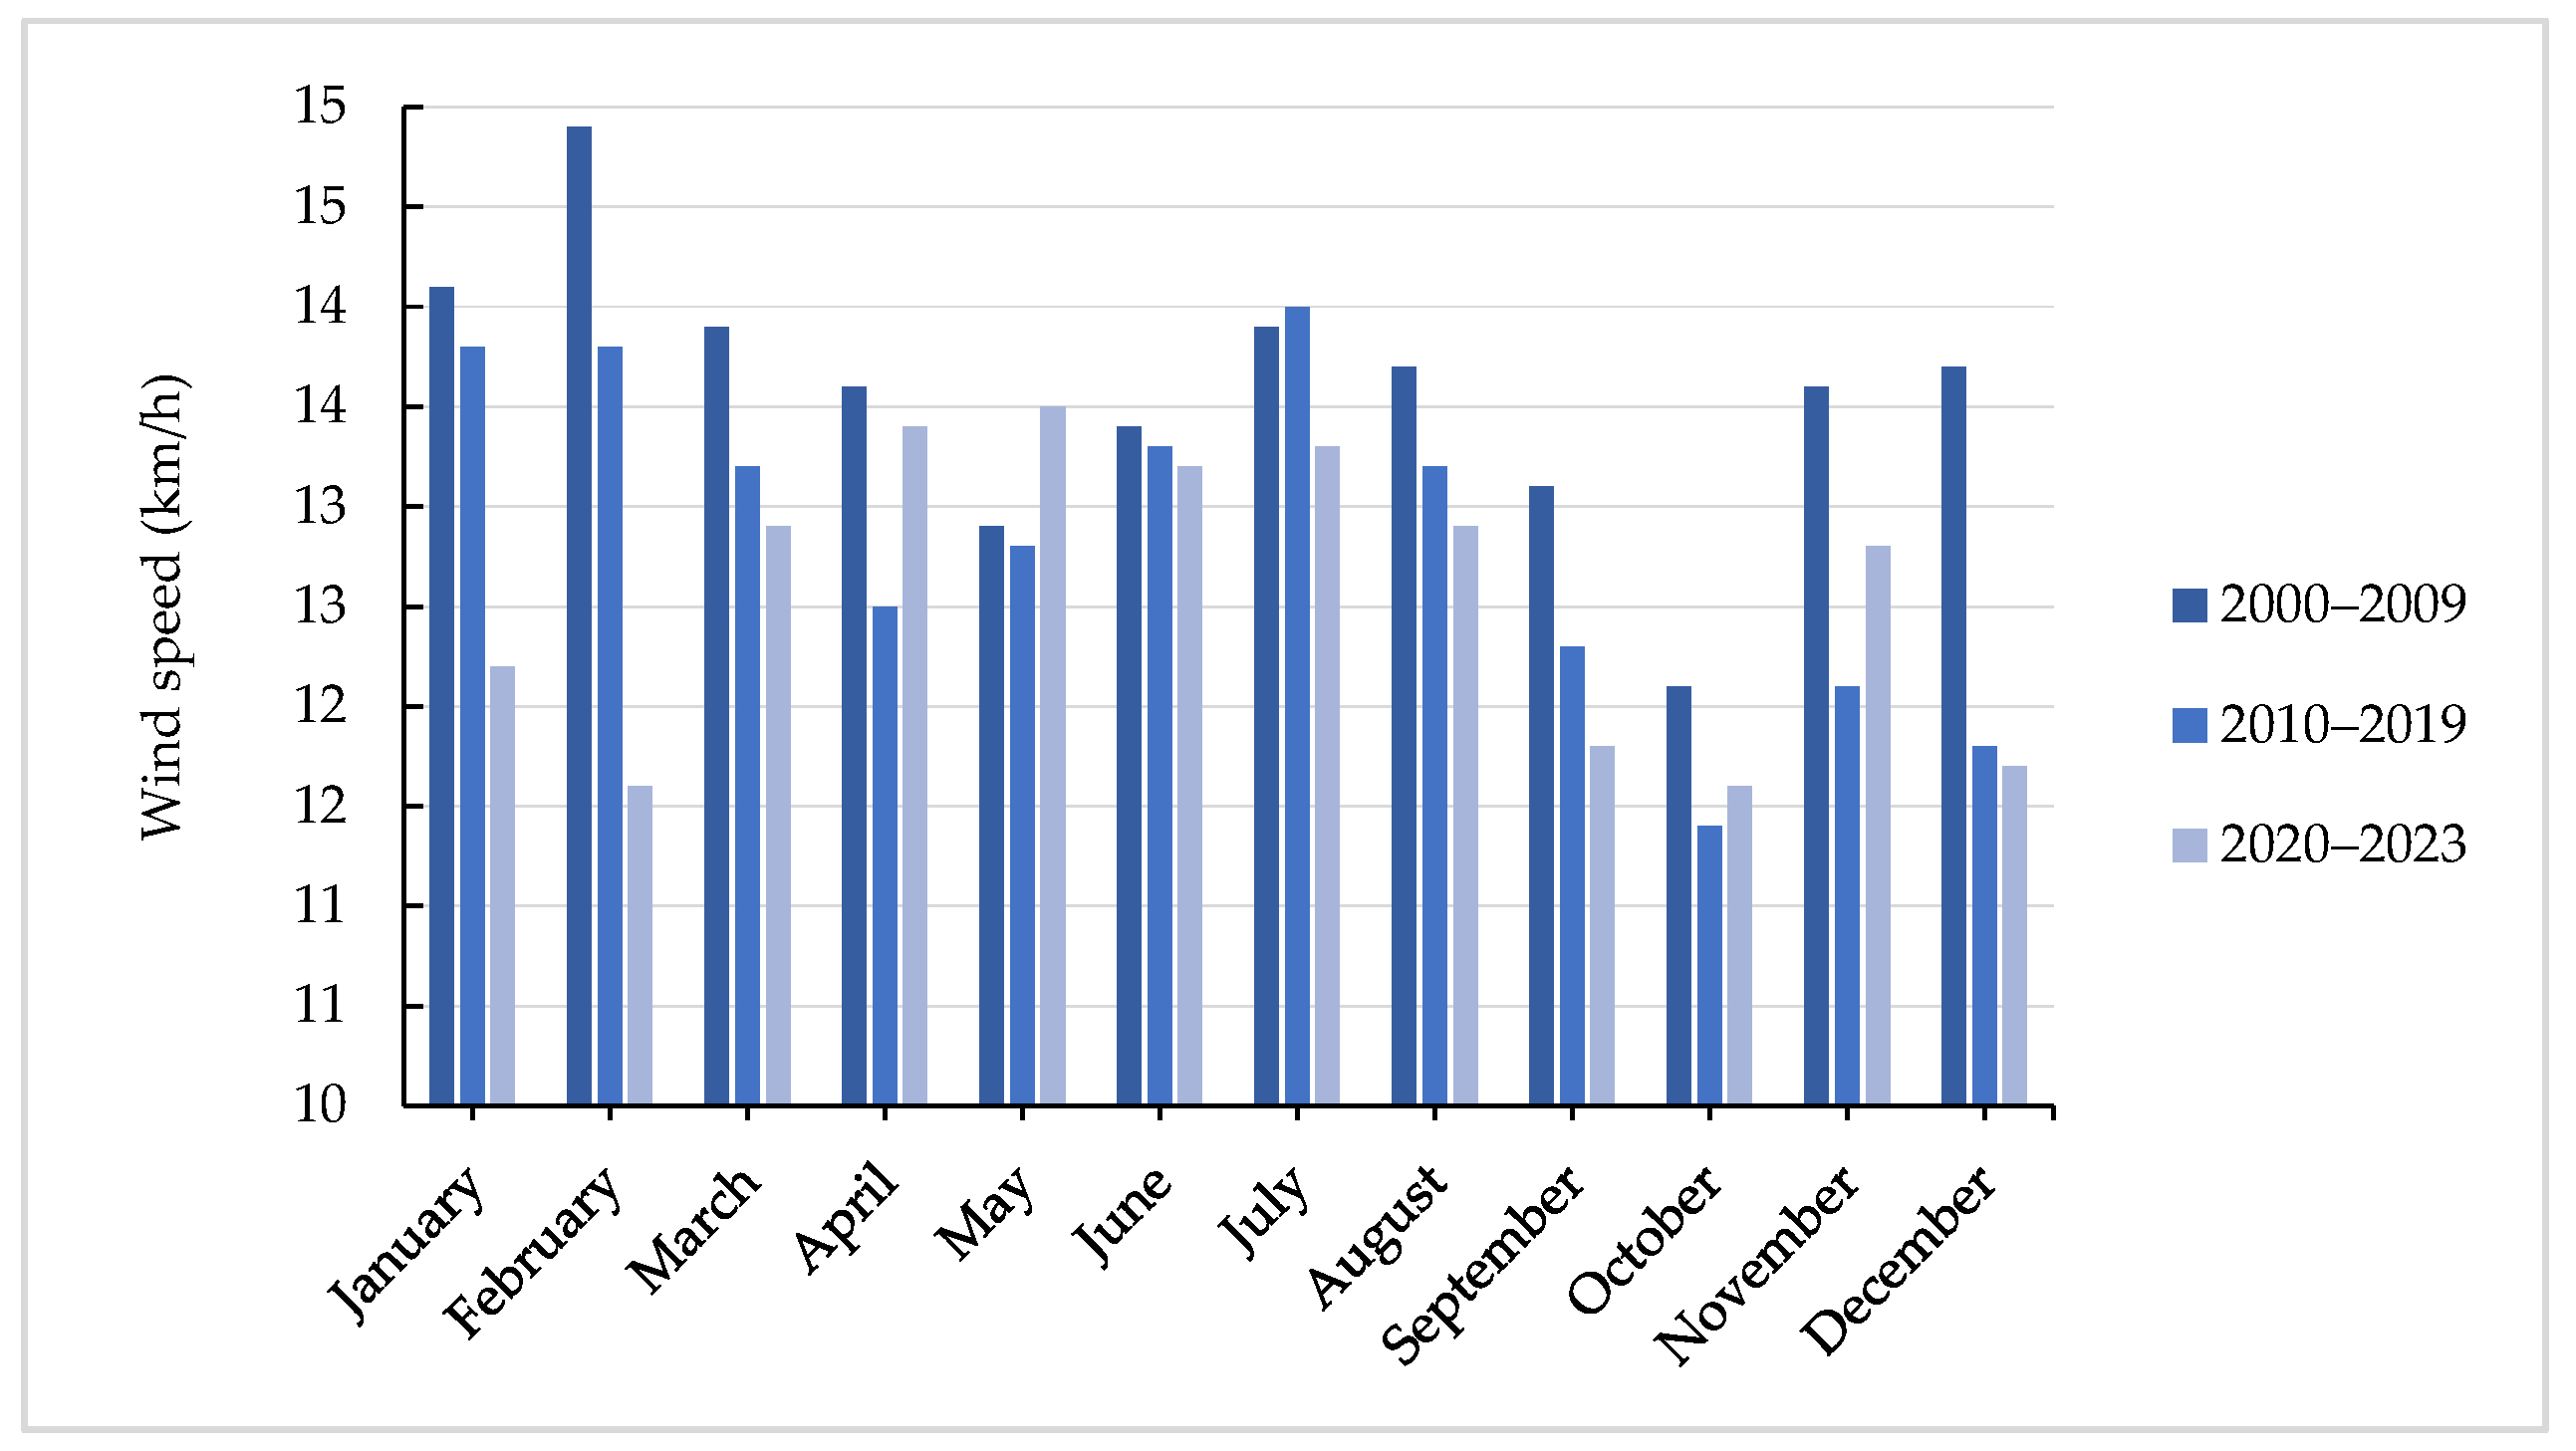
Figure 6.
Correlation between predicted and observed mean, maximum, and minimum (a) air temperature and (b) relative humidity.
Figure 6.
Correlation between predicted and observed mean, maximum, and minimum (a) air temperature and (b) relative humidity.

Figure 7.
Aridity index data for Annaba city for three decades from 2000 to 2029.
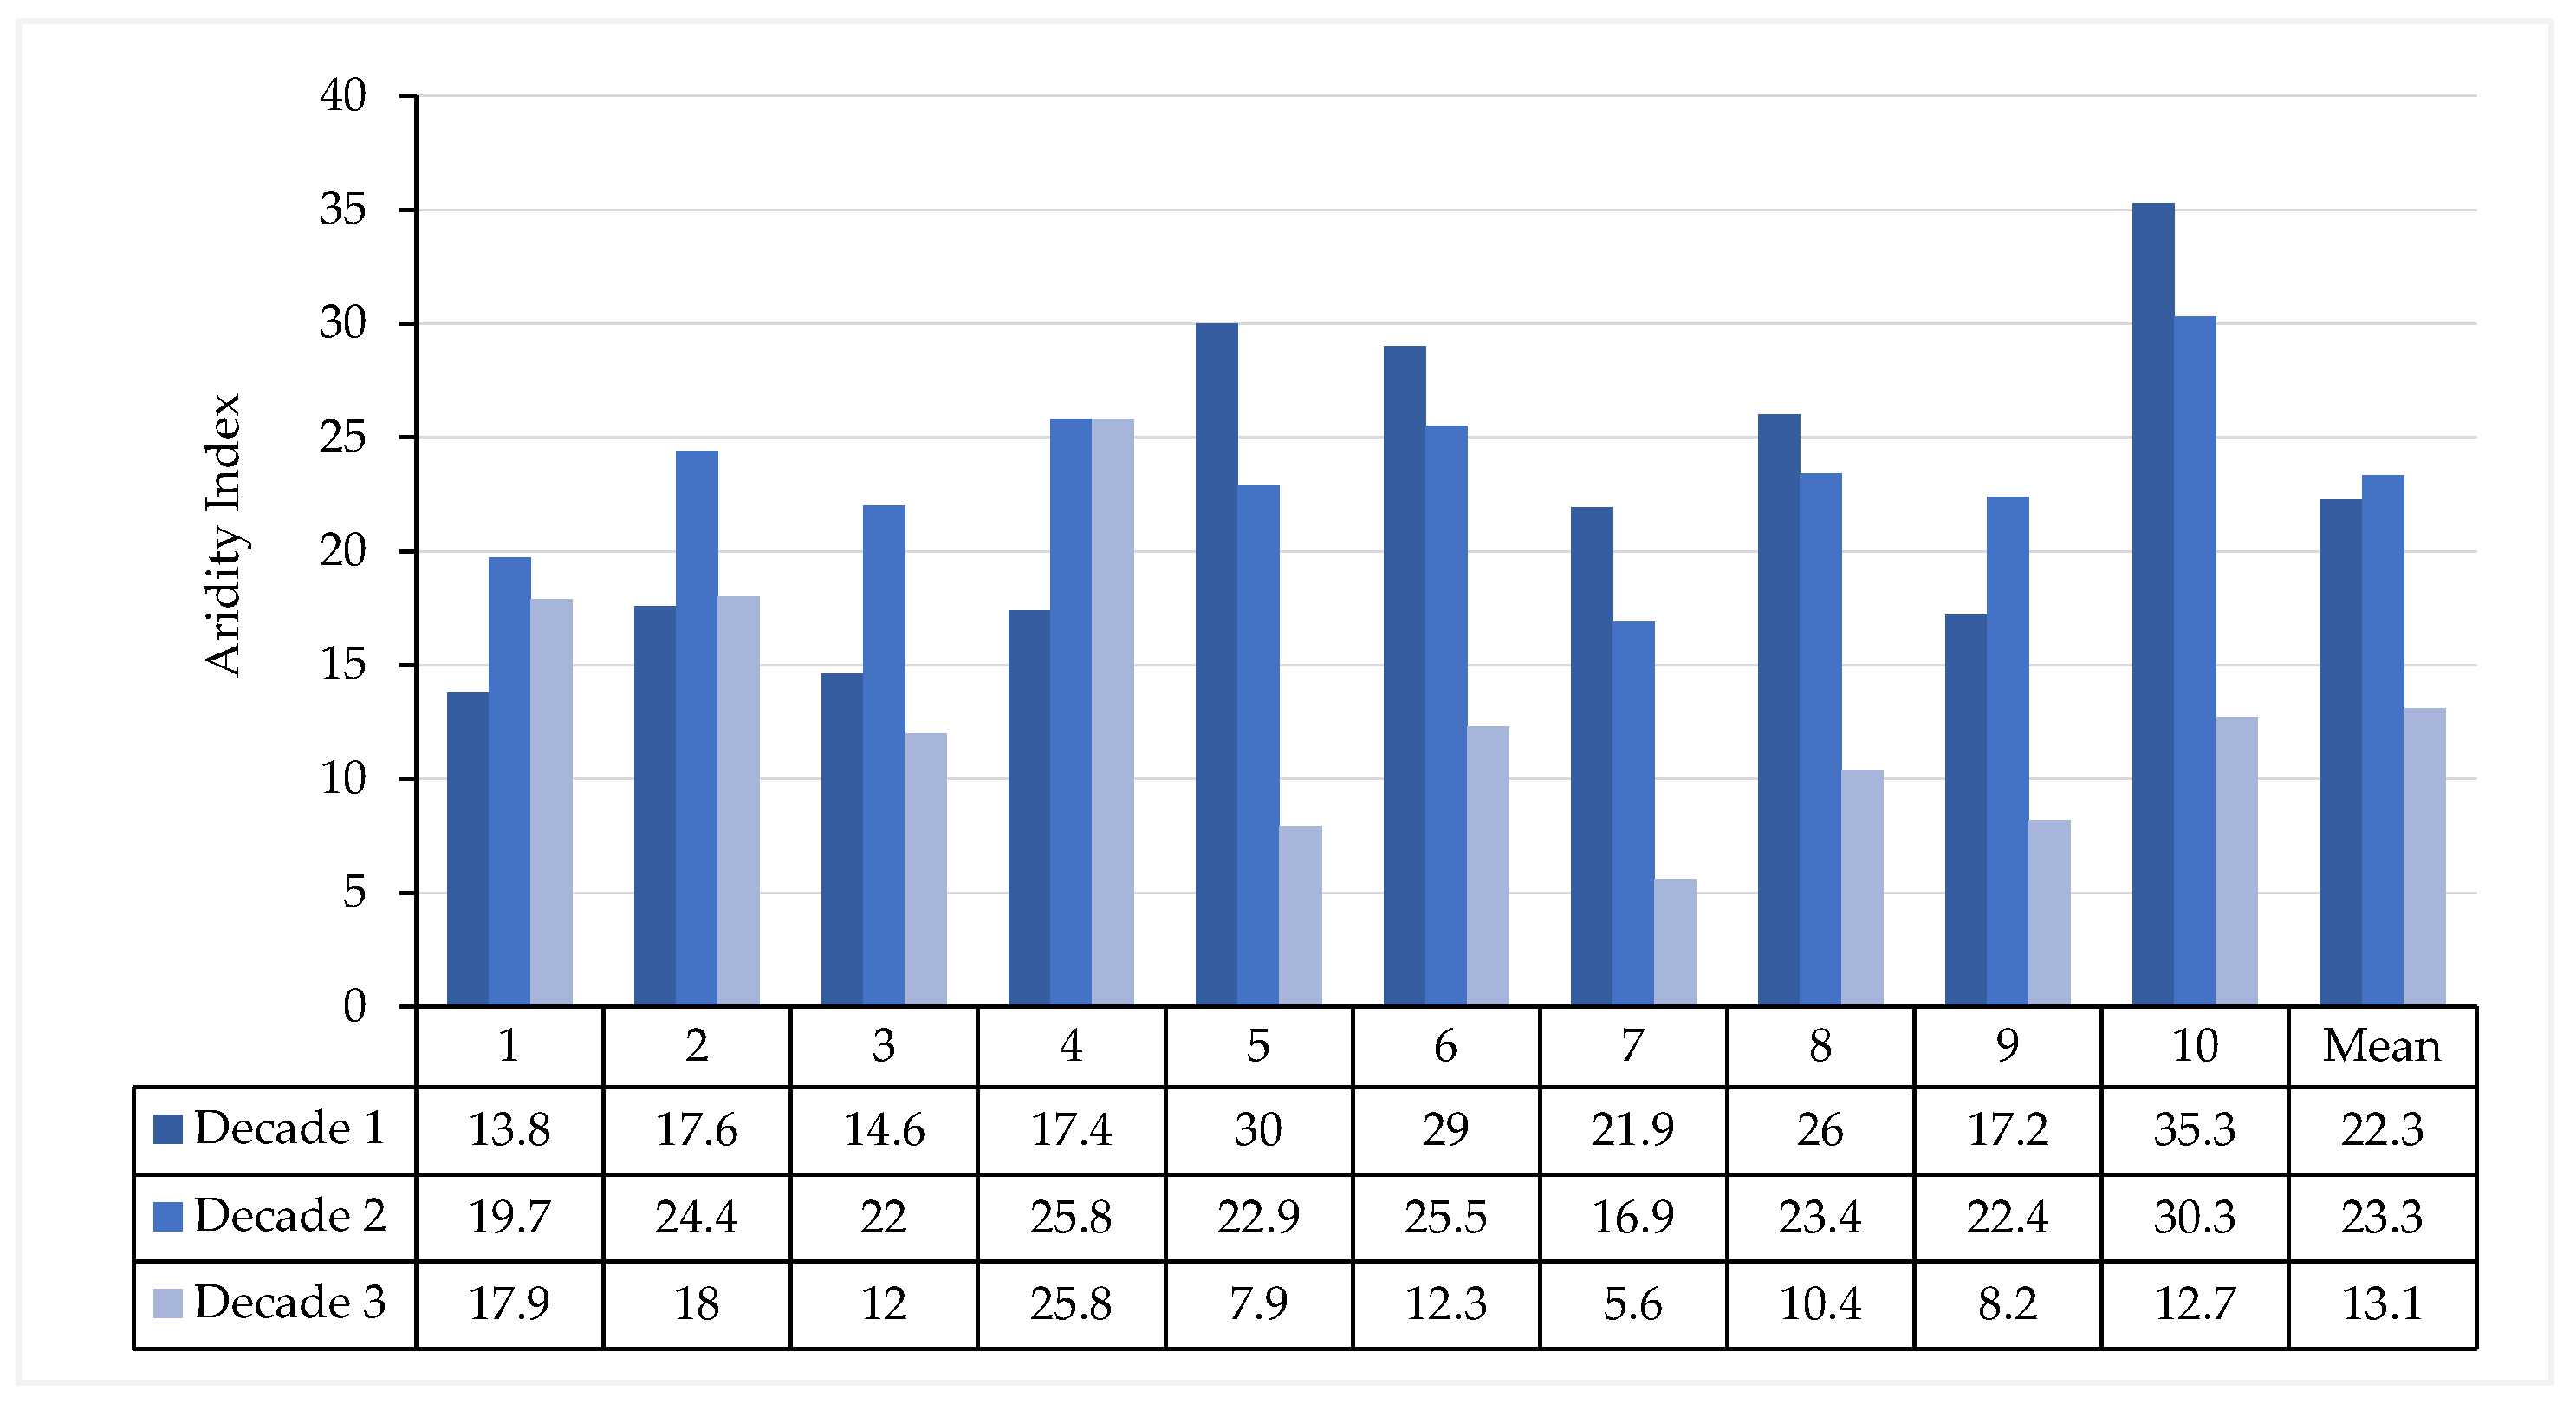
Figure 8.
The climate floor of Annaba city for the decades 2009–2010, 2010–2019, and 2020–2023.

Figure 9.
The mean dry period of Annaba city for the decades (a) 2000–2009, (b) 2010–2019, and (c) 2020–2029.
Figure 9.
The mean dry period of Annaba city for the decades (a) 2000–2009, (b) 2010–2019, and (c) 2020–2029.
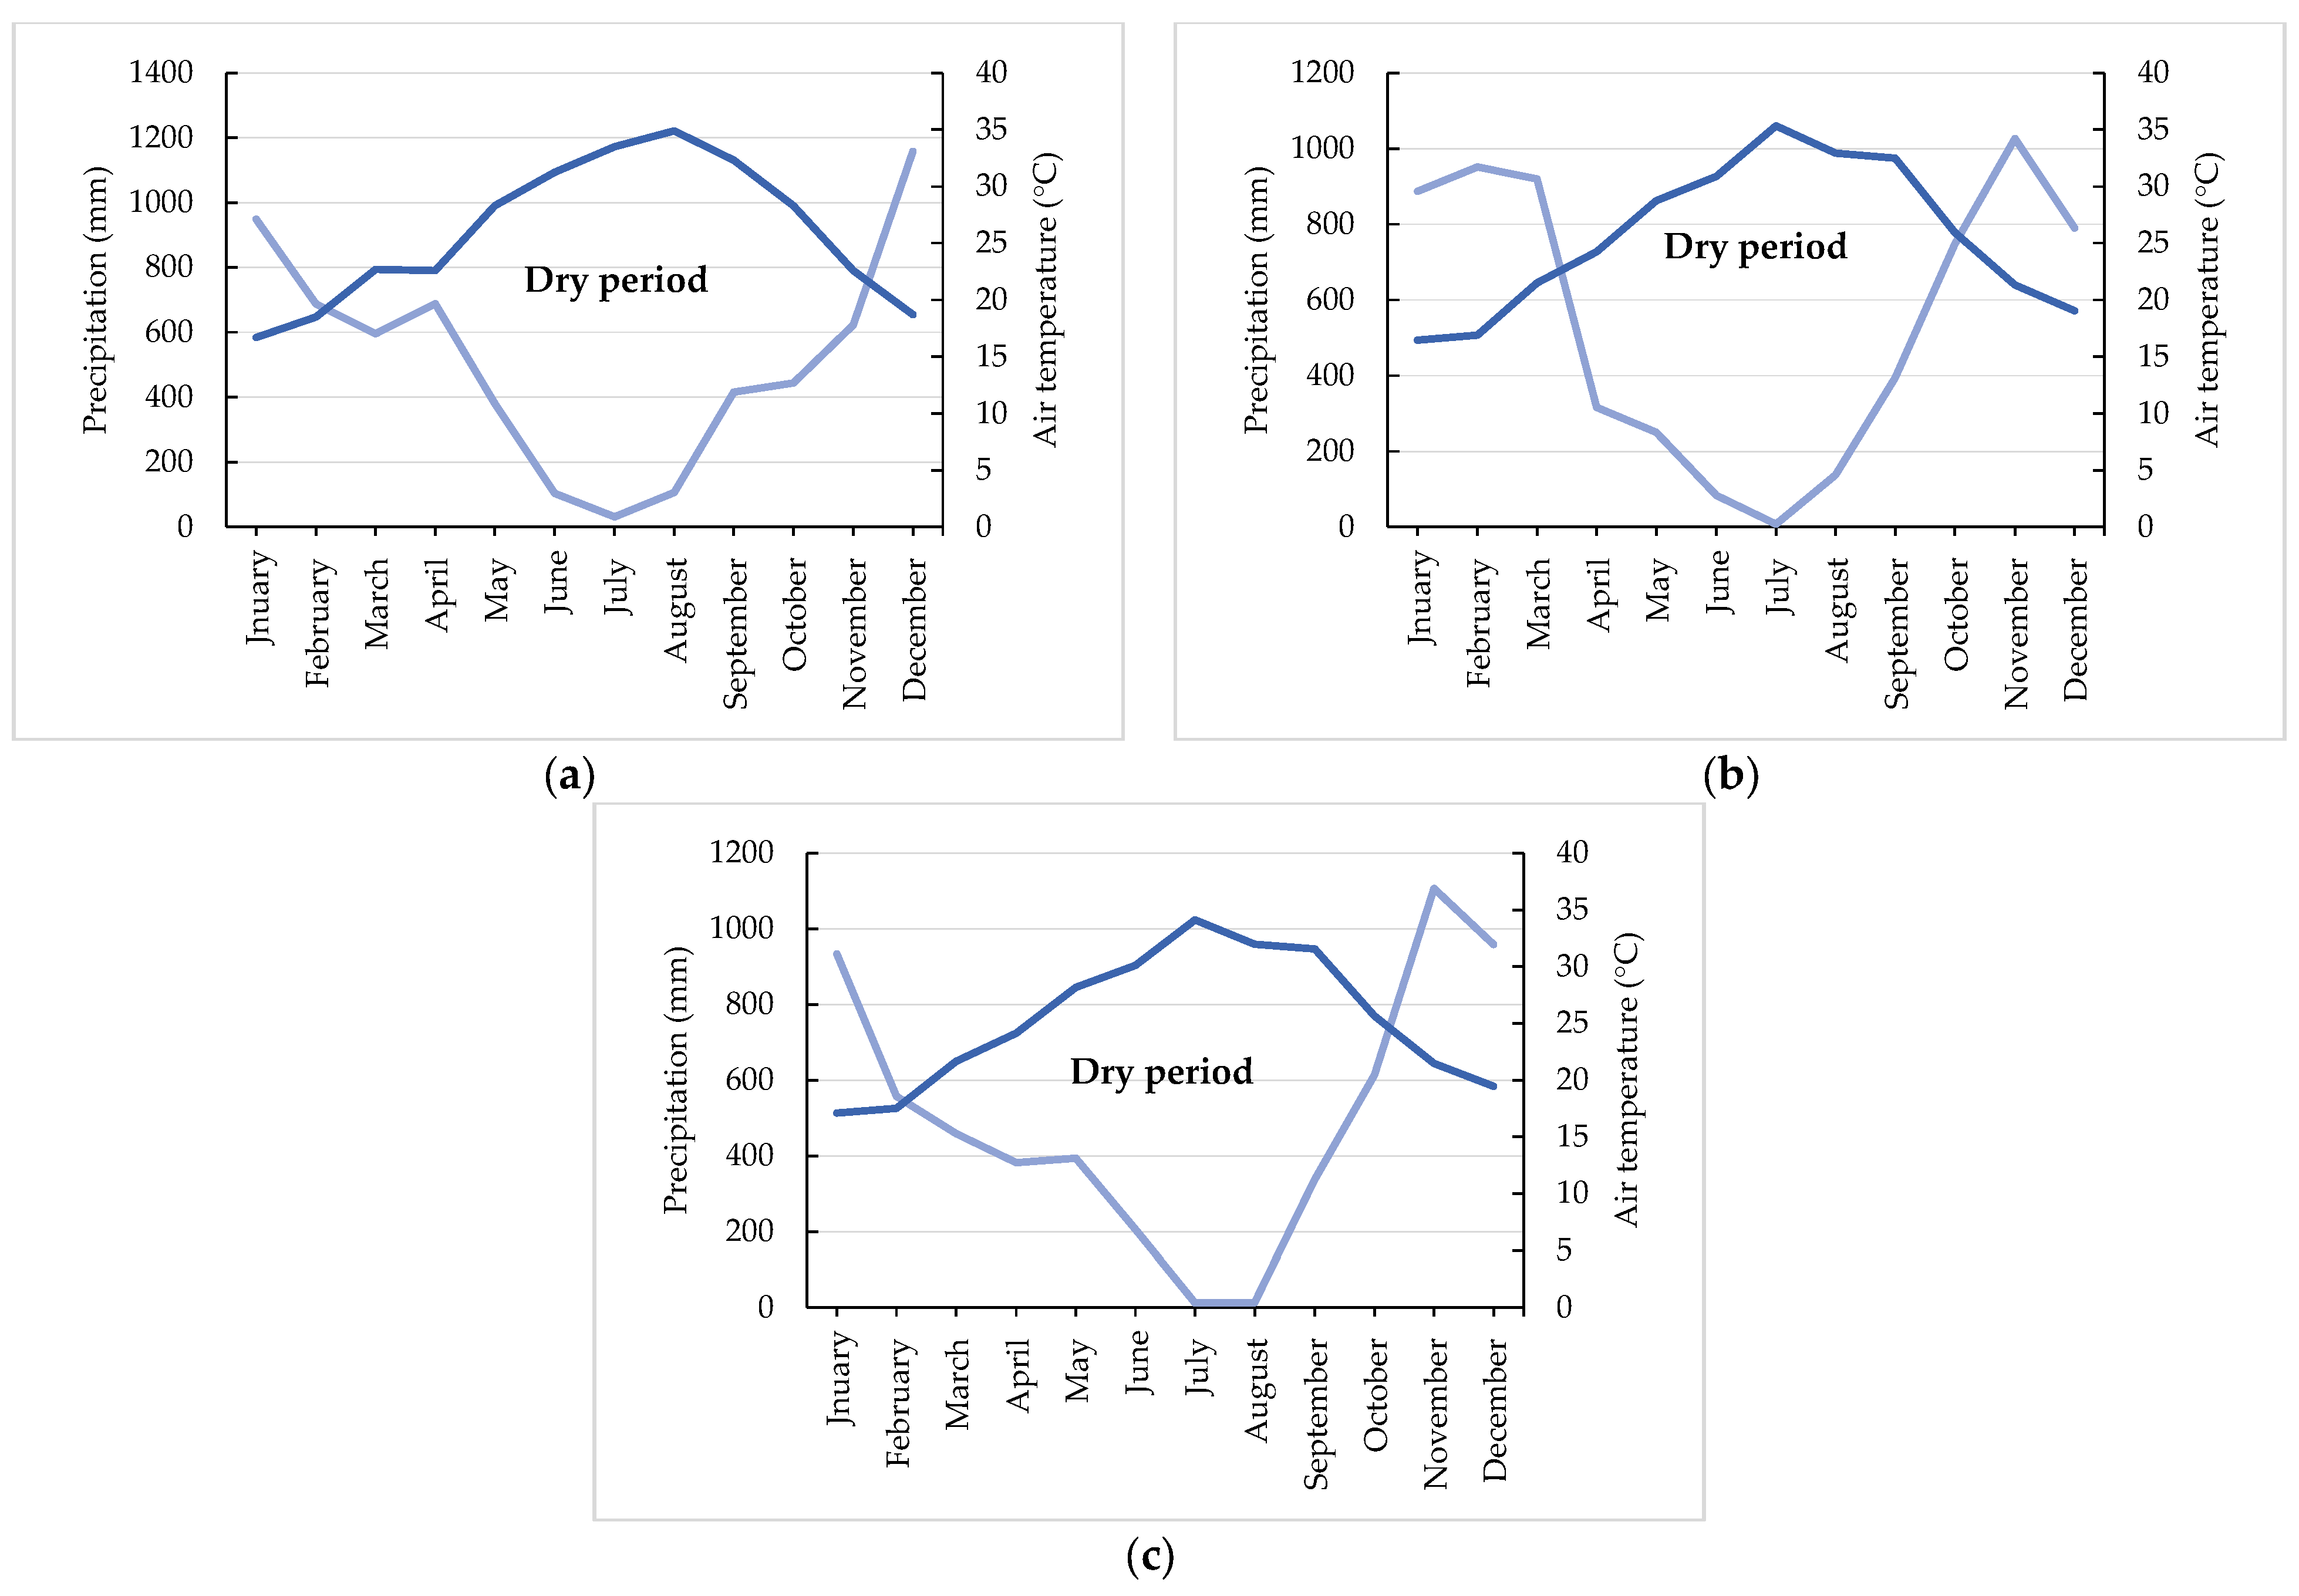
Figure 10.
Psychrometric chart of Annaba city for the decades (a) 2000–2009, (b) 2010–2019, and (c) 2020–2029.
Figure 10.
Psychrometric chart of Annaba city for the decades (a) 2000–2009, (b) 2010–2019, and (c) 2020–2029.
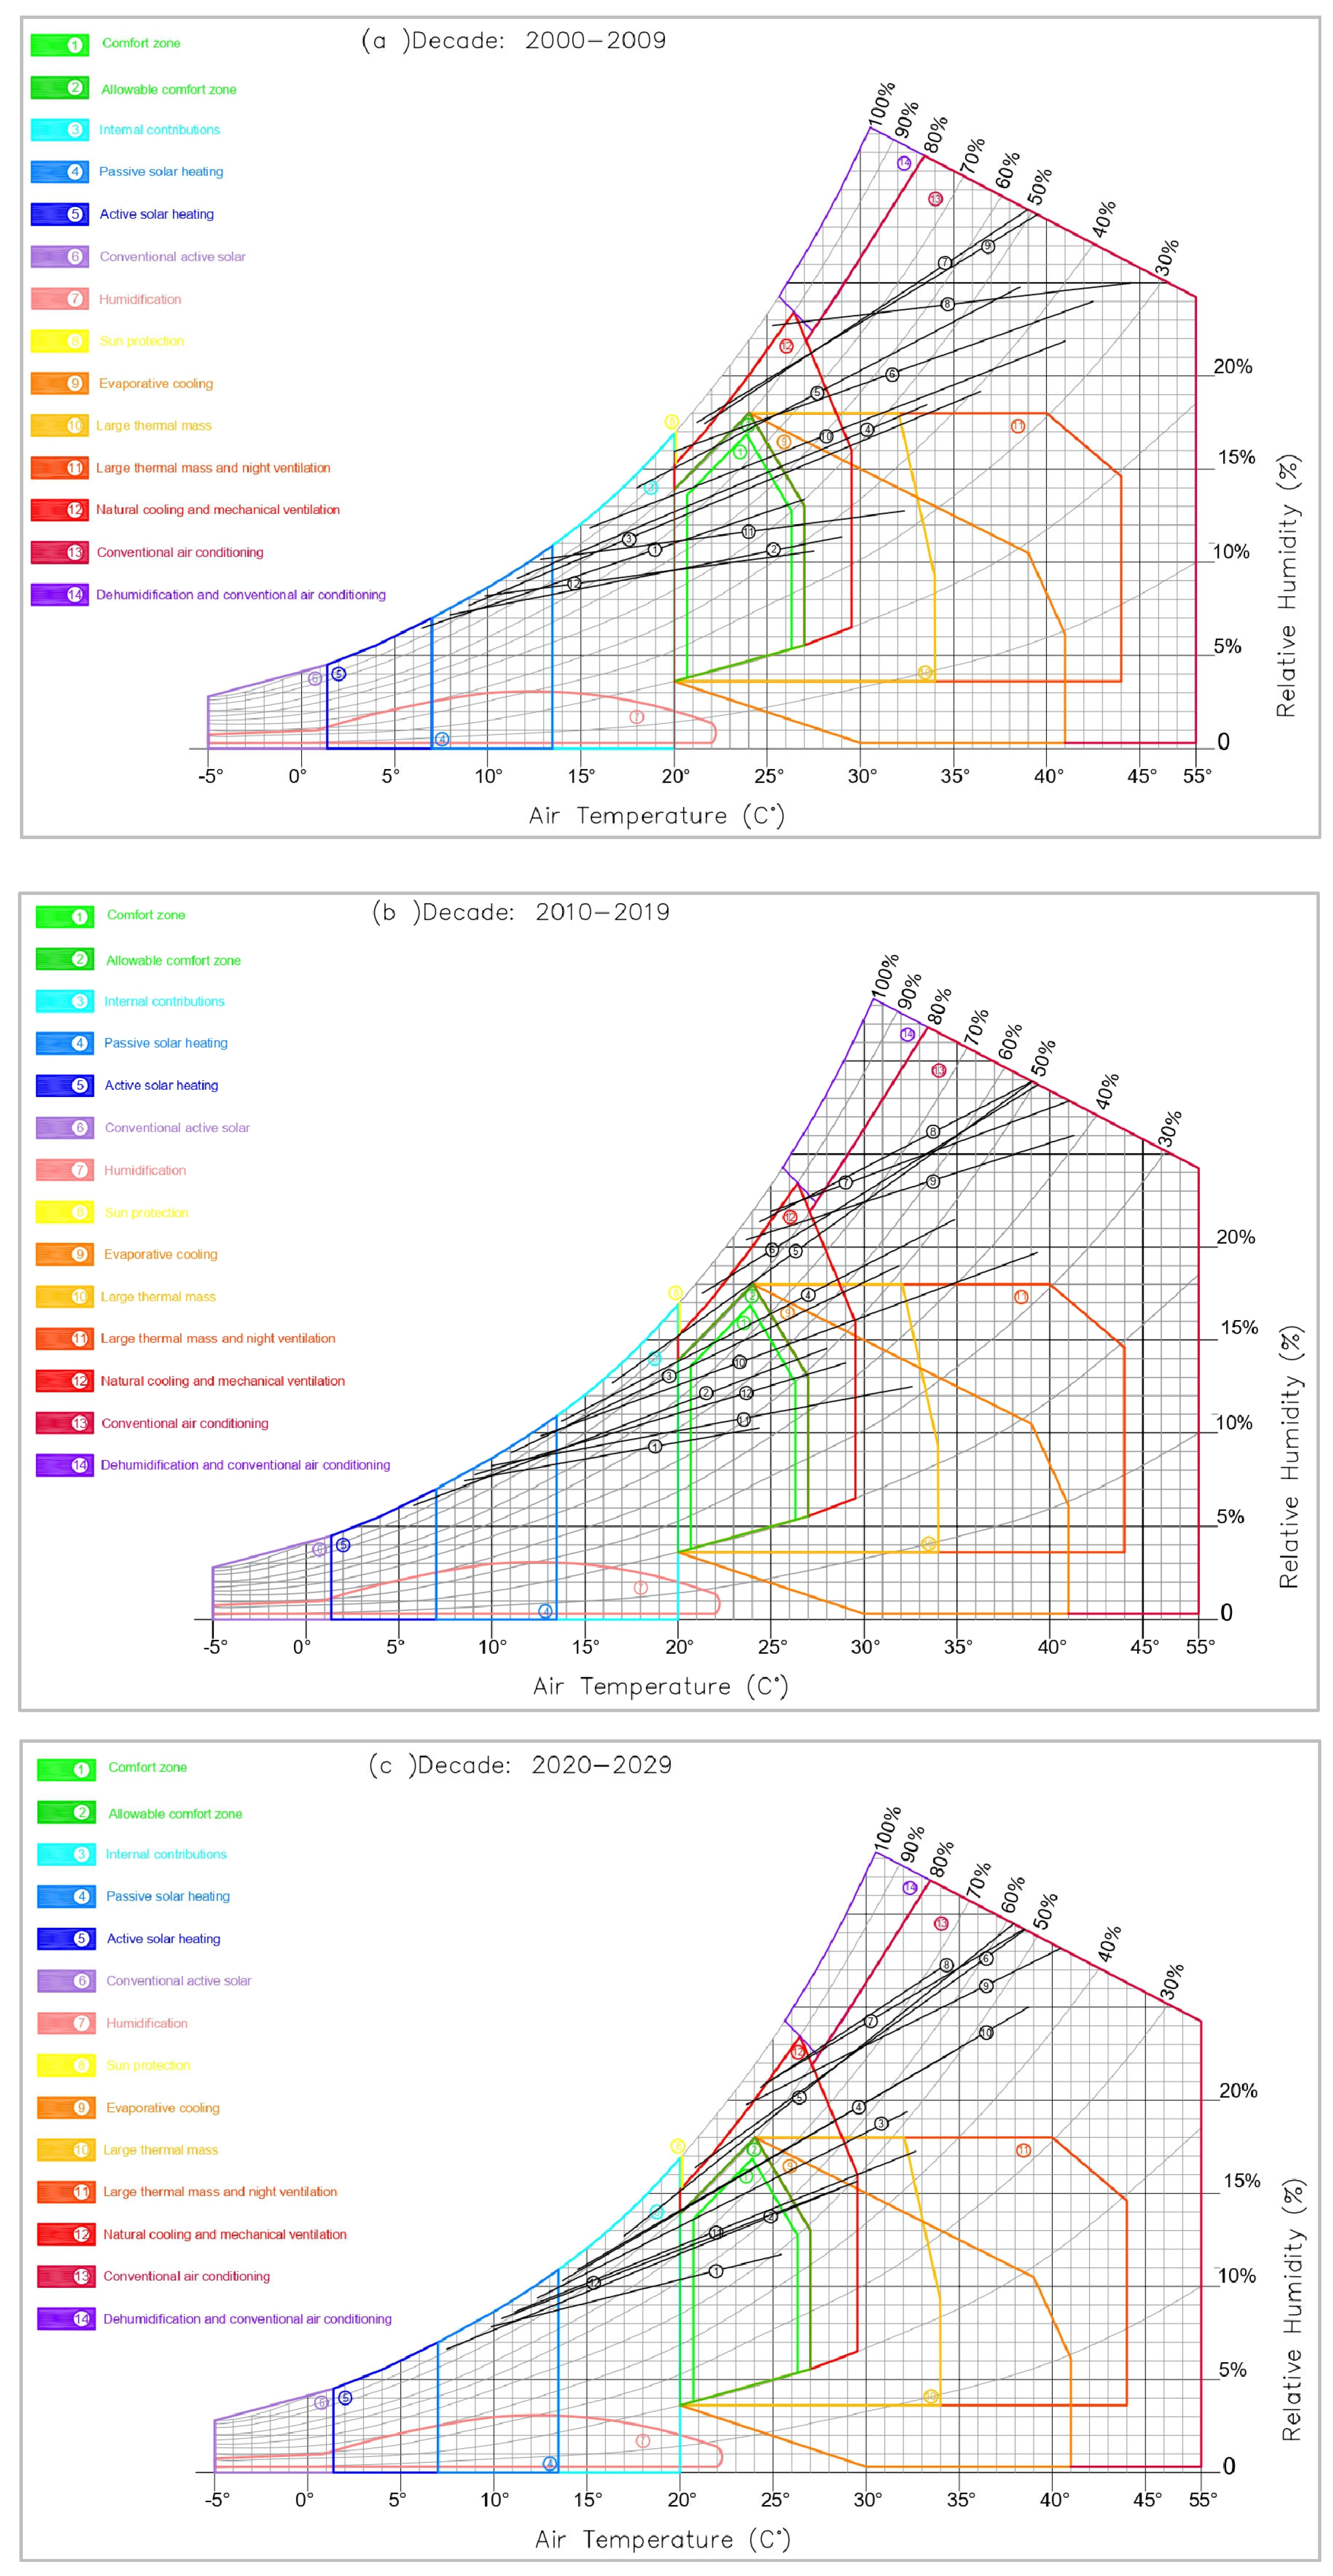
Figure 11.
The positive temperature differentials across Annaba agglomeration, using the on-site and Oke methods during (a) 7 July 2023 and (b) 14 August 2023.
Figure 11.
The positive temperature differentials across Annaba agglomeration, using the on-site and Oke methods during (a) 7 July 2023 and (b) 14 August 2023.

Figure 12.
Users’ perception of the air temperature, precipitation, relative humidity, and presence and evolution of extreme weather events in Annaba city during last decade (2013–2023).
Figure 12.
Users’ perception of the air temperature, precipitation, relative humidity, and presence and evolution of extreme weather events in Annaba city during last decade (2013–2023).
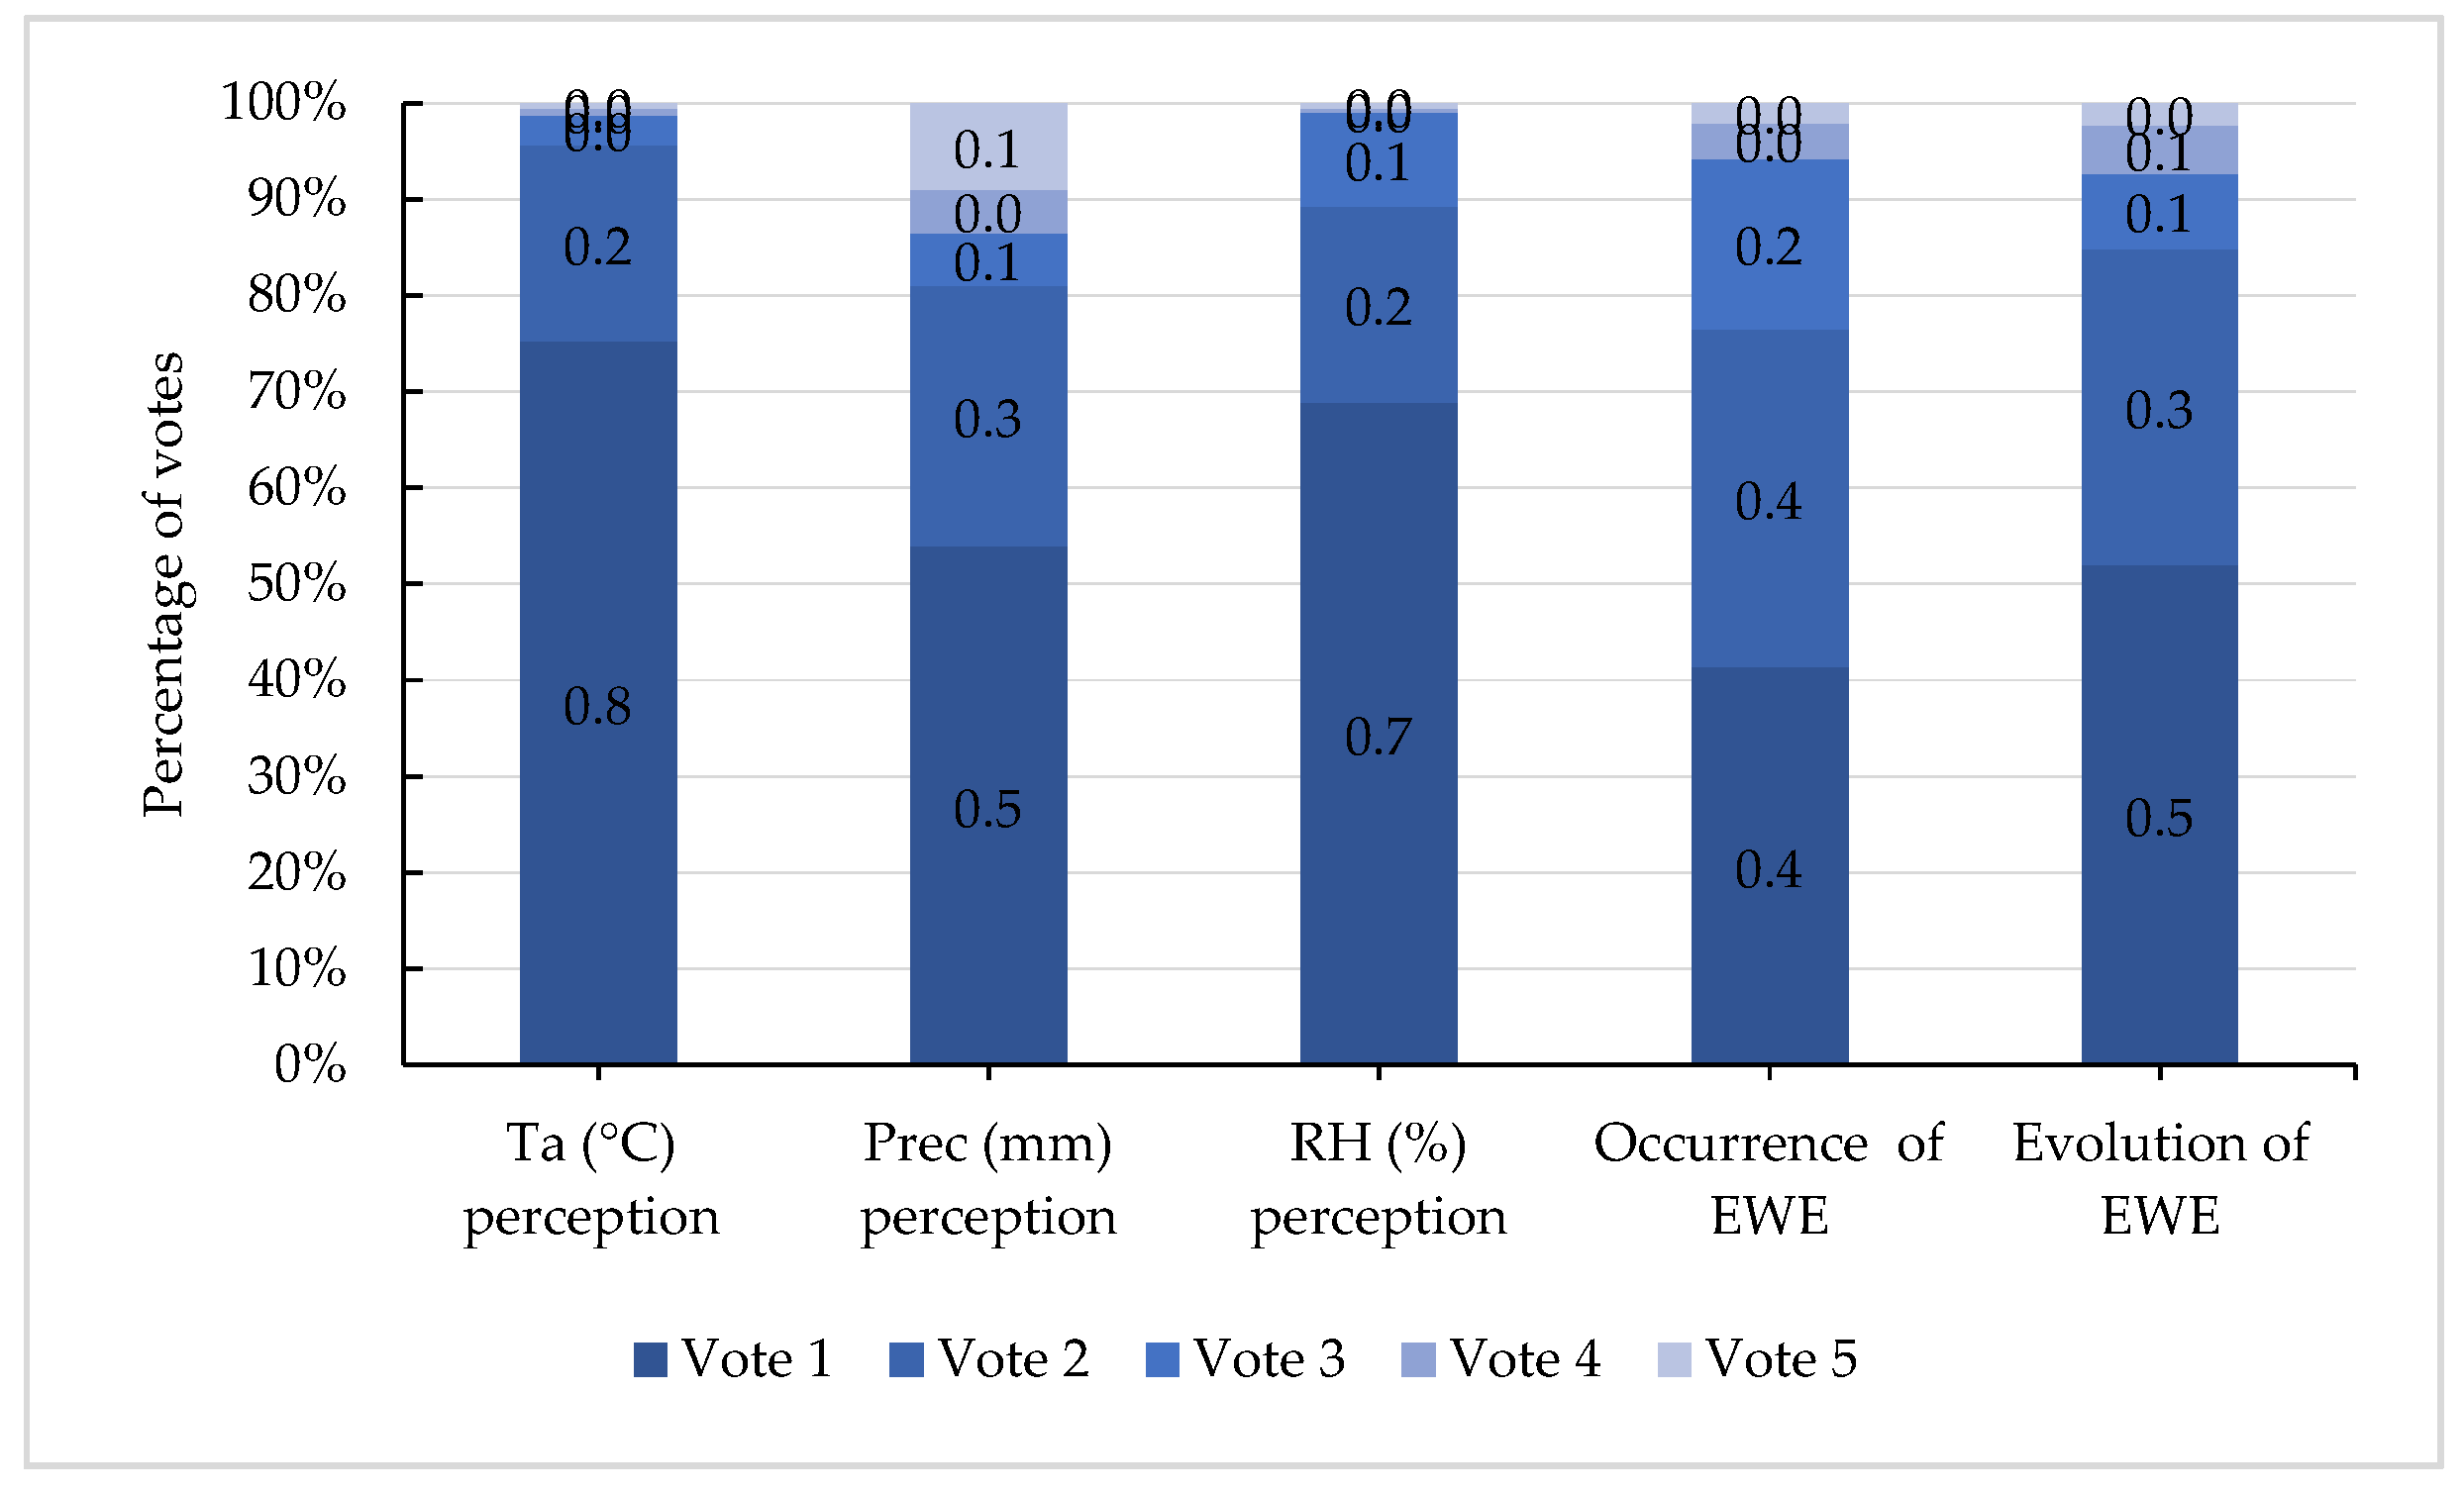
Figure 13.
Perception of climate change aspects in Annaba city during the decade 2013–2023.

Figure 14.
Daily variation of July temperatures in Annaba city from 2000 to 2023.

Figure 15.
Summary of Annaba’s weather conditions every 3 h, including temperature, relative humidity, wind speed, and visibility, on 24 July 2023.
Figure 15.
Summary of Annaba’s weather conditions every 3 h, including temperature, relative humidity, wind speed, and visibility, on 24 July 2023.

Figure 16.
Summary of the pressure and its trend in Annaba city every 3 h on 24 July 2023.
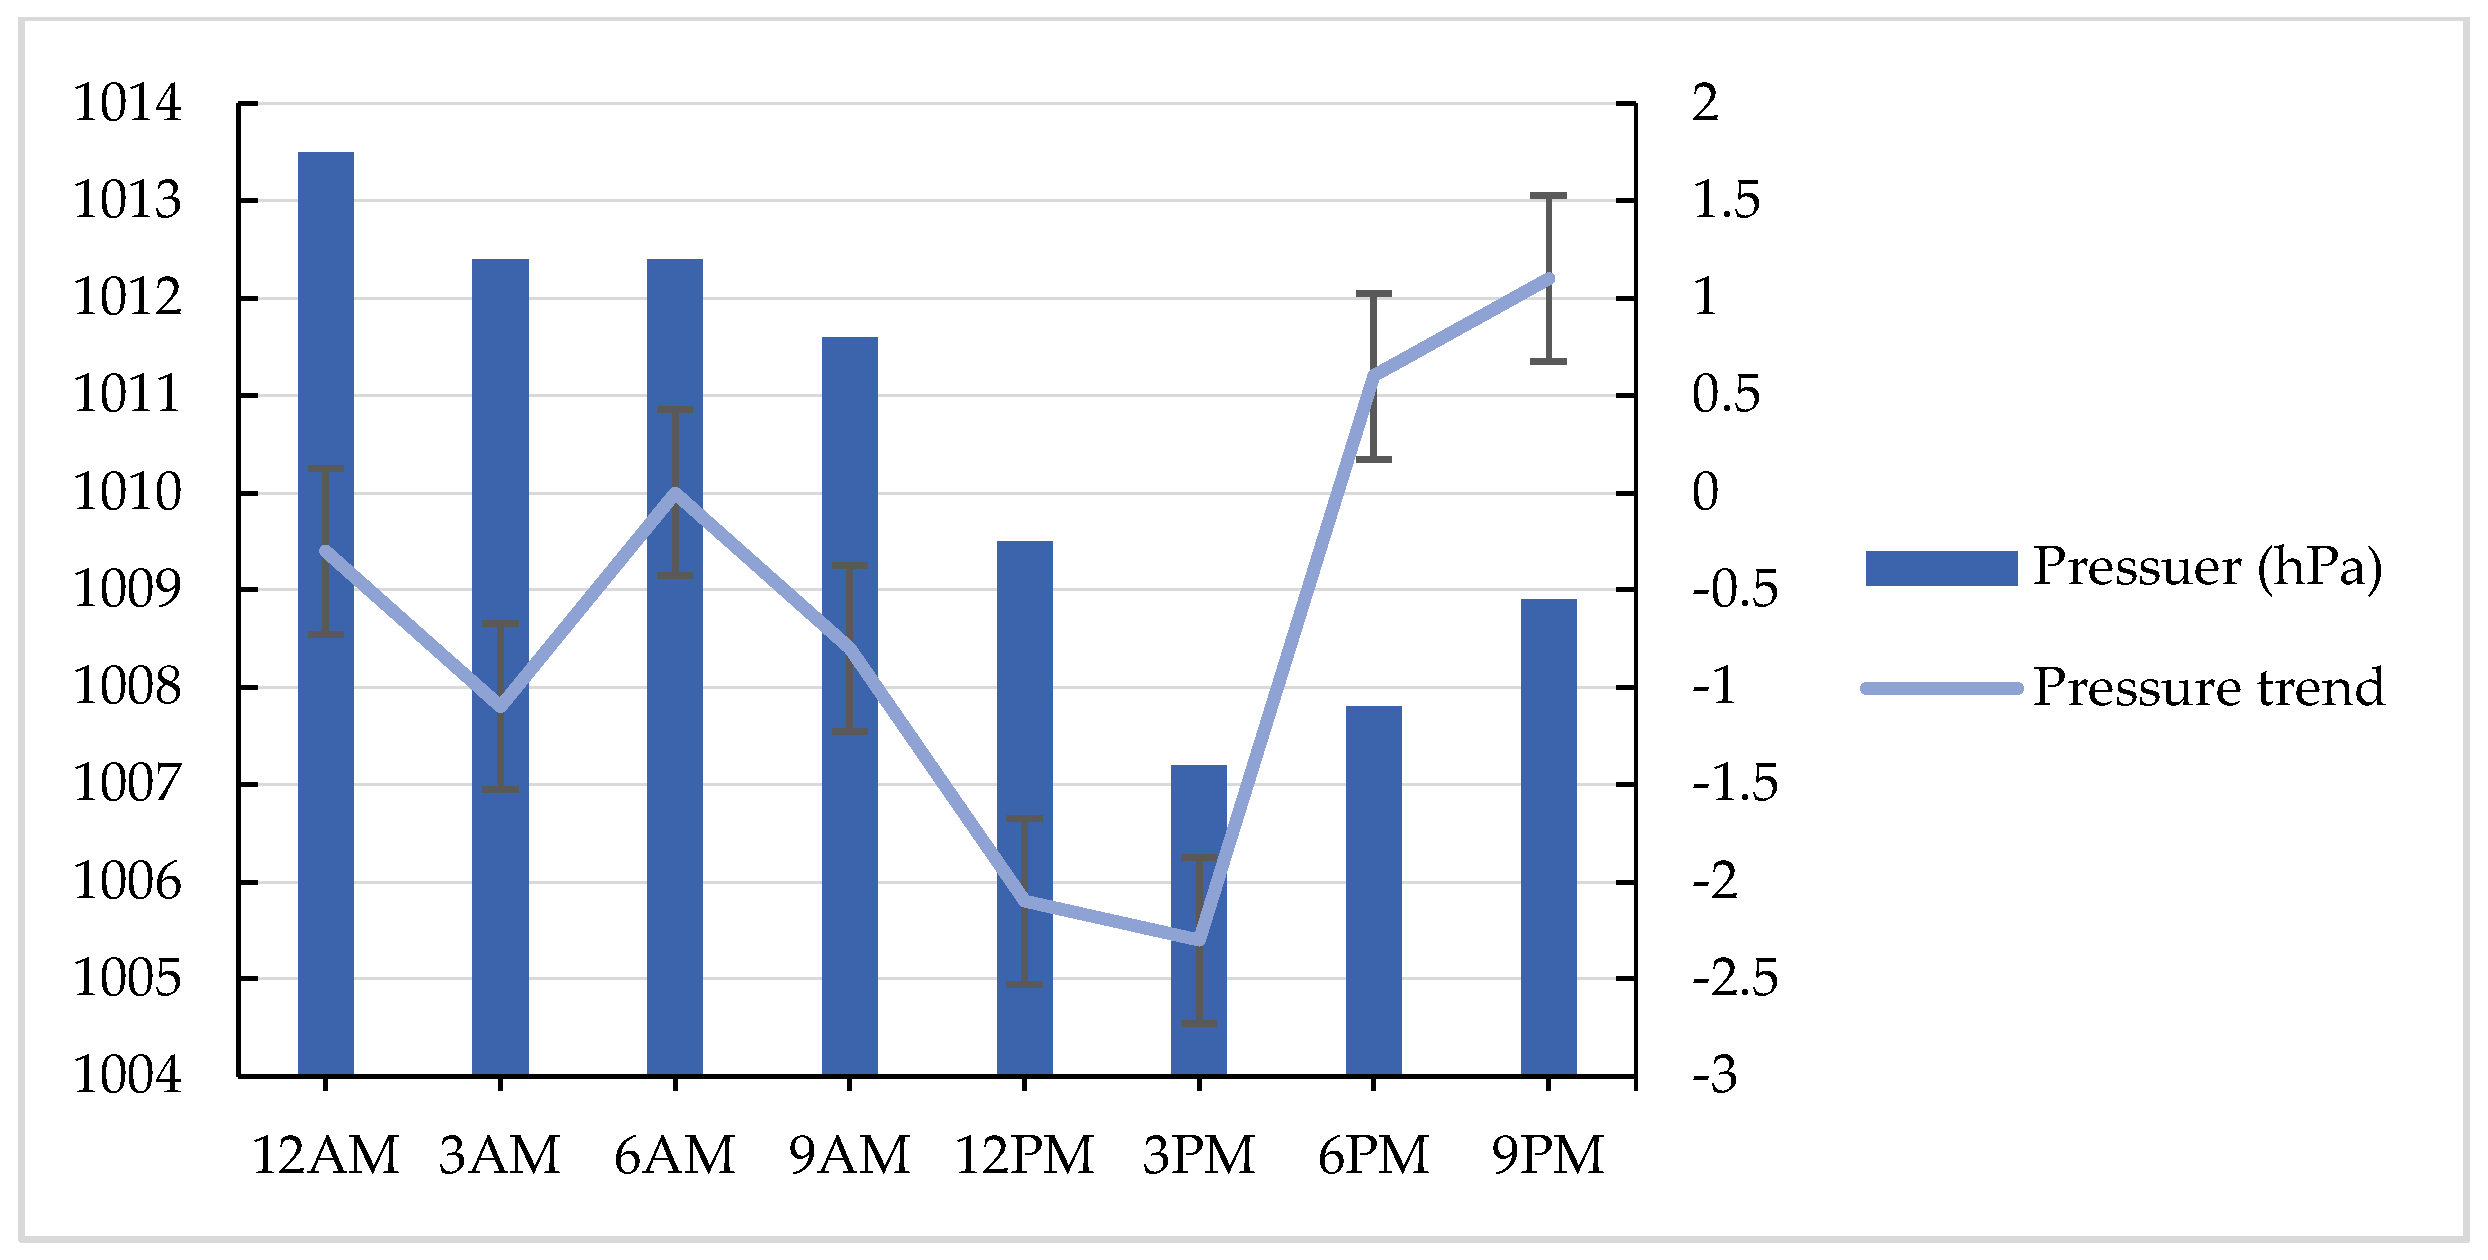

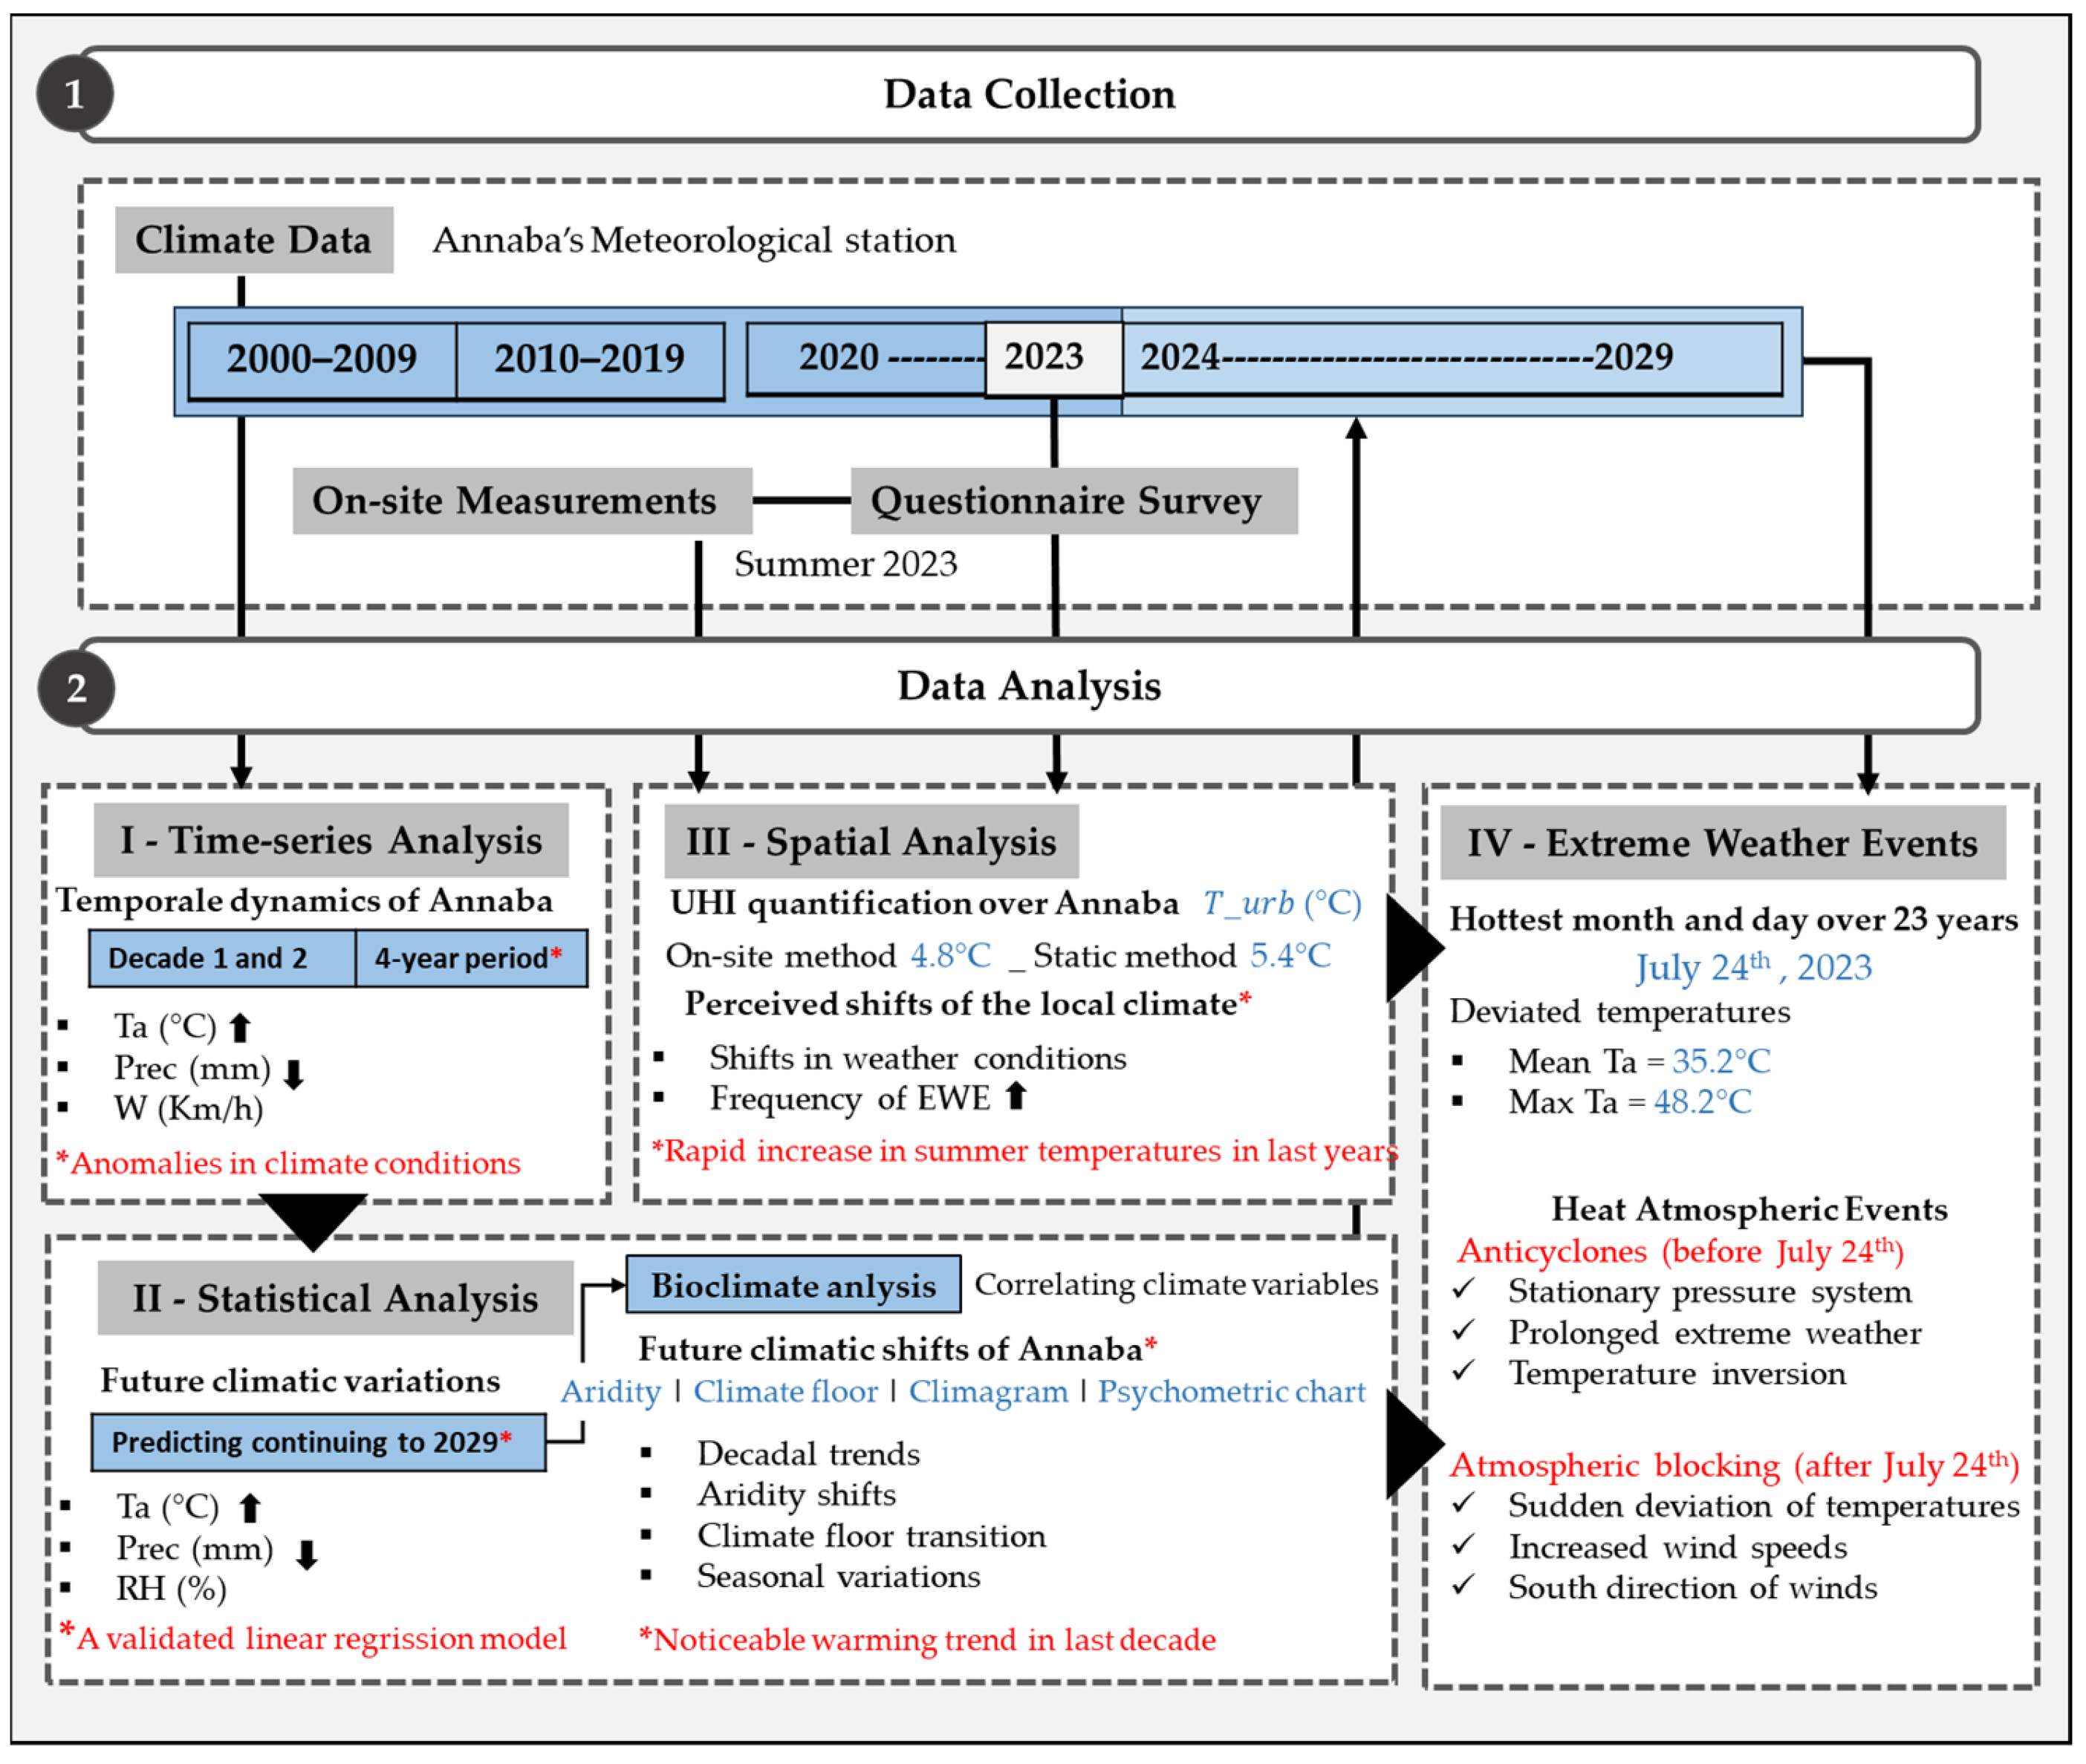
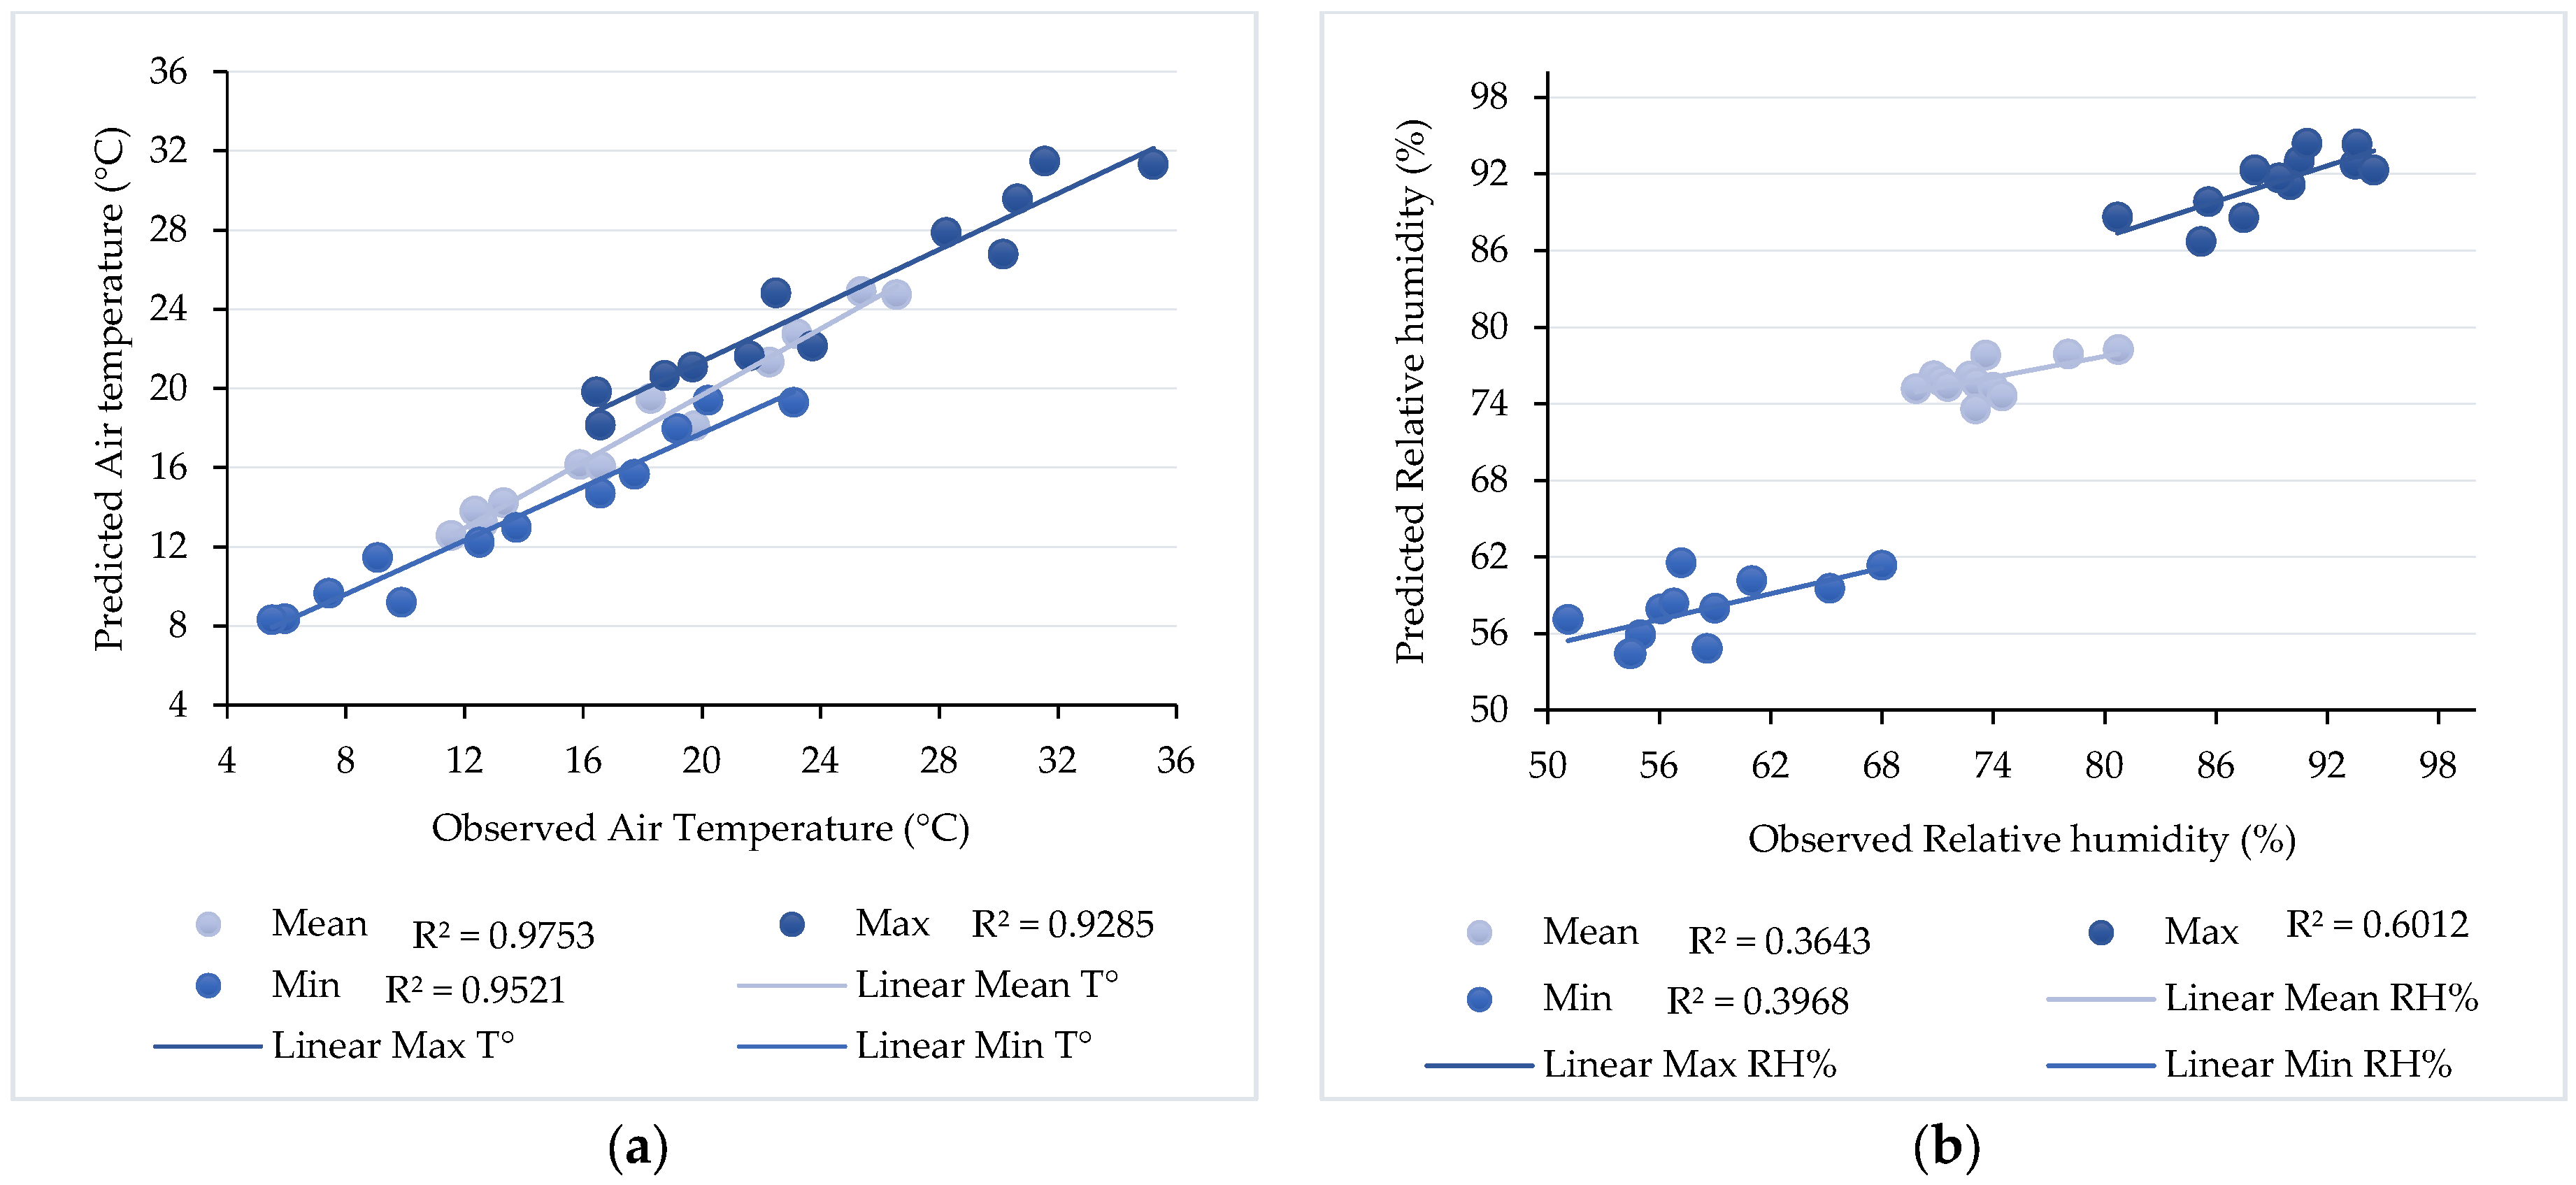
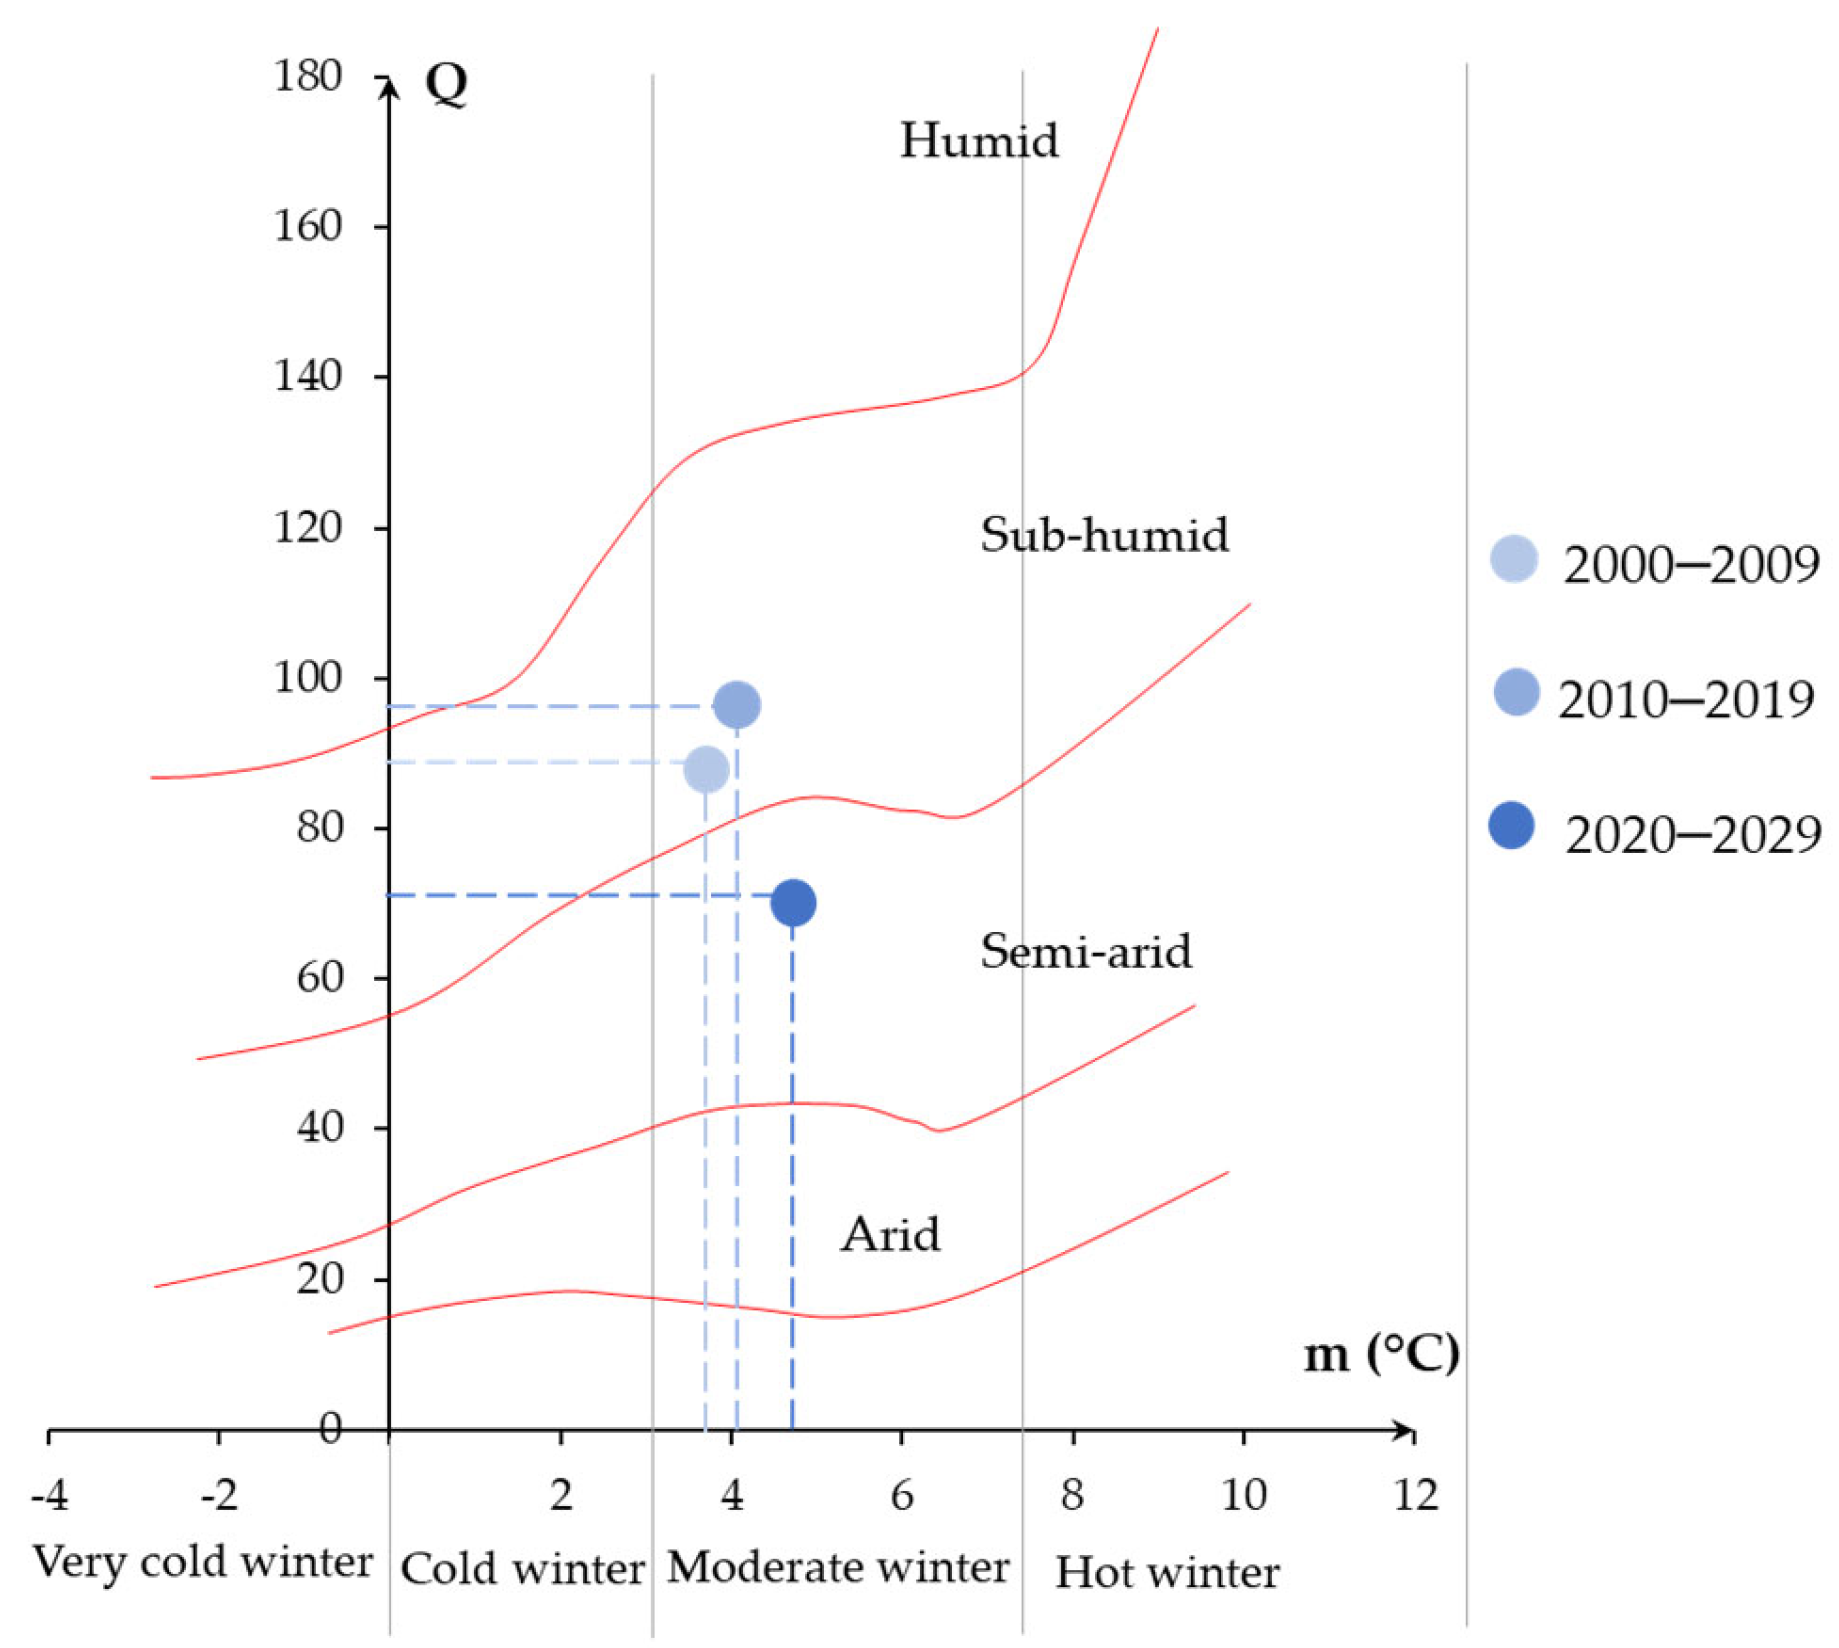
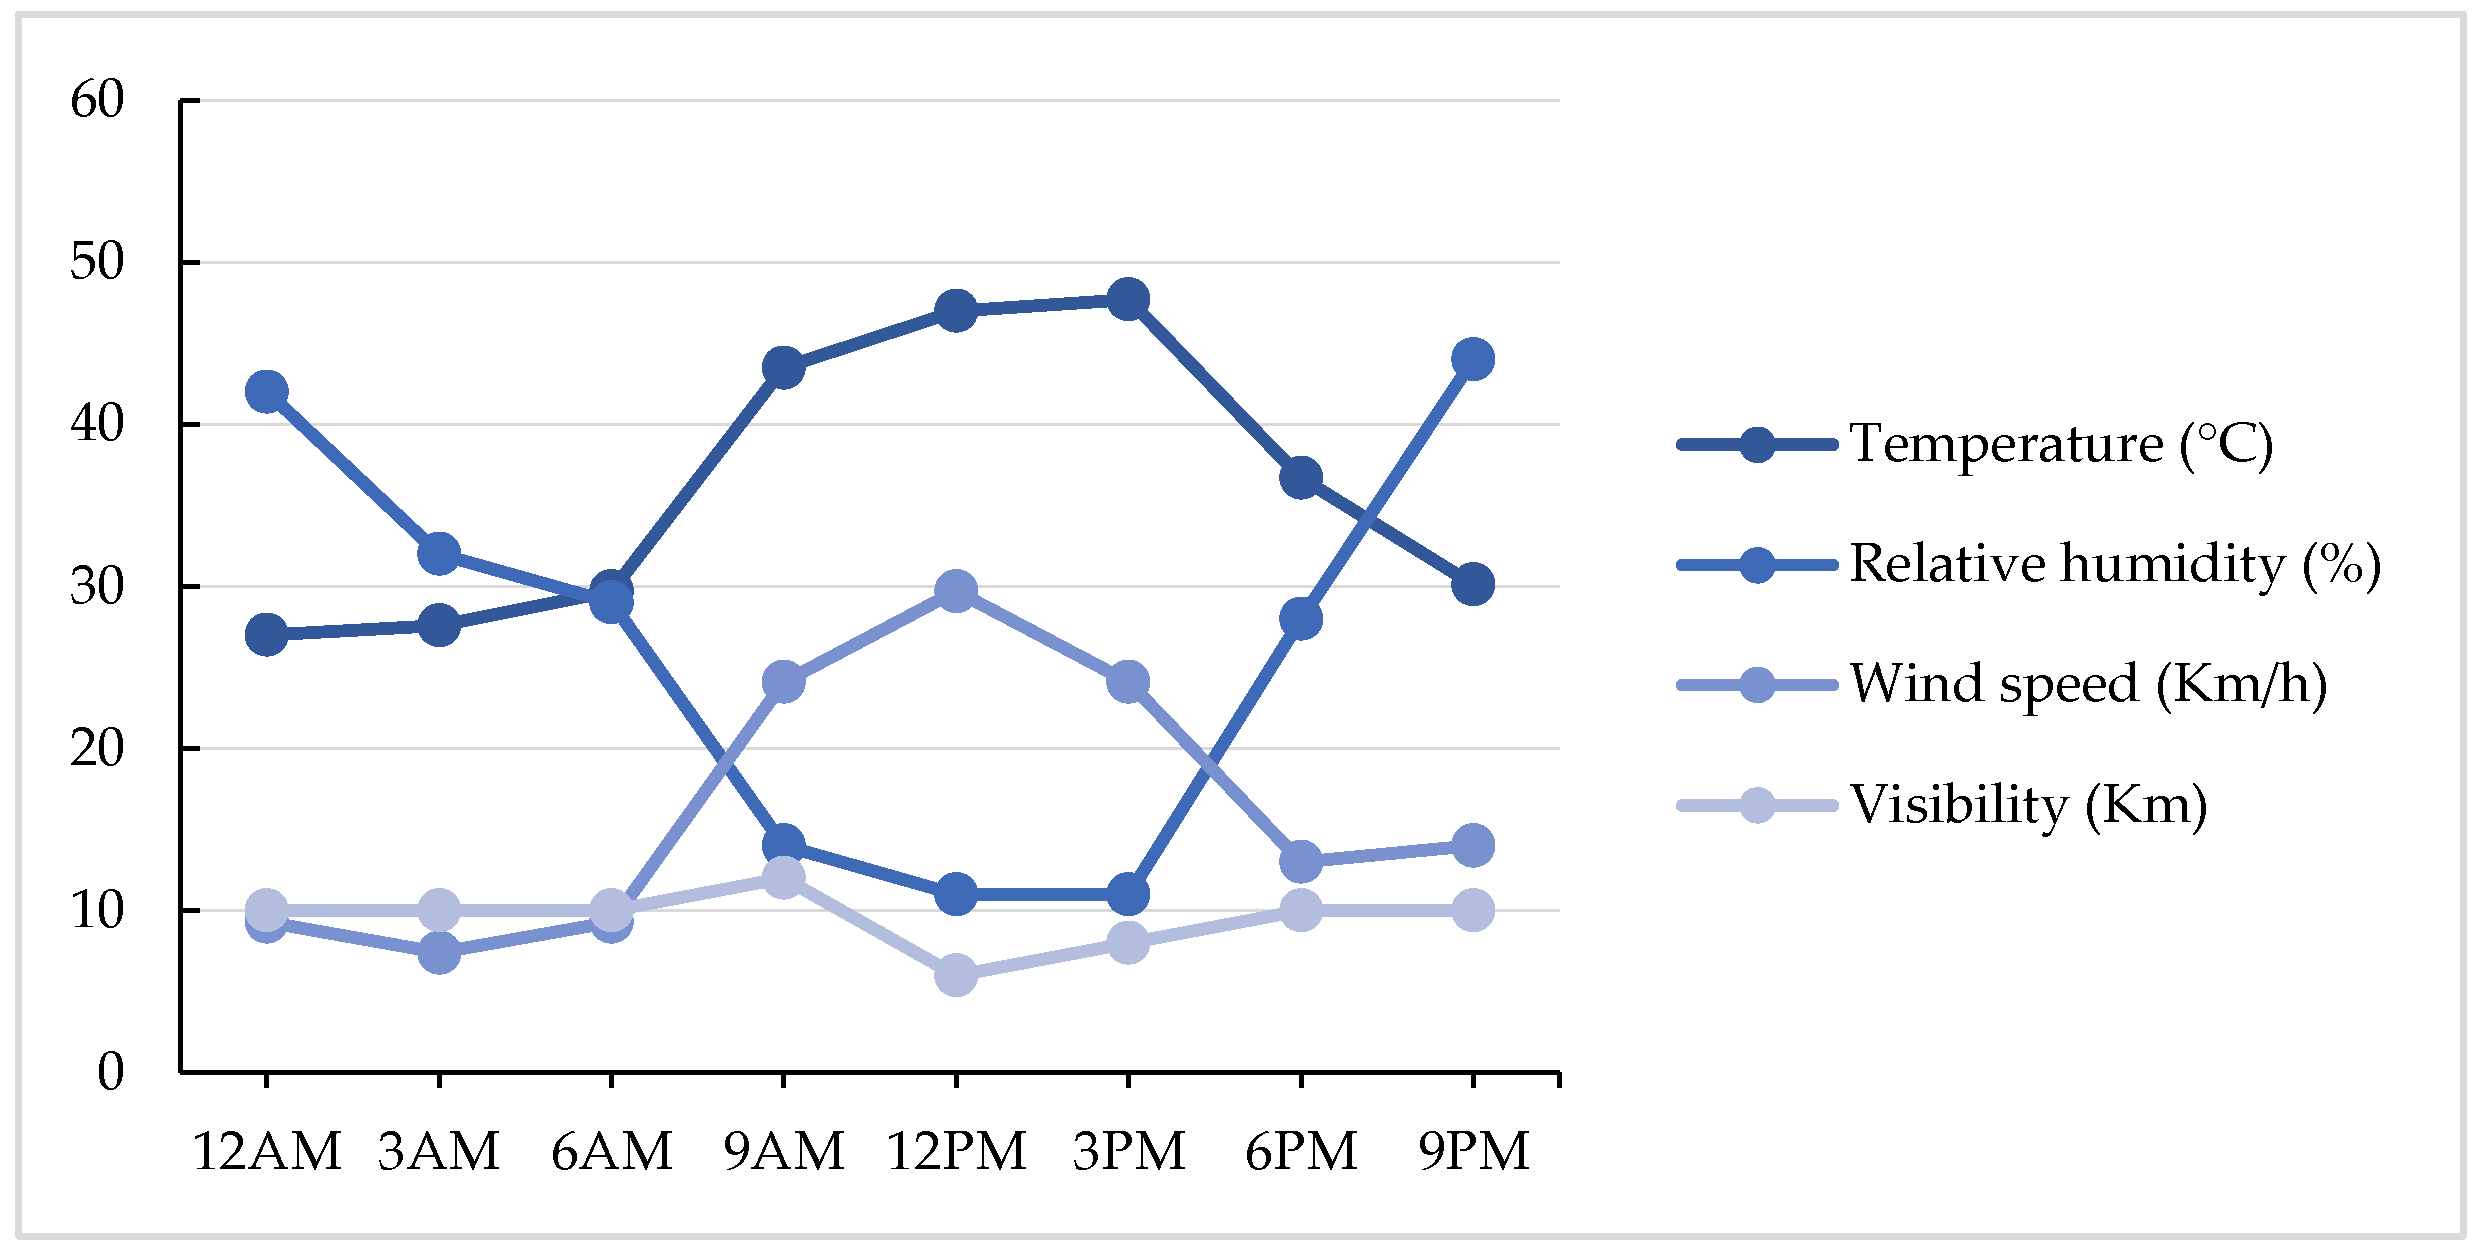
Table 1.
De Martonne aridity index categories and intervals.
| Categories | Intervals |
|---|---|
| Semi-arid | 15 ≤ I ≤ 24 |
| Moderately arid (Mediterranean) | 24 ≤ I ≤ 30 |
| Slightly arid | 30 ≤ I ≤ 35 |
| Moderately humid | 35 ≤ I ≤ 40 |
| Humid | 40 ≤ I ≤ 50 |
| Very humid | 50 ≤ I ≤ 60 |
Table 2.
Linear model regression formulation for different climatic variables.
| Climatic Variables | Model’s Formula | Coefficients | |||||||||||
|---|---|---|---|---|---|---|---|---|---|---|---|---|---|
| R² | |||||||||||||
| Ta (°C) | Max | 2.3 | 0.9 | 1.1 | 0.92 | ||||||||
| Mean | 00 | 0.97 | |||||||||||
| Min | −0.1 | 0.95 | |||||||||||
| RH (%) | Max | 33.9 | 0.6 | 1.1 | 0.60 | ||||||||
| Mean | 45.6 | 0.4 | 1.2 | 0.36 | |||||||||
| Min | 36.8 | 0.4 | −5.5 | 0.40 | |||||||||
| Prec (mm) | |||||||||||||
| Coefficients | Months | January | February | March | April | May | June | July | August | September | October | November | December |
| 111.3 | 51.8 | 1179.4 | −1.1 | 199.9 | 87.2 | −3.1 | 2.3 | 70.4 | −85.6 | 74.5 | 169.2 | ||
| −0.8 | −0.3 | −13.4 | 1.1 | −5.6 | −5.9 | 4.9 | −0.1 | −1.4 | 1.8 | 0.1 | −1.1 | ||
| R² | 0.43 | 0.51 | 0.05 | 0.37 | 0.01 | 0.85 | 0.77 | 0.99 | 0.91 | 0.01 | 0.96 | 0.91 | |
Table 3.
Monthly R2 values, covariance, and deviation for the years 2020 to 2023.
| Months | January | February | March | April | May | June | July | August | September | October | November | December |
|---|---|---|---|---|---|---|---|---|---|---|---|---|
| −284.5 | 525.4 | −64,313.3 | 932.9 | 15,352.7 | 2924.6 | 81.4 | −0.5 | 109.1 | 3262.8 | 2262.6 | 2346.8 | |
| 36.0 | 31.4 | 53.1 | 31.5 | 40.5 | 36.7 | 10.4 | 16.4 | 26.2 | 25.4 | 47.7 | 59.2 | |
| 15.1 | 24.2 | 325.4 | 19.0 | 104.6 | 12.8 | 7.5 | 2.4 | 8.9 | 38.3 | 9.1 | 14.5 | |
| R2 | 0.43 | 0.51 | 0.05 | 0.37 | 0.01 | 0.85 | 0.77 | 0.99 | 0.91 | 0.01 | 0.96 | 0.91 |
Table 4.
Two-week summary of Annaba’s weather conditions, including 24 July 2023.
| Date | Temperature | HR | Wind | Pres | Prec | Clo | Vis | Daily Weather Summary | |||
|---|---|---|---|---|---|---|---|---|---|---|---|
| (km/h) | |||||||||||
| Max | Min | Mean | (%) | Dir | Spe | (Hp) | (mm) | Okt | Km | ||
| Week before | 38.2 | 23.7 | 30.7 | 64.5 | N NE | 9.5 | 1014.0 | 0.0 | 0.0 | 10.6 |  |
| 24th July | 48.2 | 25.2 | 36 | 31.5 | S SW | 14.6 | 1010.4 | 0.0 | 0.0 | 9.5 |  |
| Week after | 32.3 | 24.3 | 28.4 | 71.9 | N NE | 13.2 | 1013.7 | 0.0 | 1.4 | 10.0 |  |
 Night clear sky;
  Daytime clear sky;
  Partially cloudy sky;
  Smoke.
Disclaimer/Publisher’s Note: The statements, opinions and data contained in all publications are solely those of the individual author(s) and contributor(s) and not of MDPI and/or the editor(s). MDPI and/or the editor(s) disclaim responsibility for any injury to people or property resulting from any ideas, methods, instructions or products referred to in the content. |
© 2024 by the authors. Licensee MDPI, Basel, Switzerland. This article is an open access article distributed under the terms and conditions of the Creative Commons Attribution (CC BY) license (https://creativecommons.org/licenses/by/4.0/).
Share and Cite
MDPI and ACS Style
Sayad, B.; Osra, O.A.; Binyaseen, A.M.; Qattan, W.S. Analyzing Urban Climatic Shifts in Annaba City: Decadal Trends, Seasonal Variability and Extreme Weather Events. Atmosphere 2024, 15, 529. https://doi.org/10.3390/atmos15050529
AMA Style
Sayad B, Osra OA, Binyaseen AM, Qattan WS. Analyzing Urban Climatic Shifts in Annaba City: Decadal Trends, Seasonal Variability and Extreme Weather Events. Atmosphere. 2024; 15(5):529. https://doi.org/10.3390/atmos15050529
Chicago/Turabian StyleSayad, Bouthaina, Oumr Adnan Osra, Adel Mohammad Binyaseen, and Wajdy Sadagh Qattan. 2024. "Analyzing Urban Climatic Shifts in Annaba City: Decadal Trends, Seasonal Variability and Extreme Weather Events" Atmosphere 15, no. 5: 529. https://doi.org/10.3390/atmos15050529
Note that from the first issue of 2016, this journal uses article numbers instead of page numbers. See further details here.