Influence of Reduced Nitrogen Diets on Ammonia Emissions from Cattle Feedlot Pens

Abstract
: Reducing crude protein (CP) in livestock diets may lower ammonia emissions. A feeding trial was conducted with crossbred steers at the Southeast Colorado Research Center in Lamar, Colorado from December 2009 to March 2010. Three diet treatments were investigated: Reduced (11.6% CP), Oscillating (13.5% crude protein 4 days/week and 11.6% CP 3 days/week) and Control (13.5% CP). Intact soil core samples (n = 36 per sampling date) were collected from the pen surfaces on three dates corresponding to 45, 92, and 148 days into the feeding cycle. Four pens from each diet treatment were sampled. Cores were placed into flow-through laboratory chambers for seven days and ammonia fluxes were trapped in acid bubblers that were refreshed every 24 h. Average daily ammonia emissions for the Control diet ranged from 6.6 to 9.4 g NH3 m−2·day−1; average daily emission for the Oscillating diet ranged from 6.3 to 8.8 g NH3 m−2·day−1; and average daily flux for the Reduced diet ranged from 4.1 to 5.8 g NH3 m−2·day−1. Ammonia fluxes from the reduced N treatment were significantly lower (21% to 40%) than from the control diet on the first two sample dates. There was no significant difference between the Oscillating and Control treatments. Reducing CP in cattle feedlot diets may be an effective method for reducing ammonia emissions from pen surfaces. More research is needed to validate these results at commercial scales in different environments to determine if reductions in ammonia can be sustained with lower CP diets without affecting rate of gain, feed efficiency and health.1. Introduction
One of the most promising strategies for reducing NH3 emissions to the atmosphere from beef cattle feedlots is reducing the proportion of fed N that is excreted to the pen surface, which involves formulating diets to stimulate physiological N retention mechanisms in cattle. Optimizing animal performance requires determining dietary protein levels above which animal production metrics do not improve. While feeding dietary protein above that level generally does not hurt the animal, it is less efficient—increasing feed costs without increasing profits, and increasing N content in animal excretions. Protein provided in excess of an animal's needs is broken down into individual amino acids which are deaminated, creating free ammonia, and quickly converted to urea by the liver [1,2]. For animals being fed near the critical point where increasing dietary protein content will not produce additional gains in production, that urea will be recycled to the digestive tract and utilized for ruminal microbial growth, increasing overall N efficiency. As the protein in the diet increases, recycling of urea decreases, and more urea-nitrogen is lost to the environment through excretion in the urine [2,3]. Feeding systems in the United States tend to ignore the contribution of urea recycling to a ruminant's overall N budget [4].
Using a pen mass balance approach at beef feedlots, Kissinger et al. [5] found that 12% of all fed N is retained by cattle, the rest is excreted to the pen surface, and 67% of excreted N is volatilized as ammonia. Overall, 60% of fed N was lost to the atmosphere as ammonia [5]. Todd et al. [6] compared estimates of N losses using micrometeorological techniques and N:P ratio analysis and reported an overall annual estimate of 50% of fed N lost as ammonia. Using an inverse dispersion technique, Flesh et al. [7] reported a 64% loss of fed N. Other studies report similar findings [8-10]. Winter/spring ammonia losses of fed N were 12–53% lower than summer/fall losses [5,6,9]. Absolute flux of ammonia from feedyards measured using a variety of techniques and in a variety of locations around the United States ranges from 2.89 to 5.8 g m−2·day−1 in the winter, 6.02 to 7.81 g m−2·day−1 in the summer, and 5 to 6.8 g m−2·day−1 on an annual basis [6,7,9-11].
One way to mitigate N losses from feedlot systems is by manipulating protein content of the feed. By reducing dietary protein content to match animal needs more closely, more urea recycling is stimulated, overall feed efficiency improves, and N losses are minimized or shifted so a larger fraction is in fecal N. Using a mass balance approach, Erickson et al. [12] reported a 15–33% reduction in N loss in a phase feeding study in Nebraska that reduced N inputs by 10–20% with no associated negative impacts on cattle performance. Using micrometeorological techniques Todd et al. [13] demonstrated a 35% increase in ammonia emissions when the diet at one feedyard was supplemented with distillers grains for a 16.3% crude protein (CP) feed compared to 12.2% CP at a comparable feedyard not using distillers grains. Using tower-based measurements from a commercial Texas feedlot as inputs into an inverse dispersion model, and feed grab samples, Todd et al. [9] demonstrated a relationship between increasing CP in the diet and increased NH3-N losses. Throughout three summer and winter campaigns, feed N increased between 15 and 26%, while NH3-N loss increased 10–64% [9].
Animal scientists often collect the urine and feces directly from livestock and measure the ammonia emissions in the laboratory. A study done by Cole et al. [14] showed that reducing dietary CP from 13% to 11% reduced urine and fecal nitrogenous losses by 60% to 200%. Todd et al. [15] measured emissions from artificial feedlot surfaces in the field and in laboratory chambers using urine and fecal material collected from an experimental feedlot in Texas. Steers were fed 11.5% and 13.0% CP diets, and significant decreases in ammonia losses were measured in both the in vitro field trials and in the laboratory. Loss reduction has also been reported from urine and feces in laboratory chambers from livestock receiving a diet with oscillating CP [16]. Cole et al. [8] conducted a phase-feeding trial to compare several levels of dietary CP and the timing of feeding different diets. When animals were switched from a 13% CP diet to an 11.5% CP diet for the finishing phase, volatilization losses were reduced, but animal performance was adversely impacted. However, the group that was fed 11.5% CP diet throughout the feeding trial showed a 25% decrease in N volatilization compared to those fed 13% CP with no impact on animal performance [8]. While laboratory flux methods achieve a controlled environment for comparing ammonia loss among diet treatments, previous studies have been done using disturbed samples of mixed manure and urine that do not replicate the physio-chemical conditions of a feedlot pen surface.
Although there has been limited research of diet effects on ammonia emissions from beef cattle, there have been no statistically-based studies that directly link dietary changes to ammonia volatilization from open-lot feedlot pens. Thus, the main objective of this project was to determine if a reduced CP diet in feedlot cattle causes a corresponding reduction in NH3 emissions from the pen surface. This study used flux measurements from intact pen-surface samples from three diets (Control, Reduced CP, and Oscillating CP) to make statistical comparisons among treatments. Additionally, this study compared measurements from the laboratory system to calculated N retention and excretion in animals fed the three different diet treatments.
2. Methods and Models
2.1. Feeding Trial
The feeding trial began in November of 2009 at the Colorado State University Southeast Colorado Research Center in Lamar, CO. Monthly average temperature in Lamar during the November 2009 to March 2010 ranged from −4 to 9 °C. A nearby weather station recorded 11.7, 0, 8.4, 11.4, and 33.8 mm rainfall events from November 2009 through March 2010. These precipitation data are likely biased low, since the rain gauges in use typically do not detect snowfall accurately. Average precipitation in this area is about 10 mm from November to February and about 25 mm in March. The study was conducted with 84 crossbred steers blocked by weight, and fed one of three treatment diets. The cattle had an average starting weight of 330 kg and were fed for 149 days. There were four pens per treatments with a stocking density of 7 head per pen (12 m2·head−1). Prior to the study, the pens were scraped clean of all manure so that the soil hardpan was visiably exposed. There was no manure-based organic matter on the surface. Diet treatments included in this study were:
Control: traditional starting and step-up diets through 21 days followed by a 13.5% crude protein (CP), 3.50% crude protein extract (CPE) from non-protein nitrogen (NPN) through slaughter;
Oscillating N: traditional starting and step-up diets through 21 days followed by alternating an 11.62% CP, 1.55% CPE from NPN diet with control diet on a 48 h basis; (The reduced diet was fed every Wednesday, Thursday and Sunday and the control diet was fed every Monday, Tuesday, Friday and Saturday from 22 days through slaughter);
Reduced N: traditional starting and step-up diets through 21 days then 11.62% CP, 1.55% CPE from NPN from day 22 through slaughter.
All treatments were applied to a 77% steam-flaked corn based diet. Urea and ground corn was used to modify dietary CP concentrations. Cattle were implanted with 200 mg trenbolone acetate and 40 mg estradiol. Fecal grab samples were taken 3 or 4 times (depending on the replicate) throughout the trial to determine the N concentration in the feces. This information coupled with the feeding data were then used to calculate retained and excreted N using standard National Research Council (NRC) equations [17].
2.2. Pen Sampling
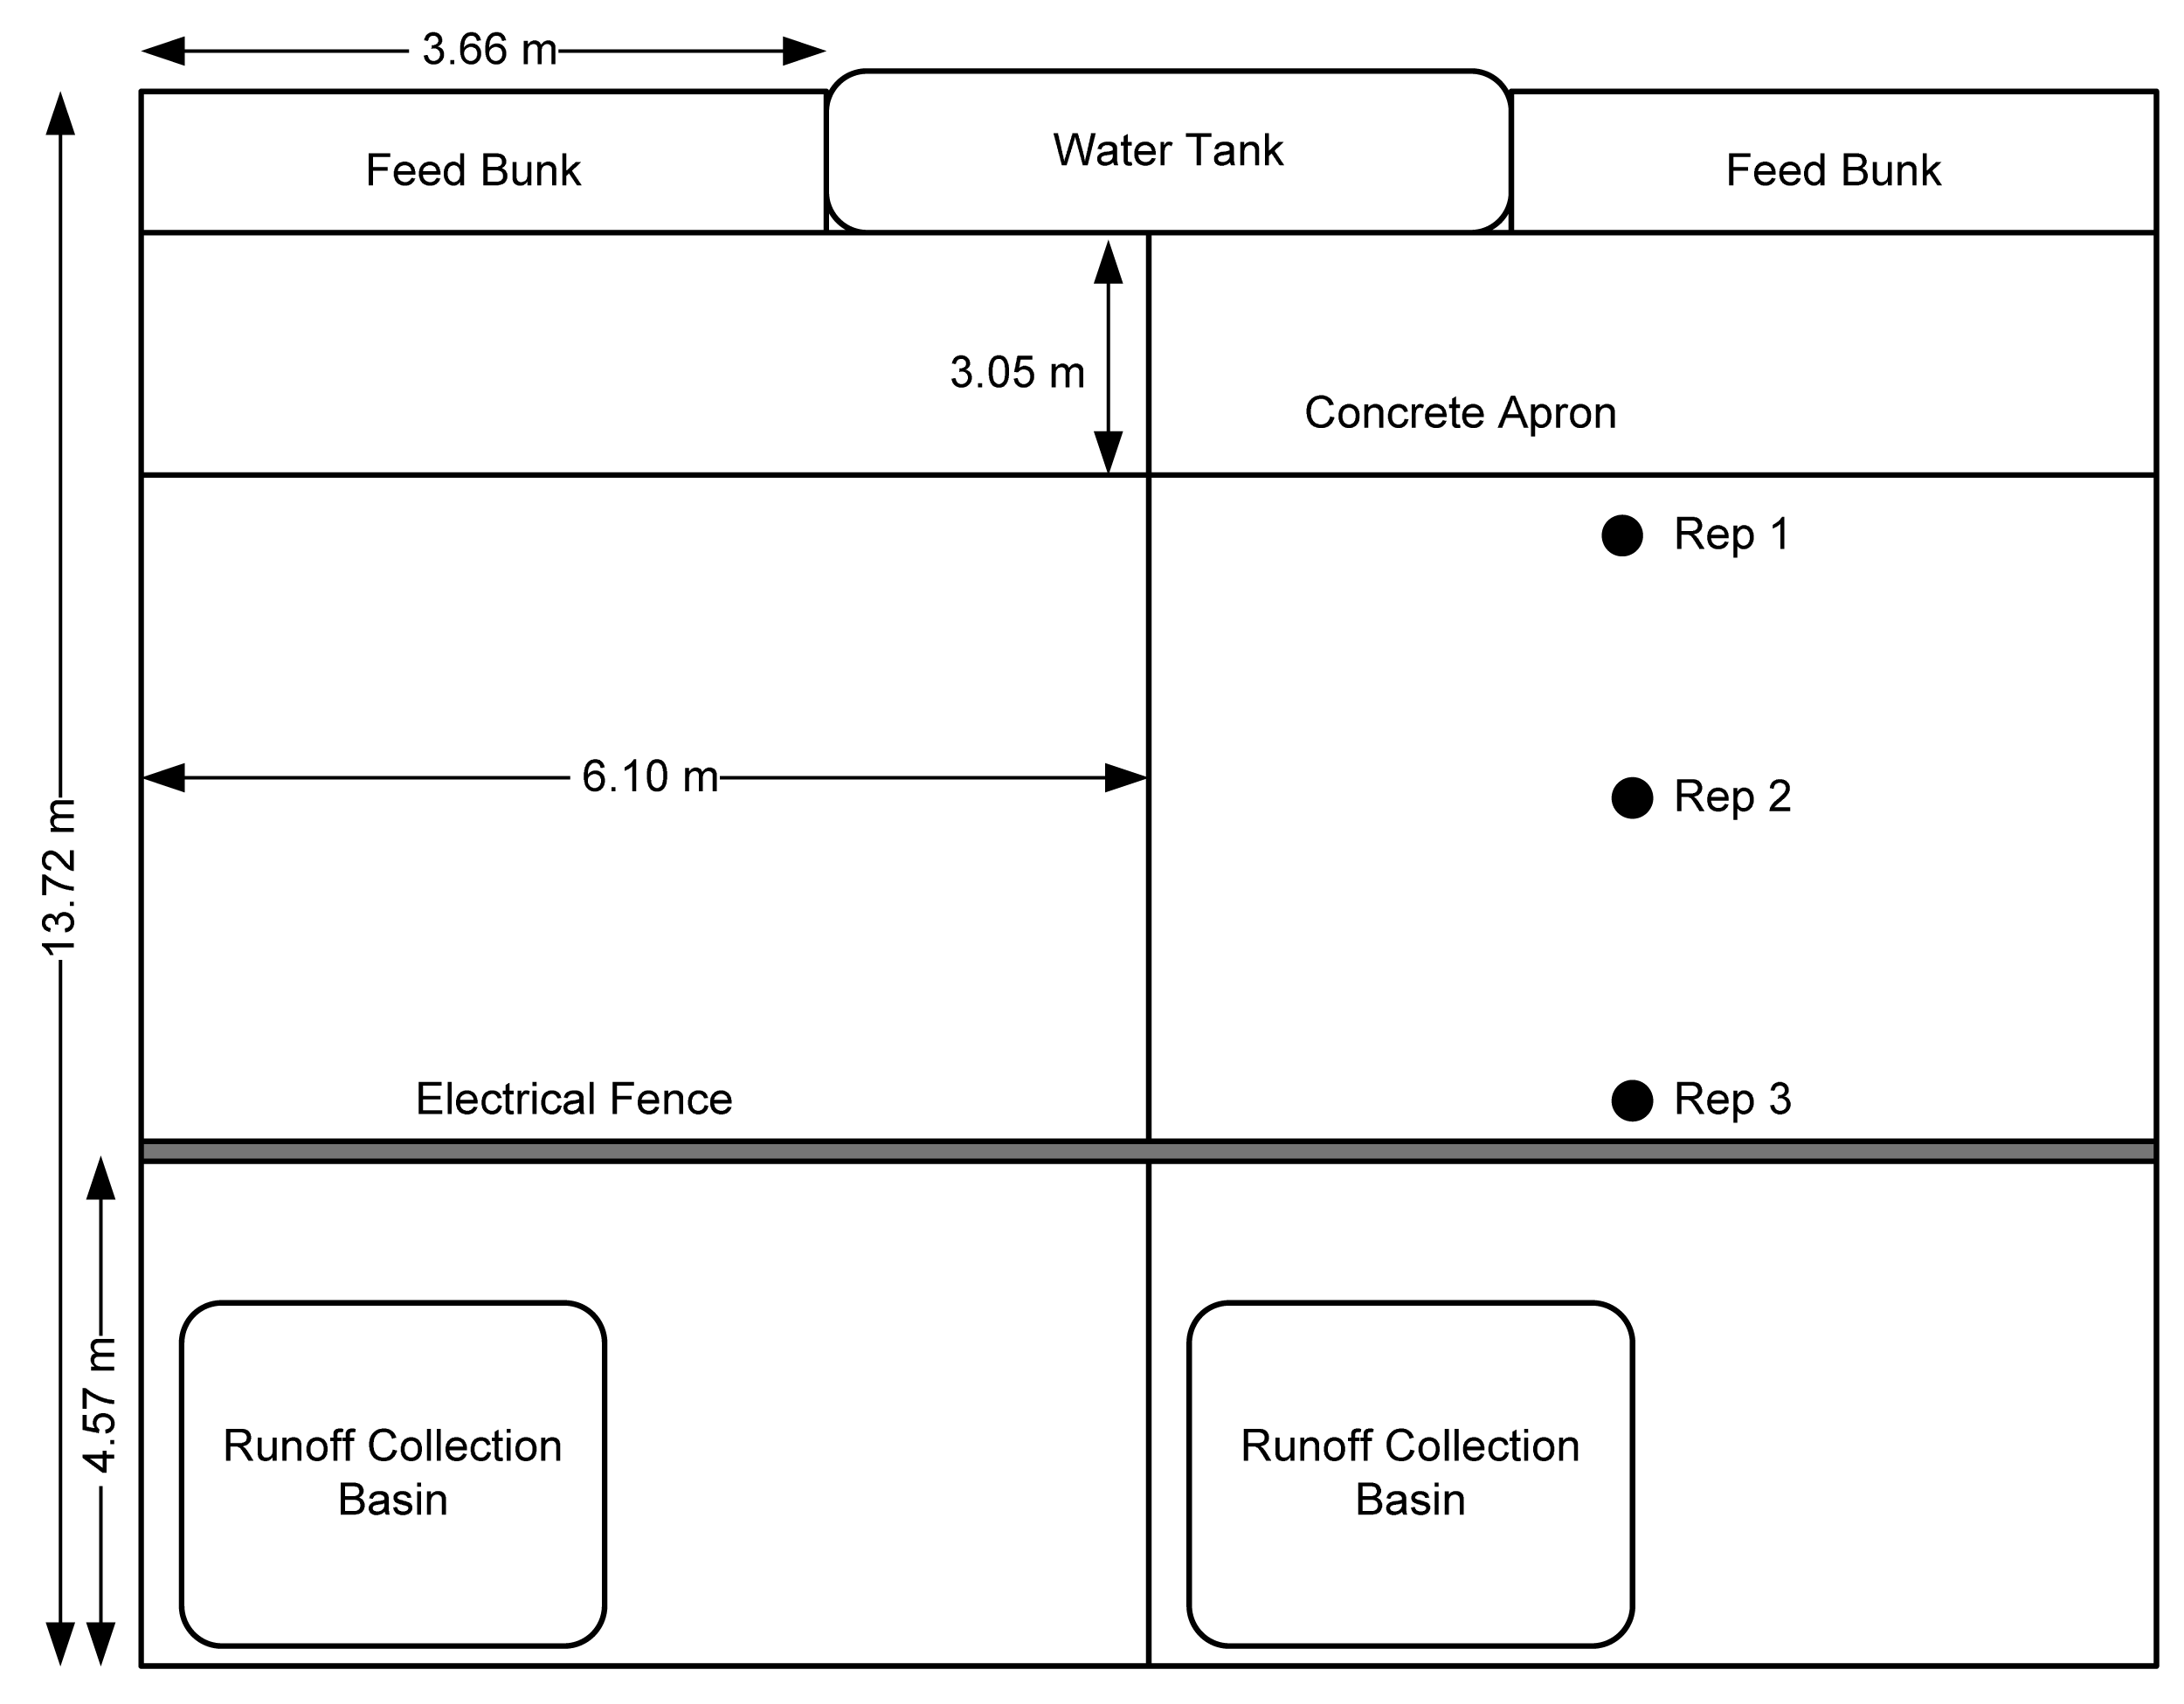
Pen surface samples were taken from three locations in each of 12 pens (4 per treatment) on days 45, 92, and 148 of the feeding trial. Due to frequent precipitation and low wintertime evaporation rates, the pen surface was wet, “muddy”, and well-mixed on all sampling dates. Samples were taken from the center of the pen in three different locations; Rep 1 was taken 1 m from the concrete apron near the feed bunk; Rep 2 was taken from approximately the middle of the pen; Rep 3 was taken at the rear of the pen near the electrical fence (Figure 1). A steel cylinder 12.7 cm in diameter and 4 cm deep was placed on the pen surface near the designated sampling locations. Fresh manure pats and clearly visible urine patches were avoided. The cylinder was pushed by hand into the surface and the sample and cylinder was removed from the pen surface. Under typical feedlot conditions, a pneumatic or a hammer driver would be used to drive the cylinder into the hard-packed surface, but due to the wet conditions, this was not necessary for any of the sampling dates in this study. Excess soil was eliminated from the bottom of the sample and outsides of the cylinder. The manure pack was deep and clearly discernable from the base subsoil. Thus, the cores we collected in this study only sampled the manure pack and did not extend into the underlying hardpan. The sample and drive cylinder were double bagged in labeled 8 mil low density polyethylene bags and sealed to prevent any ammonia flux. All samples were frozen within 8 h of initial collection and stored for approximately six weeks before analysis.
2.3. Flux Chamber System
All samples were evaluated for N loss using an ammonia flux chamber system at Colorado State University, Fort Collins, Colorado. The twelve chamber, flow-through design is built around modified vacuum desiccators about 15 cm in diameter. Modifications to the desiccators and general system design are described in Vaillant [18]. Ammonia-free air at room temperature (about 22 °C) and controlled humidity (dewpoint temperature of 12 °C) was routed into each chamber at a rate of 5 L·min−1 (6.7 chamber volumes per min.). Laboratory measurements showed this flow rate produced an aerodynamic conductance similar to that observed under field conditions [18,19]. Temperature and humidity of the supply air were monitored using an Onset U23 sensor (Onset Computer Corp., Bourne, MA, USA). The air flowed into the top of chamber and was spatially diffused using a ported manifold. Air exited through the side of the chamber and was routed through a short section of Teflon tubing to a 500-mL acid bubbler bottle containing about 100 mL 0.1 M phosphorous acid. All samples ran in the system for seven days. The acid bubblers were changed daily and stored in a refrigerator for analysis. At the conclusion of each measurement run, the acid solutions were decanted into a graduated cylinder to record the final volume of acid solution. Thirty milliliters of sample was stored until the NH3 concentration of the acid solution was measured using a Flow Injection Analyzer by the salicylate method (FIAlab Instruments, Bellvue, Washington, USA).
Because ammonia volatilization is strongly dependent on environmental conditions, especially temperature, the flux rates from the chamber system were not expected to represent actual fluxes from the feedlot pens in winter at Lamar, CO. However, the repeatable environmental conditions attainable in the laboratory provided a means to evaluate how expected differences in excreted nitrogen among treatments might affect NH3 flux from intact cores. In a sense, the chamber data are a top-down method to detect differences in the surface physio-chemistry of NH3 volatilization caused by differences in cattle diets.
2.4. Soil Analysis
Small samples of the core surface crust (0 to 5 mm depth) were taken before and after running in the chamber system for pH measurement using a microelectrode (Model No. MI-410, Microelectrodes Inc., Bedford, New Hampshire, USA). After the flux measurements were completed, all core samples were frozen pending soil analysis. Frozen samples were quartered, and one quarter of each sample was acidified. A spray bottle filled with 2% acetic acid was used to soak the outside of the intact samples three times over 4 h to lower pH and minimize ammonia volatilization. They were then air dried, ground, and sealed in 8 mil LDPE plastic bags. Analysis by Servitech (Dodge City, Kansas, USA) included: total N, organic N, ammonium, nitrate, organic matter, ash, and carbon: nitrogen ratio. All three reps from each pen were ground together and pooled for soil analysis.
Initial moisture content was determined by weight. Each sample was weighed prior to and following incubation in the chamber system. Samples were then frozen and divided into quarters. Three-quarters of nine samples (one from each of the three diet treatments, from each of the three pen sampling locations) from each of the sampling dates were weighed frozen. They were thawed and dried at room temperature for 2 days and further oven dried at 50 °C for one day. Initial water content of nine samples was averaged to provide an estimate for the initial water content for each sampling date.
2.5. Statistical Analysis
Treatment differences on ammonia flux were analyzed using SAS 9.2 (SAS Institute, Cary, North Carolina, USA) proc mixed with a Tukey adjustment for multiple comparisons (alpha of 0.10). Cattle average daily gain was analyzed with a similar model. The initial and final pH values were compared with a paired t-test (alpha of 0.05). Emissions from the chamber studies were evaluated statistically comparing the cumulative fluxes over the seven-day test period and by breaking the data into three intervals: Day 1 (24 h), Days 2 and 3 (48 h), and Days 4 to 7 (96 h). This was in response to previous measurements that showed the ammonia flux in the chambers tended to change over time.
3. Results and Discussion
3.1. Nutrient Analysis
For the first two sampling dates (Day 45 and Day 92), the surface pH before and after the chamber runs was not significantly different. For the third sampling date surface pH after the chamber runs was lower than pH measured before for all treatments (p ≤ 0.033; Table 1). Both initial and final pH, taken at the beginning and end of the chamber measurements, were significantly lower for the Reduced N treatment than for the other treatments for samples taken on trial day 45. All initial and final pH measurements ranged between 6.40 and 8.32 with an overall mean of 7.44. Summary statistics for pH measurements for all sampling dates and treatments are presented in Table 1. Vaillant et al. [20] reported surface pH around 8.5 for feedlots in Kansas, Cole et al. [21] report a yearly average surface pH of 7.7 for feedyards in Texas, and Cole and Todd [22] observed an annual mean pH of 7.89 from air-dried manure from Texas feedlots. Working in Nebraska, Gilbertson et al. [23] reported average pH of 7.6 and 6.6 for two different stocking densities. Measured pH in this study are generally lower than other published results (but not without precedent) and did not approach the low pH range that would inhibit volatilization.
Besides pH differences mentioned above, there were no significant differences among treatments for any of the pen surface chemical properties for any of the sampling dates. Organic N accounted for nearly 85% of total N, followed by ammonium; nitrate levels were below detection for all treatments and sampling dates (Table 1). Because there were not differences in sample chemical properties among treatments, data were pooled and compared among sampling dates (data not shown). Pen surface chemical nutrient concentrations were much lower overall (p < 0.001) on the third sampling date (trial day 148) for Total N, Organic N, Total P, and Organic Matter (%). When all treatments were pooled, the one surface chemical property that did not follow this pattern was pen surface ammonium, which remained relatively constant across all sampling dates. This may indicate that during cool weather when volatilization is limited by temperature, ammonium occupies a relatively stable proportion of exchange sites. Vaillant et al. [20] sampled pen surfaces at four different feedlots in Kansas, organic N ranged from 500–22,000 mg·kg−1. Of the eighteen pens samples, surface organic N values were below about 5000 mg·kg−1 in only one pen and were much more frequently in the range reported in this study.
Cole et al. [21] measured pen surface chemical characteristics at three feedlots in Texas in all four seasons. Taking an average of spring (April) and winter (December) values, they reported Total N values 1.5–2 times higher than reported in this study, about 27,500 mg·kg−1; however, they reported an average of 2600 mg·kg−1 NH4-N, which is similar to overall mean of 2204 ± 589 mg·kg−1 in this study. Vaillant et al. [20] reported a range 375–8000 mg·kg−1 ammonium in the top 10-cm surface layer at Kansas feedyards. In Texas feedyards, N:P was calculated as 3.78 in the spring and 4.53 in the winter, much higher than values reported in this study, which were all near 1.00, regardless of treatment or sampling date [21]. It is possible that the much higher Total N and N:P ratio in Cole et al. [24] reflect the higher crude protein content of the diets (reported only as 13–14.5% overall), while the similarities in surface ammonium reflects the rapid kinetics of the physicochemical processes of urea hydrolysis.
The organic matter component of samples in this study was 26–38% (Table 1), similar to values reported for manure harvested from feedlot pens [5]. Adams et al. [25] measured organic matter content of pen surface manure in three trials examining effect of OM additions. For Control treatments (without OM additions) they reported OM content of 18.8, 23.5 and 27.8%. For three different diet treatments, Bierman et al. [26] reported OM content of 28–35% in manure removed from the pen surface.
Initial moisture content of samples from trial days 45, 92, and 148 was 52.5%, 47.3%, and 42.7% respectively (data not shown). Woodbury et al. [27] reported feedlot surface moisture content of 18.8% to 32.1% for “unconsolidated surface material” and 19.9% to 29.9% for the first 10 cm. Cole et al. [22] reported wintertime water content of a feedlot surface as 12.7% for “loose” surface material and 23.1% for the “dry-pack” layer. Harvested manure from piles that had just been scraped from a pen surface had a moisture content of 28.2% in the winter/spring [5]. Moisture content for this study was higher than other values reported in the literature and likely influenced ammonia flux temporal dynamics.
3.2. Ammonia Flux
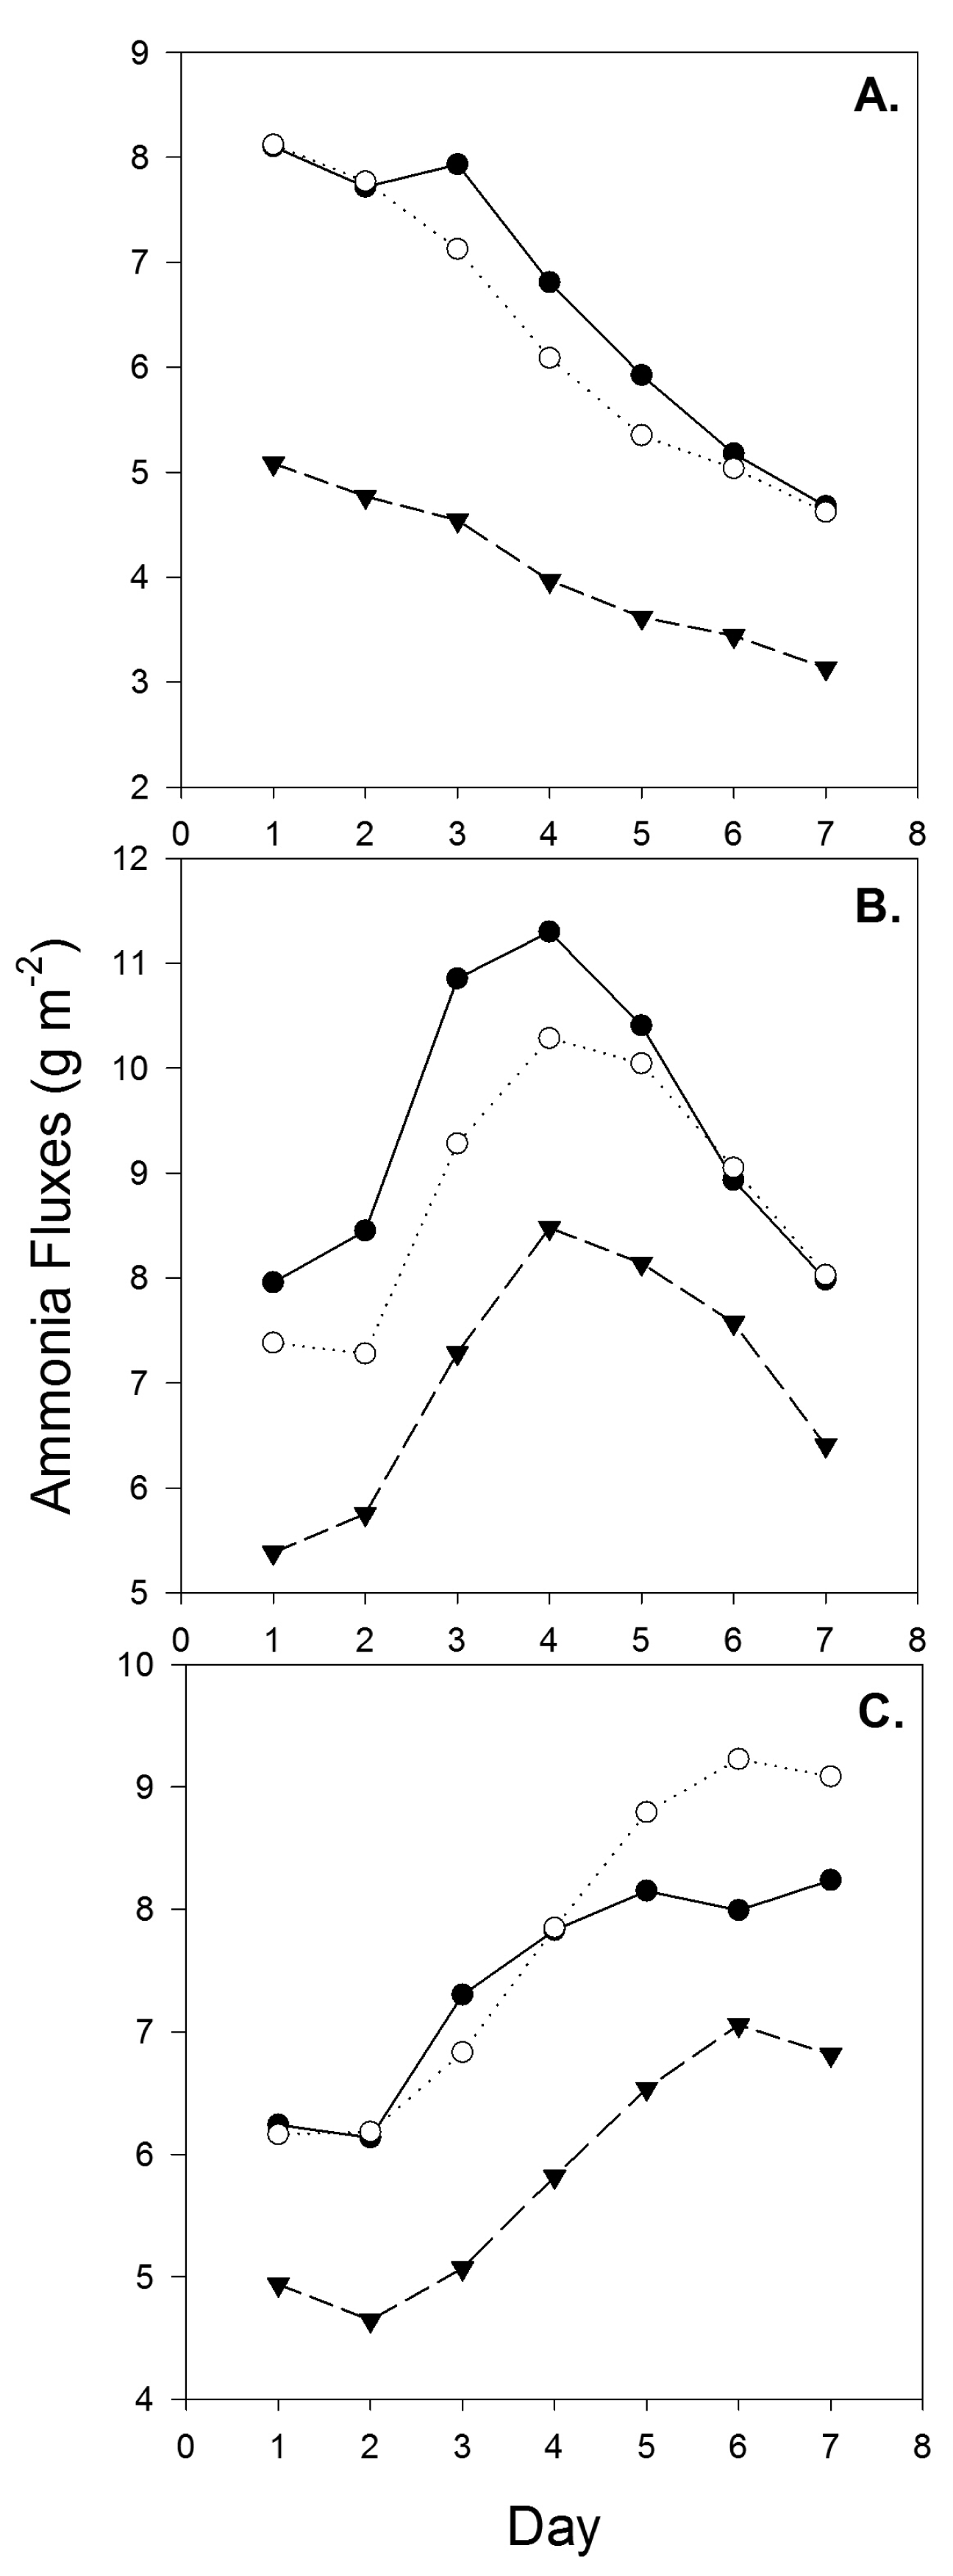
Daily ammonia flux dynamics for each set of samples through the ammonia flux chamber system are shown in Figure 2. Ammonia volatilization was influenced by the sample's initial water content and evaporative water loss throughout the course of the chamber study, so the temporal patterns showed different trends for the three sampling dates. The 2009–2010 winter around Lamar, CO was unusually wet and all sampling dates reported here exhibited “sloppy”, wet conditions. Samples were loaded into the chambers with very high initial moisture content (e.g., 50%) which likely contributed the varied patterns. In previous studies with mostly dry samples, trends in ammonia flux exhibited an exponential or linear decrease over time with very high fluxes on the first day (Figure 3). Data in Figure 3 were taken from intact cores collected urine patches at a commercial feedlot in northern Colorado during the summer. The exponential decline in flux with time seen in Figure 3 is consistent with other feedlot ammonia measurements observed from drier cores using the chamber system. Thus, the somewhat unsual patterns observed in Figure 2B,C is probably unique to wet cores. The high water content probably initially limited near surface vertical NH3 diffusion, and, later, contributed to the formation of cracks when drying, which compromise the integrity of the surface crust and reduce resistance to mass transfer. The physical properties of the pen surface likely changed over the course of the study as hoof action continued to mix and stir the accumulated manure under the wet conditions. Deep cracks and shrinkage were observed on the cores during the chamber tests which exposed more area to the air and affected fluxes. Thus, the temporal dynamics of drying and cracking likely contributed to increases in flux over time seen for samples collected on Day 148 and the convex pattern observed for the Day 92 samples.
Ammonia flux from the Reduced N treatment was significantly lower than that from the Control and Oscillating treatments on two of the three sampling dates. For samples collected on day 45, the Reduced N treatment had significantly lower N loss than the Control treatment (p = 0.0018) and the Oscillating treatment (p = 0.0122). Average flux for the three treatments—Control, Oscillating N, and Reduced N—was 7.13, 6.21, and 3.72 g NH3 m−2·day−1 respectively, and peak daily flux occurred on the first day of the 7 day incubation for all three treatments (Table 2, Figure 2A). The Reduced N treatment was significantly lower for all the intervals evaluated (i.e., Day 1, Day 2–3 and Day 4–7).
For day 92 samples, the results are similar, with the Reduced N diet showing significantly lower emissions than the Control diet (p = 0.0155) and the Oscillating N diet (p = 0.0932). There was also significant difference between the control and the Oscillating N diet, the only time this difference was observed. Average daily fluxes were 9.41, 8.74, and 7.02 g NH3 m−2·day−1 for the Control, Oscillating N, and Reduced N diets; respectively. Peak daily emissions occurred on day 4 for all treatments (Table 2, Figure 2B). The interval analysis showed that differences tended to be more significant during the beginning of the seven-day test (Day 1 and Day 2–3) when the cores were most representative of the pen surface at the time of sampling. As the cores dried, surface cracking likely added extraneous variance that moderated statistical differences among treatments.
On trial day 148, trends were similar but there were not significant differences among diets. The average daily flux for the Control diet was 7.22 g NH3 m−2·day−1. Average daily emission for the Oscillating N diet was 7.43 g NH3 m−2·day−1. Average daily emission for the Reduced N diet was 6.27 g NH3 m−2·day−1. The Oscillating N and Reduced N diets peaked on the sixth day of measurement while the control diet peaked on the seventh (last) day. It is possible that the control treatment samples actually exhibited peak fluxes after our seven day measurement timeframe (Table 2, Figure 2C). There were no differences for any of the sub-intervals, which likely resulted from slightly higher variance among cores on this sampling date.
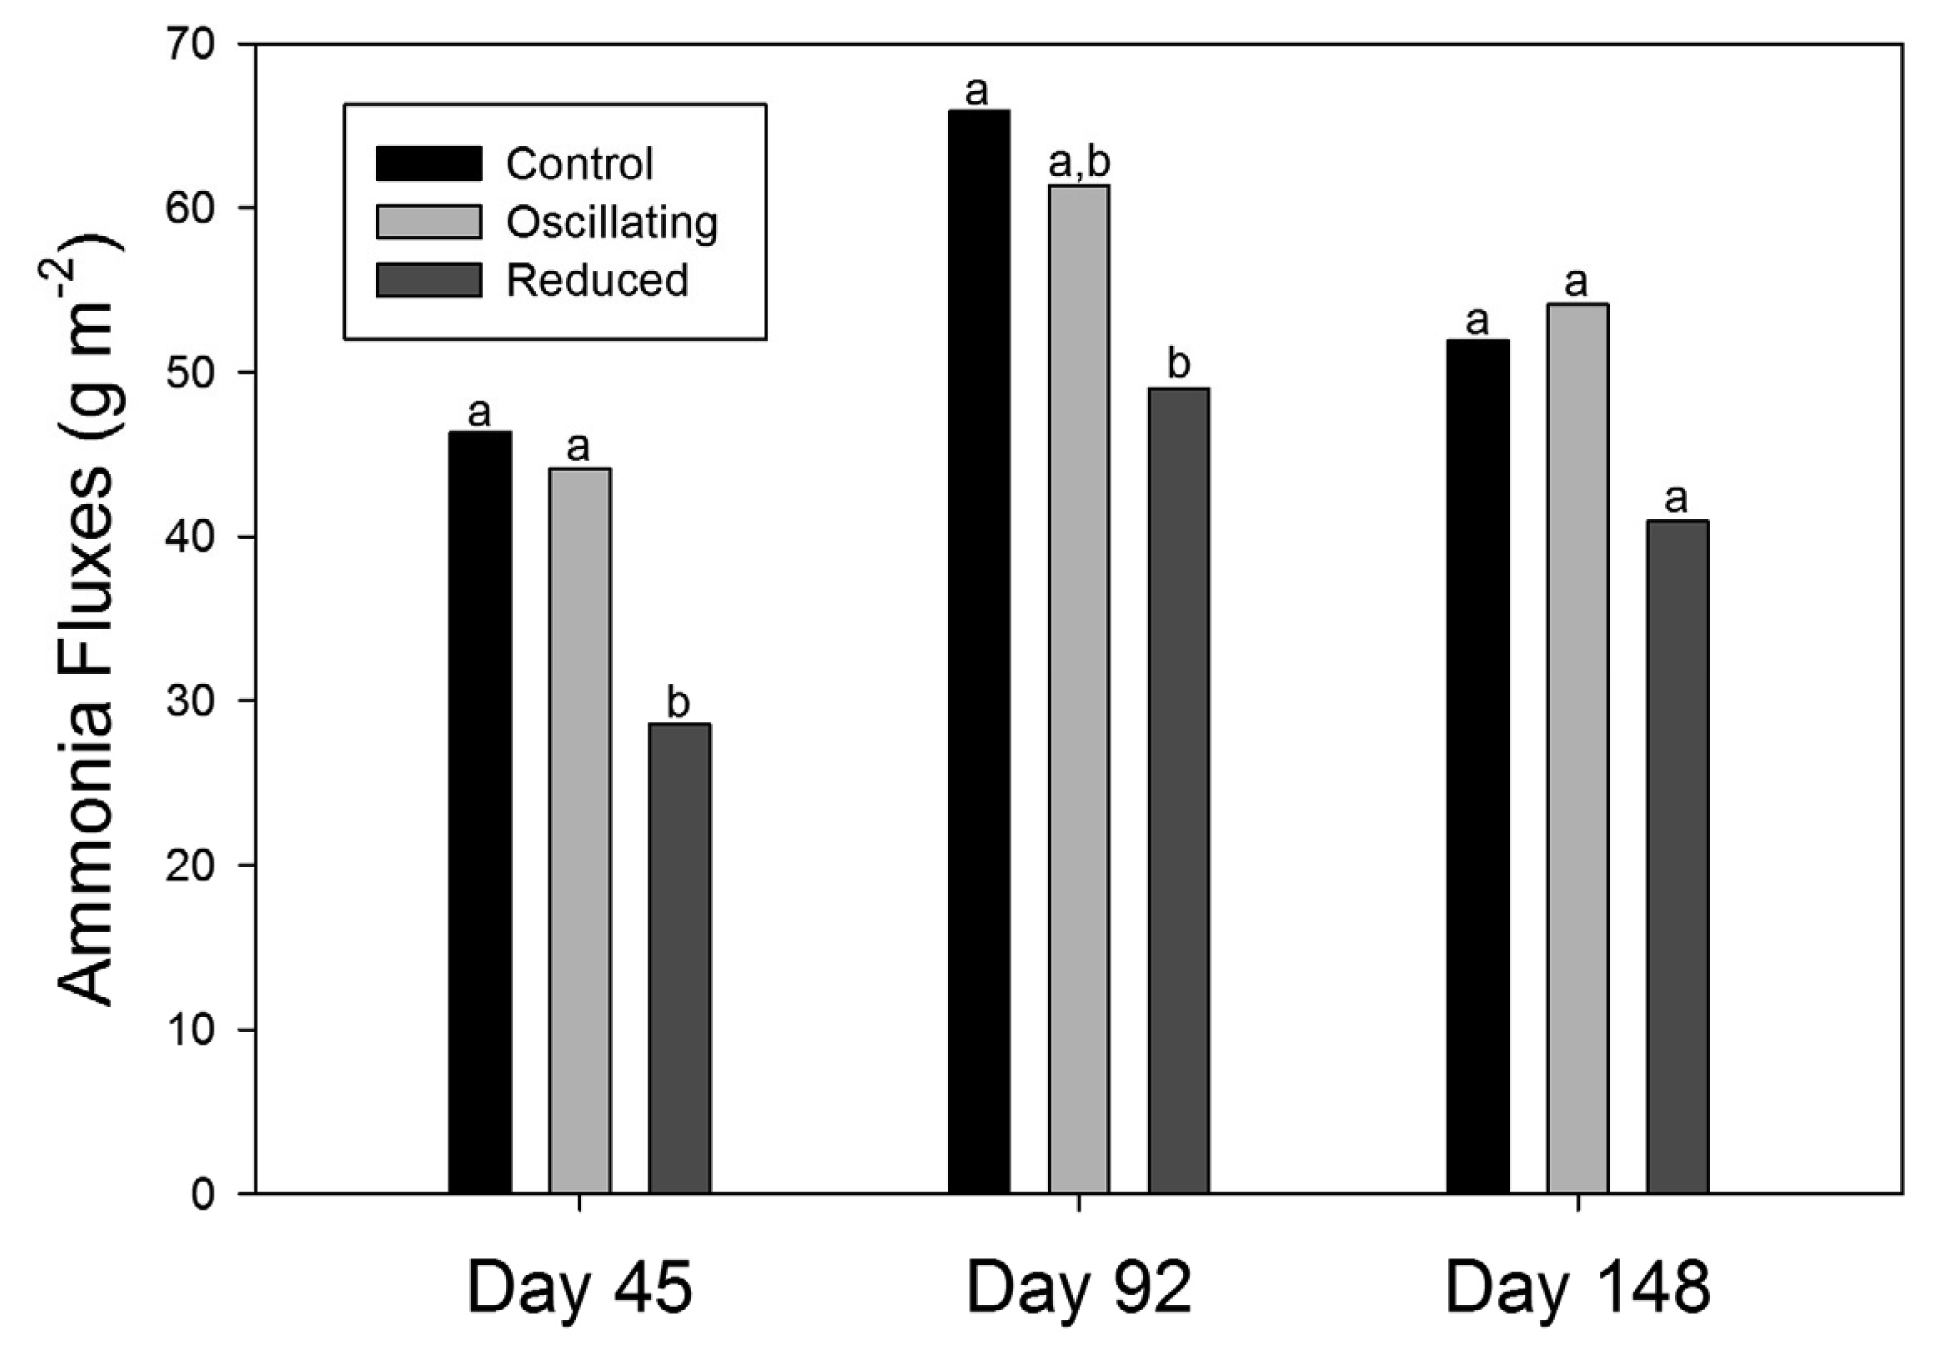
Regardless of the patterns observed during the chamber tests, cumulative fluxes from the Reduced N treatment were 40% and 25% lower than the Control for Day 45 and Day 92, respectively (Figure 4). As mentioned, there were no significant differences on the last sampling date, but the absolute reduction between the Control and Reduced N treatments was 21%. Thus, the Reduced N diet seemed to have a greater effect on NH3 fluxes early in the feeding cycle and then moderate over time. This trend is could be the result of larger differences in pen-surface ammonical N early in the feeding cycle. Cattle retain a larger portion of fed N early in a feeding cycle which may have influenced the proportional difference in excreted N among treatments. However, there is no direct evidence of changes in pen surface NH4+ over time (Table 1). Unfortunately, the chemistry of the 5-cm deep cores (i.e., Table 1) may not be equivalent to that at the aqueous-air interface where NH3 volatilization occurred. The inability to measure differences in N content among treatments may have been the result of sampling too deep. Future studies may want to include very shallow sampling in the top few millimeters of the pen surface.
Cumulative reductions in fluxes reported here for the Reduced N diet for Day 92 and Day 148 were similar to values reported from composited surface samples and simulated feedlot surfaces at the end of the feeding cycle by Todd et al. [15] and Cole et al. [8]. Day 45 reductions were higher than previously reported, but as mentioned, the effect seems to be more pronounced earlier in the feeding cycle. Differences between the Control and Oscillating N diets were not observed. Archibeque et al. [16] measured a significant 66% reduction of in vitro ammonia volatilization from fresh composite manure and urine samples from an oscillating CP treatment compared to a high CP treatment with no reduction in animal performance [28]. Archibeque et al. [16] studied an oscillating treatment that averaged 11.5% CP, and found no difference in the volatilization of ammonia or animal performance between the oscillating treatment and a moderate CP treatment with a constant 11.8% CP. In addition, the timing and the magnitude of the oscillation was considerably different, switching from 9.1% CP to 13.9% CP on a predictable 48 h rotation [16]. The current study fed an 11.62% CP diet every Wednesday, Thursday, and Saturday and a 13.5% CP diet the remaining days of the week. This timing scheme was chosen to make the feeding scheme more practical for a commercial operation, but this could have negated the proposed N recycling benefits of oscillating CP by making the oscillation period irregular, thus making it difficult for the animal to adapt physiologically [29,30].
3.3. Excreted Nitrogen
Animal N retention and excretion was calculated as part of the feeding trial, providing an opportunity to compare the measurements from the laboratory chamber system against another method of estimating N loss (Table 2). For the Control treatment, 160 g NH3 head−1·day−1 were excreted to the pen surface. For the Oscillating N and Reduced N treatments 148.5 and 131.7 g NH3 head−1·day−1 were excreted respectively. N excreted as feces remained constant across the treatments, but N excreted as urine was significantly (p < 0001) lower for the reduced and the oscillating treatments. Reduced excretion of urine-N instead of fecal-N is a reflection of increased urea recycling in the rumen in response to lower crude protein diets and is expected based on cattle physiology [2,3]. In an extensive mass balance study of several commercial feedlots in Nebraska, Kissinger et al. [31] reported that 62% of all excreted N is volatilized as ammonia. If 62% of N excretion calculated in Table 3 were volatilized the estimate for ammonia loss would be 8.3 g NH3 m−2·day−1 from the Control pens, 7.7 g NH3 m−2·day−1 from the Oscillating N pens, and 6.83 g NH3 m−2·day−1 from the Reduced N pens. These values fall within the ranges measured using the chamber system with the exception of the Reduced treatment. Kissinger et al. [5] fed a diet with 14.3% CP. It is possible that because the volatilization mechanism depends partially on an ample supply of ammonium ions to drive the equilibrium towards ammonia, and on concentration gradients to move the ammonia to the surface layers from which volatilization occurs, the input of 11.62% CP into the system may not be great enough to drive volatilization at as great a rate as observed by Kissinger et al. [5].
Cole et al. [8] showed similar N loss reductions with no impact on animal performance, however studies with similar dietary CP reductions have shown reductions in animal performance metrics [32]. Any ammonia volatilization strategy that negatively impacts animal performance will not be a practical N loss reduction strategy for feedlot operators. Ability to maintain animal performance levels at a reduced dietary CP should be investigated further at larger scales as part of commercial feedlot trials.
4. Conclusions
Reducing CP from 13.5% to 11.62% caused a 21% to 40% reduction in NH3 fluxes under the conditions tested. This measured reduction corresponds to calculated reductions in excreted nitrogen, particularly urinary N from cattle receiving the reduced N diet. Altering cattle finishing diets to eliminate N content that exceeds the cattle's nutritional requirements for maximum growth provides an opportunity to reduce overall nitrogen losses to the atmosphere. More research is needed at commercial scales (i.e., full-sized feedlot pens) to determine if reductions in NH3 emissions can be sustained with lower CP diets without affecting rate of gain and feed conversion in feedlot cattle.


| Treatment 1 | Total N | Org N | NH4+-N | P2O5-P | N:P | pH initial | pH final | OM (%) |
|---|---|---|---|---|---|---|---|---|
| Trial Day 45 | ||||||||
| Control | 15.9 ± 2.96 | 13.8 ± 2.52 | 2.08 ± 0.46 | 14.98 ± 2.49 | 1.06 ± 0.10 | 7.80 ± 0.14 a | 7.83 ± 0.12 a | 37.4 ± 7.3 |
| Oscillating | 15.8 ± 1.94 | 13.7 ± 1.42 | 2.05 ± 0.57 | 14.70 ± 2.33 | 1.01 ± 0.11 | 7.83 ± 0.14 a | 7.89 ± 0.20 a | 36.6 ± 5.5 |
| Reduced | 14.2 ± 1.57 | 12.5 ± 1.48 | 1.66 ± 0.23 | 13.50 ± 1.62 | 1.05 ± 0.05 | 7.52 ± 0.35 b | 7.64 ± 0.25 b | 35.6 ± 4.5 |
| Trial Day 92 | ||||||||
| Control | 15.7 ± 3.12 | 13.2 ± 2.63 | 2.55 ± 0.49 | 15.33 ± 2.42 | 1.03 ± 0.05 | 7.48 ± 0.23 | 7.44 ± 0.28 | 38.3 ± 6.4 |
| Oscillating | 15.4 ± 4.11 | 12.8 ± 2.93 | 2.55 ± 0.12 | 13.58 ± 3.30 | 1.13 ± 0.11 | 7.43 ± 0.32 | 7.50 ± 0.36 | 37.2 ± 8.9 |
| Reduced | 15.7 ± 2.38 | 13.4 ± 1.92 | 2.26 ± 0.51 | 14.88 ± 1.78 | 1.06 ± 0.05 | 7.41 ± 0.30 | 7.53 ± 0.31 | 38.3 ± 3.4 |
| Trial Day 148 | ||||||||
| Control | 12.01 ± 3.53 | 9.68 ± 3.16 | 2.36 ± 0.60 | 11.03 ± 3.66 | 1.11 ± 0.11 | 7.30 ± 0.20 x | 6.97 ± 0.42 y | 27.7 ± 9.1 |
| Oscillating | 10.8 ± 1.00 | 8.75 ± 0.98 | 2.04 ± 0.39 | 10.04 ± 1.19 | 1.08 ± 0.08 | 7.27 ± 0.14 x | 6.89 ± 0.30 y | 25.7 ± 3.4 |
| Reduced | 11.7 ± 3.24 | 9.36 ± 2.97 | 2.28 ± 0.37 | 10.95 ± 2.84 | 1.06 ± 0.06 | 7.17 ± 0.19 x | 6.96 ± 0.29 y | 28.5 ± 7.9 |
1Treatments: Control: 13.5% CP; Oscillating: 13.5% CP fed 4 days/week and 11.62% CP fed 3 days/week; Reduced: 11.62% CP;a,bIndicate statistical difference among treatments (α = 0.05);x,yIndicate statistical difference of sample pH before (pH initial) and after (pH final) incubation in laboratory chambers (α = 0.05). Nitrate N was below level of detection.
| Interval | Treatment 1 | ||
|---|---|---|---|
| Control | Oscillating | Reduced | |
| Trial Day 45 | |||
| Day 1 | 8.50 a | 8.17 a | 4.64 b |
| Days 2–3 | 8.40 a | 7.27 a | 4.25 b |
| Days 4–7 | 6.16 a | 5.16 a | 3.24 b |
| Overall | 7.13 a | 6.21 a | 3.72 b |
| Trial Day 92 | |||
| Day 1 | 8.11 a | 7.40 a,b | 5.21 b |
| Days 2–3 | 9.52 a | 8.66 a,b | 6.27 b |
| Days 4–7 | 9.68 a | 9.22 a | 7.72 a |
| Overall | 9.41 a | 8.74 b | 7.02 c |
| Trial Day 148 | |||
| Day 1 | 6.20 | 6.14 | 5.00 |
| Days 2–3 | 6.58 | 6.21 | 5.29 |
| Days 4–7 | 7.85 | 8.49 | 7.00 |
| Overall | 7.22 | 7.43 | 6.27 |
1Treatments: Control: 13.5% CP; Oscillating N: 13.5% CP fed 4 days/week and 11.62% CP fed 3 days/week; Reduced N: 11.62% CP.a–cLeast squares means within a row without a common superscript differ (p < 0.10).
| Treatments | |||
|---|---|---|---|
| Item | Control | Oscillating | Reduced |
| N retention (g) | 23 | 23.3 | 23.1 |
| N excretion (g) | 160 | 148.5 | 131.7 |
| Feces (g) | 32.1 | 37.4 | 37.1 |
| Urine (g) | 127.8 | 111.2 | 94.4 |
Acknowledgments
This project was partially supported by Agriculture and Food Research Initiative Competitive Grant No. 2010-65112-20508 from the USDA National Institute of Food and Agriculture.
References
- Reynolds, C.K.; Kristensen, N.B. Nitrogen recycling through the gut and the nitrogen economy of ruminants: An asynchronous symbiosis. J. Anim. Sci. 2008, 86, E293–E305. [Google Scholar]
- Stewart, G.S.; Smith, C.P. Urea nitrogen salvage mechanisms and their relevance to ruminants, non-ruminants and man. Nutr. Res. Rev. 2005, 18, 49–62. [Google Scholar]
- Piatkowski, B.; Voigt, J. Studies on the intestinal protein supply in the cow. Arch. Anim. Nutr. 1986, 36, 222–226. [Google Scholar]
- Hristov, A.N.; Hanigan, M.D.; Cole, N.A.; Todd, R.W.; McAllister, T.A.; Ndegwa, P.M.; Rotz, A. Review: ammonia emissions from dairy farms and beef feedlots. Can. J. Anim. Sci. 2011, 91, 1–35. [Google Scholar]
- Kissinger, W.F.; Koelsch, R.K.; Erickson, G.E.; Klopfenstein, T.J. Characteristics of manure harvested from beef cattle feedlots. Appl. Eng. Agric. 2007, 23, 357–365. [Google Scholar]
- Todd, R.W.; Cole, N.A.; Harper, L.A.; Flesch, T.K.; Baek, B.H. Ammonia and gaseous nitrogen emissions from a commercial beef cattle feedyard estimated using the flux-gradient method and N:P ratio analysis. Proccedings of the Symposium on the State of the Science: Animal Manure and Waste Management, San Antonio, TX, USA, 5–7 January 2005; Nowak, P.J., Ed.; National Center for Manure and Animal Waste Management: Raleigh, NC, USA, 2005. [Google Scholar]
- Flesch, T.K.; Wilson, J.D.; Harper, L.A.; Todd, R.W.; Cole, N.A. Determining ammonia emissions from a cattle feedlot with an inverse dispersion technique. Agric. Forest Meteorol. 2007, 144, 139–155. [Google Scholar]
- Cole, N.A.; Defoor, P.J.; Galyean, M.L.; Duff, G.C.; Gleghorn, J.F. Effects of phase-feeding of crude protein on performance, carcass characteristics, serum urea nitrogen concentrations, and manure nitrogen of finishing beef steers. J. Anim. Sci. 2006, 84, 3421–3432. [Google Scholar]
- Todd, R.W.; Cole, N.A.; Clark, R.N.; Flesch, T.K.; Harper, L.A.; Baek, B.H. Ammonia emissions from a beef cattle feedyard on the southern High Plains. Atmos. Environ. 2008, 42, 6797–6805. [Google Scholar]
- Baum, K.A.; Ham, J.M. Adaptation of a speciation sampling cartridge for measuring ammonia flux from cattle feedlots using relaxed eddy accumulation. Atmos. Environ. 2009, 43, 1753–1759. [Google Scholar]
- Staebler, R.M.; McGinn, S.M.; Crenna, B.P.; Flesch, T.K.; Hayden, K.L.; Li, S.M. Three-dimensional characterization of the ammonia plume from a beef cattle feedlot. Atmos. Environ. 2009, 43, 6091–6099. [Google Scholar]
- Erickson, G.E.; Klopfenstein, T.J.; Milton, C.T. Dietary Protein Effects on Nitrogen Excretion and Volatilization from Open-Dirt Feedlots. Proceedings of the 8th International Symposium on Animal Agricultural and Food Processing Wastes, Des Moines, IA, USA, 2000; Moore, J.A., Ed.; ASAE Publications: Des Moines, lA, USA, 2000; pp. 297–304. [Google Scholar]
- Todd, R.W.; Cole, N.A.; Parker, D.B.; Rhoades, M.B.; Casey, K. Effect of Feeding Distillers' Grains on Dietary Crude Progein and Ammonia Emissions from Beef Cattle Feedyards. Proceedings of the Texas Animal Manure Management Issues (TAMMI) Conference, Round Rock, TX, USA; 2009, pp. 37–44. Texas Animal Manure Management Issues (TAMMI) Website. Available online: http://tammi.tamu.edu/index.html (accessed on 11 July 2011). [Google Scholar]
- Cole, N.A.; Clark, R.N.; Todd, R.W.; Richardson, C.R.; Gueye, A.; Greene, L.W.; McBride, K. Influence of dietary crude protein concentration and source on potential ammonia emissions from beef cattle manure. J. Anim. Sci. 2005, 83, 722–731. [Google Scholar]
- Todd, R.W.; Cole, N.A.; Clark, R.N. Reducing crude protein in beef cattle diet reduces ammonia emissions from artificial feedyard surfaces. J. Environ. Qual. 2006, 35, 404–411. [Google Scholar]
- Archibeque, S.L.; Freetly, H.C.; Cole, N.A.; Ferrell, C.L. The influence of oscillating dietary protein concentrations on finishing cattle. II. nutrient retention and ammonia emissions. J. Anim. Sci. 2007, 85, 1496–1503. [Google Scholar]
- NRC. Nutrient Requirements of Dairy Cattle, 7th ed.; National Academies Press: Washington, DC, USA, 2000. [Google Scholar]
- Vaillant, G.C. Nutrient Cycling at Cattle Feedlots: Field and Laboratory Study. M.S. Thesis, Kansas State University, Manhattan, KS, USA, 2007. [Google Scholar]
- Baum, K.A.; Ham, J.M.; Brunsell, N.A.; Coyne, P.I. Surface boundary layer of cattle feedlots: implications for air emissions measurement. Agric. Forest Meteorol. 2008, 148, 1882–1893. [Google Scholar]
- Vaillant, G.C.; Pierzynski, G.M.; Ham, J.M.; DeRouchey, J. Nutrient Accumulation below cattle feedlot pens in Kansas. J. Environ. Qual. 2009, 38, 909–918. [Google Scholar]
- Cole, N.A.; Mason, A.M.; Todd, R.W.; Rhoades, M.; Parker, D.B. Chemical composition of pen surface layers of beef cattle feedyards. Prof. Anim. Sci. 2009, 25, 541–552. [Google Scholar]
- Cole, N.A.; Todd, R.W. Nitrogen and Phosphorus Balance in Beef Cattle Feedyards. Jordan, E., Ed.; Round Rock, TX, USA, 2009; pp. 17–24. Texas Animal Manure Management Issues (TAMMI) Website. Available online: http://tammi.tamu.edu/index.html (accessed on 11 July 2011). [Google Scholar]
- Gilbertson, C.B.; Ellis, J.R.; Nienaber, J.A.; McCalla, T.M.; Klopfenstein, T.J. Properties of manure accumulations from Midwest beef cattle feedlots. Trans. ASAE 1975, 18, 327–330. [Google Scholar]
- Aneja, V.P.; Blunden, J.; James, K.; Schlesinger, W.H.; Knighton, R.; Gilliam, W.; Jennings, G.; Niyogi, D.; Cole, S. Ammonia Assessment from Agriculture: U.S. Status and Needs. J. Environ. Qual. 2008, 37, 515–520. [Google Scholar]
- Adams, J.R.; Farran, T.B.; Erickson, G.E.; Klopfenstein, T.J.; Macken, C.N.; Wilson, C.B. Effect of organic matter addition to the pen surface and pen cleaning frequency on nitrogen mass balance in open feedlots. J. Anim. Sci. 2004, 82, 2153–2163. [Google Scholar]
- Bierman, S.; Erickson, G.E.; Klopfenstein, T.J.; Stock, R.A.; Shain, D.H. Evaluation of nitrogen and organic matter balance in the feedlot as affected by level and source of dietary fiber. J. Anim. Sci. 1999, 77, 1645–1653. [Google Scholar]
- Woodbury, B.L.; Miller, D.N.; Nienaber, J.A.; Eigenbert, R.A. Seasonal and spatial variations of denitrifying enzyme activity in feedlot soil. Trans. ASAE 2001, 44, 1635–1642. [Google Scholar]
- Archibeque, S.L.; Miller, D.N.; Freetly, H.C.; Berry, E.D.; Ferrell, C.L. The influence of oscillating dietary protein concentrations on finishing cattle. I. Feedlot performance and odorous compound production. J. Anim. Sci. 2007, 85, 1487–1495. [Google Scholar]
- Cole, N.A. Nitrogen retention by lambs fed oscillating dietary protein concentrations. J. Anim. Sci. 1999, 77, 215–222. [Google Scholar]
- Cole, N.A.; Todd, R.W. Opportunities to enhance performance and efficiency through nutrient synchrony in concentrate-fed ruminants. J. Anim. Sci. 2008, 86 Suppl., E318–E333. [Google Scholar]
- Kissinger, W.F.; Koelsch, R.K.; Erickson, G.E.; Klopfenstein, T.J. Characteristics of Manure Harvested from Beef Cattle Feedlots. Appl. Eng. Agric. 2007, 23, 357–365. [Google Scholar]
- Gleghorn, J.F.; Elam, N.A.; Galyean, M.L.; Duff, G.C.; Cole, N.A.; Rivera, J.D. Effects of crude protein concentration and degradability on performance, carcass characteristics, and serum urea nitrogen concentrations in finishing beef steers. J. Anim. Sci. 2004, 82, 2705–2717. [Google Scholar]
© 2011 by the authors; licensee MDPI, Basel, Switzerland. This article is an open access article distributed under the terms and conditions of the Creative Commons Attribution license (http://creativecommons.org/licenses/by/3.0/).
Share and Cite
Galles, K.; Ham, J.; Westover, E.; Stratton, J.; Wagner, J.; Engle, T.; Bryant, T.C. Influence of Reduced Nitrogen Diets on Ammonia Emissions from Cattle Feedlot Pens. Atmosphere 2011, 2, 655-670. https://doi.org/10.3390/atmos2040655
Galles K, Ham J, Westover E, Stratton J, Wagner J, Engle T, Bryant TC. Influence of Reduced Nitrogen Diets on Ammonia Emissions from Cattle Feedlot Pens. Atmosphere. 2011; 2(4):655-670. https://doi.org/10.3390/atmos2040655
Chicago/Turabian StyleGalles, Karen, Jay Ham, Elin Westover, Joshua Stratton, John Wagner, Terry Engle, and Tony C. Bryant. 2011. "Influence of Reduced Nitrogen Diets on Ammonia Emissions from Cattle Feedlot Pens" Atmosphere 2, no. 4: 655-670. https://doi.org/10.3390/atmos2040655