4.2. Synoptic Compositions of the Regimes
To describe the synoptic features associated with these different regimes, the strong (weak) cases, which are represented by the most positive (negative) values in the PC modes (
Figure 3), were selected. These most positive (negative) values for the PC time series are the positive (negative) values that are greater (less) than the value that is equal to the absolute maximum (minimum) value and half of the positive (negative) range,
i.e., values above (below) the upper (lower) line in
Figure 3.
The composition of the selected positive (negative) cases represents the strong (weak) synoptic activities that accompany the regimes, similar to the relationship used by [
45].In addition, notably, the surface wind described in the following sections depends on the traditional distribution of the wind around the low- and high-pressure systems in the Northern Hemisphere.
Figure 3.
The time series of the principal components of the EOF analysis for the (a) first EOF mode, (b) second EOF mode, (c) third EOF mode and (d) fourth mode.
Figure 3.
The time series of the principal components of the EOF analysis for the (a) first EOF mode, (b) second EOF mode, (c) third EOF mode and (d) fourth mode.
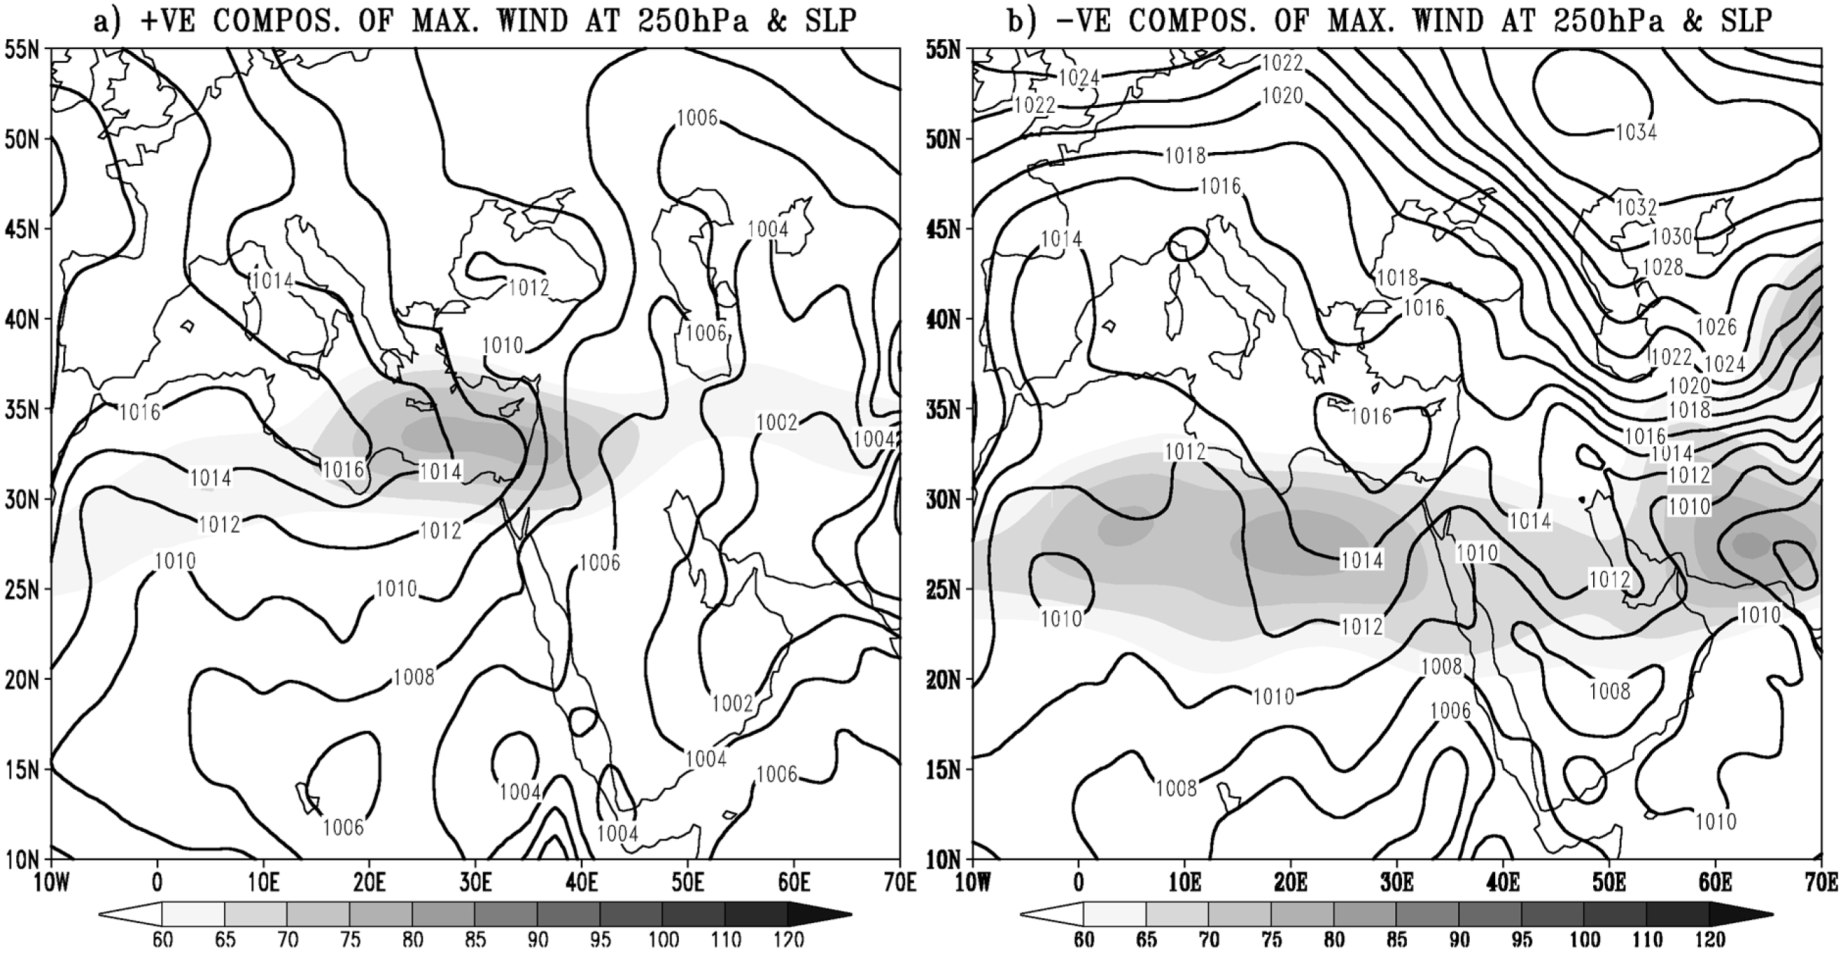
The synoptic features associated with the first regime show that the eastern Arabian Peninsula is affected by a low-pressure system and that the eastern Mediterranean is affected by a high-pressure ridge (which is composed of strong synoptic activity) (
Figure 4a). This situation is similar to the “Shamal dust storms,” which were defined by [
16].
In contrast, for the very weak synoptic activity, the northeastern Arabian Gulf is affected by a high-pressure system, and the northern Arabian Gulf is affected by a small low-pressure system in association with a cell of high pressure located over the eastern Mediterranean(
Figure 4b).
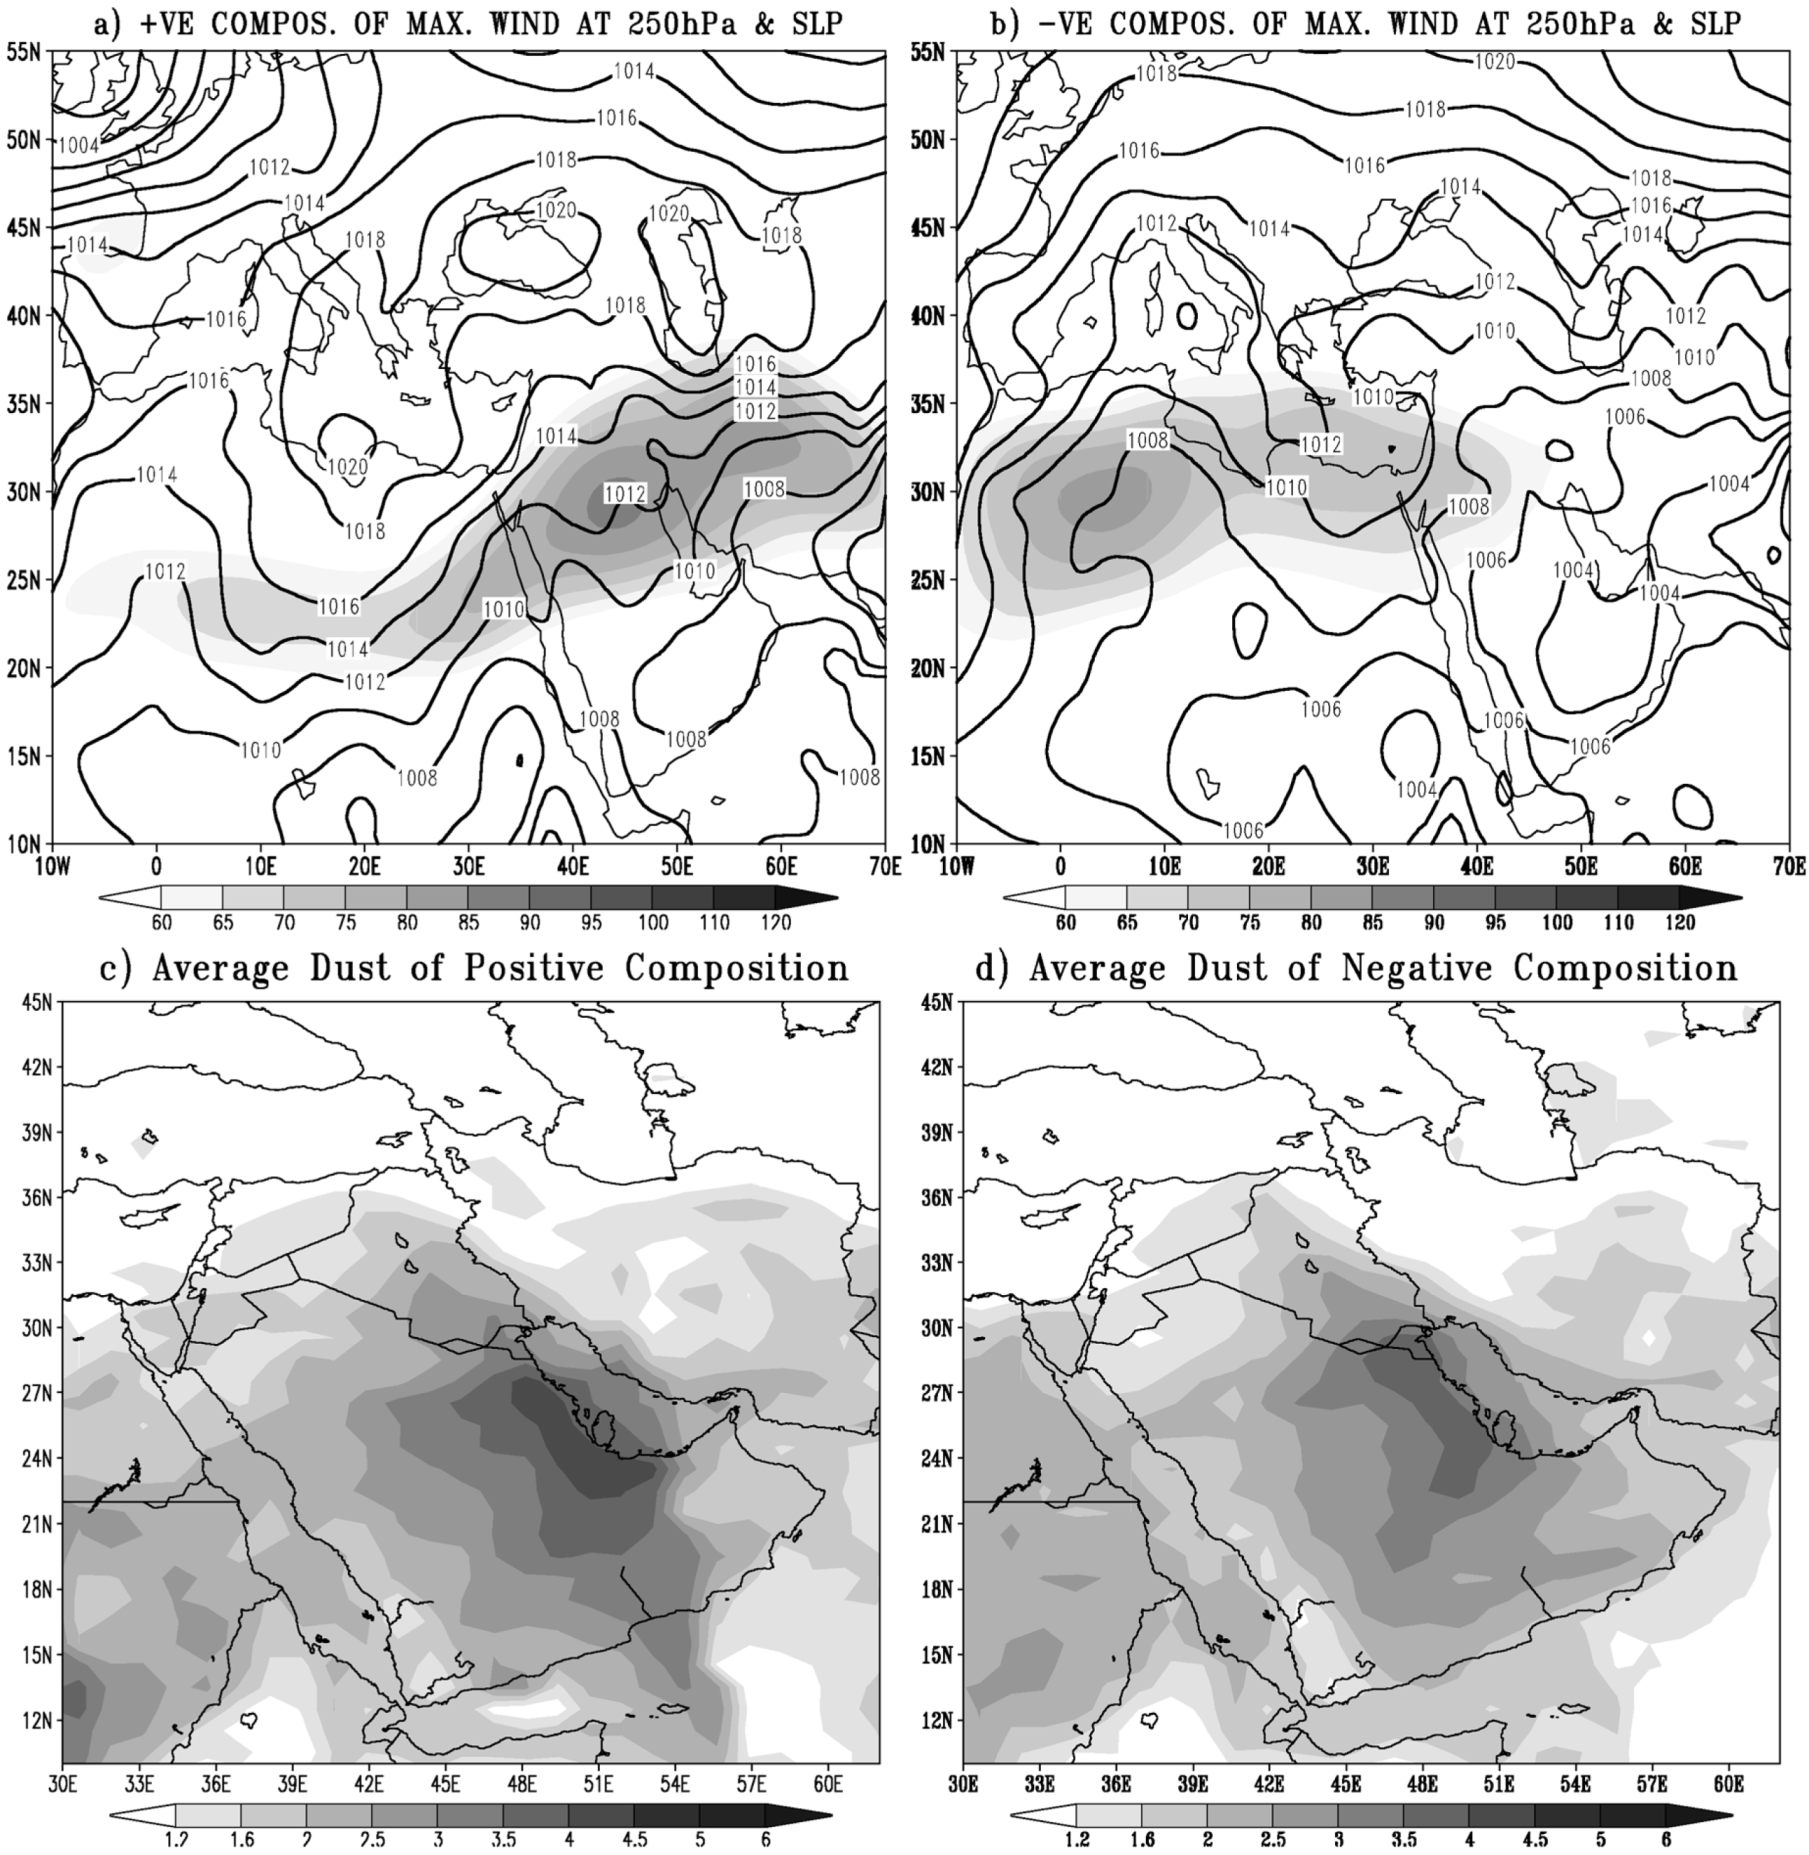
Figure 4.
The distribution of the mean sea level pressure (SLP) (contours) and maximum wind speed at 250 hPa (shaded) for the composition of the first synoptic regime for (a) strong active cases and (b) weak active cases; and the horizontal distribution of the TOMS AI values for the composition of (c) strong active cases and (d) weak active cases.
In addition, the first synoptic feature (
Figure 4a) indicates that the high-pressure ridge located over the Mediterranean interacts with the eastern low-pressure system and produces a pressure gradient over the eastern Arabian Peninsula, which is accompanied by a relatively northerly wind. Moreover, the maximum wind speed of 250 hPa that is associated with this synoptic feature (
Figure 4a) is weaker and shifted to the north compared to the second synoptic feature.
In the second synoptic feature (
Figure 4b), the low-pressure system over the northern Arabian Gulf is located between two high-pressure systems and produces a frontal system (recognized by a regular wind distribution between the pressure systems) that activates the southerly wind over the eastern Arabian Peninsula. In addition, the maximum wind speed at 250 hPa (
Figure 4b) is relatively strong and farther south compared to the first synoptic feature.
The distribution of AI for the dust compositions of the first regime (
Figure 4c,d) indicates that: (1) the maximum core of the AI is to the north for the positive values; (2) AI for the positive composition extends farther to the north than does the negative composition; and (3) there is a pronounced connection between the African dust and the dust over the Arabian Peninsula in the positive composition, although the connection is not as clear in the negative composition.
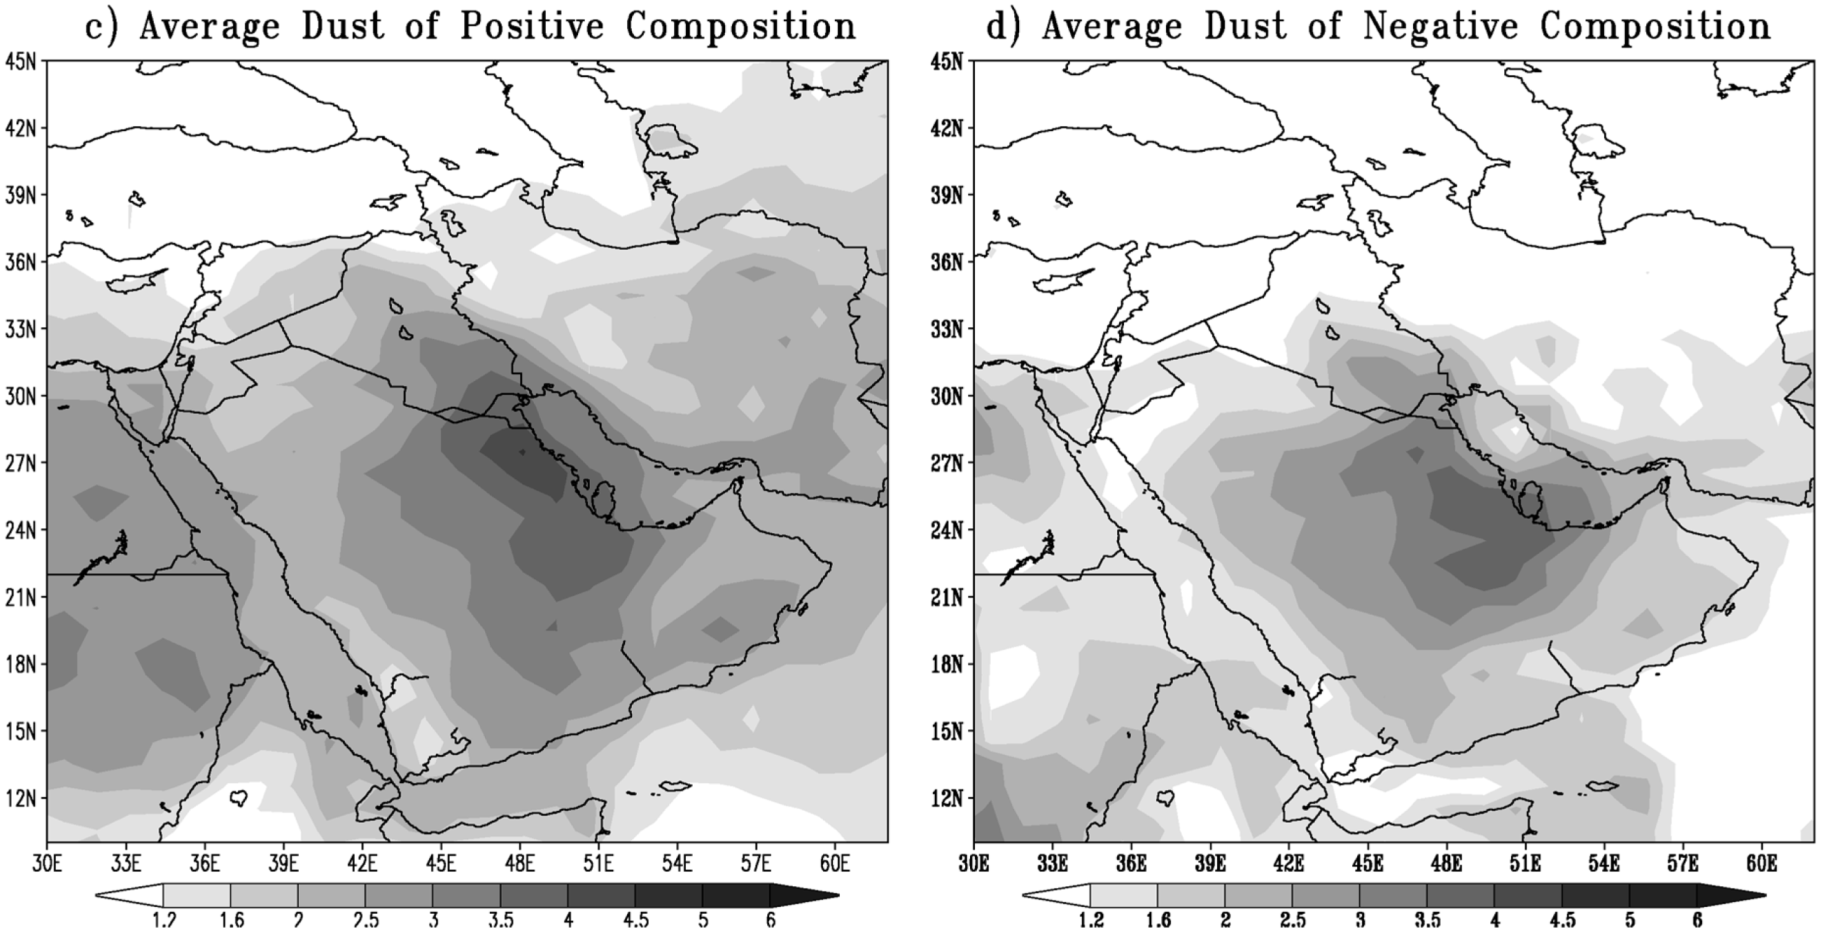
The synoptic features representing the second regime are either a high-pressure system (composition with very strong synoptic activity,
Figure 5a) or a low-pressure system (composition with very weak synoptic activity,
Figure 5b) that affects the western region. In both features, the eastern Mediterranean is affected by the high-pressure ridge in the first composition or by the high-pressure cell in the second composition; in addition, both features indicate that the eastern region is affected by a low-pressure system. The synoptic features of the first composition resembles the Type 1 “Shamal dust storms” described by [
16].
Furthermore, the distribution of synoptic systems in the first synoptic feature produces north-south pressure lines over the northeastern Arabian Peninsula; therefore, the north wind flows over the northeast region of the Arabian Peninsula. However, forthe second synoptic feature, a pressure line extends east to west and is associated with a southwesterly wind over the northeastern Arabian Peninsula.
Figure 5.
The distribution of the mean sea level pressure (SLP) (contours) and maximum wind speed at 250 hPa (shaded) for the composition of the second synoptic regime for (a) strong active cases and (b) weak active cases; and the horizontal distribution of the TOMS AI values for the composition of (c) strong active cases and (d) weak active cases.
Moreover, the maximum wind speed at 250 hPa that is associated with the first synoptic feature is stronger and zonal (
Figure 5a), whereas it is weak and forms a trough structure over the Arabian Peninsula in the second synoptic feature (
Figure 5b). The distribution of the wind at 250 hPa shows that the maximum wind speed in the first synoptic feature is to the south of its position in the second synoptic feature.
In addition, the distribution of AI for the compositions of the second regime (
Figure 5c,d) shows that: (1) the core of maximum values of the AI for the positive composition appear to the south of the core for the negative composition; (2) the AI spreads farther north in the negative composition than in the positive composition; and (3) the connection between the African and Arabian Peninsula dust is more pronounced for the positive composition.
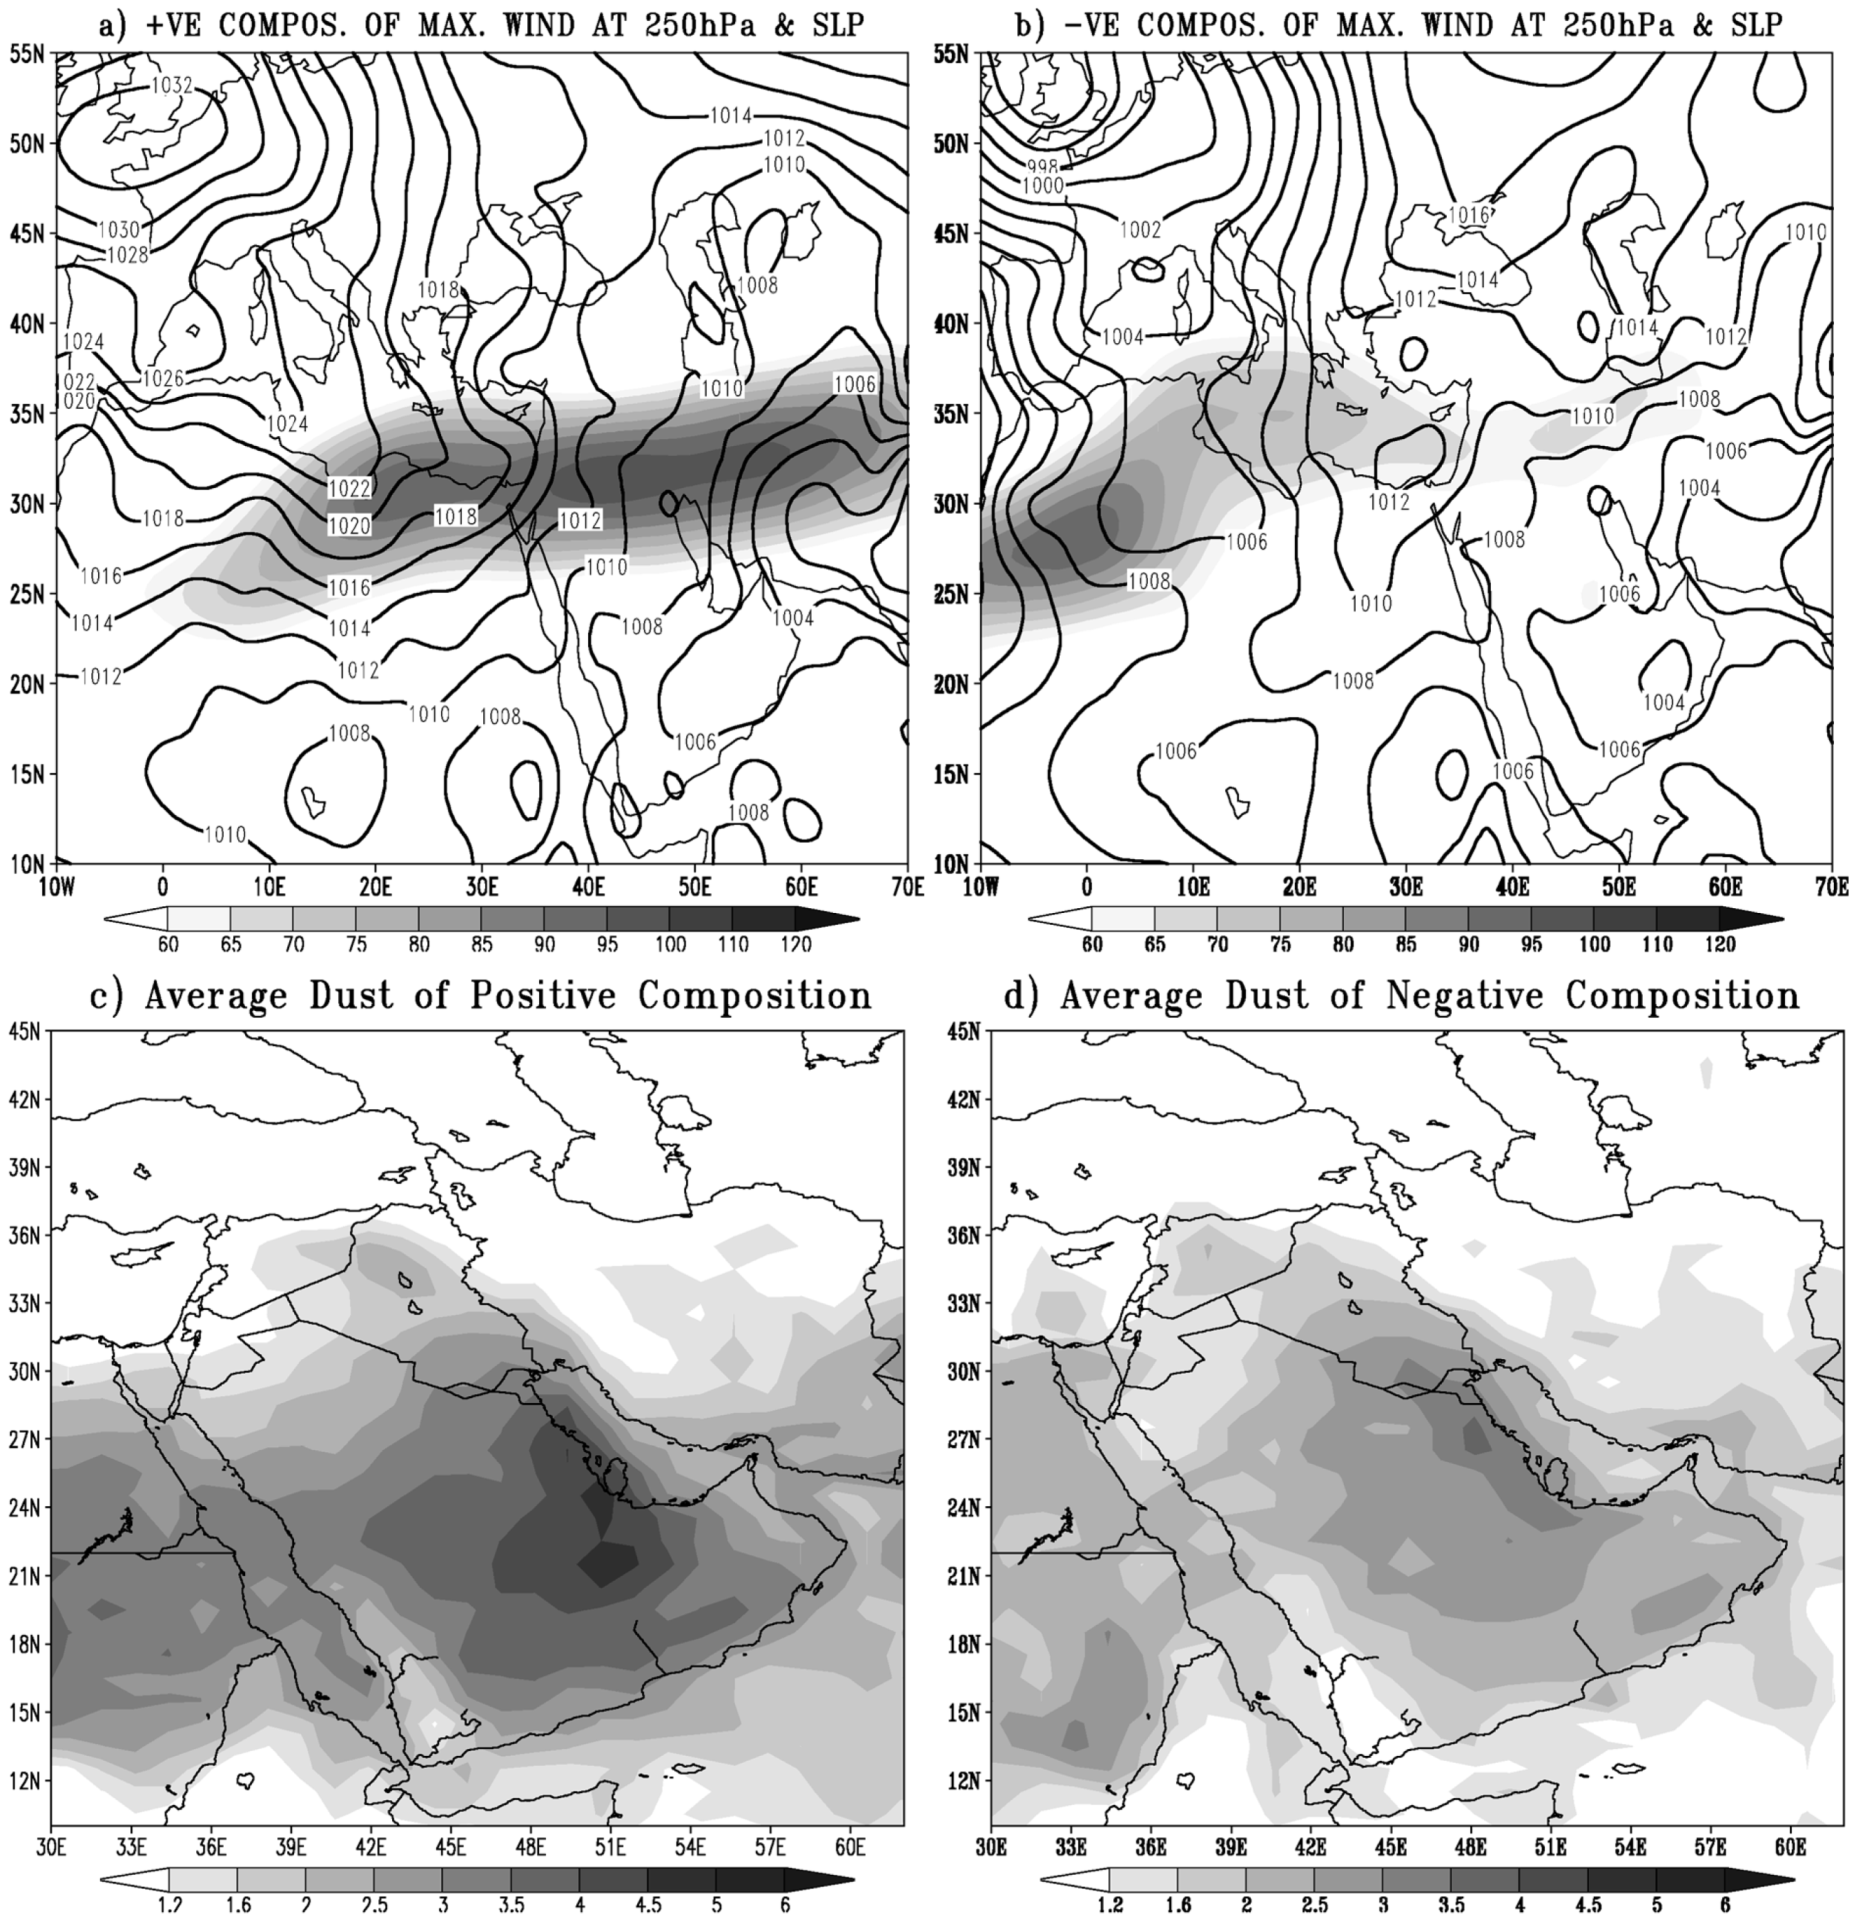
Figure 6.
The distribution of the mean sea level pressure (SLP) (contours) and maximum wind speed at 250 hPa (shaded) for the composition of the third synoptic regime for (a) strong active cases and (b) weak active cases; and the horizontal distribution of the TOMS AI values for the composition of (c) strong active cases and (d) weak active cases.
The synoptic features of the positive representative of the third regime (
Figure 6a) are composed of a belt of high-pressure systems located over the northern regions of the Sahara and the Arabian Peninsula and a belt of low-pressure systems located to the south of this high-pressure belt. The interaction between the high-pressure and low-pressure systems in these belts forms a pressure gradient that covers the northern regions of the Sahara and the Arabian Peninsula. In addition, the pressure lines form short waves over the Arabian Peninsula and a deep ridge over the eastern Arabian Peninsula. This deep ridge produces a northerly wind over the eastern region of the Arabian Peninsula; this type of synoptic feature resembles a merging between Types 1 and 2 of the “Shamal dust storms” described by [
16] and is similar to the second day of the dust event (10–11 March 2009) studied by [
46].
In the negative representative of the third regime (
Figure 6b), there is a high-pressure belt in the north of the region, and the eastern Mediterranean is affected by a high-pressure ridge. In addition, a belt of low-pressure systems is observed in the south of the region, and they contain a cell of low pressure over the northern Arabian Gulf. However, the pressure gradient between the two belts is weak compared with that found for the positive representative, although the existence of a low cell over the northern Arabian Gulf activates the southerly wind over the eastern Arabian Peninsula. These conditions resemble Type 2 of the “Shamal dust storms” and are similar to the first day of the dust event (10–11 March 2009) studied by [
46].
Furthermore, the maximum wind speed at 250 hPa for the positive representative (
Figure 6a) is high in the northern Arabian Peninsula, and the wind is oriented to the northeast. However, for the negative representative (
Figure 6b), the high speed is located over northwestern Africa and it is less than 60 m/s over the northeastern Arabian Peninsula.
In addition, the distribution of AI for the compositions of the third regime (
Figure 6c,d) shows that: (1) the highest value of the AI for the positive composition is to the south of the highest value for the negative composition; and (2) the connection between the African and Arabian Peninsula dusts is relatively high in the positive composition.
For the positive representative of the fourth regime (
Figure 7a), a belt of high-pressure systems affects the northern part of the study region. One cell of this belt is located over the mid-Mediterranean Sea and has a deep ridge that penetrates into the southern Sahara, and a shallow ridge extends toward the southwestern Arabian Peninsula. Another cell from this belt is centered over the Caspian Sea and creates a ridge into the northeastern Arabian Gulf. In addition, there is a belt of low-pressure systems to the south of the high-pressure belt. This belt has deep low pressure over the Middle East, with a main cell that is located over Pakistan and Afghanistan and a secondary cell located over the southern Arabian Peninsula. This type of system resembles a merging of Types 1 and 2 of the “Shamal dust storms” described by [
16].
From the previous relative positions of the belts, the main low-pressure cell that is surrounded by two high-pressure cells produces a deep trough that extends to the northeastern Mediterranean. In addition, the closed ridges and trough produce a northerly wind over the eastern Arabian Peninsula.
However, in the negative representative of the fourth regime (
Figure 7b), the main synoptic patterns are two low-pressure systems: the first is located over the mid-Mediterranean and the second is located over Iran. These two low-pressure systems have a weak high-pressure system squeezed between them that contains a number of high-pressure cells; one of these cells is located over the northern Arabian Gulf. Sequentially, this distribution of pressure systems produces a southerly wind over the eastern Arabian Peninsula.
Moreover, the maximum wind speed at 250 hPa for the positive representative (
Figure 7a) is oriented toward the northeast, and its highest value is located over the eastern Arabian Peninsula. However, the maximum wind speed at 250 hPa for the negative representative (
Figure 7b) is oriented to the southeast over the eastern Arabian Peninsula, and its highest value is located over northern Africa.
Figure 7.
The distribution of the mean sea level pressure (SLP) (contours) and maximum wind speed at 250 hPa (shaded) for the composition of the fourth synoptic regime for (a) strong active cases and (b) weak active cases; and the horizontal distribution of the TOMS AI values for the composition of (c) strong active cases and (d) weak active cases.
In addition, the distribution of AI for the compositions of the fourth regime (
Figure 7c,d) indicates that: (1) for the positive composition, the maximum value of the AI is located north of the position of the negative composition; (2) the AI for the positive composition spreads across a large area and extends farther north than that for the negative composition; and (3) there is a pronounced connection between the African and Arabian Peninsula dusts for the positive composition.
4.3. Case Studies for the Regimes
The case studies for certain regimes are represented by the cases at the time of maximum positive or negative values for their own PC value.
The SLP of the case (29 May 1984) represents the maximum positive PC value for the first regime (shaded
Figure 8a) and shows that the eastern region affected by a low-pressure system has two centers: one is located over northern Iran, and the second is located over the southeastern Arabian Peninsula. However, the western region is affected by a high-pressure system that extends as a ridge to the eastern Mediterranean. The interaction between the two systems produces pressure lines over the eastern Arabian Peninsula that extend from the north to south and a northerly wind that flows over the eastern Arabian Peninsula; in addition, the streamlines of an 850 hPa wind (
Figure 8a) confirm this flow.
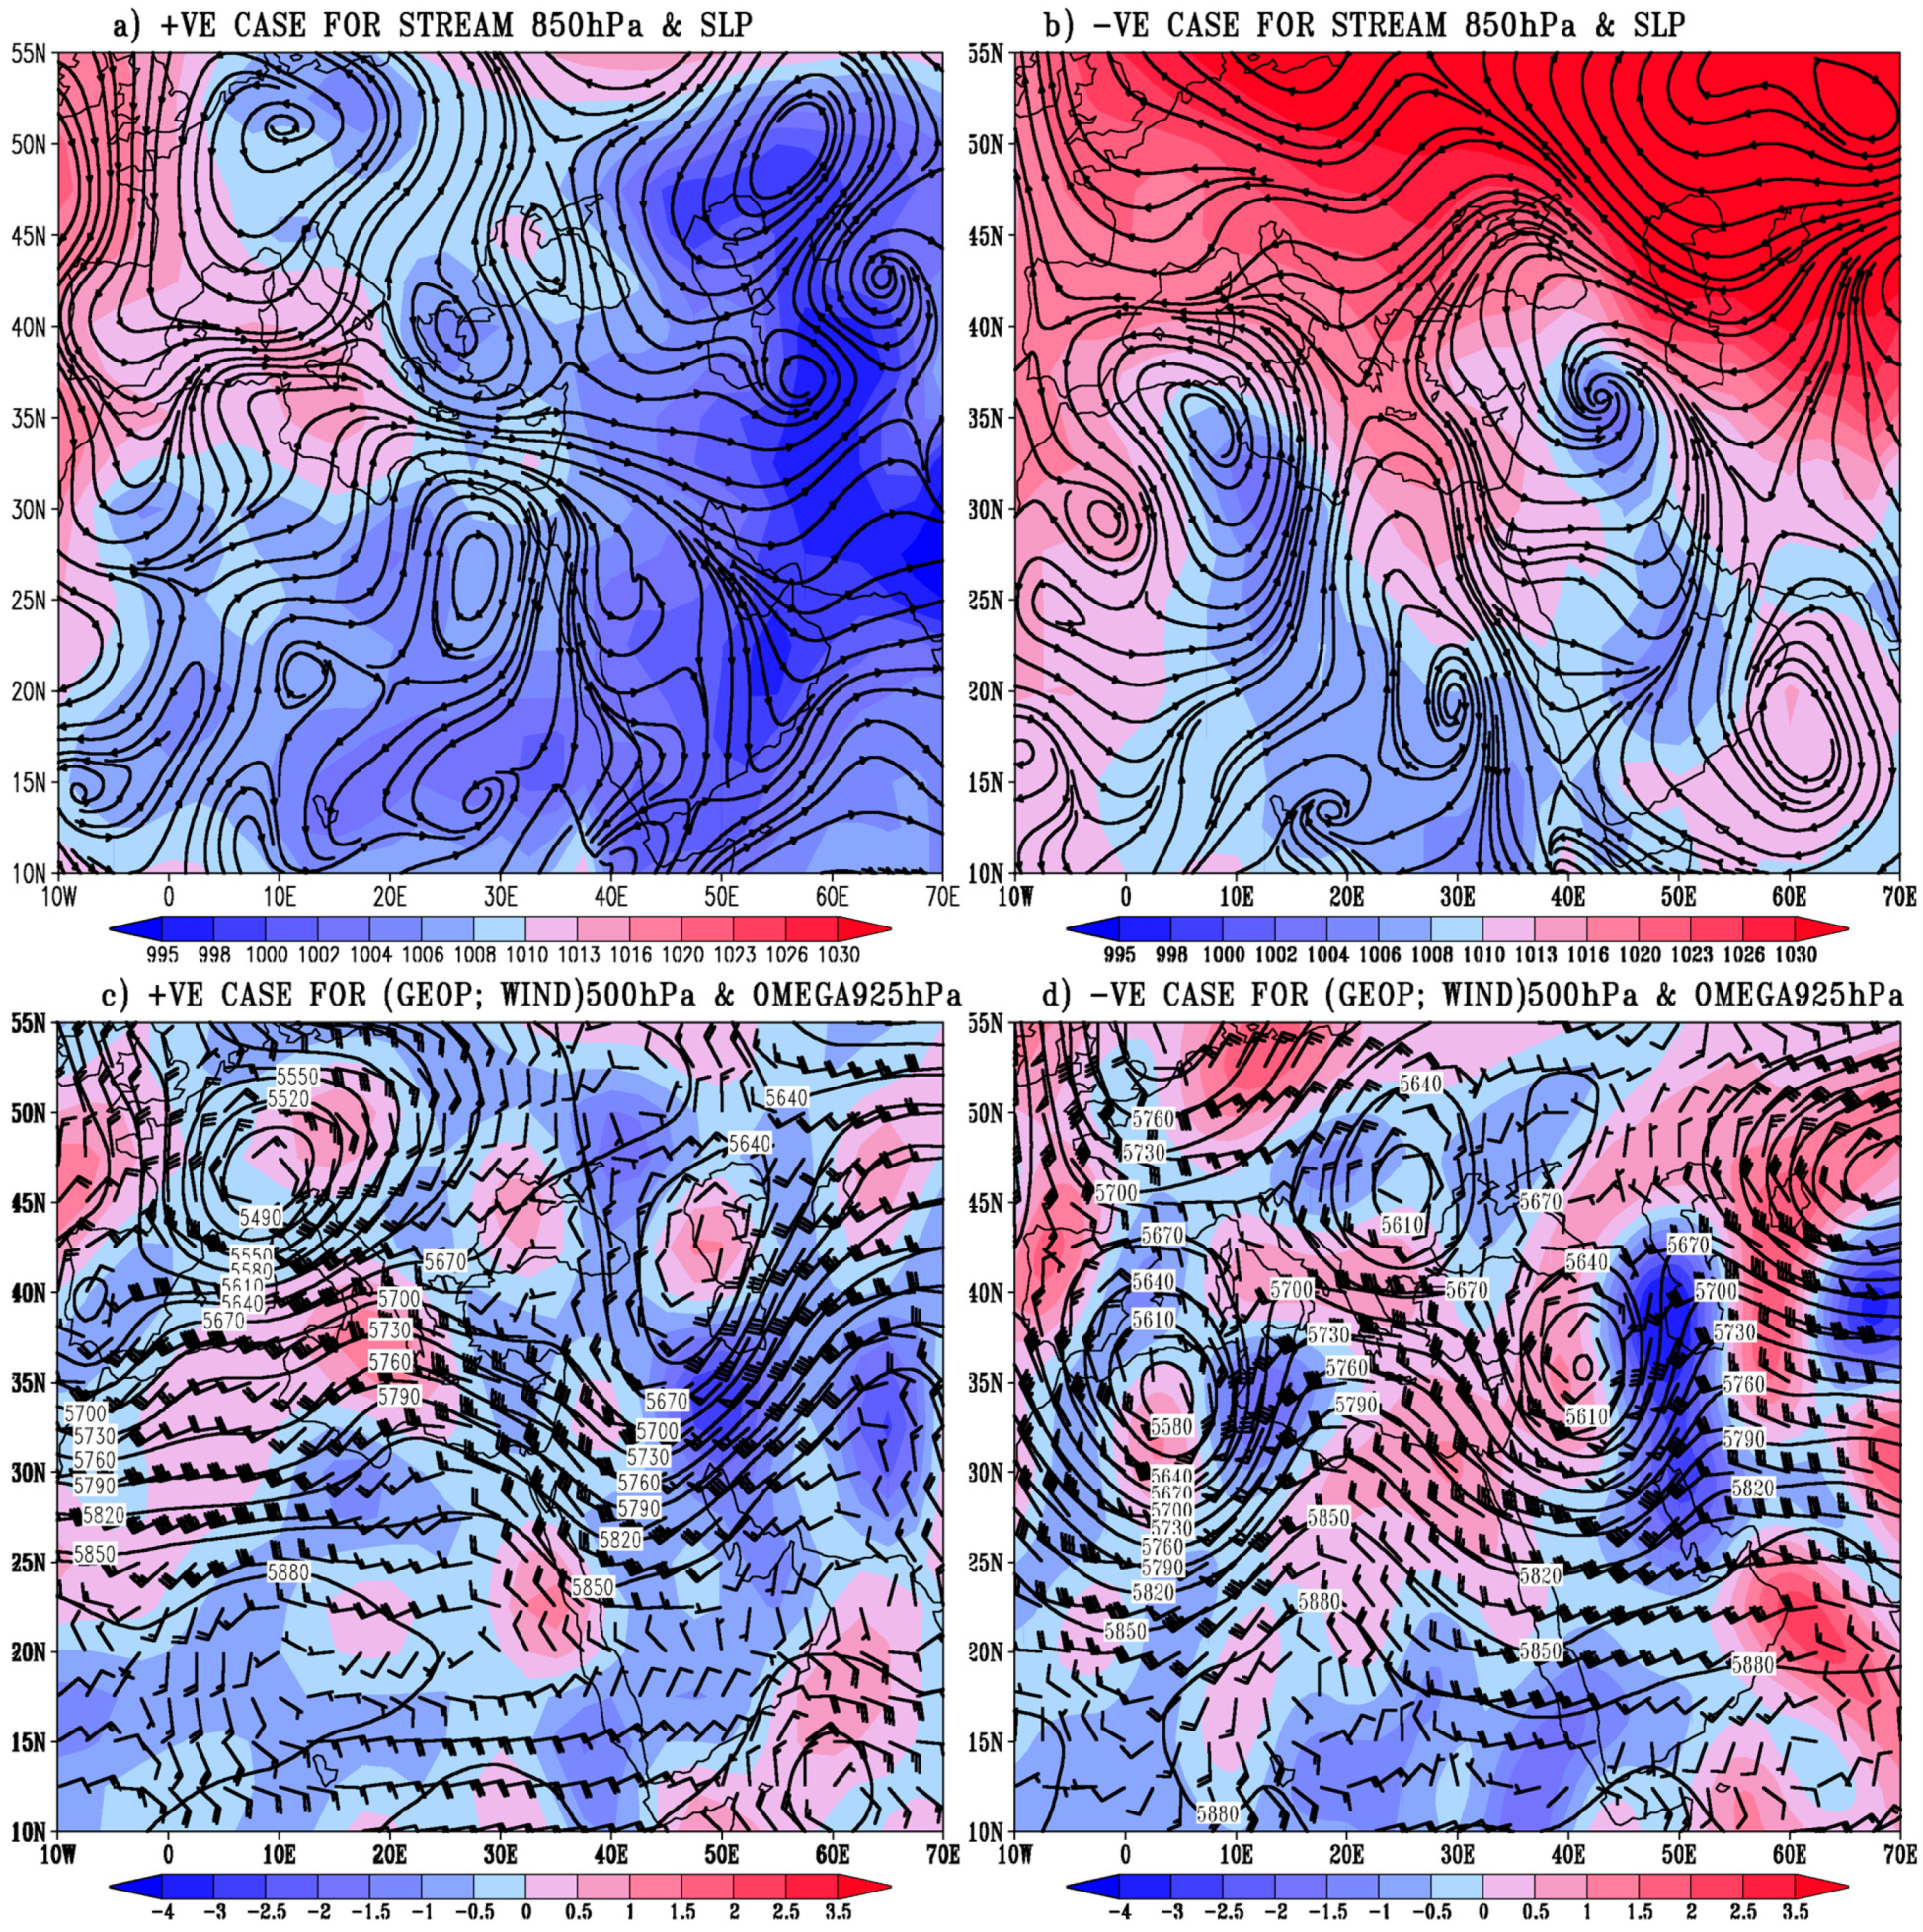
Figure 8.
The distribution of the mean sea level pressure (SLP) (shaded) and streamlines at 850 hPa (contour) for the first synoptic regime for (a) strong active cases and (b) weak active cases; the geopotential height (contours) and wind vectors at 500 hPa (barbs) and the vertical motion at 925 hPa (shaded) for (c) strong active cases and (d) weak active cases; and the horizontal distribution of TOMS AI values for (e) strong active cases and (f) weak active cases.
Furthermore, the previous surface synoptic features are supported by the upper trough at 500 hPa (
Figure 8c), which affects the Arabian Peninsula, and this trough is oriented from northeast to southwest. In addition, the winds on the eastern side of the trough are stronger than the winds on the western side, and the vertical motion at 925 hPa is upward on the eastern side, whereas it subsides on the western side (shaded in
Figure 8c).
For the maximum negative case (16 April 2003) in the first regime, the northern region is influenced by a high-pressure system (shaded in
Figure 8b); however, the effects of this system reach the south of the study region through the extension of two ridges. The first high-pressure ridge passes through the eastern Mediterranean to the south of Sudan, and the second ridge is located in the far-eastern region. These two ridges surround a low-pressure system over the Middle East, and this situation produces a southerly wind over the northeastern Arabian Peninsula that resembles the wind arising from a frontal system. This wind flow is confirmed by the streamlines of the wind at 850 hPa (lines in
Figure 8b).
These surface systems are supported by an upper deep trough at 500 hPa over the Arabian Peninsula (
Figure 8d), which is oriented from the north to south. Moreover, the atmosphere around this trough has two different characteristics: on the eastern side, the winds are stronger, and the vertical motion at 925 hPa is upward (shaded in
Figure 8d); whereas on the western side, the winds are relatively weak, and the vertical motion at 925 hPa subsides.
In addition, over the eastern Arabian Peninsula, a single core of dust in the positive case is noted compared to two cores in the negative case (
Figure 8e,f, respectively). Moreover, there is a pronounced eastward distribution of dust in the positive case.
For the positive case (22 May 1991) in second regime, the western part of the study region is influenced by a strong high-pressure system, whereas the eastern region is influenced by a strong low-pressure system (shaded in
Figure 9a).The eastern Arabian Peninsula is also influenced by the low-pressure systems. This distribution of pressure systems orients the surface wind to become westerly to northwesterly over the eastern Arabian Peninsula, and the streamlines of the wind at 850 hPa (lines in
Figure 9a) appear to confirm the surface wind.
At 500 hPa, the northern Arabian Peninsula is influenced by a cyclonic trough (contours in
Figure 9c) that is oriented from the northeast to southwest. In addition, the winds on the eastern side of the upper trough are stronger and associated with a strong upward motion at 925 hPa (shaded area in
Figure 9c).
Figure 9.
The distribution of the mean sea level pressure (SLP) (shaded) and streamlines at 850 hPa (contour) for the second synoptic regime for (a) strong active cases and (b) weak active cases; the geopotential height (contour) and wind vectors at 500 hPa (barbs) and the vertical motion at 925 hPa (shaded) for (c) strong active cases and (d) weak active cases; and the horizontal distribution of TOMS AI values for (e) strong active cases and (f) weak active cases.
In the negative case (4 May 2004) in the second regime (
Figure 9b), there are two low-pressure systems that influence the study region: one to the far northwest, which is the strongest, and the other to the southeast. These two low-pressure systems surround a high-pressure ridge that extends from the high-pressure system located over the northern Caspian Sea. This distribution of the pressure systems produces a wind over the Arabian Peninsula that resembles the wind distribution around the frontal system. In addition, this wind system is confirmed by the streamlines of the wind at 850 hPa (lines in
Figure 9b).
At 500 hPa (
Figure 9d), the Arabian Peninsula is influenced by a deep cyclonic trough that is oriented from north to south, and the values of the wind do not change around the trough. The vertical motion to the eastern side of this trough at 925 hPa is strongly upward (shaded in
Figure 9d), whereas on the western side of the trough, the vertical motion is weakly upward or subsides.
In addition, it is clear that the positive case has a higher TOMS AI value over the Arabian Peninsula than the negative case (
Figure 9e,f; respectively). Furthermore, the dust distribution in these cases shows that the high TOMS AI values in the negative case are concentrated over the eastern Arabian Peninsula, whereas they are distributed over the peninsula in the positive case.
In the positive case (30 April 2003) in the third regime (
Figure 10a), there is a belt of high-pressure systems at approximately 40°N that influences the Arabian Peninsula through a ridge that reaches the south of the peninsula. Concurrently, the southeastern region is affected by a low-pressure system that influences the eastern Arabian Gulf through a trough. According to the above description, the eastern Arabian Peninsula is affected by a northerly wind produced by the interaction between the previously noted ridge and trough. In addition, the distribution of the streamlines of 850 hPa wind (lines in
Figure 10a) supports the surface wind flow. Furthermore, the previous surface systems are combined at 500 hPa with an anticyclone over the Arabian Peninsula and a shallow trough over Iran (
Figure 10c), which produces a zonal wind over the Arabian Peninsula. Concurrently, the vertical wind at 925 hPa exhibits sequences of upward motion, subsidence and then upward motion over the western and eastern Arabian Peninsula and eastern Arabian Gulf, respectively (shaded in
Figure 10c).
Figure 10.
The distribution of the mean sea level pressure (SLP) (shaded) and streamlines at850 hPa (contour) for the third synoptic regime for (a) strong active cases and (b) weak active cases; the geopotential height (contour) and wind vectors at 500 hPa (barbs) and the vertical motion at 925 hPa (shaded) for (c) strong active cases and (d) weak active cases; and the horizontal distribution of TOMS AI values for (e) strong active cases and (f) weak active cases.
In the negative case (4 May 1992) in the third regime, there is a high-pressure belt in the north of the study region that extends as a high-pressure ridge into the eastern Mediterranean (shaded in
Figure 10b). Concurrently, the zonal area at approximately 25°N is affected by a low-pressure belt that has centers over North Africa, the northern Mediterranean and Iran. Additionally, there are numerous weak low-pressure cells spread throughout the Arabian Peninsula. As a result of the adjoining of a relatively deep low-pressure cell over Iran and a weak low-pressure cell over the Arabian Peninsula, a weak northerly wind is produced over the eastern Arabian Peninsula. Moreover, the distribution of the wind at 850 hPa (streamlines in
Figure 10b) shows that the wind is westerly over the northern Arabian Peninsula and northerly over the eastern Arabian Peninsula.
In addition, at 500 hPa (
Figure 10d), the Arabian Peninsula is affected by a high-pressure ridge that is surrounded by two low-pressure troughs. As a result of this situation, a northwesterly wind is generated over the eastern Arabian Peninsula. Moreover, the vertical motion at 925 hPa is upward over the northeastern Arabian Peninsula and subsides over the southeastern Arabian Peninsula (shaded area in
Figure 10d).
The distribution of TOMS AI values illustrates that the high values of dust in the positive case (
Figure 10e) are parallel to the Arabian Gulf and northern Arabian Peninsula, whereas the high values in the negative case (
Figure 10f) are concentrated over the eastern Arabian Peninsula. In addition, the connection between the dust over Africa and that over the Arabian Peninsula is more pronounced in the positive case (
Figure 10e).
In the positive case (16 May 1990) in the fourth regime (
Figure 11a), two high-pressure systems influence the study region: one is located to the east (weakest) and has a ridge that penetrates southward to the Sahara, and the other (strongest) is located in the northeast region and has a ridge that extends to the south of Iran. These two high-pressure systems surround a low-pressure cell located over the northern Arabian Peninsula. This situation produces a distribution of wind over the Arabian Peninsula that resembles the winds over a frontal system. These wind conditions appear in streamlines at 850 hPa (
Figure 11a).
Figure 11.
The distribution of the mean sea level pressure (SLP) (shaded) and streamlines at 850 hPa (contour) for the fourth synoptic regime for (a) strong active cases and (b) weak active cases; the geopotential height (contour) and wind vectors at 500 hPa (barbs) and the vertical motion at 925 hPa (shaded) for (c) strong active cases and (d) weak active cases; and the horizontal distribution of TOMS AI values for (e) strong active cases and (f) weak active cases.
This surface situation is supported by the upper pattern at 500 hPa (
Figure 11c); an anticyclone is located over the Arabian Peninsula, and two cyclones are located over the eastern Mediterranean and northeastern part of the study region. The interaction between these patterns produces a southwesterly and northwesterly wind over the western and eastern Arabian Peninsula, respectively. Concurrently, the vertical wind at 925 hPa exhibits a sequence of upward motion, subsidence and then upward motion over the western and eastern Arabian Peninsula and the eastern Arabian Gulf, respectively (shaded area in
Figure 11c); the upward motion over the eastern Arabian Gulf is stronger.
In the negative case (9 March 1988) in the fourth regime (
Figure 11b), a belt of low-pressure systems is located at approximately 40°N and contains a western low-pressure system located over the northern Mediterranean and an eastern low-pressure system located over Turkmenistan. The eastern low pressure affects the Arabian Peninsula by extending a low-pressure trough to the south of the peninsula that ends in a low cell. Concurrently, the north of the peninsula is affected by a high-pressure ridge that extends from a Saharan high-pressure system, whereas the south of the peninsula is affected by a high-pressure system located over the Arabian Sea. This situation produces a northerly and southwesterly wind over the northeastern and southern peninsula, respectively, and at 850 hPa, the previous surface wind becomes northwesterly and southwesterly, respectively (streamlines in
Figure 11b).
At 500 hPa (
Figure 11d), the Arabian Peninsula is affected by a strong zonal wind. At the same time, the vertical wind at 925 hPa appears in a sequence of pronounced upward motion, subsidence and then upward motion over the western and eastern Arabian Peninsula and eastern Arabian Gulf, respectively (shaded area in
Figure 11d); the upward motion over the eastern Arabian Gulf is stronger.
In addition, the dust distribution of this regime shows that the dust distribution in the positive case (
Figure 11e) extends north to south, whereas it extends west to east in the negative case (
Figure 11f). Furthermore, the connection between the dust over Africa and that over the Arabian Peninsula is more pronounced in the negative case (
Figure 11f). Moreover, the high value of the dust in the positive case is located to the north of its position in the negative case.


