Communication

Isotope Ratio Mass Spectrometry Monitoring of Nitrogen Volatilization from Beef Cattle Feces and 15N-Labeled Synthetic Urine

1
Department of Agricultural and Biosystems Engineering, South Dakota State University, Brookings, SD 57007, USA
2
Department of Plant Science, South Dakota State University, Brookings, SD 57007, USA
*
Author to whom correspondence should be addressed.
Atmosphere 2015, 6(5), 641-649; https://doi.org/10.3390/atmos6050641
Submission received: 26 February 2015 / Accepted: 7 May 2015 / Published: 13 May 2015

Abstract

:
A 15-day bench-scale manure storage experiment with a slurry mixture comprising beef cattle feces and synthetic urine with 15N-labeled urea was conducted to evaluate the source of volatilized ammonia nitrogen (NH3-N). Beef cattle feces was mixed daily in a 1:2.2 mass ratio with 15N-labeled urine and added for four consecutive days to 2-L storage containers and then left undisturbed for eleven days. Isotope ratio mass spectrometry was used to determine the origin of aerial NH3-N losses from the relative isotopic abundance of N in the 15N-labeled slurry mixture. On average 84% of total NH3-N losses originated from the urine portion and were highest during the first two to four days, when fresh material was added. After fresh material addition ceased, daily NH3-N emission from the urine decreased gradually, whereas emission from the feces remained relatively constant. Calculations showed that over 34% of aerial N was not captured, suggesting that other N gas emission is significant from slurry mixtures. Likely all uncaptured N losses were from urinary urea. The study verified the applicability of 15N-labeled synthetic urine for beef slurry mixtures. However, the results suggest further research to explain and model the NH3 and N release from fecal material is warranted and to determine the identity of the uncaptured N losses.

1. Introduction

Nitrogen (N) losses from manure can occur through runoff, leaching or emission and represent valuable nutrient losses for agricultural applications and potential harm to the environment. When deposited, atmospheric NH3 can be nitrified in soil and water and contribute to soil and water acidification; in addition, acid depositions can be transported large distances (several 100 km) from the source of release [1,2]. Ammonia emission can form light-scattering aerosol particles that may impair visibility and form respirable aerosol particles that are a health concern [3].
The 15N labeling method has been used to track N in dairy cows from feed intake to manure excretion [4] and cycling of manure N in crop systems [5,6]. Isotope ratio mass spectrometry is typically used to determine the ratio of 15N and 14N of plant and soil samples with high accuracy to detect even small differences between isotopic abundances of sample and standard conditions [7,8]. Few studies have been conducted that discuss labeled N movements through manure management systems [9,10] and have focused on compost [11,12,13] and anaerobic systems [14,15].
It is commonly assumed that NH3 from manure predominantly originates from urea when urine comes in contact with fecal urease [16,17,18,19]. However, only limited research examines the quantity of NH3 originating from urine versus feces in the manure. Thomsen [9] and Lee et al. [10] investigated urinary vs. fecal-N contribution to gaseous N emission from composted and anaerobically stored 15N-labeled sheep manure with bedding and stored dairy cattle manure, respectively. Both studies showed that urinary N accounted for the highest N loss from the manure.
Gaseous NH3 emissions from cattle manure are affected by a variety of factors, such as manure characteristics [20,21] and type and duration of manure storage [22,23]. In the long-term, recognizing the source of aerial N losses from beef cattle manure and the time when N emission are highest will help with beef cattle manure management decisions. Our research complements research conducted by Thomsen [9] and Lee et al. [10] and specifically considers NH3 emission from beef cattle manure with respect to time after fresh manure addition. Compared to 15N-labeled urine obtained from the animal, the applicability of synthetic 15N-labeled urine would allow advanced control over the 15N concentration in the manure mixture and provides a less costly and time-consuming alternative. Thus, the objectives of this study were (1) to verify the use of synthetic urine amended with 15N-labeled urea as a valid means to determine the fate and origin of N in manure, and (2) to monitor labeled-N movement in a bench-scale manure storage system for beef cattle manure.

2. Materials and Methods

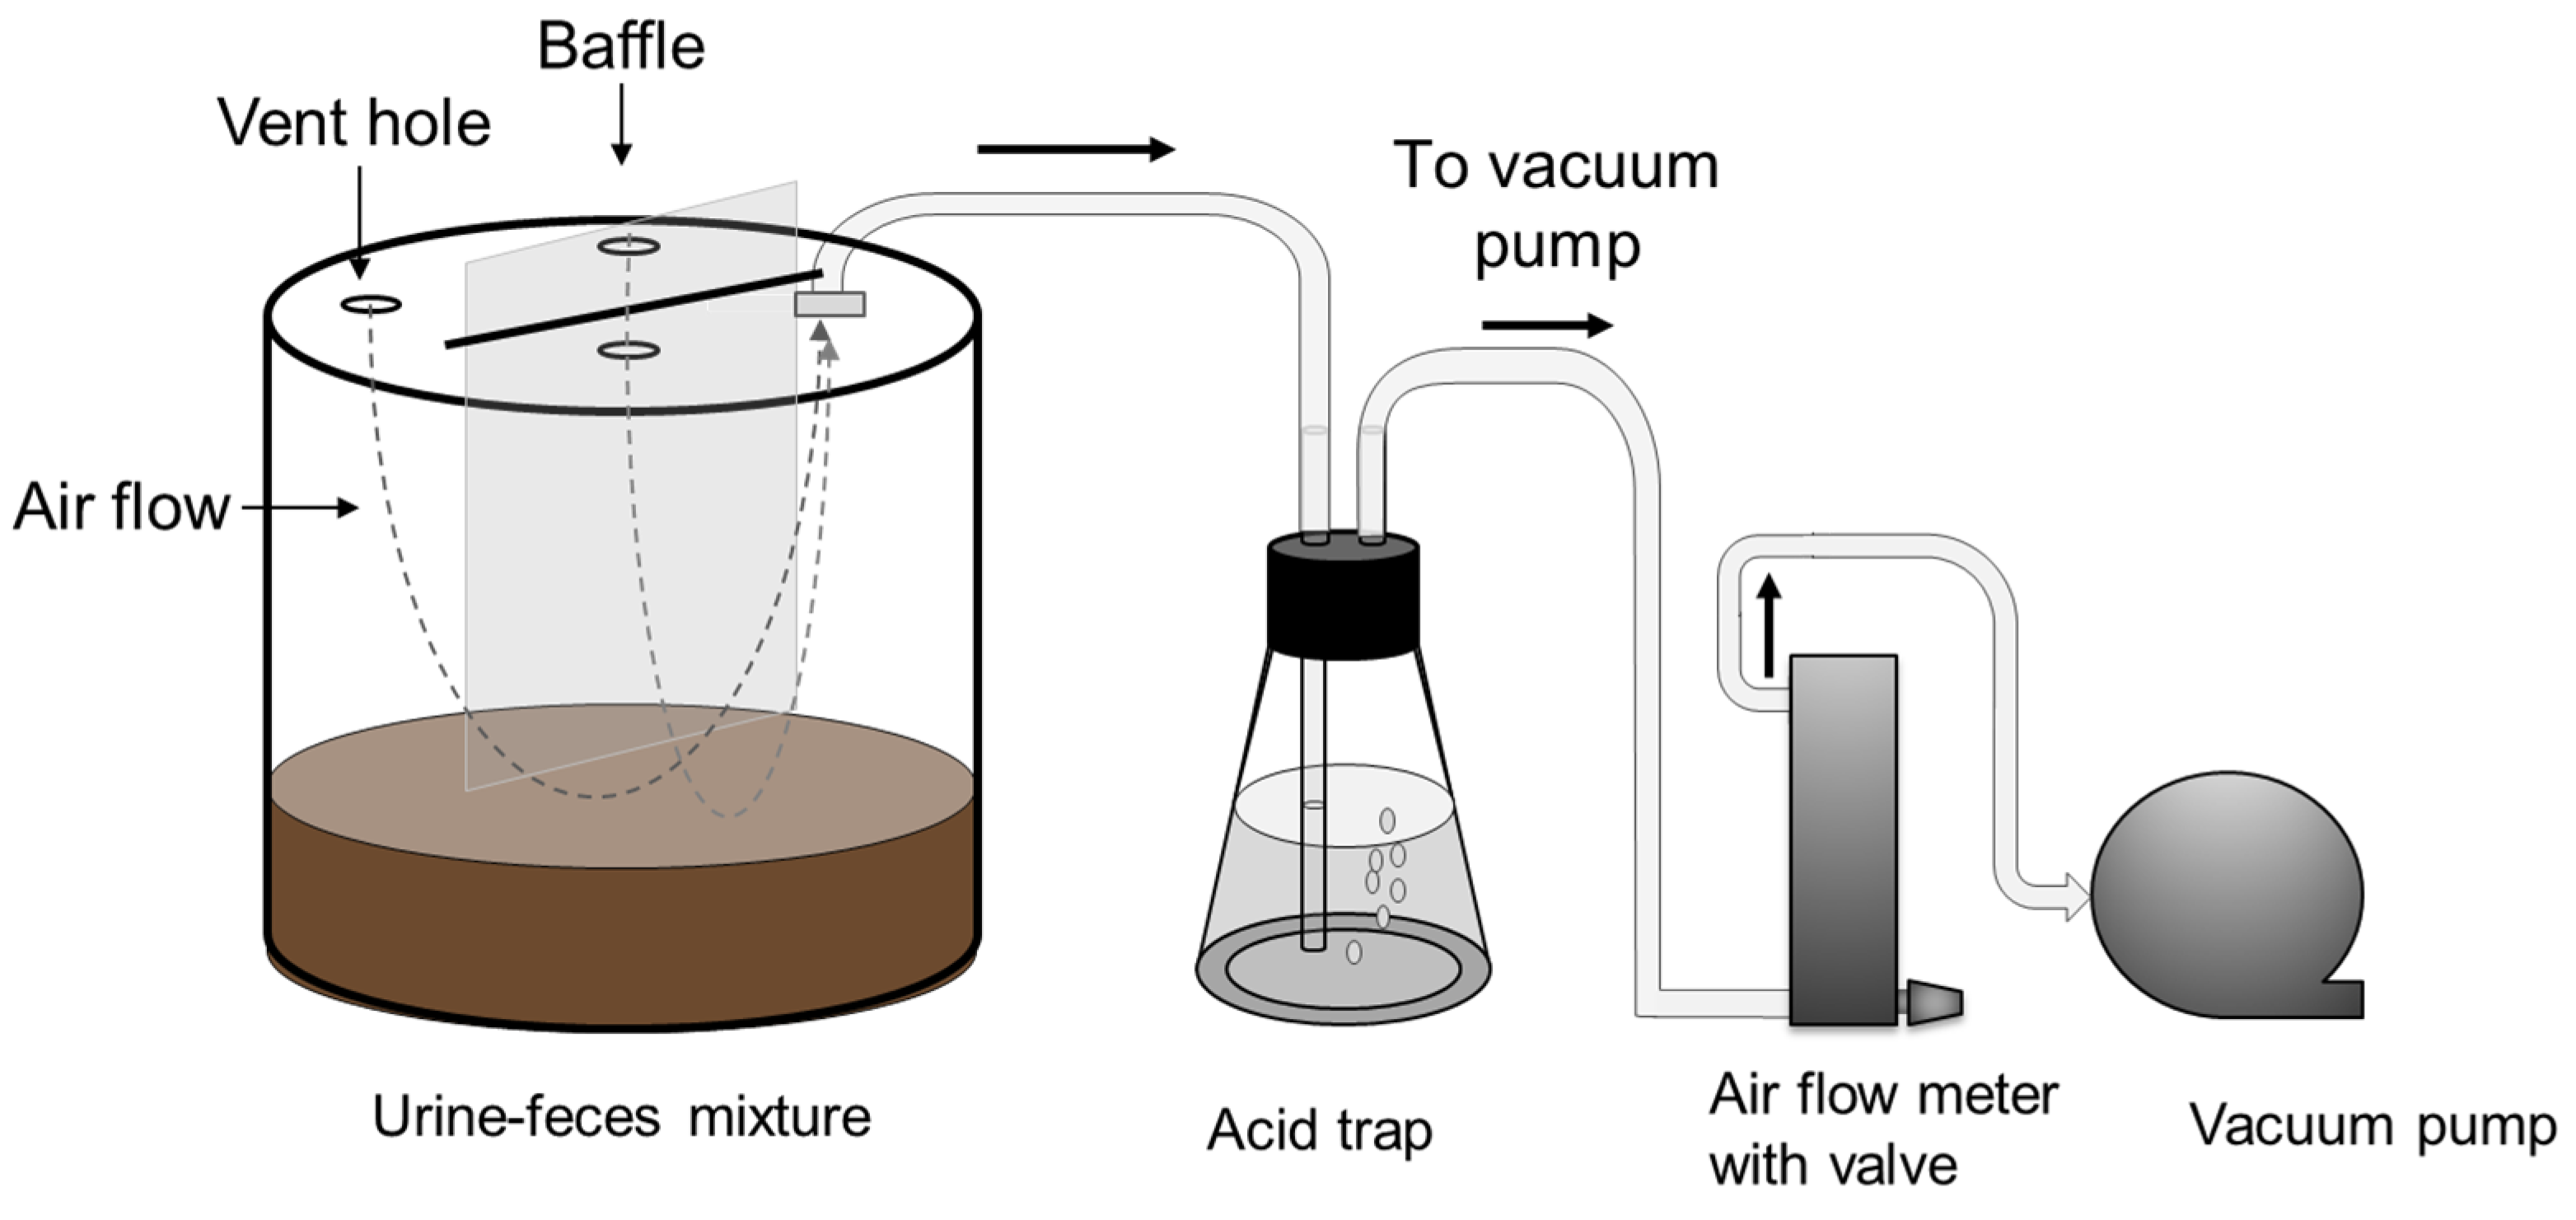
2.1. Simulated Slurry Systems

The bench-scale manure storage test system consisted of four 2-L wide-mouth glass jars (Figure 1). The lid of each jar was equipped with three inlet holes and one exhaust hole. A Teflon tube was connected to the exhaust hole to draw air out of the system through an acid trap solution. Combination airflow meters and valves (RMA-26-SSV, Dwyer Instruments, Inc., IN, USA) for each sampling line were situated after the acid trap and prior to the common vacuum pump (DOA-P707-AA, Gast Manufacturing Inc., Benton Harbor, MI, USA) to ensure equal air flow of 1 L·min−1 through each jar. A baffle placed in the middle of the jar lid was adjusted approximately 1 cm above the slurry surface to disperse air flow through the headspace of the jar. Thermocouples were placed in the slurry mixture and in the ambient air to monitor temperature changes with measurements recorded at 5-min intervals.
Figure 1. Schematic of one acid trap unit within the bench-scale manure storage system (not to scale).
Atmosphere 06 00641 g001
Fresh fecal material was hand-grabbed from an open beef feedlot, combined, stored in a freezer (−18 °C), and thawed over 24 h prior to addition. The synthetic urine was prepared immediately before addition following procedures by Parker et al. [24]. Synthetic labeled urine contained 22.6 g·L−1 15N-labeled urea (10 atom %, Sigma-Aldrich, St. Louis, MO, USA) in combination with 23.1 g·L−1 potassium bicarbonate, 1.9 g·L−1 potassium sulfate, and 3.8 g·L−1 potassium chlorate using nanopure water (E-Pure, Barnstead, Thermo Scientific, Dubuque, IA, USA). Daily subsamples of feces and urine were taken after material addition and stored at −18 °C for further analysis. For the first four days, 200 mL of synthetic urine and 90.9 g of beef cattle feces were added to each jar daily. After each material addition, the mixtures were stirred briefly and the lids were closed. The 100-mL acid traps were prepared with 0.3 M sulfuric acid in nanopure water. The acid traps were replaced daily from the beginning until the end of the 15-day monitoring period and a subsample from each acid trap was stored at −18 °C until subsequent analysis. After the first four days of the material addition, the lids were not opened for the remainder of the 15-day monitoring period. At the end of the monitoring period, 50 mL of 0.3 M sulfuric acid was added to the slurries and approximately 100 g of raw feces was acidified with 20 mL 0.3 M sulfuric acid to prevent loss of N through volatilization.

2.2. Physical and Chemical Analysis

Moisture content (MC) of 350-g subsamples of the acidified slurry mixtures and fecal samples were determined by weighing the subsamples before and after drying in a forced-air oven at 80 °C for 24 h and 38 h, respectively. One-gram subsamples of the dried slurry mixtures were dried further at 135 °C for 2 h to determine absolute MC, because crust formation prevented complete drying of the larger sample. Dried slurry mixtures and dried fecal material were ground through a 2-mm screen with a centrifugal grinding mill (Retsch ZM-1, Brinkmann Instruments Co., Westbury, NY, USA). Three-mg samples of both the ground fecal material and ground slurry samples were analyzed for total N and atom % 15N (15N relative to total 14N + 15N) on a 20-20 Europa isotope ratio mass spectrometer (Europa Scientific Ltd., Crewe, Cheshire, UK). Ten-µL subsamples of both the urine and the acid trap solutions were mixed with 3 mg Chromosorb W, acid washed (Europa Scientific Ltd., Cambridge, UK) and also analyzed for total N and atom % 15N. A standard sample was run after every eight samples with the mass spectrometer. The standard used for the ground fecal samples was bleached all-purpose wheat flower purchased from a local market source with standard values previously verified through multiple testing labs for use as standard values. For samples from labeled final slurry mixtures, a 1:1.2 unlabeled urea (Sigma-Aldrich, St. Louis, MO, USA) dilutions was used as the standard for the mass spectrometer. A 1:10 dilution of the 15N-labeled urea was used as the standard for treatment acid trap subsamples.
The daily total volatilized NH3 was calculated based on the detected total N (%) measured in each acid traps and converted to g·day−1 as follows:
E N H 3 = c N H 3 _ A T × V A T × ρ A T
where
ENH3 = slurry N recovered as NH3 in the acid trap solution (g·day−1)
cNH3_AT = NH3-N concentration in acid trap (g·g−1 acid trap solution day−1)
VAT = volume acid trap solution (mL)
ρAT = density of the acid trap solution (assume 1 g·mL−1)
The proportion of NH3-N volatilized from the urine in the labeled slurry mixtures was calculated under the assumption that all 15N recovered as NH3-N in the acid trap solution originated solely from the urine portion (Equation (2)):
E N H 3 _ U = E N H 3 × ( N A T 15 N N A 15 N U 15 N N A 15 )
where
ENH3_U = recovered NH3-N from treatment urinary N (g·day−1)
15NU = 15N content in the urine before addition to treatment (g·g−1 urine)
15NAT = 15N content captured in acid trap (g·g−1 acid trap solution)
15NNA = natural abundance of 15N in air (g·g−1 air) = 0.0037 [25]
A similar approach was used to determine total N from the urine portion in the final dried slurry:
T N S l _ U = T N S l × ( N S l 15 N N A 15 N U 15 N N A 15 )
where
TNSl_U = total N from the urine portion in the final dried slurry
TNSl = total N in the final dried slurry
15NSl = 15N content in the final dried slurry
The proportion of NH3-N volatilized from the feces in the labeled slurry mixtures was calculated as the difference between ENH3 and ENH3_U. Uncaptured N was calculated as the difference between the input slurry N (sum of N added from the urine and the fecal material) and the measured output slurry N (sum of final slurry N and recovered acid-captured NH3-N).

2.3. Statistical Analysis

The experiment was designed to verify the use of synthetic urine with 15N-labeled urea, to quantify NH3-N losses from the slurry mixture, and to determine the ratio of feces versus urine contribution to 15N loss and total N. The glass jar was the experimental unit with four replicates of labeled slurry. The PROC GLM (SAS Institute Inc., Cary, NC, USA) procedure was used to test for differences in daily captured NH3-N from labeled slurries. If significant differences existed (p < 0.05) post hoc Tukey HSD was used to determine where and when differences occurred.

3. Results and Discussion

At times of material addition, the slurry temperature decreased about 2 °C because added urine and fecal material were colder (20 °C) than the average slurry temperature (27 °C, CV = 0.04). Ammonium-N losses were highest between day 2 and 4 (Figure 2). After day 4, which coincided with the end of material addition, NH3-N emission gradually decreased until the end of the 15-day monitoring period. Previous studies with incubated dairy manure at 25 °C and beef manure at 40 °C reported NH3 peak emission between two and five days [10] and within two days after manure addition [26], respectively, followed by a gradual decrease in NH3 emission. Lee et al. [10] added manure only once in the beginning of the trial but took daily manure samples; sampling may have enhanced mixing and facilitated NH3 volatilization which may explain the extended period of higher emission in their study. In our study, NH3-N emission decreased one day after the last material addition with no subsequent mixing. Other field-scale studies with cattle manure also observed highest NH3 volatilization within 24 h of manure application [27,28].
The majority (84%) of captured NH3-N losses originated from urinary urea with the highest proportion of emission from the urine portion occurring between day 2 (0.46 g·day−1, CV = 0.08) and 4 (0.53 g·day−1, CV = 0.08). Our findings conform to findings of Lee et al. [10] who reported that during the first ten days of incubated dairy manure 90% of NH3-N losses originated from urinary N. Lee et al. [10] found initial NH3 volatilization from the fecal portion to be negligible during the first 48 h of incubation, whereas after 10 incubation days, 10% of the NH3-N losses originated from fecal N. Interestingly, in our study the relative fecal contribution to NH3-N loss in the first 48 h ranged between 23% and 25%, remained constant between days 3 and 5 (9%) and then gradually increased after day 5 from 10% to 31% on day 15. However, except for day 2 (0.14 g·day−1, CV = 0.06), NH3-N emissions from fecal N were constant throughout the monitoring period ranging between 0.04 and 0.06 g·day−1 and averaged 0.05 g·day−1 (CV = 0.47). The urinary portion of the labeled slurry was the significant source of NH3-N emissions. However, further research needs to be conducted to evaluate N transformation processes in fecal material that contribute to NH3 production, or if the ratio is affected by temperature or other environmental factors.
Figure 2. Average daily NH3-N losses captured in sulfuric acid traps for 15N-labeled slurry mixtures. The proportion of fecal versus urinary contribution to NH3-N losses was calculated based on the 15N atom % in the acid trap solution. Error bars indicate the standard error of the mean.
Atmosphere 06 00641 g002
On average, 34% of the N losses were uncaptured (Table 1). Lee et al. [10] reported up to 25% uncaptured N losses from simulated dairy manure stored for 20 days, and proposed that those N losses originated most likely from dinitrogen gas. However, under these experimental conditions, nitrous oxide production may have as likely occurred as dinitrogen gas. Amon et al. [22] reported total net nitrous oxide emission (20.2 g N2O per m3 slurry) were half as high as NH3 emission (41.0 g NH3 per m3 slurry) during storage of untreated dairy cattle slurry.
Table 1. Nitrogen (N) balance for the control and treatment.1
Input N (g) 2Output N (g)
Acid-Captured NH3-NFinal Slurry N 3Uncaptured N Losses
SourceUrineFecesTotalUrineFecesTotalUrineFecesTotalUrineFecesTotal
Slurry8.892.69 (0.15)11.584.06 (0.02)0.79 (0.02)4.85 (0.02)0.47 (0.06)2.29 (0.03)2.76 (0.03)4.36−0.39 *3.97
Slurry 15N0.8800.010 (0.00)0.8900.398 (0.02)0.003 (0.02)0.401 (0.02)0.046 (0.06)0.008 (0.03)0.054 (0.06)0.436−0.001 *0.435
1 Averages are shown with coefficient of variation in parentheses (CV) for four replicates with underlined values calculated based on 15N signature and values in italic font based on mass balances; 2 Total nitrogen input after 4 days of material addition; 3 Nitrogen content after 15 days of storage; * Imbalance in fecal N masses calculation of the difference between the fecal N input and the measured fecal N output (acid-captured NH3-N and slurry N).
Future studies should incorporate additional techniques to quantify other N gases that are not captured by the acid trap. Nitrogen mass balance calculations showed that more than 80% of the total final slurry N content was from fecal N while less than 20% was from the urine portion (Table 1). The calculations also showed an imbalance in fecal N masses; the negative values for uncaptured N from feces would translate to a 15% increase in fecal N content after incubation. The error in the fecal N mass balance may be caused by the inconsistency in fecal N concentration which was reflected in the coefficient of variation for N concentration for the added fecal material (CV = 0.15).
Total N losses (captured and uncaptured) originated with 95% from urinary N. Thomsen [9] came to similar findings with anaerobically stored sheep compost and reported that urine N accounted for 94% of total N losses after 28 days of storage. Overall, the N balance (Table 1) and similar findings to Lee et al. [10] suggest that using synthetic urine with 15N-labeled urea is applicable to measure NH3-N losses and determine the source of volatilized NH3-N from beef cattle manure. However, additional studies are necessary to not only determine the uncaptured N gases but also to confirm the source of uncaptured losses.

4. Conclusions

Compared to studies with cannulated beef cattle as donors, the 15N-labeled urea tracer method presents a simple and inexpensive alternative with more control over the 15N concentration in the labeled synthetic urine solution. Urinary N accounted for the majority (84%) of NH3-N volatilization, with highest losses occurring for the days with urine and feces addition. Ammonium-N losses from the feces were similar throughout the trial, but as a percentage of total emission, gradually increased during storage time. Over 35% of the N losses were uncaptured and most likely originated all from urinary urea. Further research has to be carried out to confirm N release from fecal material and different measurements techniques should be added to determine other N gases that were not captured by the acid trap.

Acknowledgments

Funding for this study was provided by South Dakota State University Research/Scholarship Support Fund and Sherwood and Elizabeth Berg Award.

Author Contributions

Erin Cortus and Ferouz Ayadi conceived and designed the experiments; Ferouz Ayadi performed the experiments, analyzed the results, and wrote the paper. Erin Cortus contributed to the experimental design and preparation of the manuscript. Erin Cortus, David Clay, and Stephanie Hansen contributed to the data analysis, edited and revised the manuscript.

Conflicts of Interest

The authors declare no conflict of interest.

References

  1. Ayoub, A.T. Fertilizers and the environment. Nutr. Cycl. Agroecosyst. 1999, 55, 117–121. [Google Scholar] [CrossRef]
  2. Asman, W.A.; Sutton, M.A.; Schjørring, J.K. Ammonia: Emission, atmospheric transport and deposition. New Phytol. 1998, 139, 27–48. [Google Scholar] [CrossRef]
  3. Arogo, J.; Westerman, P.; Heber, A. A review of ammonia emissions from confined swine feeding operations. Trans. ASAE 2003, 46, 805–817. [Google Scholar]
  4. Powell, J.M.; Wu, Z.; Kelling, K.; Cusick, P.; Muñoz, G. Differential nitrogen-15 labeling of dairy manure components for nitrogen cycling studies. Agron. J. 2004, 96, 433–441. [Google Scholar] [CrossRef]
  5. Muñoz, G.; Kelling, K.; Powell, J.M.; Speth, P. Comparison of estimates of first-year dairy manure nitrogen availability or recovery using nitrogen-15 and other techniques. J. Environ. Qual. 2004, 33, 719–727. [Google Scholar] [CrossRef] [PubMed]
  6. Paul, J.; Beauchamp, E. Availability of manure slurry ammonium for corn using 15N-labelled (NH4)2SO4. Can. J. Soil Sci. 1995, 75, 35–42. [Google Scholar] [CrossRef]
  7. Robinson, D.; Smith, K.A. Analysis of nitrogen isotope ratios by mass spectrometry. In Soil Analysis: Modern Instrumental Techniques, 2nd ed.; Smith, K.A., Ed.; Marcel Dekker, Inc.: New York, NY, USA, 1991; pp. 465–504. [Google Scholar]
  8. Muccio, Z.; Jackson, G.P. Isotope ratio mass spectrometry. Analyst 2009, 134, 213–222. [Google Scholar] [CrossRef] [PubMed]
  9. Thomsen, I.K. C and N transformations in 15N cross-labelled solid ruminant manure during anaerobic and aerobic storage. Bioresour. Technol. 2000, 72, 267–274. [Google Scholar] [CrossRef]
  10. Lee, C.; Hristov, A.N.; Cassidy, T.; Heyler, K. Nitrogen isotope fractionation and origin of ammonia nitrogen volatilized from cattle manure in simulated storage. Atmosphere 2011, 2, 256–270. [Google Scholar] [CrossRef]
  11. Maeda, K.; Toyoda, S.; Shimojima, R.; Osada, T.; Hanajima, D.; Morioka, R.; Yoshida, N. Source of nitrous oxide emissions during the cow manure composting process as revealed by isotopomer analysis of and amoA abundance in betaproteobacterial ammonia-oxidizing bacteria. Appl. Environ Microbiol. 2010, 76, 1555–1562. [Google Scholar] [CrossRef] [PubMed]
  12. Lynch, D.; Voroney, R.; Warman, P. Use of 13C and 15N natural abundance techniques to characterize carbon and nitrogen dynamics in composting and in compost-amended soils. Soil Biol. Biochem. 2006, 38, 103–114. [Google Scholar] [CrossRef]
  13. Tran, T.M.; Luxhoi, J.; Jensen, L.S. Turnover of manure 15N-labelled ammonium during composting and soil application as affected by lime and superphosphate addition. Soil Sci. Soc. Am. J. 2013, 77, 190–201. [Google Scholar] [CrossRef]
  14. Mariappan, S.; Exner, M.E.; Martin, G.E.; Spalding, R.F. Variability of anaerobic animal waste lagoon delta 15N source signatures. Environ. Forensics 2009, 10, 18–25. [Google Scholar] [CrossRef]
  15. Béline, F.; Martinez, J.; Marol, C.; Guiraud, G. Nitrogen transformations during anaerobically stored 15N-labelled pig slurry. Bioresour. Technol. 1998, 64, 83–88. [Google Scholar] [CrossRef]
  16. Wilkerson, V.; Mertens, D.; Casper, D. Prediction of excretion of manure and nitrogen by Holstein dairy cattle. J. Dairy Sci. 1997, 80, 3193–3204. [Google Scholar] [CrossRef] [PubMed]
  17. Sommer, S.G.; Zhang, G.-Q.; Bannink, A.; Chadwick, D.; Misselbrook, T.; Harrison, R.; Hutchings, N.; Menzi, H.; Monteny, G.; Ni, J. Algorithms determining ammonia emission from buildings housing cattle and pigs and from manure stores. Adv. Agron. 2006, 89, 261–335. [Google Scholar]
  18. Varel, V.H.; Nienaber, J.A.; Freetly, H.C. Conservation of nitrogen in cattle feedlot waste with urease inhibitors. J. Animal Sci. 1999, 77, 1162–1168. [Google Scholar]
  19. Zhang, R.; Rumsey, T.; Fadel, J.; Arogo, J.; Wang, Z.; Xin, H.; Mansell, G. Development of An Improved Process Based Ammonia Emission Model for Agricultural Sources. Available online: http://www.ladco.org/reports/rpo/emissions/new_ammonia_model_final_science_document_uc_davis_et_al.pdf (accessed on 8 May 2015).
  20. Sommer, S.G.; Génermont, S.; Cellier, P.; Hutchings, N.J.; Olesen, J.E.; Morvan, T. Processes controlling ammonia emission from livestock slurry in the field. Eur. J. Agron. 2003, 19, 465–486. [Google Scholar] [CrossRef]
  21. Huijsmans, J.; Hol, J.; Vermeulen, G. Effect of application method, manure characteristics, weather and field conditions on ammonia volatilization from manure applied to arable land. Atmos. Environ. 2003, 37, 3669–3680. [Google Scholar] [CrossRef]
  22. Amon, B.; Kryvoruchko, V.; Amon, T.; Zechmeister-Boltenstern, S. Methane, nitrous oxide and ammonia emissions during storage and after application of dairy cattle slurry and influence of slurry treatment. Agric. Ecosyst. Environ. 2006, 112, 153–162. [Google Scholar] [CrossRef]
  23. Külling, D.R.; Sutter, F.; Lischer, P.; Kreuzer, M.; Menzi, H.; Kröber, T.F.; Neftel, A. Emissions of ammonia, nitrous oxide and methane from different types of dairy manure during storage as affected by dietary protein content. J. Agric. Sci. 2001, 137, 235–250. [Google Scholar] [CrossRef]
  24. Parker, D.B.; Pandrangi, S.; Almas, L.K.; Cole, N.A.; Greene, L.W.; Koziel, J.A. Rate and frequency of urease inhibitor application for minimizing ammonia emissions from beef cattle feedyards. Trans. ASAE 2005, 48, 787–793. [Google Scholar] [CrossRef]
  25. Bax, A.; Griffey, R.H.; Hawkins, B.L. Sensitivity-enhanced correlation of nitrogen-15 and proton chemical shifts in natural-abundance samples via multiple quantum coherence. J. Am. Chem. Soc. 1983, 105, 7188–7190. [Google Scholar] [CrossRef]
  26. Ayadi, F.Y.; Cortus, E.L.; Spiehs, M.J.; Miller, D.N.; Djira, G. Ammonia and greenhouse gas concentrations at surfaces from simulated beef cattle bedded manure packs. Trans. ASABE 2015, in press. [Google Scholar]
  27. Whitehead, D.C.; Raistrick, N. Nitrogen in the excreta of dairy cattle: Changes during short-term storage. J. Agric. Sci. 1993, 121, 73–81. [Google Scholar] [CrossRef]
  28. Thompson, R.B.; Pain, B.F.; Rees, Y.J. Ammonia volatilization from cattle slurry following surface application to grassland. II. Influence of application rate, wind speed and applying slurry in narrow bands. Plant Soil 1990, 125, 119–128. [Google Scholar]

