Article

Characteristics of the Transport of a Typical Pollution Event in the Chengdu Area Based on Remote Sensing Data and Numerical Simulations

1
College of Resources and Environment, Chengdu University of Information Technology, Chengdu 610225, China
2
Wenjiang Meteorological Bureau, Chengdu 611130, China
3
Sichuan Academy of Environmental Sciences, Chengdu 610041, China
4
Environment Protection Key Laboratory of Satellite Remote Sensing, Institute of Remote Sensing and Digital Earth, Chinese Academy of Sciences, Beijing 100101, China
*
Author to whom correspondence should be addressed.
Atmosphere 2016, 7(10), 127; https://doi.org/10.3390/atmos7100127
Submission received: 27 July 2016 / Revised: 3 September 2016 / Accepted: 30 September 2016 / Published: 9 October 2016

Abstract

:
A heavy air pollution event occurred in Chengdu between 7 May 2014 and 8 May 2014. The present study established tracer sources based on HJ-1 satellite data, micropulse light detection and ranging (LiDAR) remote sensing data, and backward trajectories simulated using the hybrid single-particle Lagrangian integrated trajectory (HYSPLIT) model. Additionally, the present study analyzed the diffusion conditions for the sources and characteristics of the pollutant transport in this pollution event through simulation using a mesoscale atmospheric chemistry transport model—the weather research forecasting model with chemistry (WRF–CHEM). The results show that the change in the boundary-layer height over Chengdu had a relatively large effect on the vertical diffusion of pollutants. During the pollution event, Chengdu, Meishan, and Leshan were areas of significantly low mean ventilation coefficients ( V H ). In Chengdu, the V H was extremely low at night, and there was a temperature inversion near the ground, resulting in the continuous accumulation of pollutants at night and a continuous worsening of the pollution. During the period of heavy pollution, there were straw-burning sites in Meishan, Ziyang, Neijiang, Zigong, and Deyang. On 7 May 2014, the pollutants in Chengdu mainly originated from Meishan. The accumulation in Chengdu of pollutants originating in Meishan and Deyang led to highly concentrated pollution on 8 May 2014, to which the pollutants originating in Deyang were the main contributor. The transport of pollutants resulting from straw burning in the study area and the relatively poor conditions for the pollutant diffusion in Chengdu collectively led to the heavy air pollution event investigated in the present study.

1. Introduction

A continuous rise in the frequency of heavy pollution events and a continuous increase in the area affected by heavy pollution has recently been observed in China; additionally, regional atmospheric environmental problems involving inhalable and fine particulate matter as the characteristic pollutants have become increasingly prominent and attracted extensive attention from all sectors of society. Therefore, based on the current regional and complex characteristics of atmospheric pollution in China, it is necessary to strengthen the fundamental research on atmospheric pollution sources and regional pollution transport. Such research will provide a basis for regional heavy pollution weather monitoring and warning and the joint prevention and control of regional atmospheric pollution in key areas [1]. Currently, many studies on the environmental problems caused by the transport of pollutants have been conducted in China [1]. Wang et al. [2] simulated the dust-haze pollution that occurred in southern Hebei between 2001 and 2010 using the community multi-scale air quality model and observed that 65% of the particulate matter less than 2.5 µm in diameter (PM2.5) in Shijiazhuang and Xingtai had originated from local emissions and that the remainder originated from Shanxi and northern Hebei. He et al. [3] analyzed a severe dust-haze pollution event that occurred in Beijing in 2013 through simulations using the weather research forecasting model with chemistry (WRF–CHEM) and noted that the relatively low wind speed and relatively low boundary layer were the main causes of the peak PM2.5 concentrations, and that the local pollution sources contributed to as much as 78% of this pollution event. Cheng et al. [4] analyzed the sources of sulfur dioxide (SO2) in a heavy pollution event that occurred in Beijing based on the comprehensive air quality model with extensions and noted that external pollution sources contributed to as much as 83% of the SO2 concentration during this pollution event. Zhu et al. [5] analyzed an air pollution event that occurred in Nanjing and its surrounding area through the comprehensive use of satellite monitoring data, meteorological observation data, and a backward trajectory simulation model and observed that the atmospheric pollutants resulting from straw burning in central and northern Jiangsu was the main pollutant source of this event. Regarding these types of studies, two methods have been used in the literature. One method conducts analysis based on monitoring data such as air quality and meteorological conditions. Monitoring data can truly reflect the intensity of pollution events. In addition, monitoring data combined with a receptor model can be used to quantitatively analyze the main sources of atmospheric pollutants, and can also reflect the characteristics of pollutant sources at different times and different monitoring points relatively well [6,7]. However, monitoring data cannot visually reflect the transboundary transport or transport processes of pollutants. The other method conducts analysis through model simulation by inputting a list of pollution sources compiled from statistical data on pollutants. However, these pollutant emission inventories have certain inherent errors. Consequently, it is difficult to know the location and distribution of pollutants in a timely and accurate manner based on an emission inventory. Therefore, the two aforementioned methods cannot accurately capture or predict the occurrence and development of typical heavy pollution events, thereby significantly reducing the capacity of the state to respond to heavy pollution events.
The present study obtained relevant pollutant information based on satellite remote sensing data, ground-based remote sensing data, and backward trajectories simulated using the hybrid single-particle Lagrangian integrated trajectory (HYSPLIT) model and simulated the pollutant gas transport process during a typical pollution event using WRF–CHEM. The present study attempts to simulate and monitor typical heavy pollution processes by comprehensively using remote sensing data and models, and is important for the monitoring, prevention, and control of regional atmospheric pollution. Remote sensing techniques are characterized by large spatial scales and can be employed to adequately obtain information on the spatial distribution of pollutants. The HJ-1 satellite system is an Earth observation system specifically designed for environmental and disaster monitoring; can perform wide-range, long-term, and high-precision dynamic monitoring of environmental change in China; and rapidly obtain information in areas where pollutants are distributed [8,9,10]. Of the ground-based remote sensing systems, micropulse light detection and ranging (LiDAR) (MPL) is a new-generation, high-tech product that rapidly monitors the atmospheric environment. The detector of an MPL device uses a single-channel photomultiplier module to count single photons, and each counter channel has a minimum temporal resolution of 200 ns. An MPL device can rapidly monitor the atmospheric environment of an area of several kilometers in real time. This system can obtain the characteristics of the vertical profile and temporal evolution of the atmospheric aerosol extinction coefficient (AEC) [11,12]. Additionally, the HYSPLIT model can be used to understand the trajectory of tracer air mass movements or atmospheric particles and is currently widely used to research the transport of environmental atmospheric pollution [13,14]. WRF–CHEM is a new generation of regional air quality model, and its meteorological and chemistry modules are completely coupled online. WRF–CHEM can not only simulate the evolution of meteorological conditions, but also predict and simulate the transport and spatiotemporal distribution of pollutants [15,16,17,18].
The Sichuan Basin is located in central-eastern Sichuan Province and is surrounded by high mountains. Because of its closed topography, the wind speed in the Sichuan Basin is perennially low, which is unfavorable for pollutant diffusion. Currently, the Sichuan Basin is one of the four notable heavy dust-haze areas in China [19]. Chengdu is the capital of Sichuan Province and a hub for economic development in western China. In January, February, May, October, and December, heavy pollution occurs continuously and at high frequency in the Chengdu area. Heavy pollution occurring between December and February of subsequent years results in seasonal variations of heavy pollution related to meteorological conditions. This heavy pollution mainly results from the heavy pollutant emission load, low precipitation, relatively few rainy days, and frequent occurrence of static and stable atmospheric weather conditions during this period, which are unfavorable for pollutant dispersion. May and October compose the harvesting season for the main staple crops (rapeseed and paddy rice) grown in the farmlands around Chengdu, during which time farmers start to burn large amounts of straw. Therefore, the heavy pollution occurring in May and October is from straw burning [20,21]. The severe pollution situation in Chengdu has had a significant impact on the economic development of the region and the living conditions of its residents. A severe atmospheric pollution event occurred in the Chengdu area in early May 2014. Figure 1 shows the monitoring results obtained from the automatic air-monitoring substation in Sichuan Province. The value of each index continuously decreased from 1 May to 5 May, but the overall air quality remained at the moderate pollution level. The concentration of each pollutant started to increase on 6 May and rapidly increased to the maximum on 7 May. The peak PM2.5 and PM10 concentrations on 7 May reached 180 and 284 μg/m3, respectively, reflecting that the air quality had reached a severe pollution level. Additionally, analysis of black carbon using a black carbon analyzer showed that the daily mean concentration of black carbon was 8.69 μg/m3 on 7 May and 9.20 μg/m3 on 8 May, which were much higher than the values on other days (<4.0 μg/m3). The sudden increase in the black carbon concentration reflected the effect of straw burning. This atmospheric pollution event gave rise to heavy pollution conditions in the Chengdu area in 2014 that were relatively typical of straw burning. Therefore, the present study analyzed the diffusion conditions related to the sources and characteristics of pollutant transport during this air pollution event through simulation using a mesoscale atmospheric chemistry transport model—WRF–CHEM.

2. Data Sources and Research Methods

2.1. Data Sources

The air mass concentration data were obtained from the automatic air-monitoring substation in Sichuan Province (30.63°N, 104.07°E) and included the hourly PM2.5 data between 7 May 2014 and 8 May 2014, and the daily mean PM2.5, PM10, and black carbon aerosol data between 1 May 2014 and 9 May 2014. The PM2.5 and PM10 concentrations were measured using a BAM-1020 particulate monitor, which produced by American Met One company. This particulate monitor automatically measures and records the particulate concentrations in the air based on the β-ray attenuation principle and has been verified by the U.S. Environmental Protection Agency (EPA). Black carbon aerosols were observed using an Aethalometer™, which is produced by American Magee company. This instrument can be employed to observe atmospheric black carbon aerosols simultaneously at seven wavelengths in the ultraviolet, visible, and near-infrared spectra and has been verified by the U.S. EPA’s Environmental Technology Verification Program. The aerosol optical depth (AOD) data were obtained by inverting the monitoring data acquired by the HJ-1B satellite of the HJ-1 satellite system. The AEC data were obtained by inverting the LiDAR data acquired from the comprehensive substation at the Chengdu University of Information Technology (30.58°N, 103.99°E). The meteorological data for the HYSPLIT4 model originated from the U.S. National Oceanic and Atmospheric Administration’s global data assimilation system (GDAS). The meteorological data for the HYSPLIT4 model had a horizontal resolution of 1° × 1°, 12 isobaric layers vertically from 1000 to 50 hPa, and a time interval of 6 h. The final (FNL) reanalysis data (spatial resolution: 1° × 1°; time interval: 6 h) released by the U.S. National Centers for Environmental Prediction were used as the meteorological field data required by WRF–CHEM. Figure 2 shows the locations of the automatic air-monitoring substation in Sichuan Province and the comprehensive substation at the Chengdu University of Information Technology.

2.2. Research Methods

2.2.1. Acquisition of Tracer Sources

The tracer sources used in the WRF–CHEM analysis were obtained by comprehensively analyzing the AOD data, the AEC data obtained from inverting the MPL data, and the background trajectories simulated using the HYSPLIT4 model. The charge-couple device and infrared-scanning radiometer installed on the HJ-1B satellite were used to invert the high-resolution AOD data for the Sichuan Basin on 7 May 2014, and the tracer sources were determined based on the inversion results. The time at which pollutants were emitted from the tracer sources was determined based on the AEC data obtained from the inverted LiDAR data. The transport trajectories of the air masses at different heights (50,500 and 1000 m) over Chengdu (30.67°N, 104.06°E) were simulated using the HYSPLIT4 model. The trajectories over the course of the 72 h prior to 0000UTC on 9 May, at which time the heavy pollution process was nearly over, were traced. The general directions from which the pollutants in Chengdu originated were determined based on the trajectories.
Figure 3 shows the results of the inverted AOD data for the Sichuan Basin on 7 May 2014, and the backward trajectories of pollutant transport in the Sichuan Basin. On 7 May, the air quality was relatively poor in Chengdu, Deyang, Suining, and Nanchong, and the air pollution was relatively severe in Ziyang, Zigong, Neijiang, and western Meishan. In Chengdu, the AOD ranged from 1.1–1.8 and exceeded 1.4 in most areas. These values were significantly higher than the annual mean AOD in Chengdu between 2008 and 2012 (0.70–0.95) [22], which, to a certain degree, indicates the severity of the pollution. Additionally, based on the backward trajectories, the air masses at 30 and 500 m mainly moved from Meishan, Neijiang and Zigong to Chengdu, whereas the air masses at 1000 m mainly originated from Ziyang. Meishan, Neijiang, Zigong, and Ziyang contained small areas of high AOD. Initially, it was believed that the aforementioned areas corresponded to straw-burning sites and that the resulting pollutants were continuously transported to Chengdu.
Figure 4 displays that the variation in the PM2.5 concentration was essentially consistent with that of the AEC. Therefore, it is believed that the AEC variation could reflect the variation in the pollutant concentration during the pollution event. Because only the hourly PM2.5 concentration data between 7 May 2014 and 8 May 2014 were available, the variation pattern of the PM2.5 concentration before 7 May 2014 could not be analyzed. Therefore, the present study used the AEC data to analyze the time at which the tracer sources emitted pollutants. Figure 5 shows the hourly change in the AEC between 4 May 2014 and 9 May 2014. Figure 5 shows that the AEC exhibited a small peak (approximately 0.8 km−1) at 1700 UTC on 4 May and was less than 0.3 km−1 during the other time periods, indicating that it could be neglected. The AEC started to increase at 0800 UTC on 6 May and reached its peak at 2300 UTC on 6 May, after which it started to decrease and reached its minimum at 0800 UTC on 7 May. This minimum was greater than the AEC during the morning rush hours on 5 May, suggesting that other factors must have been contributing to the overall increase in the number of aerosol particles. Between 0800 UTC on 7 May and 0000 UTC on 8 May, the AEC exhibited a variation trend identical to that which occurred during the same time period on the previous day: reaching its peak (approximately 2.7 km−1) at 0000 UTC on 8 May, which was comparatively greater than the peak AEC on 6 May. After 0000 UTC on 8 May, the AEC gradually decreased and reached a valley at 0700 UTC, which was comparatively greater than the valley on 7 May. Thus, it can be concluded that the pollution was more severe on 8 May than on 7 May. The AEC on 9 May was lower than that on the previous two days, and the pollutants gradually dissipated. The AEC increased suddenly on 7 May and 8 May. Thus, it was inferred that external factors resulted in the significant increase in the number of aerosol particles on 7 May and 8 May. Based on the black carbon monitoring results, it was determined that straw was burned on 7 May and 8 May, and that the burning started at 0800 UTC on 6 May and 7 May.
Based on the AOD data inversion results, the backward trajectories of the pollutants in Chengdu and the AEC simulation results, it was inferred that straw-burning sites were located in Meishan, Ziyang, Neijiang, and Zigong, south of Chengdu, and that the burning started at 0800 UTC. The pollutants resulting from straw burning continuously converging in Chengdu, thereby resulting in the heavy pollution event. However, considering that Deyang and Suining are next to Chengdu, the AOD in most areas exceeded 1.4, and the GDAS data used in the backward trajectory simulations of the HYSPLIT model were of low resolution, the effect of pollutants originating in Deyang and Suining on this pollution event could not be excluded. Therefore, the present study simulated this pollution event using the areas with high AOD as the locations of the tracer sources (Figure 3). Carbon monoxide was used as the tracer gas for the simulation. The areas with an AOD greater than 1.4 in Deyang, Suining, Meishan, Ziyang, Neijiang, and Zigong were set as the areas where pollutants were emitted from the tracer sources. The emission intensity of the tracer sources was 100 mol/(km2·h) [23]. Additionally, the tracer sources were added at 0800 UTC on 6 May during the simulation period. Furthermore, a survey conducted by the environmental protection department of Chengdu revealed that no straw-burning sites were located in Chengdu [24]. Therefore, to trace the sources of the pollutants in Chengdu, the pollution sources in Chengdu were removed.

2.2.2. Design of the Simulation Scheme for the Heavy Pollution Transport Process

The present study simulated the atmospheric diffusion conditions for and the characteristics of pollutant transport during the heavy pollution event between 0000 UTC on 6 May and 0000 UTC on 9 May 2014, using WRF–CHEM. The FNL reanalysis data were used as the initial meteorological field data required by WRF–CHEM, and a three-layer nested structure was used for the simulation (Table 1). Figure 6 shows the simulation area. The center of the simulation area was located at 29.71°N, 101.79°E, and 20 unequally spaced layers were created vertically. The pressure at the top of the model was set to 50 hPa. The optimal parameter configuration for the typical pollution event was previously obtained through an experimental study [25]. The Weather Research and Forecasting single-moment 3-class scheme was selected for the microphysical process. The rapid radiative transfer model scheme was selected for longwave radiation. The Dudhia scheme was selected for shortwave radiation. The slab land surface model was used for the land surface process. The Mellor–Yamada–Janjic (MYJ) scheme was selected for the planetary boundary layer. The scheme used for the surface layer was combined with the MYJ boundary-layer scheme, and thus the Eta scheme was selected for the surface layer. The Grell–Devenyi scheme (with a closed third layer) was selected for cumulus parameterization. The chemistry tracer module within the chemistry module was initiated. Atmospheric chemical processes, such as gas-phase chemistry and aerosol evolution, were deactivated to emphasize the pollutant gas transport process.

3. Analysis of the Pollution Transport Process through Simulation Using WRF–CHEM

3.1. Analysis of the Conditions for Pollutant Diffusion

The height of the atmospheric boundary layer and wind speed within the atmospheric boundary layer reflect the capacity of the atmospheric turbulent flows within the boundary layer to diffuse pollutants. Zhang [26] defines the product of the height of the boundary layer and the mean wind speed within the boundary layer as the ventilation coefficient ( V H (unit: m2·s−1)), which represents the diffusion conditions in the atmospheric boundary layer. V H can be calculated using the following equation:
V H = i = 1 n U i ( Z i ) · Δ Z i
where n represents the number of vertical model layers within the height of the boundary layer, U i ( Z i ) represents the horizontal wind speed in each model layer within the boundary layer (m·s−1), and Δ z i represents the height of each model layer within the boundary layer (m).
The present study calculated the V H for Chengdu during the pollution event using the aforementioned equation. Figure 7 shows the distribution of the mean value of V H in the study area on 7 May 2014 and 8 May 2014. On 7 May, the mean V H over Meishan and Leshan in the central and southern regions of the study area was relatively low, and the V H over Chengdu’s city center was only 600 m2·s−1. Additionally, the diffusion capacity of the atmospheric boundary layer over the entire basin was relatively weak. On 8 May, Chengdu, Meishan, and Leshan in the area west of the Longquan Mountains had significantly low mean V H , with a value at the center of this area of less than 600 m2·s−1, thus indicating a weak capacity of the atmospheric turbulent flows within the boundary layer over this area to diffuse pollutants. Therefore, pollutants could not diffuse in a timely fashion and continuously accumulated in the area, thus resulting in a rapid increase in concentration.
Figure 8 shows the hourly change in the AEC and V H . During the heavy pollution period, the V H over Chengdu at night was extremely low at approximately 100 m2·s−1. The persistently poor diffusion conditions led to the continuous accumulation of pollutants at night. The AEC reached its peak value at approximately 0000 UTC on both 7 May and 8 May. After 0000 UTC, as solar radiation continuously increased and the boundary layer gradually rose, the V H continuously increased and reached its peak at approximately 0800 UTC. The change in V H was opposite that observed for the AEC. The AEC decreased to a minimum during the time period when the V H was highest. Thus, the V H could characterize the diffusion capacity of the atmosphere. The lower the V H , the more unfavorable the conditions for pollutant diffusion, and vice versa. Analysis of the hourly change in the thickness of the temperature inversion layer (Figure 9) indicated that this layer always occurred at night. On 6 May, the thickness of the temperature inversion layer gradually increased in the early morning and reached 200 m at 1900 UTC, which was maintained until 0000 UTC on 7 May. The thickness of the temperature inversion layer reached 100 m on the night of 8 May. The temperature inversion layer occurred for 11 h. During the heavy pollution event, the extremely low value of V H at night and relatively strong temperature inversion resulted in the continuous accumulation of pollutants, thereby causing the occurrence and development of atmospheric pollution.

3.2. Analysis of Pollutant Sources and Transport Characteristics

Figure 10 shows the simulated volume fraction of pollutants and hourly change in the PM2.5 concentration over Chengdu during the pollution event. The concentration of PM2.5 increased from the early morning of 7 May, reaching the first peak at 0000 UTC and the second peak at 0600 UTC. Subsequently, the PM2.5 concentration decreased rapidly and fluctuated after reaching the minimum. The PM2.5 concentration rapidly increased at 2100 UTC on 7 May and reached its maximum (375 µg/m3) at 0100 UTC, after which it continued to decrease. The volume fraction of pollutants started to increase at 1600 UTC on 6 May, which was consistent with the time point at which the PM2.5 concentration started to increase. Similar to the PM2.5 concentration, the volume fraction of pollutants also had two peaks in the early morning of 7 May. The volume fraction of pollutants started to increase at approximately 1600 UTC on 7 May and reached a peak at 0200 UTC on 8 May, after which it continuously decreased. The aforementioned analysis demonstrates a slight difference between the time at which the peaks in the volume fraction of pollutants and PM2.5 concentration occurred. This time difference was mainly caused by the exclusion of the local pollution sources in Chengdu in the simulation. However, the correlation coefficient between the hourly change in the volume fraction of pollutants and PM2.5 concentration reached 0.78, thus indicating that the volume fraction of pollutants and PM2.5 concentration had similar variation patterns. This result suggests that the transport of the pollutants resulting from straw burning was the main cause of the pollution event.

3.2.1. Horizontal Transport of Pollutants

Figure 11 shows the spatiotemporal change in the ground pollutants during the entire pollution event, simulated using WRF–CHEM. Figure 11a shows that the atmospheric diffusion conditions were poor at 1200 UTC on 6 May and that pollutants continuously accumulated near the ground. A weak convergence formed over Chengdu because of the convergence of a southerly airflow and an airflow directed from the mountains. Pollutants originating in Meishan were slowly transported to Chengdu by the southerly airflow, whereas pollutants originating in Ziyang, Neijiang, and Zigong were controlled by a northerly airflow and moved southward. The first peak period of the heavy pollution event occurred at 0000 UTC on 7 May. Figure 11b shows that pollutants originating in Ziyang, Neijiang, and Zigong diffused eastward and that pollutants originating in Meishan were the main pollution source affecting Chengdu during this period. Additionally, the wind speeds were low, and there were continuous southerly winds over the area. Consequently, the pollutants could not diffuse in a timely fashion. The pollutants originating in Meishan continued to be transported to Chengdu with the airflow. These aforementioned factors collectively led to the highly concentrated pollution. At 0400 UTC on 7 May (Figure 11c), because of the effect of a southerly airflow over Chengdu, the wind speed increased and boundary layer rose. As a result, the ground pollutants diffused northward with the airflow, and the concentration of pollutants decreased.
At 1200 UTC on 7 May (Figure 11d), the area near Chengdu was controlled by a southerly wind, and the pollutants from the area south of Chengdu continuously converged in Chengdu. Beginning at 2000 UTC on 7 May (Figure 11), the area north of Chengdu was controlled by a northerly wind, which converged with the southerly airflow from south of Chengdu over Chengdu at 2200 UTC, forming a significant convergence center. At 0000 UTC on 8 May (Figure 11e), the convergence center disappeared, and the airflows over Chengdu turned into a northerly airflow. The second peak period of the heavy pollution event occurred at 0000 UTC on 8 May. Figure 11e shows that the pollutants originating in Meishan and Deyang were the main external pollution sources during the second peak period of the heavy pollution event. The pollutants carried by the southerly airflow before 2200 UTC on 7 May mainly accumulated in southern Chengdu. Controlled by the northerly airflow, the pollutants originating in Deyang moved to Chengdu. The accumulation in Chengdu of the pollutants originating in Meishan and Deyang collectively led to the second high-concentration pollution event. The daily mean concentration of black carbon was comparatively higher on 8 May than 7 May (Figure 1), indicating that straw-burning sites were also present in Deyang. At 0400 UTC on 8 May (Figure 11f), the northerly airflow intensified, and the pollutants gradually dissipated.

3.2.2. Vertical Transport of Pollutants

The backward trajectory results and horizontal distribution of pollutants simulated using WRF–CHEM indicated that the pollutants originating in Meishan and Deyang were the main pollution sources of the heavy pollution event. The backward trajectory results show that the airflows at 1000 m mainly originated from the direction of Ziyang. Therefore, the present study analyzed the vertical pollutant diffusion along lines AB and CD shown in Figure 6b. The profile in the AB direction (Figure 12) shows that the Longquan Mountains (altitude: approximately 1000 m) separate Chengdu and Ziyang, and primarily easterly airflows occurred at 1000 m over Ziyang during the heavy pollution event; however, the vertical diffusion capacity of the atmosphere was relatively weak, and the pollution layer at 1000 m was essentially nonexistent. The pollutants originating in Ziyang could not cross the Longquan Mountains and, therefore, had no significant effect on Chengdu.
Figure 13 shows the mean height of the boundary layer in the area where line CD (Figure 6b) was located in the simulated inner area. The height of the boundary layer was greater in this area during the day than at night. The height of the boundary layer at night was below 200 m, which was unfavorable for pollutant diffusion. Beginning at 0000 UTC, the boundary layer rose, and the diffusion capacity of the atmosphere increased. After 1000 UTC, the boundary layer gradually lowered. The height of the boundary layer at night on 8 May was greater than that on 7 May. The height of the boundary layer during the day on 8 May decreased by approximately 300 m compared to that on 7 May.
Figure 14 shows the vertical profile of the volume fraction of pollutants and the wind along line CD shown in Figure 6b. The pollutants were concentrated within the boundary layer, and there were few pollution layers above 1000 m. At 0000 UTC on 7 May (Figure 14a), there were consistent southerly airflows from the ground to 1700 m. The pollutants originating in Leshan and Meishan diffused along the airflow direction. The mean height of the boundary layer, through which line CD passes, was approximately 150 m (Figure 13). Limited by the boundary layer, the pollutants were concentrated in the ground layer. During this time period, the diffusion capacity of the atmosphere over Chengdu was poor, and the temperature inversion near the ground had not dissipated. Additionally, pollutants continuously accumulated, and a high-pollution center appeared in south Chengdu. At 0400 UTC on 7 May, the mean height of the boundary layer increased to 1000 m, the diffusion capacity of the atmosphere over Chengdu increased, and there were consistent southerly winds within the boundary layer. The pollutants were also transported by the turbulent flows to the top of the boundary layer while diffusing northward, and the concentration of pollutants near the ground decreased (Figure 14b). Between 1800 UTC and 2200 UTC on 7 May (Figure 14), the southerly wind in the ground layer gradually turned into a northerly wind. At 0000 UTC on 8 May, the ground layer was controlled by the northerly airflow, and the wind speed in the ground layer increased to some extent compared to that on 7 May. Pollution centers were located in the southern and northern areas of Chengdu. The pollution concentration in the northern center was relatively high, and the pollution layer in the northern center was significantly higher than that in the southern center. The pollutants originating in Deyang were the notable contributor to the pollution in Chengdu on 8 May (Figure 14c). Figure 14d shows that the concentration of pollutants in Chengdu decreased as the boundary layer rose at 0400 UTC; however, the height of the boundary layer during the day on 8 May was significantly lower than that on 7 May. Therefore, the concentration of pollutants in Chengdu at 0400 UTC on 8 May remained higher than that at 0400 UTC on 7 May (Figure 10).
The aforementioned analysis indicates that the transport of pollutants resulting from straw burning was the leading cause of the typical pollution event. The pollutant transport process was mainly concentrated within 1000 m. During the typical pollution event, the mean value of V H in Chengdu, Meishan, and Leshan was relatively low, and the diffusion capacity of the atmosphere over the aforementioned areas was relatively weak. On 7 May, the pollutants originating in Meishan were continuously transported to Chengdu. The extremely low value of V H in Chengdu at night and the relatively strong temperature inversion resulted in the large accumulation of pollutants in the ground layer, thereby causing the high-concentration pollution event on the morning of 7 May. On 8 May, the pollutants originating in Meishan and Deyang converged in Chengdu. The pollutants originating in Deyang were the notable contributor to the worsening pollution in Chengdu on 8 May. The pollutants could not diffuse because of the relatively low height of the boundary layer during the day on 8 May. Therefore, the pollution concentration on 8 May was higher than that on 7 May.

4. Conclusions

The present study established the tracer sources required for the simulation based on the AOD data obtained from the following: inversion of HJ-1 satellite data, backward trajectories simulated using the HYSPLIT model and MPL AEC data. Additionally, the present study also analyzed a typical heavy pollution event that occurred in Chengdu in early May 2014 using a mesoscale atmospheric chemistry transport model—WRF–CHEM. The main conclusions of the present study are as follows:
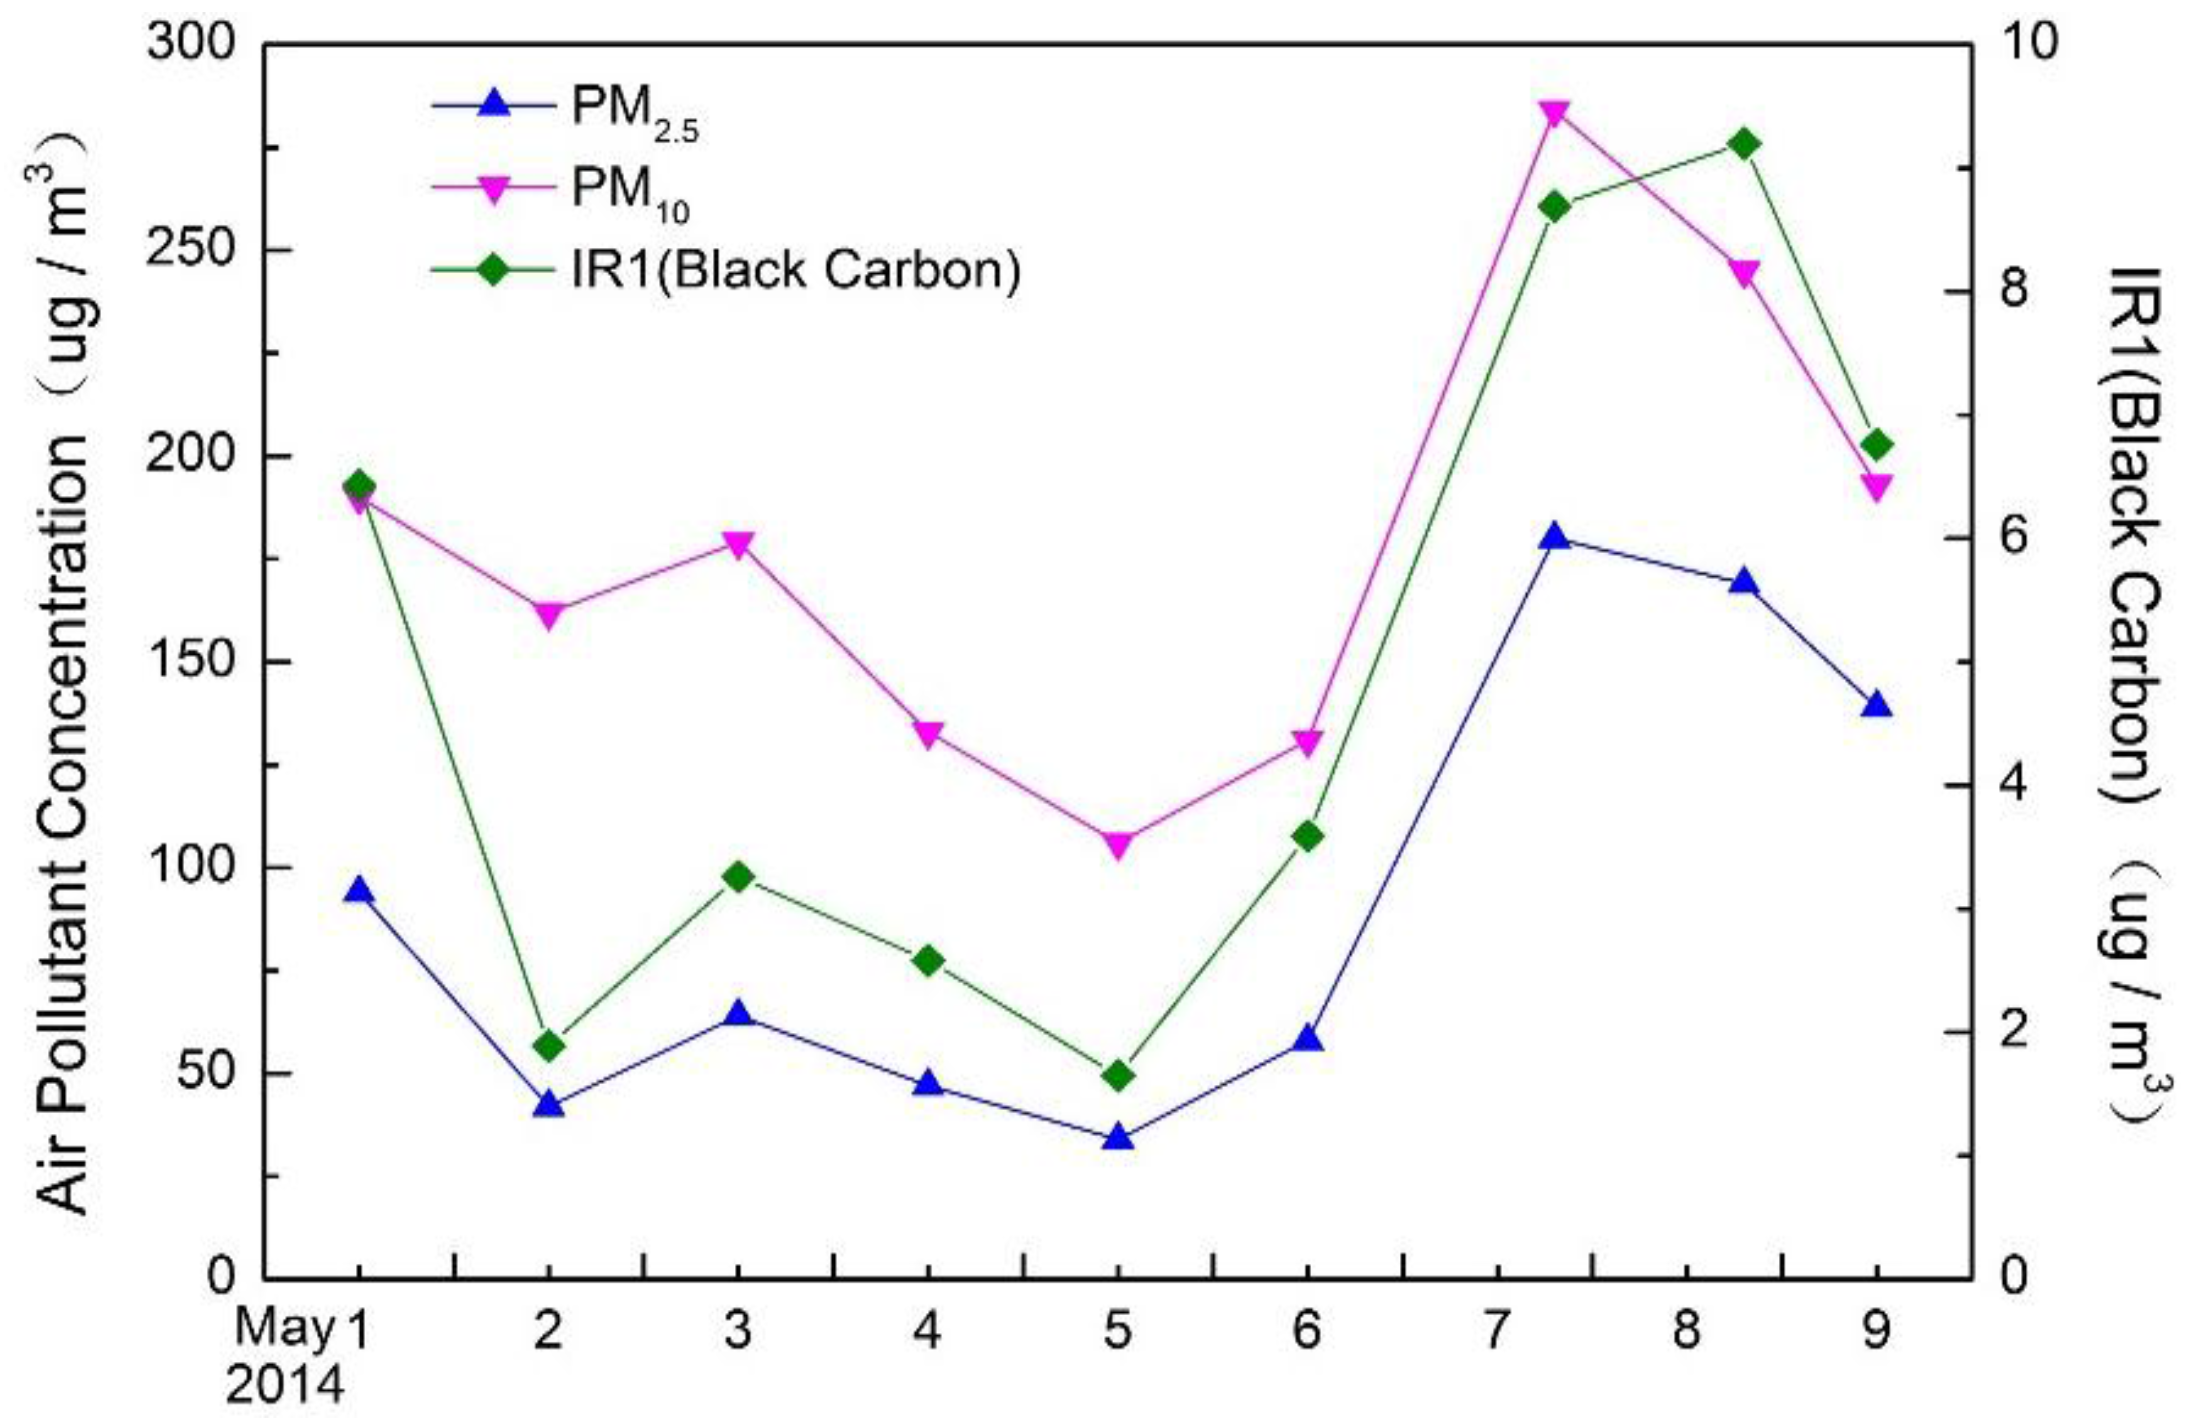
  • The multisource remote sensing data indicated that the regional transport of pollutants resulting from straw burning was the direct cause of the heavy air pollution event that occurred in Chengdu between 7 May 2014 and 8 May 2014. There were straw-burning sites in Meishan, Ziyang, Neijiang, and Zigong, south of Chengdu, beginning at 0800 UTC on 6 May and 7 May.
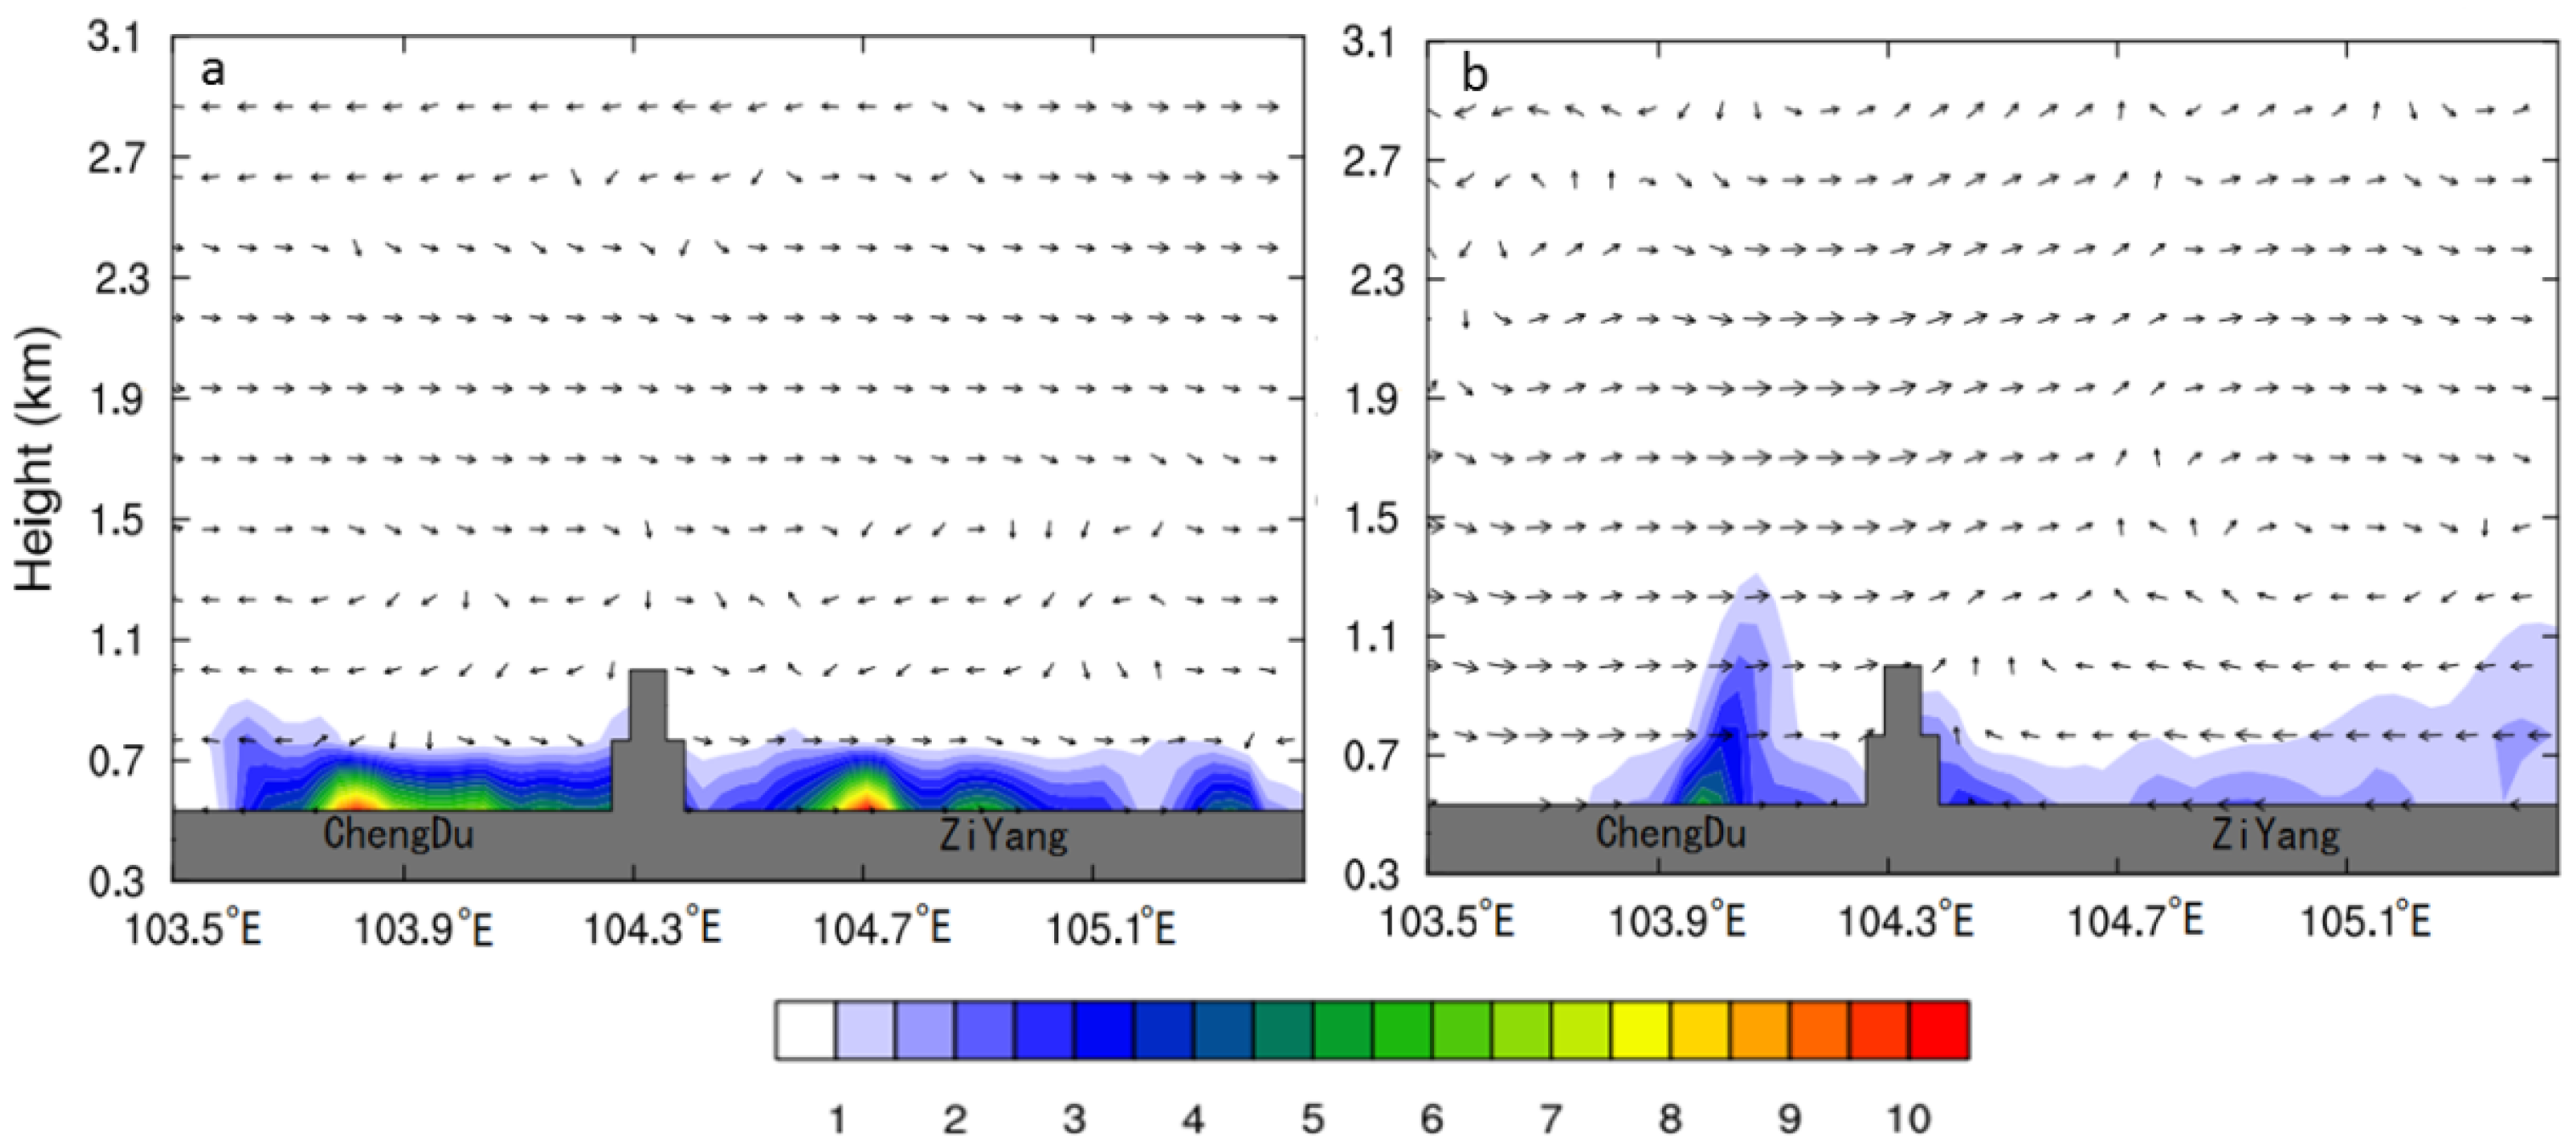
  • The numerical simulation results indicated that Chengdu, Meishan, and Leshan were areas with significantly low mean V H during the typical pollution event. The V H in Chengdu at night was extremely low, and there was a continuous temperature inversion near the ground in Chengdu. The unfavorable meteorological conditions for diffusion were a key factor in the maintenance and worsening of the pollution event. The change in the boundary layer height over Chengdu had a relatively large effect on vertical pollutant diffusion. The boundary layer was low at night, and the capacity of the atmosphere to vertically diffuse pollutants was poor. Therefore, pollutants were essentially concentrated in the ground layer. During the day, as the boundary layer continuously rose, the capacity of the atmosphere to vertically diffuse pollutants increased, and the concentration of pollutants near the ground consequently decreased.
The remote sensing data and numerical simulation results indicated that the pollutants resulting from straw burning in Meishan and Deyang were the main pollution source of the pollution event. On 7 May, the pollutants in Chengdu mainly originated from Meishan. The accumulation in Chengdu of pollutants originating in Meishan and Deyang resulted in the highly concentrated pollution on 8 May, to which the pollutants originating in Deyang were the notable contributor.

Acknowledgments

This work is financially supported by grants from the Air Pollution Prevention and Control Countermeasures of Sichuan and Chengdu Region (2013HBZX03), the Environmental Protection Science and Technology Program Project in Sichuan Province in 2015 (the Air Pollution Prevention and Control Countermeasures of Southern Sichuan).

Author Contributions

All authors made great contributions to the work. Ying Zhang and Zhihong Liu conceived and designed the experiments, analyzed the data and model results and wrote the article. Yang Zhang performed the AOD algorithm research. Xiaotong Lv and Jun Qian examined the experimental data and checked the experimental results. All authors agreed to the submission of the manuscript.

Conflicts of Interest

The authors declare no conflict of interest.

References

  1. Xue, W.; Fu, F.; Wang, J.N.; Tang, G.Q.; Lei, Y.; Yang, J.T.; Wang, Y. Numerical study on the characteristics of regional transport of PM2.5 in China. China Environ. Sci. 2014, 34, 1361–1368. [Google Scholar]
  2. Wang, L.; Xu, J.; Yang, J.; Zhao, X.; Wei, W.; Cheng, D.; Pan, X.; Su, J. Understanding haze pollution over the southern Hebei area of China using the CMAQ model. Atmos. Environ. 2012, 56, 69–79. [Google Scholar] [CrossRef]
  3. He, H.; Tie, X.; Zhang, Q.; Liu, X.; Gao, Q.; Li, X.; Gao, Y. Analysis of the causes of heavy aerosol pollution in Beijing, China: A case study with the WRF-Chem model. Particuology 2015, 20, 32–40. [Google Scholar] [CrossRef]
  4. Cheng, N.L.; Zhang, D.W.; Li, Y.T.; Chen, T.; Li, J.X.; Dong, X.; Sun, R.W.; Meng, F. Analysis about Spatial and temporal distribution of SO2 and an ambient SO2 pollution process in Beijing during 2000–2014. Environ. Sci. 2015, 36, 3961–3971. [Google Scholar]
  5. Zhu, B.; Su, J.; Han, Z.; Yin, C.; Wang, T.J. Analysis of a serious air pollution event resulting from crop residue burning over Nanjing and surrounding regions. China Environ. Sci. 2010, 30, 585–592. [Google Scholar]
  6. Cesari, D.; Donateo, A.; Conte, M.; Merico, E.; Giangreco, A.; Giangreco, F.; Contini, D. An inter-comparison of PM2.5 at urban and urban background sites: Chemical characterization and source apportionment. Atmos. Res. 2016, 174–175, 106–119. [Google Scholar]
  7. Aldabe, J.; Elustondo, D.; Santamaría, C.; Lasheras, E.; Pandolfi, M.; Alastuey, A.; Querol, X.; Santamaría, J.M. Chemical characterisation and source apportionment of PM2.5 and PM10 at rural, urban and traffic sites in Navarra (North of Spain). Atmos. Res. 2011, 102, 191–205. [Google Scholar]
  8. Wang, Z.; Li, Q.; Tao, J.; Li, S.; Wang, Q.; Chen, L. Monitoring of aerosol optical depth over land surface using CCD camera on HJ-1 satellite. China Environ. Sci. 2009, 29, 902–907. [Google Scholar]
  9. Zhang, Y.; Liu, Z.; Wang, Y.; Ye, Z.; Leng, L. Inversion of aerosol optical depth based on the CCD and IRS sensors on the HJ-1 satellites. Remote Sens. 2014, 6, 8760–8778. [Google Scholar] [CrossRef]
  10. Zhang, Y.; Liu, Z.; Ye, Z.; Leng, L. Refined inversion of aerosol optical depth of Sichuan basin based on HJ-1 satellite data. Sichuan Environ. 2014, 33, 29–35. [Google Scholar]
  11. Deng, T.; Wu, D.; Deng, X.; Tan, H.; Li, F.; Liao, B. A vertical sounding of severe haze process in Guangzhou area. Sci. China Earth Sci. 2014, 57, 2650–2656. [Google Scholar] [CrossRef]
  12. Ma, J.; Gu, S.; Chen, M.; Shi, H.; Zhang, G. Analysis of a dust case using Lidar in Shanghai. Acta Ecol. Sin. 2012, 32, 1085–1096. [Google Scholar]
  13. Huang, J.; Yan, P.; Roland, R. Using HYSPLIT_4 dispersion model to analyze the variations of surface SO2 in Zhuhai region. J. Trop. Meteorol. 2002, 18, 407–414. [Google Scholar]
  14. Draxler, R.R.; Hess, G.D. An overview of the HYSPLIT-4 modeling system for trajectories. Aust. Meteorolog. Mag. 1998, 47, 295–308. [Google Scholar]
  15. Sessions, W.R.; Fuelberg, H.E.; Kahn, R.A.; Winker, D.M. An investigation of methods for injecting emissions from boreal wildfires using WRF-Chem during ARCTAS. Atmos. Chem. Phys. 2010, 11, 5719–5744. [Google Scholar] [CrossRef] [Green Version]
  16. Grell, G.; Freitas, S.R.; Stuefer, M.; Fast, J. Inclusion of biomass burning in WRF-Chem: Impact of wildfires on weather forecasts. Atmos. Chem. Phys. 2011, 11, 5289–5303. [Google Scholar] [CrossRef]
  17. Jiang, F.; Liu, Q.; Huang, X.; Wang, T.; Zhuang, B.; Xie, M. Regional modeling of secondary organic aerosol over China using WRF/Chem. J. Aerosol Sci. 2012, 43, 57–73. [Google Scholar] [CrossRef]
  18. Saide, P.E.; Carmichael, G.R.; Spak, S.N.; Gallardo, L.; Osses, A.E.; Mena-Carrasco, M.A.; Pagowski, M. Forecasting urban PM10 and PM2.5 pollution episodes in very stable nocturnal conditions and complex terrain using WRF–Chem CO tracer model. Atmos. Environ. 2011, 45, 2769–2780. [Google Scholar]
  19. Li, S.; Jiang, X.; Tong, H.; Deng, L.; Yang, K.; Qian, J. Study on the numerical simulation of PM2.5 in Chengdu Chongqing economic zone based on air quality model system CMAQ. Sichuan Environ. 2013, 32, 109–113. [Google Scholar]
  20. Chen, Y.; Xie, S.; Luo, B. Composition and pollution characteristics of fine particles in Chengdu from 2012 to 2013. Acta Sci. Circumst. 2016, 36, 1021–1031. [Google Scholar]
  21. He, M.; Wang, X.; Han, L.; Feng, X.; Mao, X. Emission inventory of crop residues field burning and its temporal and spatial distribution in Sichuan Provence. Environ. Sci. 2015, 36, 1208–1216. [Google Scholar]
  22. Zhang, Y.; Liu, Z.; Yu, M.; Ye, B.; Leng, L. Spatial and temporal distribution characteristic of aerosol optical depth in Sichuan. Sichuan Environ. 2014, 03, 48–53. [Google Scholar]
  23. Jin, Q.; Yin, Y.; Tan, W. Numerical simulation of transport process of pollution gases over the complex terrain of Mountain Huang region. Trans. Atmos. Sci. 2012, 35, 680–688. [Google Scholar]
  24. Sichuan Provincial People’s Government. Available online: http://www.sc.gov.cn/10462/10464/10594/10602/2014/5/9/10301249.shtml (accessed on 9 May 2014).
  25. Zhang, Y.; Liu, Z.; Lv, X.; Qian, J.; Xiang, W. Optimal configuration of WRF model parameterized schemes during a pollution episode in Sichuan Basin. Acta Sci. Circumst. 2016, 36, 2819–2826. [Google Scholar]
  26. Zhang, B. A Simulation Study on the Structure of the Urban Boundary Layer and the Diffusion of SO2 Pollutants over Shenyang; Peking University: Beijing, China, 2011; pp. 92–97. [Google Scholar]
Figure 1. Daily concentration of pollutants in Chengdu between 1 May 2014 and 9 May 2014, extracted from ground-based monitoring data of an automatic air-monitoring substation in Sichuan Province (30.63°N, 104.07°E).
Atmosphere 07 00127 g001
Figure 2. The locations of the automatic air-monitoring substation in Sichuan Province and the comprehensive substation at the Chengdu University of Information Technology (notes: the red dot signifies the automatic air monitoring substation in Sichuan Province, and the green dot signifies the comprehensive substation at the Chengdu University of Information Technology).
Atmosphere 07 00127 g002
Figure 3. Aerosol optical depth (AOD) in the Sichuan Basin and backward trajectories of air mass transport over Chengdu (30,500 and 1000 m). Note: the AOD data originated from the data acquired by the HJ-1 satellite on 7 May 2014.
Atmosphere 07 00127 g003
Figure 4. Hourly change in the aerosol extinction coefficient (AEC) data for Chengdu and the observed PM2.5 (particulate matter less than 2.5 µm in diameter) concentration during the pollution event.
Atmosphere 07 00127 g004
Figure 5. Hourly change in the AEC from 1600 UTC on 4 May 2014, to 1600 UTC on 9 May 2014. Note that 0000 UTC is the same 0800 local sidereal time (LST).
Atmosphere 07 00127 g005
Figure 6. The three nested areas (a) and innermost area (b) of simulation using weather research forecasting model with chemistry (WRF–CHEM) (notes: the red dot in (b) signifies the automatic air monitoring substation in Sichuan Province, and the green dot in (b) signifies the comprehensive substation at the Chengdu University of Information Technology).
Atmosphere 07 00127 g006
Figure 7. Distribution of the mean ventilation coefficient V H (m2·s−1) on 7 May 2014 (a) and 8 May 2014 (b).
Atmosphere 07 00127 g007
Figure 8. Hourly change in the AEC and V H over Chengdu during the pollution event (notes: the volume fraction of pollutants was the simulation result obtained based on the mesh closest to the comprehensive substation at the Chengdu University of Information Technology).
Atmosphere 07 00127 g008
Figure 9. Hourly change in the thickness of the temperature inversion layer over Chengdu during the pollution event (notes: the thickness of the temperature inversion layer was the simulation result obtained based on the mesh closest to the comprehensive substation at the Chengdu University of Information Technology).
Atmosphere 07 00127 g009
Figure 10. Hourly change in the simulated volume fraction of pollutants (10−4) and observed PM2.5 concentration in Chengdu during the pollution event (notes: the volume fraction of pollutants was the simulation result obtained based on the mesh closest to the comprehensive substation at the Chengdu University of Information Technology).
Atmosphere 07 00127 g010
Figure 11. Spatiotemporal change in the volume fraction of ground pollutants (10−4) and the 10-m wind field (m·s−1) in the study area: (a) 1200 UTC on 6 May; (b) 0000 UTC on 7 May; (c) 0400 UTC on 7 May; (d) 1200 UTC on 7 May; (e) 0000 UTC on 8 May; and (f) 0400 UTC on 8 May.
Atmosphere 07 00127 g011
Figure 12. Vertical profile of the volume fraction of pollutants (10−4) and wind (m·s−1) (along line AB in Figure 6b): (a) 0000 UTC on 7 May and (b) 1800 UTC on 7 May. Note: the gray shaded area signifies the topography.
Atmosphere 07 00127 g012
Figure 13. Mean height of the boundary layer in the area where line CD (Figure 6b) was located in the simulated inner area.
Atmosphere 07 00127 g013
Figure 14. Vertical profile of the volume fraction of pollutants (10−4) and wind (m·s−1) (along line CD in Figure 6b): (a) 0000 UTC on 7 May; (b) 0400 UTC on 7 May; (c) 0000 UTC on 8 May; and (d) 0400 UTC on 8 May. Note: the gray shaded area signifies the topography.
Atmosphere 07 00127 g014
Table 1. Design of the model simulation areas.
AreasMesh NumbersSpacing (km)
Dom1109 × 6827
Dom2136 × 1069
Dom3130 × 1053

