
Retrieval of Aerosol Optical Depth over Arid Areas from MODIS Data


1
College of Global Change and Earth System Science, Beijing Normal University, Beijing 100875, China
2
Geomatics College, Shandong University of Science and Technology, Qingdao 266590, China
*
Author to whom correspondence should be addressed.
Atmosphere 2016, 7(10), 134; https://doi.org/10.3390/atmos7100134
Submission received: 23 July 2016
/
Revised: 5 October 2016
/
Accepted: 12 October 2016
/
Published: 16 October 2016
(This article belongs to the Special Issue Atmospheric Aerosols and Their Radiative Effects)
Abstract
:Moderate Resolution Imaging Spectroradiometer (MODIS) data have been widely applied for the remote sensing of aerosol optical depth (AOD) because the MODIS sensor features a short revisit period and a moderate spatial resolution. The Dense Dark Vegetation (DDV) method is the most popular retrieval method. However, the DDV method can only be used to retrieve the AOD with high precision when the surface reflectance in the visible spectrum is low, such as over dense vegetation or water. To obtain precise AOD values in areas with higher reflectance, such as arid areas, Land Surface Reflectance (LSR) must be estimated accurately. This paper proposes a method of estimating LSR for AOD retrieval over arid areas from long-term series of MODIS images. According to the atmospheric parameters (AOD and water vapor), the clearest image without clouds was selected from the long-term series of continuous MODIS images. Atmospheric correction was conducted based on similar ground-measured atmospheric parameters and was used to estimate the LSR and retrieve the AOD at adjacent times. To validate this method, aerosol inversion experiments were performed in northern Xinjiang, in which the inverted AOD was compared to ground-measured AOD and MODIS aerosol products (MOD04). The AOD retrieved using the new algorithm was highly consistent with the AOD derived from ground-based measurements, with a correlation coefficient of 0.84. Additionally, 82.22% of the points fell within the expected error defined by NASA. The precision of the retrieved AOD data was better than that of MOD04 AOD products over arid areas.
1. Introduction
Because of their excellent abilities to absorb and scatter short-wavelength solar radiation, aerosols are important in the radiant energy balance of the earth–atmosphere system and greatly influence regional weather variations and global climate change. In addition, because aerosols originate from diverse sources, have complex compositions, and are affected by human and natural activities, determination of their optical properties and spatial-temporal variations is difficult.
The use of inversion methods in aerosol remote sensing dates back to the 1970s, and several inversion algorithms have been developed. The first algorithms mainly focused on areas with low surface reflectance. For example, Griggs [1] and Mekler et al. [2] determined the distribution of aerosols above terrestrial water areas using Earth Resources Technology Satellite (ERTS) data; Griggs [3] studied aerosols over the Mediterranean Sea and Atlantic Ocean using National Oceanic and Atmospheric Administration (NOAA) 5 and Geostationary Operational Environmental Satellites (GOES) data; and Nagaraja et al. [4] applied an aerosol operational method for areas over oceans using NOAA’s Advanced Very High Resolution Radiometer (AVHRR) data. Based on previous research, Durkee et al. [5] proposed a multi-channel aerosol retrieval algorithm with improved precision. For aerosol remote sensing inversion over land surfaces, a dense vegetation area with lower visible light reflectance, called dense dark vegetation (DDV), was selected as the application area. After several stages of development, the DDV method has since been widely used for data from multiple satellite sensors and has resulted in several high-quality aerosol optical depth (AOD) products. The DDV method was first proposed by Kaufman and Sendra [6] based on the vegetation index determined from Landsat Multispectral Scanner Systems (MSS) data. Using this method, Holben et al. [7] retrieved the AOD over the southern Amazon rainforest from AVHRR data. Dense vegetation pixels were identified using the Normalized Difference Vegetation Index (NDVI) and assigned a fixed value of surface reflectance. The main limitation of this method is that the NDVI decreases rapidly with increasing AOD. When the AOD is greater than 1.5, the corresponding NDVI is less than 0.3; therefore, it is difficult to obtain an accurate AOD using this method [8]. Moreover, the reflectance of dense vegetation varies widely across different types of vegetation. Kaufman et al. [9] found that the surface reflectance of dense vegetation in the red (0.66 μm) and blue (0.47 μm) bands is correlated with the reflectance of the shortwave infrared band (2.1 μm). The surface reflectance in the shortwave infrared band can be replaced by its apparent reflectance because it is less affected by the atmosphere. An improved method was successfully applied to produce MODIS aerosol products due to the higher accuracy of MODIS data in Collection 4 (C4). Levy et al. [10] filtered dark pixels using shortwave infrared NDVI in the Collection 5 (C5) inversion algorithm, which significantly improved the accuracy by considering the scattering angle [10,11,12]. However, the retrieved AOD values were higher than the ground-measured values [13]. The current Collection 6 (C6) product uses the Deep Blue algorithm [14,15] over bright surfaces and has resulted in large improvements in continuity [16,17].
Low surface reflectance values allow good discrimination between the aerosol path radiance and the land surface radiance. However, high surface reflectance values make this discrimination difficult because the aerosol path radiance is often lower than surface radiance. As surface reflectance increases, it becomes more difficult to obtain accurate levels of aerosol inversion over arid areas. The retrieval of aerosols is more difficult in arid areas than in areas of dense vegetation. However, the radiation received by the satellite can provide a distinction between radiation from aerosols and from the surface [18,19]; consequently, the identification of aerosols in this region is limited only by the accuracy of the surface reflectance determination. Sun [20] proposed a method for improving surface reflectance accuracy by building a surface reflectance model over arid areas to support AOD remote sensing using the Huanjing-1 (HJ-1) satellite, which provides charge-coupled device (CCD) images of China. However, the accuracy of AOD inversion decreased because the adopted surface reflectance data were taken from historical data that were affected by temporal differences. Moreover, spectral differences associated with different sensors in the same band affect the surface reflectance. We obtained MODIS and HJ CCD data with blue band reflectance values of 0.0611 and 0.0584, respectively, using vegetation spectral data from the United States Geological Survey (USGS) and the spectral response functions of the two sensors.
By focusing on the problems associated with the current methods of AOD inversion over arid areas, this paper proposes a method for estimating land surface reflectance (LSR) in arid areas to facilitate AOD retrieval from MODIS data. The clearest image was selected based on atmospheric conditions from a series of continuous MODIS data with matching spatial characteristics and adjacent times. Atmospheric correction was performed based on ground-measured atmospheric parameters and then used to estimate the LSR for AOD retrieval. Compared to the traditional method, the new method effectively decreases the influences of mixed pixels and is more reliable when determining the surface reflectance of a pixel. In addition, the surface reflectance information and the images from which the AOD is retrieved were obtained from MODIS images that all have the same spectral characteristics; therefore, this method eliminates the surface reflectance error caused by spectral differences. Furthermore, the advantages of using this method over arid areas include the following: (1) the surface reflectance variation is relatively small because vegetation grows slowly in arid areas; and (2) the directional reflectance has little impact because arid areas have low vegetation coverage.
2. Fundamentals and the Algorithm
2.1. Fundamentals
Aerosol remote sensing over land is usually performed using the visible waveband, which has a shorter wavelength and is sensitive to aerosol scattering. In the visible waveband, the top of the atmosphere (TOA) radiance measured by a satellite sensor is a function of the solar and view zenith and azimuth angles, and it can be estimated using Equation (1):
where is the atmospheric optical depth resulting from gas molecules and aerosol particles; is the path radiance that is produced by scattering of the particles and gas molecules in the atmosphere; is the surface reflectance; is an atmospheric backscattering ratio to account for the multiple reflection between the surface and atmosphere; is the transmittance from the ground to the TOA; is the transmittance from the top to the ground; and are the cosine of the solar zenith angle and the cosine of the view zenith angle, respectively; and is the relative azimuth angle between the solar and view angles.
The energy sources of the apparent reflectance or radiance values acquired by the satellite sensor can be divided into two parts: the purely atmospheric contribution, which is addressed in the first part of Equation (1), and a combined atmosphere and land surface contribution, which is addressed in the second part of Equation (1). The first part of Equation (1) corresponds to small surface reflectance values because aerosols mainly influence the electromagnetic waves in the visible waveband; thus, the reflectance values are sensitive to aerosol variations. This relationship also explains why the identification of aerosols from remote sensing data is more accurate over oceans and why aerosol data collection from the red and blue bands improves with increasing vegetation coverage over land.
Figure 1 shows the spectral curves obtained from the visible to near-infrared (NIR) bands of several typical land features (vegetation, sand, soil, water, and rock) extracted from the USGS spectral library. In the visible waveband, water and vegetation have lower reflectance values, with a reflectance <0.08 for water in all the experimental bands. In addition, the reflectance of healthy vegetation is <0.06 in the red and blue bands, while soil and sand have relatively higher reflectance values of 0.10 and 0.17, respectively.
The 6S (Second Simulation of the Satellite Signal in the Solar Spectrum) basic radiative transfer model is used to simulate satellite observations that consider elevated targets, molecular and aerosol scattering and gaseous absorption (including H2O, O3, CO2, etc.) [21]. Figure 2 shows the simulation results of the sensitivity of the apparent reflectance and AOD under different conditions: (1) the spectral parameters are the MODIS blue and red bands; (2) the geometric parameters are ; (3) The surface reflectance range of the red and blue bands is 0.001–0.20, and this range includes most typical land features, excluding ice and snow; and (4) the 6S model defines the commonly used aerosol models, including urban/industrial, continental, desert, and biomass-burning aerosol models. These parameters were chosen to simulate the sensitivity of the AOD, and the results are shown in Figure 2.
As shown in Figure 2, the urban/industrial aerosol model exhibited a significant damping effect because the Ångström index was generally larger than 1.1 [22], and the aerosol particles influence the propagation of electromagnetic waves [23]. Because this study considers the arid area of Northwest China, the main type of land cover is desert, with a small amount of farmland. The analysis results from desert, continental and biomass-burning aerosol models are shown in Figure 2. When the surface reflectance of the blue band is high (~0.20), the slope of the simulated curve becomes smaller (Figure 2A,C); thus, the satellite apparent reflectance is not sensitive to changes in the AOD. A similar situation occurs when the surface reflectance in the red band is greater than 0.15 (Figure 2B,D). In other words, when the surface reflectance of the blue or red band is smaller than a certain threshold value, the aerosol path radiance and the radiance of the land surface can be identified in the satellite signal, but their degrees are lower than the low surface reflectance. To guarantee the accuracy of AOD retrieval, and based on the surface reflectance distribution in Figure 1, only the blue band reflectance values less than 0.12 and the red band reflectance values less than 0.15 were considered.
The MODIS DDV algorithm over land primarily uses three spectral channels centered at wavelengths of 0.47, 0.66, and 2.13 µm. The surface reflectance of the red and blue bands is obtained by two empirical relationships [9] ( and ) developed for use over vegetated surfaces. In addition, to minimize the error, was limited to less than 0.25. Therefore, the surface reflectance ranges in the red and blue bands were limited to and , respectively. In addition, areas beyond this range cannot be retrieved with high precision because the ability to identify aerosols from the radiance (or apparent reflectance) decreases, making it difficult to determine the surface reflectance [14].
2.2. Inversion Algorithm
A clear image was selected from a series of MODIS data taken at adjacent times to provide surface reflectance information. Clear images were selected based on ground measurements with small AODs, few clouds and stable atmospheric conditions. The observation sites were reasonably distributed throughout the research region, and the AOD data were obtained from the images via interpolation. Then, after atmospheric correction, the surface reflectance was acquired and applied to AOD remote sensing using other images after spatial matching. The surface reflectance was calculated using Equation (2):
After acquiring the surface reflectance using Equation (2) and substituting it into Equation (1), all atmospheric contributions, including the atmospheric aerosols and molecules within the visible wavelength range, were obtained, where the Rayleigh scattering of the atmospheric molecules was relatively important at longer wavelengths [24]. To extract the aerosol information, the atmospheric molecular Rayleigh scattering effect was removed using Equation (3), which results in the AOD ():
At sea level, the Rayleigh optical thickness (ROT) over the visible light wavelength can be estimated as a function of the wavelength [25]:
At a given height above sea level, the ROT can be determined as a function of atmospheric pressure or elevation [26]:
where z is the elevation of the ground above sea level in kilometers (km) and 8.5 is the exponential scale height of the atmosphere.
This paper utilizes high-temporal resolution MODIS data. Based on the atmospheric parameters from ground–measured data, after selecting a clear image from the MODIS images, the surface reflectance can be obtained using the atmospheric corrections described above. Then, the aerosol optical parameters (the single scattering albedo is 0.827, and the asymmetry factor is 0.910) in the study area are retrieved using sun photometric data, and the 6S model is used to construct a Look-Up table (LUT). To eliminate the influence of Rayleigh scattering on atmospheric molecules, a digital elevation model (DEM) based on the MODIS geolocation product data (MOD03) was used to estimate the height (z) and calculate for each pixel. A Rayleigh correction was applied only to land pixels, and water pixels were masked based on the land mask data from the MOD03 product. The flow chart in Figure 3 shows the procedure for retrieving AOD from MODIS data.
2.3. Look-Up Tables
To quickly and conveniently calculate AOD using the radiative transfer equation, an LUT was constructed using the 6S model. All of these methods rely on LUTs and require several parameters, such as observation geometry, atmospheric conditions, aerosol parameters, and surface reflectance.
- (1)
- Observation geometry. During satellite imaging, the geometric relationship between the sun, target, and satellite can be described by the solar zenith angle, solar azimuth, viewing zenith angle, and viewing azimuth. The sun and viewing azimuths can be described by their relative azimuths. In addition, based on a simulation of the analytical sensitivity between the angle and satellite apparent reflectance provided by the 6S model, three angle parameters were set: the solar zenith angle and viewing zenith angle were set 0°–80° with a step size of 5° and 17 parameters, and the relative azimuth angle was set from 0° to 180° with a step size of 10° and 19 parameters.
- (2)
- Atmospheric conditions. According to the geographical position of the research region and the imaging time, the atmospheric conditions in the LUT were set to those of the mid-latitudes during summer. The default values in the atmospheric model in 6S, including ozone, carbon dioxide, carbon monoxide, and nitrous oxide, were used for the atmospheric parameters.
- (3)
- Aerosol parameters. In accordance with the general range of the AOD and its inversion accuracy, the following 15 parameters were set: 0.01, 0.05, 0.1, 0.2, 0.3, 0.4, 0.5, 0.6, 0.7, 0.8, 0.9, 1.0, 1.2, 1.5, and 2.0. The continental mode was selected based on practical considerations.
- (4)
- Surface reflectance. By considering the land surface a Lambertian surface and by ignoring the effect of the Bidirectional Reflectance Distribution Function (BRDF), the surface reflectance ranges of the red and blue bands were between 0.0 and 0.12 and 0.0 and 0.15, respectively, and both were set to an interval of 0.01 in the LUT.
3. Data Source and Experimental Area
MODIS sensors are located on the sun-synchronous polar satellites Terra and Aqua, which pass over the study area at 10:30 a.m. and 1:30 p.m. local time, respectively. Daily coverage is achieved at high latitudes (above 30°). MODIS has 36 spectral channels that obtain images in the visible and thermal infrared bands (0.4–14 μm) with spatial resolutions of 1 km, 500 m and 250 m. MODIS Level 1B (L1B) data were applied in this inversion experiment.
The autonomous territory of Xinjiang province is located in the hinterland of the Eurasian continent, far from the ocean, and it is dominated by a typical continental arid climate. Because it has low precipitation, sparse vegetation, poor soil, and fragile ecosystems, this region is highly sensitive to various natural and human activities. Based on the site distribution, several local areas in Xinjiang (42.7°N–46.3°N, 87.2°E–90.7°E) were selected for this study, including the Gurbantunggut Desert in the Junggar Basin hinterland and portions of the Tianshan Mountains. These areas have low vegetation coverage and few surface feature variations because the land is mainly desert (similar to the Gobi Desert).
Ground-measured AOD data were used for atmospheric correction to obtain clear images and validate the inversion method. Continuous observation experiments were performed for two months (July and August 2014) at the Dahuangshan and Wucaiwan sites (the specific locations are shown in Figure 4).
The measurement instruments used at the Wucaiwan and Dahuangshan sites included a CE318 sun photometer produced by the CIMEL Co. and a Microtops II hand-held sun photometer produced by the Solar Light Company. The CE318 sun photometer automatically tracks and measures direct solar and sky radiation, which are used to calculate atmospheric transmissivity, AOD, and ozone content. The CE318 has 8 channels and provides cloud-free AOD observations every 15 min, with an uncertainty of ~0.01–0.02 [27]. The Microtops II sun photometer has five measurement channels and is easy to operate and transport, with an uncertainty of ~0.015–0.02 [28]. The band information for the above two instruments is shown in Table 1. Before the experiment, we conducted a comparison study at the Dahuangshan site from 7 July to 10 July 2014, with the two instruments and observed a maximum absolute error of 0.005 when the AOD at 500 nm varied from 0.14–1.63. The observation time in the study area spanned from 10 July to 24 August 2014, during which observations of several atmospheric parameters were made, including AOD, direct solar radiation, and atmospheric moisture content.
4. Results and Validation
4.1. Surface Reflectance
Based on the ground measurement data (shown in Figure 5), the AODs measured by the CE318 and Microtops II sun photometers were closest on 30 July 2014, with an absolute difference of 0.0146. The imaging time of the MODIS sensor on this date was 13:35 within one hour before and after imaging, and the maximum and minimum absolute deviations of the AOD values at 500 nm obtained from the two instruments were 0.0234 and 0.0011, respectively. The average water vapor measured by CE318 during this time period was 1.4804 cm. No cloud cover occurred over the study area during this time. Thus, the atmospheric conditions were relatively stable over the study area. Therefore, we selected the 30 July 2014, MODIS image as a clear reference image from the long-term series of MODIS data. Using the measured atmospheric parameters (AOD = 0.2435 and water vapor = 1.4804 cm), atmospheric correction was conducted using the radiative transfer model to obtain the surface reflectance of the red and blue bands. The results are shown in Figure 6. The surface reflectance in the blue band was generally smaller than that in the red band. The local desert area and the ice-covered area on top of the Tianshan Mountains had reflectance values greater than 0.2. Figure 7 shows a cumulative percent distribution diagram of the surface reflectance according to the atmospheric correction results, the blue and red lines represent the surface reflectance distribution of blue and red bands, respectively. As shown in Figure 7, approximately 99% of the surface reflectance values were below 0.12 in the blue band, and almost 58% of the surface reflectance values were below 0.15 in the red band. As illustrated in Figure 2, when the surface reflectance in the blue and red bands is less than 0.12 or 0.15, respectively, changes in AOD can still cause changes in apparent reflectance. In addition, to minimize the error, the surface reflectance values of the blue and red bands were limited to less than 0.12 and 0.15, respectively.
4.2. Inversion Experiments
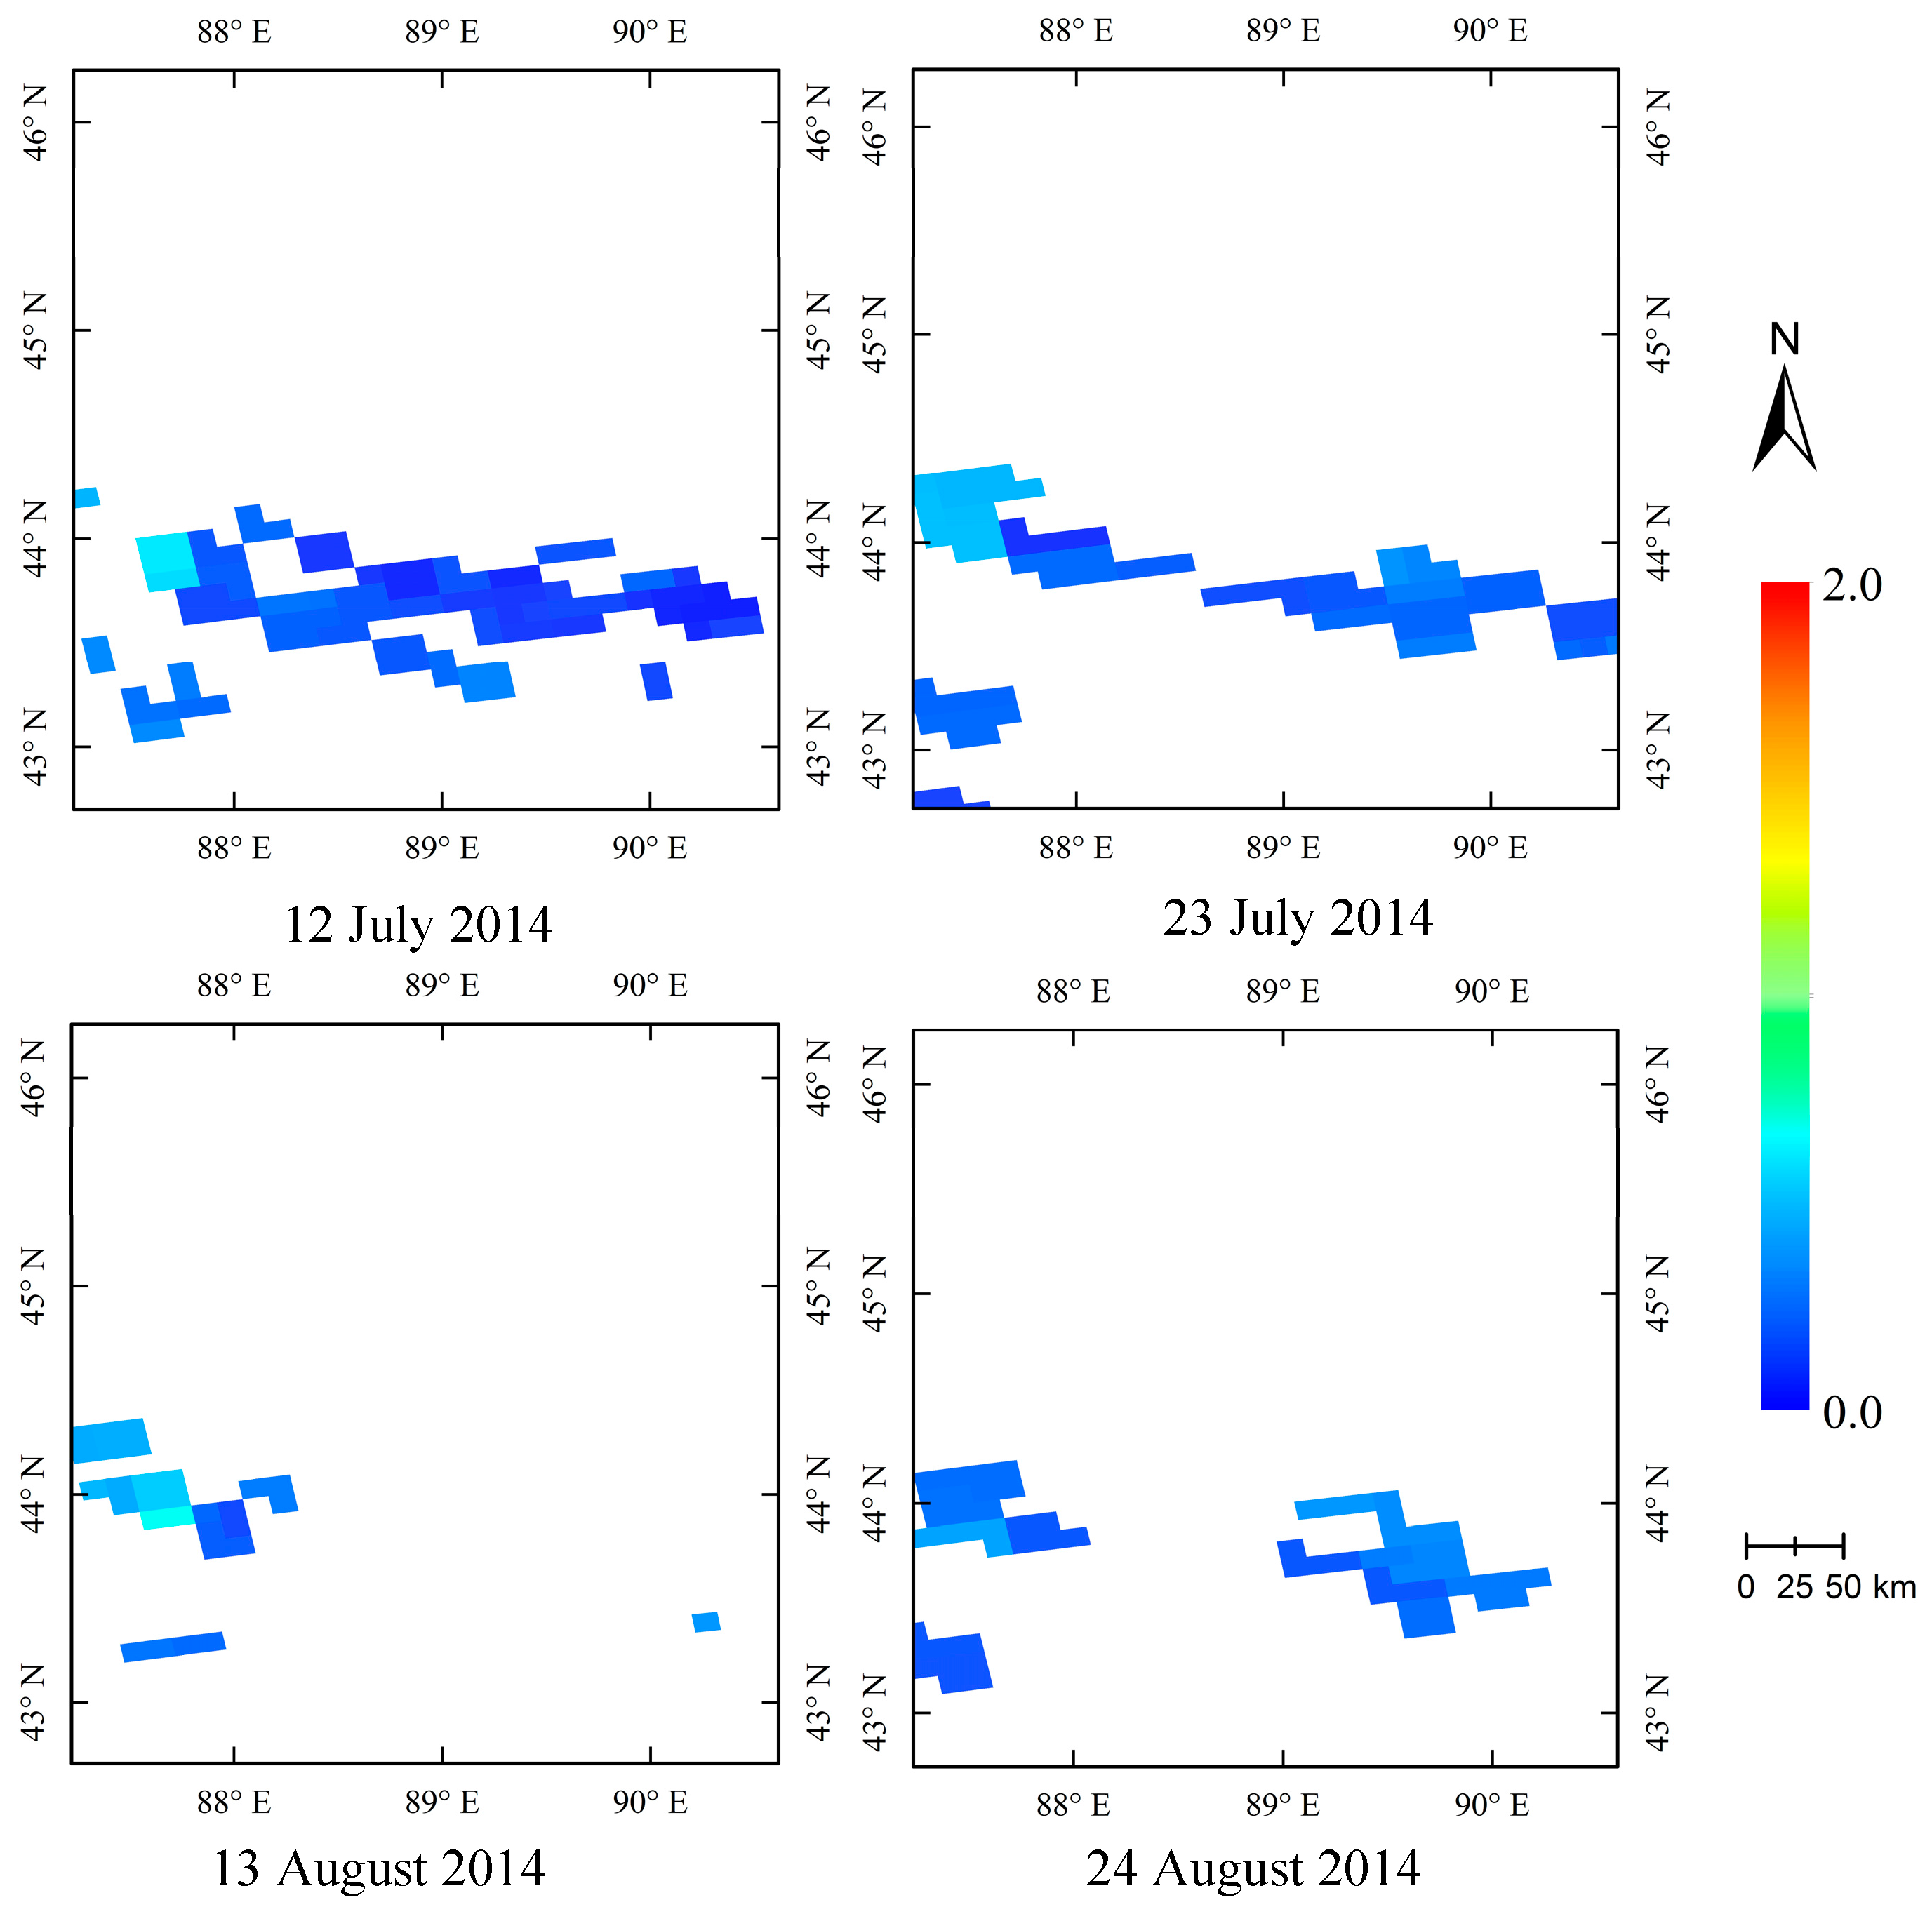
During the study period, the MODIS reflectance data covering the study area at a 500 m resolution (MOD02HKM) in July and August 2014 were selected using ground-based remote sensing measurements. In accordance with the selected MODIS data, inversion experiments were performed based on the obtained surface reflectance data. Figure 8 shows the spatial distribution of AOD over the study area retrieved from MODIS images at a 500 m resolution. These results demonstrate that the new algorithm can achieve a continuous AOD distribution, even in desert areas with high reflectance. The new algorithm describes the aerosol distribution and variability in detail and at a higher spatial resolution (500 m) than the current operational MODIS AOD product (MOD04) (10 or 3 km). As shown in Figure 8, although the retrieved overall AOD value is small, some large values appear at the edges of the clouds. The white areas in the map indicate that no data were retrieved in these areas, generally because they were covered by clouds or snow.
4.3. Validation
The AODs measured at different wavelengths were used to calculate the inversion results at 550 nm. The relationship between the AOD and wavelength can be expressed by the Ångström equation as follows [29]:
where is the AOD at , is the wavelength, α is the wavelength exponent closely related with the aerosols size, and β is the turbidity factor, which are written as:
Because the solar spectrometer lacked a 550 nm channel, we chose the two channels closest to 550 nm and then calculated the AOD at 550 nm using Equation (6). Based on the available channels for the CE318 and Microtops II sun photometers, and the influence of water vapor on the radiative transfer [30]. As a result of previous studies [31,32,33,34], we selected the 500 nm and 670 nm channels and 500 nm and 870 nm channels, respectively.
To decrease the influences of atmospheric instability, such as pixel pollution due to the presence of thin clouds, ragged clouds, and cloud edges, the average inversion results for a 3 × 3 pixel area were selected as the final verification result. Forty-five pairs of valid data were obtained at the Dahuangshan and Wucaiwan sites. Figure 9 shows a comparison of the time series between the measured AODs and the retrieved results. The overall trends of these results exhibited good agreement, although the retrieved values were slightly smaller than the measured values. Figure 9A shows the Microtops II results at the Dahuangshan site. The maximum absolute difference between the inversion values was 0.12. Figure 9B shows the results of the CE318 at the Wucaiwan site, where the maximum absolute difference was 0.27. The largest differences occurred on 9 August, and the measured value was largest on that day. Based on the true color composite image, this error may be due to the impacts of clouds.
The MODIS aerosol retrievals, except in coastal zones, lie within the retrieval error range of , which is the expected error (EE) defined by NASA [35]. In this paper, we use the NASA standard to verify the accuracy of the inversion results. Table 2 and Figure 10 show the statistics of the AOD values retrieved from MODIS images compared to the AOD measurements at the two sites. The validation results show that the AOD retrieved from the MODIS images by the algorithm outlined in this paper exhibits high consistency with the AODs measured by sun photometers (the R2 is 0.84), and a total of 45 contrast points were obtained. For all points, the average absolute error was 0.60, the relative error was 21.85%, and 82.22% of the points were within the NASA EE range. Because the Dahuangshan site is located near the highly vegetated Tianshan Mountains, the surface reflectance is low at the site. Additionally, the surface reflectance can be relatively accurately determined, and the inversion result is satisfactory.
The global aerosol data provided by MOD04 products achieve a certain level of accuracy. Most validation studies have concluded that, in general, the MODIS algorithm used to retrieve aerosol products provides results comparable to sun photometer-based products and that an expected error envelope could be defined that contained at least a 67% (approximately one standard deviation) agreement over vegetated areas [16]. The MODIS algorithm has been widely applied for climate modeling, air quality testing, etc. [36]; however, a similar result was found in northern desert areas, with the ratio of MODIS to observations ranging from 15% to 55%. Approximately 7% to 39% of MODIS products fall within NASA’s EE range, and most of the inversion results are higher than the ground-measured values [37]. Figure 11 shows the distribution of comparable MODIS MOD04 products during the study campaign, illustrating that this product was suitable only for areas covered by dense vegetation in Tianshan, and it had a substantially altered spatial distribution and lower resolution (10 km). Figure 12 shows that the scatter plots of the AOD retrieved using the proposed method are validated by the ground-based sun photometer AOD measurements. In Figure 12, the black dashed lines represent NASA’s EE lines, the black solid lines are the 1:1 lines, and the red solid lines represent the regression lines. Figure 12A,B show the results retrieved using our proposed algorithm and the MOD04 AOD results, which have R2 values of 0.84 and 0.10, respectively. The AOD results obtained using the new algorithm better fit the ground-measured values, with more points lying within NASA’s EE range.
5. Conclusions and Discussion
Based on the land surface characteristics in arid areas, this paper proposes a method for estimating land surface reflectance (LSR) and retrieving aerosol information over arid areas using long-term series of MODIS images. The clearest image was selected from a series of continuous MODIS data with matching spatial characteristics and at adjacent times. Atmospheric correction was performed using ground-measured atmospheric parameters and then used to estimate the LSR for AOD retrieval from data collected at adjacent times. Validation was performed by comparing the results from two different sun photometers (CE318 and Microtops II) located at two different sites (Dahuangshan and Wucaiwan) in arid regions; both yielded comparable results. A validation analysis using ground-measured data and the MOD04 aerosol product allowed us to draw the following conclusions: (1) Based on the 6S model simulation analysis, the sensitivity of the apparent reflectance and the AOD under different conditions, the path radiance of aerosols, and the radiance of the land surface based on the satellite signal can be identified when the surface reflectance values of blue and red wavelengths are less than 0.12 and 0.15, respectively, except when using the urban/industrial aerosol model. To obtain AOD, surface reflectance must be accurately determined; (2) The AOD results retrieved using the new algorithm represent a more accurate estimation of aerosol loading over the arid study region and can describe the aerosol distribution and variability in greater detail at a high spatial resolution (500 m); (3) This validation shows that the retrieved AODs are highly correlated with the AODs from the ground stations. The R2 reached 0.84, while the relative error was 21.85%, and 82.2% of the retrieved AODs fell within the EE range defined by NASA.
Over arid coverage areas, the proposed inversion algorithm based on sequences of images with adjacent times can compensate for some of the shortcomings of the DDV method. However, the following three limitations remain: (1) surface directional reflectance still induces some errors, although the errors are generally less than 0.035; (2) the algorithm is not suitable for areas with extremely large reflectance, such as ice-covered areas; and (3) the requirements of ground-measured data and the large area of automatic retrieval are restricting.
Acknowledgments
The authors thank the foundation of the National Natural Science Foundation of China (No. 41171270), the Key Deployment Project of Chinese Academy of Sciences (KZZD-EW-TZ-18) and Outstanding Youth Fund of Shandong Province (JQ201211). We also thank NASA for providing the MODIS data and maintaining the AERONET sites used in this study.
Author Contributions
Xin-peng Tian and Lin Sun performed the new AOD algorithm research and prepared the paper.
Conflicts of Interest
The authors declare no conflict of interest.
References
- Griggs, M. Measurements of atmospheric aerosol optical thickness over water using ERTS-1 data. J. Air Pollut. Control Assoc. 1975, 25, 622–626. [Google Scholar] [CrossRef] [PubMed]
- Mekler, Y.; Quenzel, H.; Ohring, G.; Marcus, I. Relative atmospheric aerosol content from ERTS observations. J. Geophys. Res. 1977, 82, 967–970. [Google Scholar] [CrossRef]
- Griggs, M. Satellite observations of atmospheric aerosols during the E0MET cruise. J. Atmos. Sci. 1979, 36, 695–698. [Google Scholar] [CrossRef]
- Nagaraja Rao, C.R.; Stowe, L.L.; McClain, E.P. Remote sensing of aerosols over the oceans using AVHRR data theory, practice and applications. Int. J. Remote Sens. 1989, 10, 743–749. [Google Scholar] [CrossRef]
- Durkee, P.A.; Pfeil, F.; Frost, E.; Shema, R. Global analysis of aerosol particle characteristics. Atmos. Environ. A Gen. Top. 1991, 25, 2457–2471. [Google Scholar] [CrossRef]
- Kaufman, Y.J.; Sendra, C. Algorithm for automatic atmospheric corrections to visible and near-IR satellite imagery. Int. J. Remote Sens. 1988, 9, 1357–1381. [Google Scholar] [CrossRef]
- Holben, B.; Vermote, E.; Kaufman, Y.J.; Tanré, D.; Kalb, V. Aerosol retrieval over land from AVHRR data-application for atmospheric correction. IEEE Trans. Geosci. Remote Sens. 1992, 30, 212–222. [Google Scholar] [CrossRef]
- Sun, L.; Wei, J.; Bilal, M.; Tian, X.; Jia, C.; Guo, Y.; Mi, X. Aerosol optical depth retrieval over bright areas using landsat 8 OLI images. Remote Sens. 2015, 8. [Google Scholar] [CrossRef]
- Kaufman, Y.J.; Tanré, D.; Remer, L.A.; Vermote, E.F.; Chu, A.; Holben, B.N. Operational remote sensing of tropospheric aerosol over land from EOS moderate resolution imaging spectroradiometer. J. Geophys. Res. Atmos. 1997, 102, 17051–17067. [Google Scholar] [CrossRef]
- Levy, R.C.; Remer, L.A.; Mattoo, S.; Vermote, E.F.; Kaufman, Y.J. Second-generation operational algorithm: Retrieval of aerosol properties over land from inversion of moderate resolution imaging spectroradiometer spectral reflectance. J. Geophys. Res. Atmos. 2007, 112. [Google Scholar] [CrossRef]
- Mi, W.; Li, Z.; Xia, X.; Holben, B.; Levy, R.; Zhao, F.; Chen, H.; Cribb, M. Evaluation of the moderate resolution imaging spectroradiometer aerosol products at two aerosol robotic network stations in China. J. Geophys. Res. Atmos. 2007, 112. [Google Scholar] [CrossRef]
- Li, Z.; Niu, F.; Lee, K.; Xin, J.; Hao, W.; Nordgren, B.; Wang, Y.; Wang, P. Validation and understanding of moderate resolution imaging spectroradiometer aerosol products (C5) using ground-based measurements from the handheld Sun photometer network in China. J. Geophys. Res. Atmos. 2007, 112. [Google Scholar] [CrossRef]
- Xia, X.; Yu, Y.; Chen, D. Significantly higher global MODIS aerosol optical thickness over land. Chin. Sci. Bull. 2006, 51, 2297–2303. [Google Scholar] [CrossRef]
- Hsu, N.C.; Tsay, S.C.; King, M.D.; Herman, J.R. Aerosol properties over bright-reflecting source regions. IEEE Trans. Geosci. Remote Sens. 2004, 42, 557–569. [Google Scholar] [CrossRef]
- Hsu, N.C.; Jeong, M.J.; Bettenhausen, C.; Sayer, A.M.; Hansell, R.; Seftor, C.S.; Huang, J.; Tsay, S.C. Enhanced deep blue aerosol retrieval algorithm:the second generation. J. Geophys. Res. Atmos. 2013, 118, 9296–9315. [Google Scholar] [CrossRef]
- Levy, R.C.; Mattoo, S.; Munchak, L.A.; Remer, L.A.; Sayer, A.M.; Patadia, F.; Hsu, N.C. The Collection 6 MODIS aerosol products over land and ocean. Atmos. Meas. Tech. 2013, 6, 2989–3034. [Google Scholar] [CrossRef]
- Remer, L.A.; Mattoo, S.; Levy, R.C.; Munchak, L.A. MODIS 3 km aerosol product: Algorithm and global perspective. Atmos. Meas. Tech. 2013, 6, 69–112. [Google Scholar] [CrossRef]
- Sun, L.; Sun, C.; Liu, Q.; Zhong, B. Aerosol optical depth retrieval by HJ-1/CCD supported by MODIS surface reflectance data. Sci. China Earth Sci. 2010, 53, 74–80. [Google Scholar] [CrossRef]
- Li, S.; Chen, L.; Tao, J.; Han, D.; Wang, Z.; Su, L.; Fan, M.; Yu, C. Retrieval of aerosol optical depth over bright targets in the urban areas of North China during winter. Sci. China Earth Sci. 2012, 55, 1545–1553. [Google Scholar] [CrossRef]
- Sun, L. Remote Sensing of Aerosols over Urban Areas. Ph.D. Thesis, Institute of Remote Sensing Applications Chinese Academy of Science, Beijing, China, 2006. [Google Scholar]
- Vermote, E.F.; Tanré, D.; Deuze, J.L.; Herman, M.; Morcrette, J.J. Second Simulation of a Satellite Signal in the Solar Spectrum-Vector (6SV). Available online: http://6s.ltdri.org/files/tutorial/6S_Manual_Part_1.pdf (accessed on 30 June 2015).
- Tanré, D.; Kaufman, Y.J.; Holben, B.N.; Chatenet, B.; Karnieli, A.; Lavenu, F.; Blarel, L.; Dubovik, O.; Remer, L.A.; Smirnov, A. Climatology of dust aerosol size distribution and optical properties derived from remotely sensed data in the solar spectrum. J. Geophys. Res. 2001, 106, 18205–18217. [Google Scholar] [CrossRef]
- Remer, L.A.; Kaufman, Y.J.; Holben, B.N. The size distribution of ambient aerosol particles: Smoke vs. urban/industrial aerosol. In Biomass Burning and Global Change; Levine, J.S., Ed.; MIT Press: Cambridge, MA, USA, 1996; pp. 519–530. [Google Scholar]
- Mishchenko, M.I.; Travis, L.D. Light scattering by polydispersions of randomly oriented spheroids with sizes comparable to wavelengths of observation. Appl. Opt. 1994, 33, 7206–7225. [Google Scholar] [CrossRef] [PubMed]
- Bodhaine, B.A.; Wood, N.B.; Dutton, E.G.; Slusser, J.R. On Rayleigh optical depth calculations. J. Atmos. Ocean. Technol. 1999, 16, 1854–1861. [Google Scholar] [CrossRef]
- Bucholtz, A. Rayleigh-scattering calculations for the terrestrial atmosphere. Appl. Opt. 1995, 34, 2765–2773. [Google Scholar] [CrossRef] [PubMed]
- Eck, T.F.; Holben, B.N.; Reid, J.S.; Dubovik, O.; Smirnov, A.; O’Neill, N.T.; Slutsker, I.; Kinne, S. Wavelength dependence of the optical depth of biomass burning, urban, and desert dust aerosols. J. Geophys. Res. 1999, 104, 31333–31349. [Google Scholar] [CrossRef]
- Knobelspiesse, K.D.; Pietras, C.; Fargion, G.S.; Wang, M.; Frouin, R.; Miller, M.A.; Subramaniam, A.; Balch, W.M. Maritime aerosol optical thickness measured by handheld sun photometers. Remote Sens. Environ. 2004, 93, 87–106. [Google Scholar] [CrossRef]
- Ångström, A. The parameters of atmospheric turbidity. Tellus 1964, 16, 64–75. [Google Scholar] [CrossRef]
- Pan, L.; Che, H.; Geng, F.; Xia, X.; Wang, Y.; Zhu, C.; Chen, M.; Gao, W.; Guo, J. Aerosol optical properties based on ground measurements over the Chinese Yangtze Delta Region. Atmos. Environ. 2010, 44, 2587–2596. [Google Scholar] [CrossRef]
- Sayer, A.M.; Thomas, G.E.; Grainger, R.G.; Carboni, E.; Poulesen, R.S. Use of MODIS-derived surface reflectance data in the ORAC-AATSR aerosol retrieval algorithm: Impact of differences between sensor spectral response functions. Remote Sens. Environ. 2012, 116, 177–188. [Google Scholar] [CrossRef]
- Adames, A.F.; Reynolds, M.; Smirnov, A.; Covert, D.S.; Ackerman, T.P. Comparison of moderate resolution imaging spectroradiometer ocean aerosol retrievals with ship-based sun photometer measurements from the around the americas expedition. J. Geophys Res. 2011, 116. [Google Scholar] [CrossRef]
- Jacovides, C.P.; Kaltsounides, N.A.; Asimakopoulos, D.N.; Kaskaoutis, D.G. Spectral aerosol optical depth and Angstrom parameters in the polluted Athens atmosphere. Theor. Appl. Climatol. 2005, 81, 161–167. [Google Scholar] [CrossRef]
- Remer, L.A.; Kaufman, Y.J.; Tanré, D.; Mattoo, S.; Chu, D.A.; Martins, J.V.; Li, R.R.; Ichoku, C.; Levy, R.C.; Kleidman, R.G.; et al. The MODIS aerosol algorithm, products, and validation. J. Atmos. Sci. 2005, 62, 947–973. [Google Scholar] [CrossRef]
- Chu, D.A.; Kaufman, Y.J.; Ichoku, C.; Remer, L.A.; Tanré, D.; Holben, B.N.; Einaudi, F. Validation of MODIS aerosol optical depth retrieval over land. Geophys. Res. Lett. 2002, 29, 1617–1621. [Google Scholar] [CrossRef]
- Ichoku, C.; Kaufman, Y.J.; Remer, L.A.; Levy, R. Global aerosol remote sensing from MODIS. Adv. Space Res. 2004, 34, 820–827. [Google Scholar] [CrossRef]
- Tang, J.; Ma, X.; Teng, W.; Yan, J.; Wu, W.; Dai, J.; Li, J.; Tang, J.; Ma, X.; Teng, W.; et al. Detection of quantitative trait loci and heterotic loci for plant height using an immortalized F2 population in maize. Chin. Sci. Bull. 2007, 52, 477–483. [Google Scholar] [CrossRef]
Figure 1.
Typical spectral reflectance curves for vegetation, ice, snow, soil, water, and sand in the visible to short-wave infrared (SWIR) range.
Figure 1.
Typical spectral reflectance curves for vegetation, ice, snow, soil, water, and sand in the visible to short-wave infrared (SWIR) range.

Figure 2.
Apparent reflectance as a function of aerosol optical depth (AOD). (A) Continental Model Blue Band; (B) Continental Model Red Band; (C) Desert Model Blue Band; (D) Desert Model Red Band; (E) Urban Model Blue Band; (F) Urban Model Red Band; (G) Biomass Burning Model Blue Band; (H) Biomass Burning Model Blue Band.


Figure 3.
Flowchart showing the retrieval process of the aerosol optical depth. The green shapes indicate input data based on remote sensing or ground measurements, yellow shapes represent data processing steps, blue represents results, purple shapes are look-up tables (LUTs), and the red step determines whether the image is clear.

Figure 4.
Map of the study area showing the ground-based measurement sites.

Figure 5.
Atmospheric parameters measured using the CE318 and Microtops II sun photometers. The (A) plot shows the AOD calculation results at 550 nm, and the black line is the day with the smallest measured difference (30 July). The (B) plot shows the atmospheric parameters (including AOD at 500 nm and water vapor from CE318) on 30 July the black line shows the imaging time of the MODIS data (13:35), and the grey shaded area is the 30 min before and after the overpass).

Figure 6.
The surface reflectance distribution in the study area on 30 July 2014 ((A) Blue band and (B) Red band).
Figure 6.
The surface reflectance distribution in the study area on 30 July 2014 ((A) Blue band and (B) Red band).

Figure 7.
Cumulative percentage of land surface reflectance.

Figure 8.
The distribution of the aerosol optical depth at 550 nm.

Figure 9.
Variations in the AOD inversion and ground observation results ((A) Dahuangshan and (B) Wucaiwan). The error bars represent the measurement error of the instrument. The errors in the CE318 and Microtops II data were 0.01 and 0.015, respectively.
Figure 9.
Variations in the AOD inversion and ground observation results ((A) Dahuangshan and (B) Wucaiwan). The error bars represent the measurement error of the instrument. The errors in the CE318 and Microtops II data were 0.01 and 0.015, respectively.

Figure 10.
Comparison between the AOD inversion results and ground-measured results at (A) Dahuangshan and (B) Wucaiwan. The black dashed lines represent the EE lines, and the black solid lines are the 1:1 lines.
Figure 10.
Comparison between the AOD inversion results and ground-measured results at (A) Dahuangshan and (B) Wucaiwan. The black dashed lines represent the EE lines, and the black solid lines are the 1:1 lines.

Figure 11.
Distribution of MOD04 AOD products in the study area.

Figure 12.
Comparison between ground measurements, inversion results, and MOD04 products: (A) New algorithm and (B) MOD04 product. The error bars represent the maximum absolute error between the retrieved AOD and the ground measurements.
Figure 12.
Comparison between ground measurements, inversion results, and MOD04 products: (A) New algorithm and (B) MOD04 product. The error bars represent the maximum absolute error between the retrieved AOD and the ground measurements.


| CE318 | Microtops II | ||||
|---|---|---|---|---|---|
| Channel | Central Wavelength (nm) | Band Width (nm) | Channel | Central Wavelength (nm) | Band Width (nm) |
| 1 | 340 | 2 | 1 | 380 | 4 |
| 2 | 380 | 2 | 2 | 500 | 10 |
| 3 | 440 | 10 | 3 | 870 | 10 |
| 4 | 500 | 10 | 4 | 936 | 10 |
| 5 | 670 | 10 | 5 | 1020 | 10 |
| 6 | 870 | 10 | |||
| 7 | 1020 | 10 | |||
| 8 | 1640 | 60 | |||
| Site | Observation Number | Average Absolute Error | Relative Error (%) | Correlation Coefficient (R2) | Proportion within Error Bars (%) |
|---|---|---|---|---|---|
| Dahuangshan | 24 | 0.60 | 24.02 | 0.90 | 83.33 |
| Wucaiwan | 21 | 0.60 | 19.36 | 0.85 | 76.19 |
| Total | 45 | 0.60 | 21.85 | 0.84 | 82.22 |
© 2016 by the authors; licensee MDPI, Basel, Switzerland. This article is an open access article distributed under the terms and conditions of the Creative Commons Attribution (CC-BY) license (http://creativecommons.org/licenses/by/4.0/).
Share and Cite
MDPI and ACS Style
Tian, X.-p.; Sun, L. Retrieval of Aerosol Optical Depth over Arid Areas from MODIS Data. Atmosphere 2016, 7, 134. https://doi.org/10.3390/atmos7100134
AMA Style
Tian X-p, Sun L. Retrieval of Aerosol Optical Depth over Arid Areas from MODIS Data. Atmosphere. 2016; 7(10):134. https://doi.org/10.3390/atmos7100134
Chicago/Turabian StyleTian, Xin-peng, and Lin Sun. 2016. "Retrieval of Aerosol Optical Depth over Arid Areas from MODIS Data" Atmosphere 7, no. 10: 134. https://doi.org/10.3390/atmos7100134
Note that from the first issue of 2016, this journal uses article numbers instead of page numbers. See further details here.