Abstract
This is an overview of the results from previously published climate modeling studies reporting on projected aspects of future storminess over the North Atlantic European region (NAER) in the period 2020–2190. Changes in storminess are summarized for seven subregions in the study area and rated by a categorical evaluation scheme that takes into account emission scenarios and modeling complexity in the reviewed studies. Although many of the reviewed studies reported an increase in the intensity of high-impact wind speed and extreme cyclone frequency in the second half of the 21st century, the projections of aspects of future storminess over the NAER differed regionally. There is broad consensus that the frequency and intensity of storms, cyclones, and high-impact wind speed will increase over Central and Western Europe, and these changes will probably have the potential to produce more damage. In contrast, future extratropical storminess over Southern Europe is very likely to decrease. For Northern and Eastern Europe the results of the evaluation are inconclusive, because there is an indication of increasing as well as decreasing development of the evaluated aspects of future storminess. Concerning the storm track, we found indications of a likely north- and eastward shift in most assessed studies. Results from three studies suggest a northeastward shift of the North Atlantic Oscillation.
1. Introduction
Synoptic winter storms are a typical feature of the climate over the North Atlantic European region (NAER). Over continental Europe, they bear a high damage potential to property, infrastructure, and the environment and cause deaths and injuries. In the period 1980–2014, loss associated with the ten costliest European winter storms amounted to more than US$63 billion and close to 500 fatalities occurred through the passage of these storms [1]. In Central Europe, severe winter storms are the most loss-relevant natural hazard events [2]. They are also part of the natural disturbance dynamics of European forest ecosystems with severe winter storms currently representing the main hazard, because of their large expansion and high-impact near-surface flow field characteristics. In recent decades (1950–2010), they have caused 51% of all damaged timber and thus more than all other natural hazards (mainly fire, snow, and bark beetles) together [3]. Furthermore, severe storms chronically act on Atlantic coastlines and induce sand drift and erosion [4,5,6].
The North Atlantic Oscillation (NAO) is linked to changes in extratropical storm tracks and large-scale circulation patterns over Europe [7,8,9,10,11]. Since the NAO is more pronounced during winter, most severe synoptic storms occur between December and March [7,12,13]. In the period 1500–1995, 66% of all high-impact storm events occurred between October and March [14], with most storms passing over Europe during December. There is evidence that the NAO currently has at least two modes with periods of 10.4 and 62 years, the latter being related to long-term changes in Atlantic sea surface temperature [15].
Winter storms regularly disturb the planning of thinning and harvesting operations in forestry, and forest management seeks robust information on the future development of storminess, because goals of forest management are defined over a period of several decades. However, not only stakeholders in the forestry sector are interested in robust information on future storminess. Knowledge about the characteristics of future high-impact storms is also of great interest for a number of other socio-economic sectors. For the insurance sector, storms are of major importance, because (re)insurance companies usually hedge financial risk induced by storms and are keen to assess storm-induced loss potentials [16,17]. Wind turbine operators have to shut down their installations to avoid damage during the passage of storms [18,19]. In aviation, severe storms affect airline operations [20,21].
A large number of climate modeling studies report on the projected future development of storminess over the NAER. Due to the importance of the issue, main outcomes and various aspects from these studies have already been summarized and discussed in review articles in recent years: The study of [22] summarized the importance of high-impact winter storms for European forest ecosystems and forestry. A review of cyclone characteristics in the mid-latitudes under current and future climate in the southern and northern hemisphere was presented by [23], while [11] reported on the effect of sea ice variability on storm tracks and NAO-variability. The most recent review on storminess over the North Atlantic and Northwestern Europe analyzed the available literature for storm frequency trends, changes in cyclone activity, and storm tracks [24].
The present review is an update and further development of the reviews of [22,24]. It combines a refined version of the study evaluation methodology applied by [22] with the regional evaluation approach for different parts of the NAER presented by [24]. Furthermore, we defined and evaluated the reviewed studies for the categories “storms”, “cyclones”, and “wind speed” separately, which were often used to quantify aspects of projected future storminess. For these categories, we assessed changes in frequency, intensity, and/or activity. For the assessment, we divided the NAER into seven subregions, which we believe to represent regional differences in aspects of current storminess over the study area.
The goal of this review is to provide a comprehensive overview of the projected changes of measures that are commonly used to quantify storminess under future climate conditions over the NAER. The intention of using a categorical evaluation scheme is to meet the growing demand for information on the future development of storminess for strategic management processes and decision-making in various ecological and socio-economic sectors that are exposed to the atmospheric environment.
2. Methods
2.1. Literature Search
This review is based on an extensive literature search in the databases Google Scholar, ScienceDirect, Thomson Reuters Web of Science, Wiley Online Library, and Catalog, plus the library of the Albert-Ludwigs-University of Freiburg (Freiburg, Germany). We searched for articles that reported on aspects of projected future storminess over the NAER. Keywords related to “wind”, “storm”, “cyclone”, “storminess”, “North Atlantic European region”, “Europe”, “climate model”, and “projection” were used and combined during the search process. To assess the general suitability of the search results for this review, we started reading the abstracts and selected relevant articles for further analysis based on our expert knowledge. All 58 studies—including basic information on the models used to project aspects of future storminess over the NAER—that have finally been evaluated in this review are listed in Appendix A, Table A1.
2.2. Terms and Definitions
While reviewing studies on projected storminess over the NAER, it quickly became evident that the definition of the term “storminess” is ambiguous. In the evaluated studies it was either characterized directly by different measures of wind speed and/or pressure or indirectly by impact-related variables such as storm-induced damage and losses. Furthermore, the definition of “storm” was inconsistent. For example, “storm” has not only been defined as a strong gale (near-surface wind speed ≥ 9 Bft) but also as severe cyclone.
Due to the ambiguity of the definitions of storminess, we provide a number of definitions of indicators that we used to evaluate and interpret projections of aspects of future storminess:
- Extratropical cyclones can be defined as a minimum in the mean sea level pressure field or at the 1000 hPa geopotential height [25].
- Cyclone frequency can be quantified by counting the number of cyclones occurring in gridded datasets [23]. Changes in cyclone frequency are often expressed as changes in cyclone return period [26,27,28,29,30].
- Cyclone intensity is characterized by the depth of a pressure center at sea level or by the relative pressure minimum at the 1000 hPa geopotential height. Low pressure is always associated with high cyclone intensity. Alternative measures of cyclone intensity are magnitude of vorticity, precipitation intensity, or wind speed [23,31].
- Cyclone activity was defined and reported as the product of the number of cyclones and their mean intensity [32]. This entails that it was not always possible to attribute changes in cyclone activity to either changes in cyclone frequency or changes in cyclone intensity. Cyclone activity can also be quantified by cyclone track density [23].
- Cyclone track density was defined as the number of cyclone tracks which can be counted over time in gridded datasets [23]. Cyclone track density does not provide any information on the intensity of the counted cyclones [33]. We therefore interpreted information on cyclone track density as a measure of cyclone frequency.
- A storm track is the path of a storm over time. Originally, a storm track referred to preferred regions of storm/cyclone activity. “Storm track” was also used to describe clusters of cyclone tracks in different geographical regions [24]. We interpreted information on storm track activity as a measure of cyclone activity [34].
- Storm intensity can be characterized by wind speed measurements made at 10 m above the ground. In the reviewed literature, it was reported as (i) peak wind speed values averaged over 1–3 s; (ii) mean wind speed averaged over 10 min intervals; or (iii) percentiles (e.g., 90–98 percentiles) of maximum daily wind speed values [13,16,35,36,37,38].
Due to the numerous definitions of “storminess” it proved to be impossible to always unambiguously interpret the future development of stormy conditions based on the reviewed studies. Especially, the terms “storm” and “extreme cyclone” were often improperly defined, not only between studies, but also in one and the same study. When the definition of storm and extreme cyclone was ambiguous within the very same study, we interpreted the reported results as changes in cyclone characteristics.
Additionally ambiguous was the use of the term “wind speed”. Wind speed has either been used as a measure for storm intensity or cyclone intensity, or was investigated without relating to storms and/or extreme cyclones. In the following analysis, we use the term “wind” as an abbreviation for “high-impact wind speed”.
Table B1 in Appendix B summarizes the emission scenarios and the variables investigated in the evaluated studies and their assignment to categories (frequency, intensity, activity) of aspects (storms, extreme cyclones, high-impact wind speed) of projected storminess assessed in this review.
2.3. Study Evaluation and Rating
The present analysis is a modification of the approach of [22]. In their review of the past, present, and future storminess over the NAER, they interpreted findings from 32 studies on the basis of a categorical evaluation scheme of
- data volume differentiated for the categories (i) measured/observed data; (ii) data from reanalysis; (iii) combination of reanalysis and climate change scenarios, and
- methodology with the categories (i) trend analysis/simple statistics; (ii) output from an individual model/complex statistics; and (iii) output from multi-model ensembles.
We basically adopted this classification scheme, but focused on projections of the future development of storminess, which implies that we did not include measured/observed data and data from reanalysis into the present assessment. The rating of the significance of an evaluated study was completed with the type of emission scenario (S) and the number (N) of general circulation models (GCMs) used to project future storminess, with grades from 1 (lowest rating) to 3 (highest rating).
To assess S, we differentiated between (i) CO2-experiments or IS92-scenarios [39] (S = 1); (ii) Special Report on Emission Scenarios (SRES) [40] (S = 2); and (iii) Representative Concentration Pathways (RCP) [41] (S = 3). The differentiation between the emission scenarios was based on the assumption that newer emission scenarios better represent the current state of scientific knowledge in emission scenario modeling.
The assessment of the applied methodology was based on the number of applied GCMs. The number of regional climate models (RCMs) was not considered because it has been demonstrated that GCM-forcing affects projection results more strongly than RCM-outputs [13,42,43]. Although the spread produced by the RCMs is smaller than the GCM-spread, it had an effect on the results reported in the evaluated studies. However, we did not take the number of RCMs into account, because this would have reduced the total number of evaluated studies. The categorical interpretation key for assessment of N differentiates between (i) single models (one GCM or one GCM together with one or more RCMs, N = 1); (ii) multiple GCMs (2 ≤ number of GCMs < 10, N = 2); and (iii) multi-model ensembles (number of GCMs ≥ 10, N = 3). The differentiation between the numbers of applied models was based on the assumption that the combined information of multiple models generally improves the accuracy, reliability, and consistency of projections [44]. The differentiation between the N-values of 2 and 3 was made at ten GCMs to balance the number of studies assigned to these two categories.
The evaluation score (ES) for individual studies was calculated emphasizing the effect of the applied GCMs on projections of storminess over the assumed future scenario [13] as follows:
ES = S + 2·N
After the comparison (data not shown) of several combinations of weighted and unweighted S- and N-values, it turned out that the applied weighting scheme allows for the intended differentiation between the evaluated studies without affecting the overall subregion-specific ES-pattern.
To better account for typical large-scale circulation patterns known to occur over the NAER, we divided the study area into the seven subregions (Figure 1) in a similar fashion, as has been done by [24]. The subregions we defined are (i) North Atlantic north of 60°N; (ii) North Atlantic south of 60°N; (iii) Northern Europe (including Baltic Sea); (iv) Central Europe; (v) Southern Europe; (vi) Western Europe (including North Sea); and (vii) Eastern Europe. Based on the individual study-specific ES-values, total ES-scores and mean ES-values () were calculated to provide the total and mean weight of all studies pooled for one of the subregions.
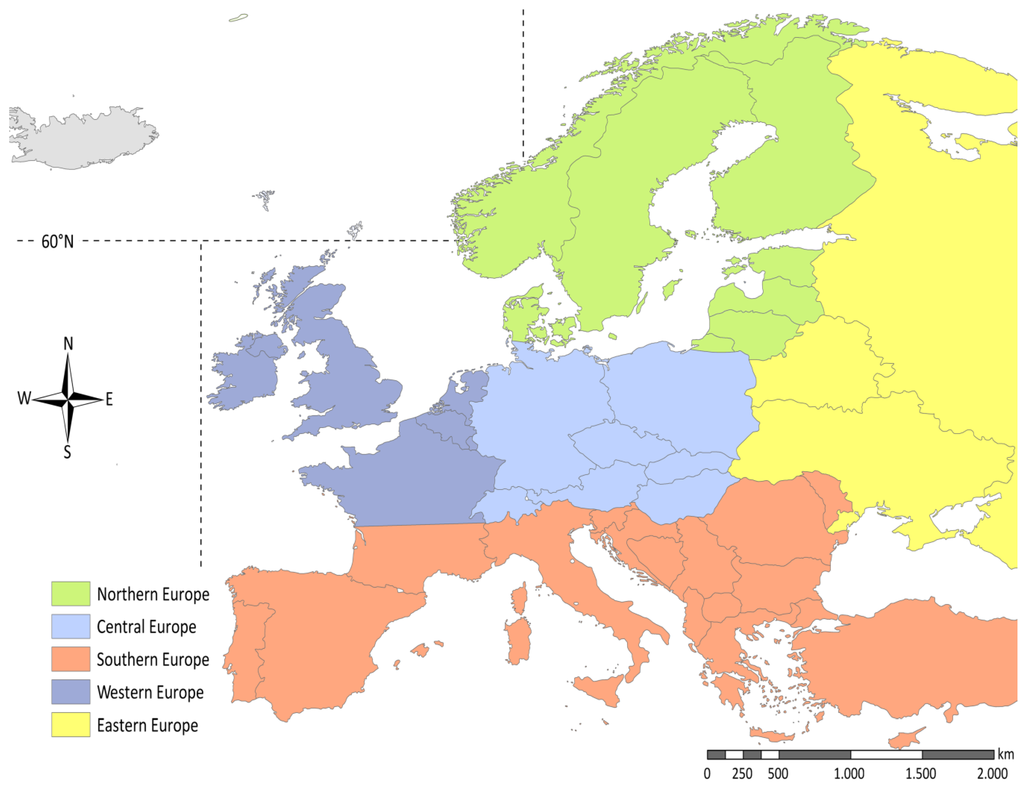
Figure 1.
Differentiation of the study area (North Atlantic European region: NAER) into seven subregions. The horizontal dashed line at 60°N divides the North Atlantic into the subregions North Atlantic north of 60°N and North Atlantic south of 60°N. The vertical dashed lines indicate the eastern boundaries of the two North Atlantic subregions.
We assigned the projected and reported long-term evolution of aspects of storminess to the categories frequency, intensity, and activity of storms and extreme cyclones to these subregions based on the definitions provided above. This means that we do not always report on the meteorological variables actually presented in the reviewed studies (e.g., the future development of wind speed measured at 10 m above ground, change of wind speed at different pressure levels such as the 850 hPa pressure level) but interpreted them in terms of their projected long-term changes in frequency, intensity, and activity as either “storms” or “extreme cyclones” or “high-impact wind speed”. The reported tendency (T) in the long-term evolution of the reported variables was assessed and quantified using the categorical interpretation key (i) T = –1 for a decreasing tendency; (ii) T = 0 for no tendency; and (iii) T = +1 for an increasing tendency. Interestingly enough, in total, only four [45,46,47,48] out of the 58 evaluated studies reported no tendency in any one of the assessed categories of future storminess.
To allow for a quantitative comparison of the evaluation results obtained for the seven subregions, an effective tendency (eT) was computed based on subregions-related ES- and T-values:
Results (data not shown) from a sensitivity analysis demonstrated that different combinations of weighted S- and N-values induced only minor changes in the eT-score (maximum ΔeT = 0.06) and did not change the structure of the presented inter-subregional results.
For the overall inter-subregional assessment, the eT-score puts more weight on studies with high ES-values and varies between −1.00 and 1.00. More negative values indicate a stronger tendency for a decreasing storminess in the future, while increasingly positive values indicate a stronger tendency for increasing storminess. With regard to the results from this study, we interpret eT-values as indicators for the reliability of the tendency of future projections, which implies that eT-values close to either −1.00 or 1.00 indicate clear decreasing or increasing tendencies in the evaluated aspects of projected storminess.
In addition to the assessment of future storminess in the seven subregions, we summarized results reported in the evaluated studies on projected changes of NAO- and storm track characteristics over the NAER. Although we also scored the applied emission scenario and methodology to calculate study-specific ES-values, we do not provide T- and eT-values, because projected changes in NAO- and storm track characteristics were spatially interpreted.
No differentiation of the evaluation results was made concerning the projection periods because the respective starting points in time, lengths, and endpoints were too diverse, leading to too many subgroups with too few members.
Provided that multiple projections were performed in a study, we evaluated only the study’s overall results and not the results obtained from individual projections included in the respective study. We focused on the overall results because synthesized results have been reported to be superior to results reported from individual projections [44]. Moreover, systematically considering the problems associated with individual projections in the evaluated studies, e.g., physical backgrounds, metrics of model validation, model dependences, experimental design, and model tuning [44], was beyond the scope of this paper. We, however, are aware that the chosen approach has an influence on our results and our interpretation of the future development of storminess.
Altogether, the reviewed studies cover the period 2020–2190. The spectral grid resolutions of the GCMs used in these studies varied at least between T21 and T213, which equal horizontal grid resolutions of 500 km to 49 km in the study area. With one exception [47], the evaluated studies have a focus on the European cold season including the months September to April. Typical terms and acronyms found in the reviewed studies referring to the cold season were “winter” without specifying individual months and “DJF” (December, January, and February). One reviewed study modeled future storminess for the month February representing winter conditions [49].
The evaluated studies summarized in tables in the Results section are primarily ranked in descending order based on the study-specific ES-value and secondarily based on the surname of the lead author.
3. Results
3.1. North Atlantic North of 60°N
In the North Atlantic region north of 60°N, highest N-ratings were awarded to two [50,51] out of eleven evaluated studies (Table 1, [9,13,25,27,37,50,51,52,53,54,55]), because they used multi-model ensembles with ten or more GCMs. In addition, the simulations of [51] were based on RCP-projections which, together with the large number of GCMs, yield ES = 9. Studies that reported results obtained from less than ten GCMs or from only one GCM (e.g., [25,52]) typically got lower N-ratings.

Table 1.
Studies reporting on projections of aspects of future storminess in the North Atlantic subregion north of 60°N.
The majority of the studies reported on changes of projected frequency of extreme cyclones and cyclone intensity. It is obvious that, in all analyzed categories of storminess a prevailingly decreasing development is found. One exception is the study of [25], who expected an increase in both projected frequency of extreme cyclones and cyclone intensity.
The subregion-related total ES-score is 65, -score is 5.0, and the eT-value equals −0.82, which, according to our evaluation scheme, implies a strong decreasing tendency of projected future storminess.
3.2. North Atlantic South of 60°N
Compared to the North Atlantic region north of 60°N, a different picture emerges in the North Atlantic region south of 60°N (Table 2, [2,9,13,31,45,47,50,52,54,56,57,58,59,60,61,62]). Results from 16 evaluated studies demonstrate that it is indisputable that storminess is projected to generally increase. Almost all studies indicated a positive change in at least one of the analyzed aspects of future storminess. Results from several studies suggested not only an increase in storm and cyclone frequency but also an increase in storm and cyclone intensity. From the results of the study of [2], it can be inferred that future wind intensity will also increase. Results of the study of [50], which scored ES = 9, showed an increase in cyclone activity in a large number of projections made in their study. Only one study did not identify a change in wind intensity [47].
Table 2.
Same as Table 1 but for the North Atlantic subregion south of 60°N.
The subregion-related total ES-score amounts to 95, the value is 4.8, and the eT-value equals 0.96. It is the highest eT-value of this assessment and clearly points to an increasing tendency of the projected storminess in this subregion.
3.3. Northern Europe
The results of the 20 studies evaluated for Northern Europe are more diverse (eT = 0.54) than the results obtained for the two North Atlantic regions north and south of 60°N (Table 3, [17,27,28,30,31,37,46,49,53,54,55,62,63,64,65,66,67,68,69]). Northern Europe is, together with Eastern Europe, a subregion for which we found no study that achieved ES = 9. However, for the evaluated aspects of projected storminess, our scoring includes all categories of T, with the study of [46] being the only study that found no change in their analyzed aspect (wind intensity) of future storminess. The subregion-related total ES-score is 108, and the -value equals 4.5.
Table 3.
Same as Table 1 but for the Northern Europe subregion.
Since only a few of the assessed studies reported on future development of “storms” no conclusive tendency can be identified for this variable. In two studies [30,62], expected future storm frequency decreased while two other studies projected an increase in storm intensity [28] and storm activity [63].
Most often studied were the future developments of extreme cyclone frequency and wind intensity. In both categories, model results support the conclusion that the number of cyclones as well as the wind intensity will increase towards the end of the 21st century. One study reported results that were obtained from projections of several RCMs without explicitly specifying a GCM [49].
3.4. Central Europe
The studies reviewed for Central Europe (Table 4, [2,17,27,28,30,31,37,38,49,50,51,54,55,61,63,64,70,71,72,73,74,75,76]) indicated an increase in almost all of the assessed aspects of storminess. However, although we reviewed 23 studies for this subregion, we found no clearly interpretable results on projected changes in future cyclone activity.
Table 4.
Same as Table 1 but for the Central Europe subregion.
With respect to the applied methodology, we rated the studies of [50,51,64] as complex, multi-model approaches (M = 3). A shift towards a higher storm activity was identified by [50], while [51] projected an increase in the frequency of extreme cyclones, which are associated with high wind speed at the 850 hPa pressure level. Results from [64] suggested a shift of the 95–100 percentiles towards higher wind speed values at the 850 hPa pressure level; for the purpose of our study, we interpreted this shift as an increase in wind intensity.
Compared to most of the other subregions, for Central Europe the majority of the results were reported for storm frequency and wind intensity. In each case, the eight studies we evaluated, strongly indicated an increase. Furthermore, three studies projected an increasing storm intensity [2,28,70], and two studies suggested an increasing storm activity [50,63]. Results from [28] suggested an increase in wind-induced damage in the future. The study of [74] gave an overview of the future development of storminess over Germany. They used one GCM to drive three RCMs which projected gust speed as an indicator for storminess at a rather high horizontal resolution (<20 km). Their results basically implied a slight decrease of gust wind speed over Central and Southern Germany but suggested an increase of gust wind speed over Northern Germany.
The subregion-related total ES-score amounts to 151, = 4.7. The eT-value of 0.95 is the second highest eT-value of our evaluation and clearly indicates an increasing tendency of the future subregion-related storminess.
3.5. Southern Europe
The findings of the eleven studies for Southern Europe (Table 5) indicated, without exception, decreasing long-term behavior of storminess, including the two studies [51,64] for which we rated ES = 9. While the majority of the studies addressed projected future changes in wind intensity, three studies presented results on the expected future development of the frequency of extreme cyclones [31,69,77]. For all other assessed categories, a maximum of two studies was found that reported on projected aspects of storminess. Based on our evaluation scheme, the subregion-related total ES-score is 63, the -value is 5.3, and eT = −1.00, which unambiguously suggests a decreasing tendency of the projected future extratropical storminess.
Table 5.
Same as Table 1 but for the Southern Europe subregion.
3.6. Western Europe
The 33 studies available for this subregion (Table 6, [2,5,9,13,17,19,26,27,28,30,37,45,48,49,50,51,54,55,56,57,58,60,61,62,67,70,74,75,76,78,79,80,81]) allowed for the evaluation of all categories of aspects of projected future storminess. The majority of the evaluated studies projected an increase in frequency, intensity, and activity of storms and cyclones, as well as an increase in frequency and intensity of high-impact wind speed.
Table 6.
Same as Table 1 but for the Western Europe subregion.
Results of [50] obtained from an ensemble of 19 CMIP3-models, implied an increase in storm activity. From the results of [51,78], an increasing frequency of extreme cyclones can be inferred, while another study [56] reported an increase in cyclone activity. The results of the study of [5] showed an increase in cyclone intensity and at the same time a decreasing storm frequency.
Two of the evaluated studies also reported on the future development of storm damage. While the results from [17] indicated an increase of wind-induced damage, the study of [28] suggested a decrease in projected wind-induced damage. In two further studies, no change in analyzed long-term development of storminess was found: One study [48] did not identify a change in expected wind intensity over the North Sea, and another study [45] reported no change in cyclone intensity over the UK.
The subregion-related total ES-score is 221, the -value equals 4.7, and the eT-value is 0.84; thus, we strongly assume that projected future storminess will increase in this subregion.
3.7. Eastern Europe
Altogether we found five studies for the Eastern Europe subregion (Table 7). Therefore, the results of our evaluation in this subregion are probably the least robust in comparison to the other subregions, not only because of the low number of available studies but also because of the limited (according to our evaluation scheme) methodological complexity of the evaluated studies. Among the studies available for evaluation, there was no study comprising RCP-scenarios and/or multi-model ensembles. Only two studies used more than one GCM [17,53]. Their results suggested an increase in future wind intensity. While one study [17] investigated the change of the ensemble mean of extreme wind speed, another study investigated the strength of extreme wind speed events with a return period of ten years [53].
Table 7.
Same as Table 1 but for the Eastern Europe subregion.
Overall, results concerning the future development of storminess over Eastern Europe are inconclusive. While findings from the study of [59] implied a decrease for Russia, another study projected an increasing number of cyclones over parts of Russia [67]. The subregion-specific total ES-score amounts to 36, = 4.5, and eT = 0.56.
3.8. Changes in the North Atlantic Oscillation and Storm Tracks
The studies summarized in Table 8 [9,25,31,36,38,48,50,51,52,54,56,59,60,61,63,64,65,69,80,81,82,83,84,85,86,87] report on projections of future NAO- and storm track characteristics over the NAER. The reported results are quite diverse. Sixteen out of the 26 assessed studies indicated that future storm tracks will at least partly shift either northward, northeastward, eastward, or poleward. However, findings from ten studies implied storm tracks shifting south- or southeastward. Furthermore, there were five studies that suggested no shifts in the long-term development of storm tracks. With respect to NAO-characteristics, the results from three of the studies indicated a northeastward shift of the NAO in the future. The NAO- and storm track-related total ES-score amounts to 129, and equals 5.0.
Table 8.
Studies reporting on projections of future NAO- and/or storm track characteristics over the NAER.
4. Summary and Conclusions
Our research on the current literature yielded a total of 58 studies modeling aspects of the projected future storminess over the NAER. Through a categorical evaluation scheme based on the ranking of emission scenarios and modeling complexity, we attempted a joint evaluation of the methodologically highly diverse studies. The intention was to disclose to which degree the studies yielded either shared or differing general tendencies in the projected future development of storminess. In our evaluation, we did not attempt to treat the NAER as a whole but differentiated for seven subregions for the following two reasons: On the one hand, the spatial reference of the evaluated studies allowed for a differentiation, as they all clearly referred to subregions within the NAER. On the other hand, it is highly improbable that aspects of storminess will show consistent development throughout the NAER in the future.
Not unexpectedly, a heterogeneous picture of the projected future storminess emerges from the evaluation. From a total of 156 ratings, (i) 76% suggest an increase; (ii) 21% indicate a decrease; and (iii) 3% of the ratings do not indicate any change in the projected aspects of storminess. With respect to the assessed categories of storminess (Table 9), most of the ratings refer to results from studies addressing future changes in the intensity of high-impact wind speed (43 ratings) and frequency of extreme cyclones (35 ratings).
Table 9.
Number of ratings assigned to categories of aspects of projected future storminess over the NAER.
Despite the noteworthy differences in the number and quality of studies available for the evaluated subregions, it is apparent that the projected future development of storminess is quite heterogeneous and not consistent in the NAER. However, within the subregions, results on projected aspects of future storminess are clearer. For the three subregions Central Europe, North Atlantic south of 60°N, and Western Europe, the evaluated studies clearly indicate (>90% of the ratings) increasing tendencies for projected aspects of future storminess (Figure 2). For Eastern and Northern Europe, the majority of ratings (75% and 74%) also indicates increasing tendencies in projected aspects of future storminess; however, the studies available for these two subregions also indicate, in more than 20% of the ratings, decreasing tendencies of aspects of future storminess. Predominantly decreasing tendencies of aspects of storminess are indicated for subregions North Atlantic north of 60°N (85% of the ratings) and Southern Europe (100% of the ratings).
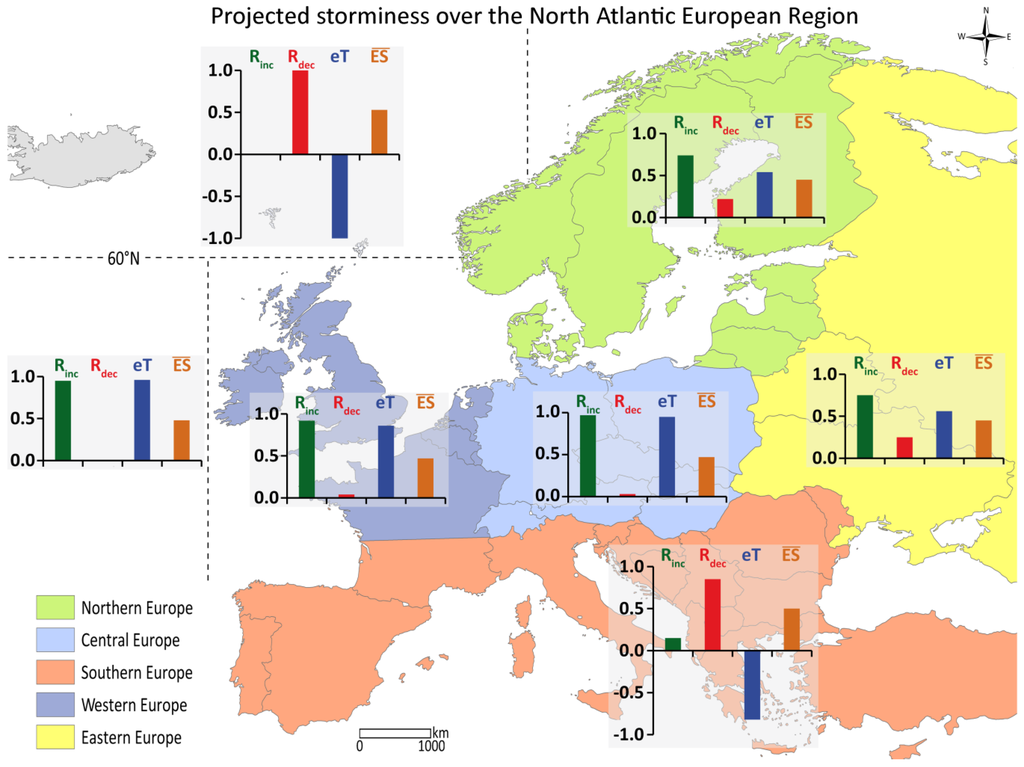
Figure 2.
Relative proportions of ratings indicating either increasing (Rinc) or decreasing (Rdec) tendencies of aspects of projected future storminess, subregion-related eT-, and -values for the seven subregions of the NAER. The -values were divided by 10 to adapt them to the scaling. The height of the columns corresponds to the numbers given in the subregion-related text sections.
The relative distribution of the subregion-related ratings is mirrored by the summary of the subregion-related eT-values . While eT-values computed for Central Europe, the North Atlantic region south of 60°N and Western Europe indicate clear tendencies for an increasing storminess in these subregions, eT-values computed for the North Atlantic region north of 60°N and the Southern Europe region strongly suggest decreasing tendencies in storminess. Based on the eT-values, we deemed the results on the projected future development of storminess over Eastern and Northern Europe as inconclusive. However, we believe that, in particular, the interpretation of our findings for Eastern Europe and Southern Europe is limited for two reasons: For Eastern Europe, there were only few studies available, and the evaluation of studies available for the Southern European subregion was restricted to the projected development of extratropical storms and cyclones. In the evaluation, we did not address the projected future development of tropical storms and cyclones, which might be of importance for the long-term evolution of storminess in this particular subregion. For example, results from [59] implied an increase in wind intensity associated with tropical cyclones, while there was indication that wind intensity associated with extratropical cyclones would simultaneously decrease. In addition, there is an indication that tropical cyclones might transform into extratropical cyclones as they move northward. Since tropical cyclones are expected to intensify in a warmer climate, this could also boost extratropical storms in the summer and autumn [31].
Across the evaluated subregions, the -values vary between 4.5 and 5.3, which hints at a nearly balanced mean weighting of the seven analyzed subregions.
The results from the majority of studies that reported on the future development of storm tracks over the NAER point in a similar direction, as they mostly suggested a north- and eastward shift of storm tracks. Regardless of the results reported for the Northern Europe subregion, based on the storm track-related findings, it must be concluded that Northern Europe is probably the most strongly subject to potential increases in aspects of future storminess.
The comparison of the results presented in this review with results from previous reviews [11,22,23,24] on the storminess over NAER is limited. This is mainly due to methodological reasons. We did not only use a different evaluation scheme, but we have also assessed changes in categories of aspects of projected storminess in subregions of the NAER which are based on a pool of studies that differed from the pools of studies included in previous reviews.
Author Contributions
Tina Mölter developed the research idea, designed the study, carried out the study evaluation, and co-wrote the manuscript. Dirk Schindler developed the research idea and wrote the manuscript. Axel Tim Albrecht developed the research idea and commented on the manuscript. Ulrich Kohnle helped to refine the research idea and commented on the manuscript.
Conflicts of Interest
The authors declare no conflict of interest.
Appendix A
Table A1.
Models used or mentioned in the reviewed studies and subregion(s) covered by the model grids. Although not all listed models are general circulation models, GCM is used to indicate the global scale of the model grid. RCM stands for regional climate model or indicates the regional scale of the model grid. The listed studies are sorted according to the surname of the lead author.
| Study | Model(s) | Subregion(s), NAO/Storm Track | |
|---|---|---|---|
| Barstad et al. (2012) [19] | GCM: | Arpege/IFS, GFDL V2.0, ECHAM5, HADCM3, CCSM3 | Western Europe |
| RCM: | - | ||
| Beersma et al. (1997) [62] | GCM: | ECHAM3 | North Atlantic south of 60°N, Northern Europe, Western Europe |
| RCM: | - | ||
| Bengtsson et al. (2006) [9] | GCM: | ECHAM5/MPI-OM | North Atlantic north of 60°N, North Atlantic south of 60°N, Southern Europe, Western Europe, change of storm/cyclone track or NAO |
| RCM: | - | ||
| Bengtsson et al. (2009) [31] | GCM: | ECHAM5 | North Atlantic south of 60°N, Northern Europe, Central Europe, Southern Europe, change of storm/cyclone track or NAO |
| RCM: | - | ||
| Beniston et al. (2007) [70] | GCM: | HadAM3H | Central Europe, Southern Europe, Western Europe |
| RCM: | HIRHAM, HadRM3H/P, RCAO, REMO, CHRM, CLM, RASMO3 | ||
| Carnell et al. (1996) [80] | GCM: | UKMO | Western Europe, change of storm/cyclone track or NAO |
| RCM: | - | ||
| Catto et al. (2011) [85] | GCM: | HiGEM1.1 | Change of storm/cyclone track or NAO |
| RCM: | - | ||
| Della-Marta and Pinto (2009) [26] | GCM: | ECHAM5/OM1 | Western Europe |
| RCM: | - | ||
| Donat et al. (2010) [2] | GCM: | BCCr-BCM2, CNRM-CM3, DMI-ECHAM5, FUB-EGMAM, IPSL-CM4, MPI-ECHAM5, METO-HC-HadGEM1 | North Atlantic south of 60°N, Central Europe, Western Europe |
| RCM: | - | ||
| Donat et al. (2011) [17] | GCM: | BCCr-BCM2, CNRM-CM3, DMI-ECHAM5, FUB-EGMAM, IPSL-CM4, MPI-ECHAM5, METO-HC-HadGEM1 | Northern Europe, Central Europe, Southern Europe, Western Europe, Eastern Europe |
| RCM: | C4I-RCA3, HC-HadRM3, ETHZ-CLM, CNRM-RM4.5, DMI-HIRHAM, METNO-HIRHAM, KNMI-RACMO2, MPI-REMO, SMHI-RCA3 | ||
| Fink et al. (2009) [38] | GCM: | ECHAM5/MPI-OM | Central Europe, Southern Europe, change of storm/cyclone track or NAO |
| RCM: | REMO, COSMO-CLM | ||
| Fischer-Bruns et al. (2005) [36] | GCM: | ECHAM4/HOPE-G | Change of storm/cyclone track or NAO |
| RCM: | - | ||
| Gastineau and Soden (2009) [64] | GCM: | CGCM3.1 (T47), CGCM3.1 (T63), CSIRO-Mk3.0, CSIRO-Mk3.5, CNRM-CM3, GFDL-CM2.0, GFDL-CM2.1, GISS-AOM, FGOALS-g1.0, INM-CM 3.0, IPSL-CM4, MIROC3.2, MIUB/ECHO-G, ECHAM5/MPI-OM, ECHAM5/INGV, MRI_CGCM2.3.2 | Northern Europe, Central Europe, Southern Europe, change of storm/cyclone track or NAO |
| RCM: | - | ||
| Geng and Sugi (2003) [52] | GCM: | JMA8911 | North Atlantic north of 60°N, North Atlantic south of 60°N, change of storm/cyclone track or NAO |
| RCM: | - | ||
| Gerstengarbe et al. (2013) [71] | GCM: | - | Central Europe |
| RCM: | STARS | ||
| Giorgi et al. (2004) [63] | GCM: | HadAM3H | Northern Europe, Central Europe, Southern Europe, change of storm/cyclone track or NAO |
| RCM: | HadRM3H | ||
| Gregow et al. (2012) [53] | GCM: | BCCR-BCM2.0, CGCM3.1, CNRM-CM3, ECHAM5/MPI-OM, GFDL-CM2.1, IPSL-CM4, MIROC3.2, MRI-CGCM2.3.2, NCAR-CCSM3 | North Atlantic north of 60°N, Northern Europe, Eastern Europe |
| RCM: | - | ||
| Hanson et al. (2003) [45] | GCM: | HadAM3H | North Atlantic south of 60°N, Western Europe |
| RCM: | HadRM3H | ||
| Harvey et al. (2012) [50] | GCM: | BCC-CSM1.1, CanESM2, CNRM-CM5, CSIRO-Mk3.6.0, EC-EARTH, FGOALS-g2, GFDL-ESM2G, GFDL-ESM2M, HadGEM2-CC, HadGEM2-ES, INM-CM4, IPSL-CM5A-LR, IPSL-CM5A-MR, MIROC-ESM, MIROC-ESM-CHEM, MIROC5, MPI-ESM-LR, MRI-CGCM3, NorESM1-M (CMIP5 models) | North Atlantic north of 60°N, North Atlantic south of 60°N, change of storm/cyclone track or NAO |
| BCCR-BCM2.0, CGCM3.1 (T47), CGCM3.1 (T63), CNRM-CM3, CSIRO-CM3, CSIRO-Mk3.0, CSIRO-Mk3.5, ECHAM5/MPI-OM, ECHO-G, GFDL-CM2.0, GFDL-CM2.1, GISS-AOM, GISS-ER, INVG-SXG, INM-CM3.0, IPSL-CM4, MIROC3.2, MRI-CGCM2.3.2, NCAR CCSM3 (CMIP3 models) | North Atlantic south of 60°N, Central Europe, Western Europe | ||
| RCM: | - | ||
| Karremann et al. (2014) [30] | GCM: | ECHAM5/MPI-OM1 | Northern Europe, Central Europe, Western Europe |
| RCM: | - | ||
| Klaus et al. (2011) [72] | GCM: | ECHAM5/MPI-OM1 | Central Europe |
| RCM: | - | ||
| Knippertz et al. (2000) [69] | GCM: | ECHAM4/OPYC3 | Northern Europe, Southern Europe, change of storm/cyclone track or NAO |
| RCM: | - | ||
| Laine (2009) [84] | GCM: | CNRM-CM3, IPSL-CM4 | Change of storm/cyclone track or NAO |
| RCM: | - | ||
| Lambert (1995) [86] | GCM: | GCMII | Change of storm/cyclone track or NAO |
| RCM: | - | ||
| Lambert and Fyfe (2006) [82] | GCM: | CCCMA (T47), CNRM, GFDL2.0, GFDL2.1, GISS-AOM, GISS-EH, GISS-ER, INM, IPSL, MIROC, ECHAM5/MPI, MRI, NCAR-PCM, NCAR-CCSM | Change of storm/cyclone track or NAO |
| RCM: | - | ||
| Leckebusch and Ulbrich (2004) [54] | GCM: | HadCM3 | North Atlantic north of 60°N, North Atlantic south of 60°N, Northern Europe, Central Europe, Western Europe, change of storm/cyclone track or NAO |
| RCM: | HadRM3H | ||
| Leckebusch et al. (2006) [13] | GCM: | ECHAM4/OPYC3, ECHAM5/MPI-OM1, HadAM3P, HadAM3H | North Atlantic north of 60°N, North Atlantic south of 60°N, Western Europe |
| RCM: | HadRM3P, HIRHAM4, CHRM, RCAO | ||
| Leckebusch et al. (2008) [57] | GCM: | MPI-ECHAM5, DMI-ECHAM5, IPSL-CM4, FUB-EGMAM, CNRM-CM3, BCCR-BCM2, HadGEM1 | North Atlantic south of 60°N, Western Europe |
| RCM: | - | ||
| Leckebusch et al. (2008) [58] | GCM: | ECHAM5-OM1 | North Atlantic south of 60°N, Western Europe |
| RCM: | - | ||
| Leckebusch et al. (2008) [76] | GCM: | ECHAM4/OPYC3 | Central Europe, Western Europe |
| RCM: | - | ||
| Lionello et al. (2008) [59] | GCM: | HadAM3H (HadCM3 provides SST) | North Atlantic south of 60°N, Eastern Europe, change of storm/cyclone track or NAO |
| RCM: | RegCM | ||
| Löptien et al. (2008) [65] | GCM: | ECHAM4/OPYC3, ECHAM5/OM | Northern Europe, change of storm/cyclone track or NAO |
| RCM: | - | ||
| Lozano et al. (2004) [5] | GCM: | ECHAM4 A-GCM (boundary conditions derived by OA-GCM) | Western Europe |
| RCM: | - | ||
| McDonald (2011) [60] | GCM: | HadAM3P (driven by boundary conditions derived from observations and HadCM3 experiments) | North Atlantic south of 60°N, Western Europe, change of storm/cyclone track or NAO |
| RCM: | - | ||
| Mizuta (2012) [78] | GCM: | BCC-CSM1.1, CCSM4, CSIRO- Mk3-6-0, GFDL-ESM2G, HadGEM2 -CC, INMCM4, IPSL-CM5A-LR, MIROC5, MPI-ESM-LR, MRI-CGCM3, NorESM1-M | Western Europe |
| RCM: | - | ||
| Mizuta et al. (2011) [67] | GCM: | MRI-AGCM3.1 | Northern Europe, Western Europe, Eastern Europe |
| RCM: | - | ||
| Muskulus and Jacob (2005) [77] | GCM: | ECHAM4/OPYC3 | Southern Europe |
| RCM: | REMO 5.1 | ||
| Nikulin et al. (2011) [66] | GCM: | ECHAM5, CCSM3, HadCM3, CNRM, BCM, IPSL | Northern Europe, Southern Europe |
| RCM: | RCA3 | ||
| Pinto et al. (2006) [25] | GCM: | ECHAM4/OPYC3 | North Atlantic north of 60°N, change of storm/cyclone track or NAO |
| RCM: | - | ||
| Pinto et al. (2007) [37] | GCM: | ECHAM5/MPI-OM1 | North Atlantic north of 60°N, Northern Europe, Central Europe, Southern Europe, Western Europe |
| RCM: | - | ||
| Pinto et al. (2007) [61] | GCM: | ECHAM5/MPI-OM1 | North Atlantic south of 60°N, Central Europe, Southern Europe, Western Europe, change of storm/cyclone track or NAO |
| RCM: | - | ||
| Pinto et al. (2009) [55] | GCM: | ECHAM5/MPI-OM1 | North Atlantic north of 60°N, Northern Europe, Central Europe, Western Europe |
| RCM: | - | ||
| Pinto et al. (2010) [73] | GCM: | ECHAM5/MPI-OM1 | Central Europe |
| RCM: | FOOT3DK | ||
| Pinto et al. (2012) [28] | GCM: | ECHAM5/MPI-OM1 | Northern Europe, Central Europe, Western Europe |
| RCM: | - | ||
| Pryor et al. (2006) [46] | GCM: | BCCR-BCM2.0, BCC-CM1, CGCM3.1, CNRM-CM3, ECHAM5/MPI-OM, GFDL-CM2.0, GISS-ModelE20/Rusell, IPSL-CM4, MIROC3.2, MRI-CHCM2.2.2 | Northern Europe |
| RCM: | - | ||
| Pryor et al. (2012) [68] | GCM: | ECHAM5/MPI-OM | Northern Europe |
| RCM: | HIRHAM5, RCA3 | ||
| Rauthe et al. (2010) [74] | GCM: | ECHAM5/MPI-OM | Central Europe, Western Europe |
| RCM: | CCLM1 and 2, REMO | ||
| Rockel and Woth (2007) [75] | GCM: | HadAM3H, (HadCM3 provides SST and sea ice conditions) | Central Europe, Western Europe, Eastern Europe |
| RCM: | HIRHAM, CHRM, CLM, HadRM3, RACMO, REMO, RCAO, PROMES | ||
| Schubert et al. (1998) [87] | GCM: | ECHAM3 (ECHAM1/LSG provides SST and sea ice conditions) | Change of storm/cyclone track or NAO |
| RCM: | - | ||
| Schwierz et al. (2010) [27] | GCM: | HadAM3, ECHAM5 | North Atlantic north of 60°N, Northern Europe, Central Europe, Southern Europe, Western Europe |
| RCM: | CLM, CHRM | ||
| Semmler et al. (2008) [47] | GCM: | ECHAM5-OM1 | North Atlantic south of 60°N |
| RCM: | RCA3 | ||
| Sterl et al. (2009) [79] | GCM: | ECHAM5/MPI-OM | Western Europe |
| RCM: | - | ||
| Ulbrich and Christoph (1999) [81] | GCM: | ECHAM4/OPYC3 | Western Europe, change of storm/cyclone track or NAO |
| RCM: | - | ||
| Ulbrich et al. (2008) [56] | GCM: | CCCma (T47), CCCma (T63), CNRM-CM3, CSIRO-mk3.0, ECHAM5/OM1, ECHO-G, FRAU IPSL-CM4, GFDL-CM2.0, GISS-AOM, GISS E-R, IAP FGOALS-g1.0, INM-CM3.0, MIROC3.2, MRI-CGCM2.3.2, NCAR CCSM3 | North Atlantic south of 60°N, Western Europe, change of storm/cyclone track or NAO |
| RCM: | - | ||
| Walter et al. (2006) [49] | GCM: | - | Northern Europe, Central Europe, Western Europe |
| RCM: | REMO5.0 and 5.1, CLM, MCCM/MM5 | ||
| de Winter et al. (2012) [48] | GCM: | CanESM2, CSIRO-Mk3-6-0, EC-Earth, GFDL-ESM2G, GFDL-ESM2M, HadGEM2-CC, HadGEM2-ES, IOSL-CM5a-MR, MIROC-ESM-CHEM, MIROC5, MPI-ESM-LR, MRI-CGCM3 | Western Europe, change of storm/cyclone track or NAO |
| RCM: | - | ||
| Yin (2005) [83] | GCM: | MIROC3.2, CCSM3, ECHAM5/MPI-OM, GFDL-CM2.0, GFDL-CM2.1, CNRM-CM3, MIROC3.2, MRI-CGCM2.3.2, FGOALS-g1.0, IPSL-CM4, CGCM3.1 (T47), ECHO-G, GISS-AOM, GISS-ER, INM-CM3.0 | Change of storm/cyclone track or NAO |
| RCM: | - | ||
| Zappa et al. (2013) [51] | GCM: | BCC-CSM1.1, CanESM2, CNRM-CM5, CSIRO-Mk3.6.0, EC-EARTH, FGOALS-g2, GFDL-ESM2M, GFDL-ESM2G, HadGEM2-CC, HadGEM2-ES, INM-CM4, IPSL-CM5A-LR, IPSL-CM5A-MR, MPI-ESM-LR, MRI-CGCM3, MIROC5, MIROC-ESM, MIROC-ESM-CHEM, NorESM1-M | North Atlantic north of 60°N, Central Europe, Southern Europe, Western Europe, change of storm/cyclone track or NAO |
| RCM: | - | ||
Appendix B
Table B1.
Climate scenarios, variables reported in the reviewed studies and their assignment to the assessed categories frequency, intensity and activity for the subregions evaluated in this review. The listed studies are sorted according to the surname of the lead author.
| North Atlantic North of 60°N | |||
| Study | Climate Scenario | Variable(s) Reported | Categories of Aspects of Storminess |
| Bengtsson et al. (2006) [9] | SRES A1B | Storm track intensity | Cyclone intensity |
| Geng and Sugi (2003) [52] | IS92a | Density of strong cyclones (central pressure gradient >30 hPa·(1000 km)−1) | Frequency of extreme cyclones |
| Gregow et al. (2012) [53] | SRES A1B, A2, B1 | Strength of the 10-year return period extreme wind speed | Wind intensity |
| Harvey et al. (2012) [50] | RCP4.5 | Storm activity | Storm activity |
| Leckebusch and Ulbrich (2004) [54] | SRES A2, B2 | Number of extreme cyclones | Frequency of extreme cyclones |
| Leckebusch et al. (2006) [13] | SRES A2 (IS92a for ECHAM4/OPYC3) | Cyclone track density of the strongest 5% | Frequency of extreme cyclones |
| Pinto et al. (2006) [25] | IS92a | Number of intense cyclones, cyclone intensity | Frequency of extreme cyclones, cyclone intensity |
| Pinto et al. (2007) [37] | SRES A1B, A2 | 98th wind percentile | Wind intensity |
| Pinto et al. (2009) [55] | SRES A1B | Track density and intensity of extreme cyclones (10% most severe in term of intensity) | Frequency of extreme cyclones, cyclone intensity |
| Schwierz et al. (2010) [27] | SRES A2 | Strength of extreme storms expressed in gust speed | Storm intensity |
| Zappa et al. (2013) [51] | RCP4.5, RCP8.5 | Wind intensity | Wind intensity |
| Beersma et al. (1997) [62] | CO2-experiment | Number of storm events | Storm frequency |
| Bengtsson et al. (2006) [9] | SRES A1B | Cyclone track density and intensity, number of stronger storms (>10 × 10−5 s−1) | Frequency of extreme cyclones, cyclone intensity |
| Bengtsson et al. (2009) [31] | SRES A1B | 99.5th percentile of wind speed in 925 hPa as an aspect of extratropical cyclones | Cyclone intensity |
| Donat et al. (2010) [2] | SRES A1B | Intensity of storm cyclones and associated wind speed | Cyclone intensity, wind intensity |
| Geng and Sugi (2003) [52] | IS92a | Density of strong cyclones (central pressure gradient >30 hPa/1000 km) | Frequency of extreme cyclones |
| Hanson et al. (2003) [45] | SRES A2a, B2a | Number of extreme cyclones (<970 hPa), intensity of cyclones | Frequency of extreme cyclones, cyclone intensity |
| Harvey et al. (2012) [50] | SRES A1B, RCP4.5 | Cyclone activity | Cyclone activity |
| Leckebusch and Ulbrich (2004) [54] | SRES A2, B2 | Track density of extreme cyclones (defined by the exceedance of the 95th per- centile of the Laplacian of MSLP), cyclone intensity | Frequency of extreme cyclones, cyclone intensity |
| Leckebusch et al. (2006) [13] | SRES A2 (IS92a for ECHAM4/OPYC3) | Number of extreme cyclones, cyclone track density of the strongest 5% | Frequency of extreme cyclones |
| Leckebusch et al. (2008) [57] | SRES A1B | Extreme cyclones which are connected to wind storms | Storm frequency |
| Leckebusch et al. (2008) [58] | SRES A1B, A2 | Storm severity defined by its impacts | Storm intensity |
| Lionello et al. (2008) [59] | SRES A2, B2 | Frequency and intensity of extreme cyclones | Frequency of extreme cyclones, cyclone intensity |
| McDonald (2011) [60] | SRES A2 | Ensemble mean number of gale days per winter for storms and stronger events (Bft ≥ 10) | Storm frequency |
| Pinto et al. (2007) [61] | SRES A1B, A2, B1 | Number of intense cyclones (>2.5 hPa/(deg. lat)²) | Frequency of extreme cyclones |
| Semmler et al. (2008) [47] | SRES A2 | Maximum wind speed | Wind intensity |
| Ulbrich et al. (2008) [56] | SRES A1B | Storm track activity | Cyclone activity |
| Northern Europe | |||
| Study | Climate Scenario | Variable(s) Reported | Categories of Aspects of Storminess |
| Beersma et al. (1997) [62] | CO2-experiment | Number of storm events | Storm frequency |
| Bengtsson et al. (2009) [31] | SRES A1B | Number of cyclones for winds >45 m/s and 99.5th percentile of wind speed at 925 hPa | Frequency of extreme cyclones, cyclone intensity |
| Donat et al. (2011) [17] | SRES A1B | Ensemble mean of extreme wind speed (98th percentile of daily maximum wind speed) | Wind intensity |
| Gastineau and Soden (2009) [64] | SRES A1B | 95th-99th percentile of 850 hPa pressure level wind speed | Wind intensity |
| Giorgi et al. (2004) [63] | SRES A2, B2 | Precipitation changes due to changes in storm activity | Storm activity |
| Gregow et al. (2012) [53] | SRES A1B, A2, B1 | Strength of the 10-year return period of extreme wind speed | Wind intensity |
| Karremann et al. (2014) [30] | SRES A1B | Return period of 1yrl and 2yrl storm events | Storm frequency |
| Knippertz et al. (2000) [69] | IS92a | Storm track activity, extreme wind speed, deep cyclones with core pressure less than 970 hPa | Frequency of extreme cyclones, cyclone activity, wind intensity |
| Leckebusch and Ulbrich (2004) [54] | SRES A2, B2 | Track density of extreme cyclones | Frequency of extreme cyclones |
| Löptien et al. (2008) [65] | SRES A1B | Intense cyclones with a central pressure <980 hPa | Frequency of extreme cyclones |
| Mizuta et al. (2011) [67] | SRES A1B | Number of intense cyclones, frequency of strong wind | Frequency of extreme cyclones, frequency of extreme wind speed |
| Nikulin et al. (2011) [66] | SRES A1B | Ensemble mean of the 10 m daily maximum gust wind in terms of the 20 yr return value | Wind intensity |
| Pinto et al. (2007) [37] | SRES A1B, A2 | Value of the 98th wind percentile | Wind intensity |
| Pinto et al. (2009) [55] | SRES A1B | Track density of very extreme storms which undergo a strong intensification phase close to Europe | Frequency of extreme cyclones |
| Pinto et al. (2012) [28] | SRES B1, A1B, A2 | Intensity of windstorms, return levels for losses due to windstorms | Storm intensity |
| Pryor et al. (2006) [46] | SRES A2 | 90th percentile wind speed | Wind intensity |
| Pryor et al. (2012) [68] | SRES A1B | 50-year return period of wind speed, 98th percentile wind gust magnitude | Wind intensity |
| Schwierz et al. (2010) [27] | SRES A2 | Gust events, strength of extreme storms expressed in gust speed | Frequency of extreme wind speed, wind intensity |
| Walter et al. (2006) [49] | Not mentioned | Mean changes of wind velocities | Wind intensity |
| Central Europe | |||
| Study | Climate Scenario | Variable(s) Reported | Categories of Aspects of Storminess |
| Bengtsson et al. (2009) [31] | SRES A1B | Number of cyclones for winds >45 m/s and 99.5th percentile of wind speed at 925 hPa | Frequency of extreme cyclones, cyclone intensity |
| Beniston et al. (2007) [70] | SRES A2 | 90th percentile of daily wind speed | Storm intensity |
| Donat et al. (2010) [2] | SRES A1B | Number of storm days and associated mean daily maximum wind speed | Storm frequency, storm intensity |
| Donat et al. (2011) [17] | SRES A1B | Ensemble mean of extreme wind speed | Wind intensity |
| Fink et al. (2009) [38] | SRES A1B | Risk of wind storms | Storm frequency |
| Gastineau and Soden (2009) [64] | SRES A1B | 95th-99th percentile of 850 hPa pressure level wind speed | Wind intensity |
| Gerstengarbe et al. (2013) [71] | SRES A1B | Winter storm related loss events | Storm frequency |
| Giorgi et al. (2004) [63] | SRES A2, B2 | Precipitation changes due to changes in storm activity | Storm activity |
| Harvey et al. (2012) [50] | SRES A1B | Storm activity | Storm activity |
| Karremann et al. (2014) [30] | SRES A1B | Return period of 2yrl storm events | Storm frequency |
| Klaus et al. (2011) [72] | SRES A1B | Frequency of severe storms | Storm frequency |
| Leckebusch and Ulbrich (2004) [54] | SRES A2, B2 | Track density of extreme cyclones | Frequency of extreme cyclones |
| Leckebusch et al. (2008) [76] | IS92a | Occurrence of extreme wind speed and storm situations, pressure gradient of cyclones | Storm frequency, cyclone intensity, frequency of extreme wind speed |
| Pinto et al. (2007) [37] | SRES A1B, A2 | 98th wind percentile | Wind intensity |
| Pinto et al. (2007) [61] | SRES A1B, A2, B1 | 98th percentile of daily maximum 10 m wind | Wind intensity |
| Pinto et al. (2009) [55] | SRES A1B | Number of windstorms | Storm frequency |
| Pinto et al. (2010) [73] | SRES A1B, A2 | Number of storm events, 98th wind gust percentile | Storm frequency, wind intensity |
| Pinto et al. (2012) [28] | SRES B1, A1B, A2 | Intensity of storms, return levels for losses due to storms | Storm intensity |
| Rauthe et al. (2010) [74] | SRES A1B, B1, A2 | Wind gust extremes for a 10-year return period | Wind intensity |
| Rockel and Woth (2007) [75] | SRES A2 | Number of storm peaks, 99th percentile of mean wind speed | Frequency of extreme wind speed, wind intensity |
| Schwierz et al. (2010) [27] | SRES A2 | Gust events, strength of storms expressed in gust speed | Frequency of extreme wind speed, wind intensity |
| Walter et al. (2006) [49] | Not mentioned | Mean change of wind velocities | Wind intensity |
| Zappa et al. (2013) [51] | RCP4.5, RCP8.5 | Number of cyclones, wind speed of cyclones | Frequency of extreme cyclones, cyclone intensity |
| Southern Europe | |||
| Study | Climate Scenario | Variable(s) Reported | Categories of Aspects of Storminess |
| Bengtsson et al. (2006) [9] | SRES A1B | Mean intensity of storm track | Cyclone intensity |
| Bengtsson et al. (2009) [31] | SRES A1B | Number of strong cyclones for winds >35 m/s and 99.5th percentile of wind speed in 925 hPa as an aspect of extra- tropical cyclones | Frequency of extreme cyclones, cyclone intensity |
| Beniston et al. (2007) [70] | SRES A2 | 90th percentile of daily wind speed | Storm intensity |
| Donat et al. (2011) [17] | SRES A1B | Ensemble mean of extreme wind speed, storm loss potential | Wind intensity |
| Fink et al. (2009) [38] | SRES A1B | Risk of occurrence of wind storms | Storm frequency |
| Gastineau and Soden (2009) [64] | SRES A1B | 95th-99th percentile of 850 hPa pressure level wind speed | Wind intensity |
| Giorgi et al. (2004) [63] | SRES A2, B2 | Precipitation changes due to changes in storm activity | Storm activity |
| Knippertz et al. (2000) [69] | IS92a | Storm track activity, extreme wind speed, deep cyclones with core pressure less than 970 hPa | Frequency of extreme cyclones, cyclone activity, wind intensity |
| Muskulus and Jacob (2005) [77] | SRES B2 | Number of strong cyclones (<995 hPa) | Frequency of extreme cyclones |
| Nikulin et al. (2011) [66] | SRES A1B | Ensemble mean of the 10 m daily maximum gust wind speed in terms of 20-year return values | Wind intensity |
| Pinto et al. (2007) [37] | SRES A1B, A2 | Value of the 98th wind percentile | Wind intensity |
| Pinto et al. (2007) [61] | SRES A1B, A2, B1 | 98th percentile of daily maximum 10 m wind | Wind intensity |
| Schwierz et al. (2010) [27] | SRES A2 | Strength of extreme storms expressed in gust speed | Wind intensity |
| Zappa et al. (2013) [51] | RCP4.5, RCP8.5 | Wind speed of cyclones | Cyclone intensity |
| Western Europe | |||
| Study | Climate Scenario | Variable(s) Reported | Categories of Aspects of Storminess |
| Barstad et al. (2012) [19] | SRES A1B | Wind speed (>27.5 m·s−1) at 100 m height | Wind intensity |
| Beersma et al. (1997) [62] | CO2-experiment | Number of storm events | Storm frequency |
| Bengtsson et al. (2006) [9] | SRES A1B | Storm track density, number of stronger storms (>10 × 10−5 s−1), mean intensity of storm track | Frequency of extreme cyclones, cyclone intensity |
| Beniston et al. (2007) [70] | SRES A2 | Number of moderate and strong storms | Storm frequency |
| Carnell et al. (1996) [80] | CO2-experiment | Stronger winds, depth of cyclones | Frequency of extreme wind speed, cyclone intensity |
| Della-Marta and Pinto (2009) [26] | SRES A1B, A2 | Return periods of extreme cyclones of all intensities | Frequency of extreme cyclones |
| Donat et al. (2010) [2] | SRES A1B | Track density and mean intensity of cyclones | Storm frequency, storm intensity |
| Donat et al. (2011) [17] | SRES A1B | Ensemble mean of extreme wind speed, loss potential | Wind intensity |
| Harvey et al. (2012) [50] | SRES A1B | Storm activity | Storm activity |
| Hanson et al. (2003) [45] | SRES A2a, B2a | Cyclone intensity | Cyclone intensity |
| Karremann et al. (2014) [30] | SRES A1B | Storm events with a return period of 1 and 2 years | Storm frequency |
| Leckebusch and Ulbrich (2004) [54] | SRES A2, B2 | Influence of windstorms, track density of extreme cyclones, cyclone intensity | Storm frequency, frequency of extreme cyclones, cyclone intensity |
| Leckebusch et al. (2006) [13] | SRES A2 (IS92a for ECHAM4/OPYC3) | Number of extreme cyclones, cyclone track density, frequency of extreme wind speed, intensity of wind speed | Frequency of extreme cyclones, frequency of extreme wind speed, wind intensity |
| Leckebusch et al. (2008) [57] | SRES A1B | Extreme cyclones which are connected to wind storms | Storm frequency |
| Leckebusch et al. (2008) [58] | SRES A1B, A2 | Storm severity defined by its impacts | Storm intensity |
| Leckebusch et al. (2008) [76] | IS92a | Relative frequency of exceedance of the local 98th percentile of the local wind | Frequency of extreme wind speed |
| Lozano et al. (2004) [5] | IS92a | Number of storms, cyclone intensity | Storm frequency, cyclone intensity |
| McDonald (2011) [60] | SRES A2 | Ensemble mean number of gale days and stronger events | Storm frequency |
| Mizuta (2012) [78] | RCP4.5 | Number of intense cyclones | Frequency of extreme cyclones |
| Mizuta et al. (2011) [67] | SRES A1B | Number of intense cyclones, frequency of strong wind | Frequency of extreme cyclones, frequency of extreme wind speed |
| Pinto et al. (2007) [37] | SRES A1B, A2 | Frequency of storms, value of the 98th wind percentile, number of extreme cyclones | Storm frequency, frequency of extreme cyclones, wind intensity |
| Pinto et al. (2007) [61] | SRES A1B, A2, B1 | 98th percentile of daily maximum 10 m wind, number of intense cyclones | Wind intensity, frequency of extreme cyclones |
| Pinto et al. (2009) [55] | SRES A1B | Track density and intensity of extreme cyclones (10% most severe in term of intensity) | Frequency of extreme cyclones, cyclone intensity |
| Pinto et al. (2012) [28] | SRES B1, A1B, A2 | Intensity of windstorms, return levels for losses due to windstorms | Storm intensity |
| Rauthe et al. (2010) [74] | SRES A1B, B1, A2 | Wind gust extremes for a 10-year return period | Wind intensity |
| Rockel and Woth (2007) [75] | SRES A2 | Number of storm peaks (gusts ≥8 Bft), 99th percentile of daily mean wind speed | Frequency of extreme wind speed, wind intensity |
| Schwierz et al. (2010) [27] | SRES A2 | Gust events | Frequency of extreme wind speed |
| Sterl et al. (2009) [79] | SRES A1B | 6-hourly wind speed >8 Bf | Wind intensity |
| Ulbrich and Christoph (1999) [81] | IS92a | Upper air storm track activity | Cyclone activity |
| Ulbrich et al. (2008) [56] | SRES A1B | Storm track activity | Cyclone activity |
| Walter et al. (2006) [49] | Not mentioned | Mean changes of wind velocities | Wind intensity |
| de Winter et al. (2012) [48] | RCP4.5, RCP8.5 | Annual maximum wind speed, wind speeds with lower return periods (1:500 year event) | Wind intensity |
| Zappa et al. (2013) [51] | RCP4.5, RCP8.5 | Cyclones associated with strong at 850 hPa wind speed | Frequency of extreme cyclones |
| Eastern Europe | |||
| Study | Climate Scenario | Variable(s) Reported | Categories of Aspects of Storminess |
| Donat et al. (2011) [17] | SRES A1B | Ensemble mean of extreme wind speed | Wind intensity |
| Gregow et al. (2012) [53] | SRES A1B, A2, B1 | Strength of the 10-year return period extreme wind speed | Wind intensity |
| Lionello et al. (2008) [59] | SRES A2, B2 | Frequency and intensity of extreme cyclones | Frequency of extreme cyclones, cyclone intensity |
| Mizuta et al. (2011) [67] | SRES A1B | Number of intense cyclones, frequency of strong wind | Frequency of extreme cyclones, frequency of extreme wind speed |
| Rockel and Woth (2007) [75] | SRES A2 | Number of storm peaks, 99th percentile of daily mean wind speed | Frequency of extreme wind speed, wind intensity |
References
- Munich, R.E. Significant Natural Disasters since 1980. Costliest Winter Storms in Europe; Publication of the Munich Re: Munich, Germany, 2015. [Google Scholar]
- Donat, M.G.; Leckebusch, G.C.; Pinto, J.G.; Ulbrich, U. European storminess and associated circulation weather types: Future changes deduced from a multi-model ensemble of GCM simulations. Clim. Res. 2010, 42, 27–43. [Google Scholar] [CrossRef]
- Schuck, A.; Schelhaas, M.-J. Storm damage in Europe—An overview. In What Science Can Tell Us. Living with Storm Damage to Forests; Gardiner, B., Schuck, A., Schelhaas, M.J., Orazio, C., Blennow, K., Nicoll, B., Eds.; European Forest Institute: Barcelona, Spain, 2013; pp. 15–23. [Google Scholar]
- Dawson, A.; Elliott, L.; Noone, S.; Hickey, K.; Holt, T.; Wadhams, P.; Foster, I. Historical storminess and climate ‘see-saw’ in the North Atlantic region. Mar. Geol. 2004, 210, 247–259. [Google Scholar] [CrossRef]
- Lozano, I.; Devoy, R.J.N.; May, W.; Andersen, U. Storminess and vulnerability along the Atlantic coastlines of Europe: Analysis of storm records and of a greenhouse gases induced climate scenario. Mar. Geol. 2004, 210, 205–225. [Google Scholar] [CrossRef]
- Clarke, M.L.; Rendell, H.M. The impact of North Atlantic storminess on western European coasts: A review. Quatern. Int. 2009, 195, 31–41. [Google Scholar] [CrossRef]
- Hurrell, J.W.; Kushnir, Y.; Visbeck, M. The North Atlantic Oscillation. Science 2001, 291, 603–605. [Google Scholar] [CrossRef] [PubMed]
- Keim, B.D.; Muller, R.A.; Stone, G.W. Spatial and temporal variability of coastal storms in the North Atlantic Basin. Mar. Geol. 2004, 210, 7–15. [Google Scholar] [CrossRef]
- Bengtsson, L.; Hodges, K.I.; Roeckner, E. Storm tracks and climate change. J. Clim. 2006, 19, 3518–3543. [Google Scholar] [CrossRef]
- Greeves, C.Z.; Pope, V.D.; Stratton, R.A.; Martin, G.M. Representation of Northern Hemisphere winter storm tracks in climate models. Clim. Dyn. 2007, 28, 683–702. [Google Scholar] [CrossRef]
- Bader, J.; Mesquita, M.D.S.; Hodges, K.I.; Keenlyside, N.; Østerhus, S.; Miles, M. A review on Northern Hemisphere sea-ice, storminess and the North Atlantic Oscillation: Observations and projected changes. Atmos. Res. 2011, 101, 809–834. [Google Scholar] [CrossRef]
- Marshall, J.; Kushnir, Y.; Battistic, D.; Chang, P.; Czaja, A.; Dickson, R.; Hurrel, J.; McCartney, M.; Saravanan, R.; Visbeck, M. North atlantic climate variability: Phenomena, impacts and mechanisms, review. Int. J. Climatol. 2001, 21, 1863–1898. [Google Scholar] [CrossRef]
- Leckebusch, G.C.; Koffi, B.; Ulbrich, U.; Pinto, J.G.; Spangehl, T.; Zacharias, S. Analysis of frequency and intensity of European winter storm events from a multi-model perspective, at synoptic and regional scales. Clim. Res. 2006, 31, 59–74. [Google Scholar] [CrossRef]
- Pfister, C. Winterstürme. In Wetternachhersage, 500 Jahre Klimavariationen und Naturkatastrophen; Haupt-Verlag: Bern, Switzerland, 1999; pp. 246–255. (In German) [Google Scholar]
- Fischer, H.; Mieding, B. A 1000-year ice core record of interannual to multidecadal variations on atmospheric circulation over the North Atlantic. Clim. Dyn. 2005, 25, 65–74. [Google Scholar] [CrossRef]
- Klawa, M.; Ulbrich, U. A model for the estimation of storm losses and the identification of severe winter storms in Germany. Nat. Hazard Earth Syst. Sci. 2003, 3, 725–732. [Google Scholar] [CrossRef]
- Donat, M.G.; Leckebusch, G.C.; Wild, S.; Ulbrich, U. Future changes in European winter storm losses and extreme wind speeds inferred from GCM and RCM multi-model simulations. Nat. Hazard Earth Sys. Sci. 2011, 11, 1351–1370. [Google Scholar] [CrossRef]
- Kleemann, M. Stürmische Perspektiven—Nutzungsmöglichkeiten und Grenzen der Windenergie. Physik in unserer Zeit 1996, 27, 60–68. (In German) [Google Scholar] [CrossRef]
- Barstad, I.; Sorteberg, A.; Mesquita, M.D.S. Present and future offshore wind power potential in northern Europe based on downscaled global climate runs with adjusted SST and sea ice cover. Renew. Energ. 2012, 44, 398–405. [Google Scholar] [CrossRef]
- Young, G.S.; Kristensen, L. Surface-layer gusts for aircraft operation. Bound. Lay Meteor. 1992, 59, 231–242. [Google Scholar] [CrossRef]
- Manasseh, R.; Middleton, J.H. The surface wind gust regime and aircraft operations at Sydney Airport. J. Wind Eng. Ind. Aerod. 1999, 79, 269–288. [Google Scholar] [CrossRef]
- Albrecht, A.; Schindler, D.; Grebhan, K.; Kohnle, U.; Mayer, H. Sturmaktivität über der nordatlantisch-europäischen Region vor dem Hintergrund des Klimawandels: Eine Literaturübersicht. Allg. Forst Jagdztg. 2009, 180, 109–118. (In German) [Google Scholar]
- Ulbrich, U.; Leckebusch, G.C.; Pinto, J.G. Extra-tropical cyclones in the present and future climate: A review. Theor. Appl. Climatol. 2009, 96, 117–131. [Google Scholar] [CrossRef]
- Feser, F.; Barcikowska, M.; Krueger, O.; Schenk, F.; Weisse, R.; Xia, L. Storminess over the North Atlantic and northwestern Europe—A review. Q. J. Roy. Meteor. Soc. 2015, 141, 350–382. [Google Scholar] [CrossRef]
- Pinto, J.G.; Spangehl, T.; Ulbrich, U.; Speth, P. Assessment of winter cyclone activity in a transient ECHAM4-OPYC3 GHG experiment. Meteorol. Z. 2006, 15, 279–291. [Google Scholar] [CrossRef]
- Della-Marta, P.M.; Pinto, J.G. Statistical uncertainty of changes in winter storms over the North Atlantic and Europe in an ensemble of transient climate simulations. Geophys. Res. Lett. 2009, 36, L14703. [Google Scholar] [CrossRef]
- Schwierz, C.; Köllner-Heck, P.; Zenklusen Mutter, E.; Bresch, D.N.; Vidale, P.-L.; Wild, M.; Schär, C. Modelling European winter wind storm losses in current and future climate. Clim. Chang. 2010, 101, 485–514. [Google Scholar] [CrossRef]
- Pinto, J.G.; Karremann, M.K.; Born, K.; Della-Marta, P.M.; Klawa, M. Loss potentials associated with European windstorms under future climate conditions. Clim. Res. 2012, 54, 1–20. [Google Scholar] [CrossRef]
- Outten, S.D.; Esau, I. Extreme winds over Europe in the ENSEMBLES regional climate models. Atmos. Chem. Phys. 2013, 13, 5163–5172. [Google Scholar] [CrossRef]
- Karremann, M.K.; Pinto, J.G.; Reyers, M.; Klawa, M. Return periods of losses associated with European windstorm series in a changing climate. Environ. Res. Lett. 2014, 9, 12016. [Google Scholar] [CrossRef]
- Bengtsson, L.; Hodges, K.I.; Keenlyside, N. Will extratropical storms intensify in a warmer climate? J. Clim. 2009, 22, 2276–2301. [Google Scholar] [CrossRef]
- Wang, X.L.; Swail, V.R.; Zwiers, F.W. Climatology and changes of extratropical cyclone activity: Comparison of ERA-40 with NCEP–NCAR reanalysis for 1958–2001. J. Clim. 2006, 19, 3145–3166. [Google Scholar] [CrossRef]
- Raible, C.C.; Yoshimori, M.; Stocker, T.F.; Casty, C. Extreme midlatitude cyclones and their implications for precipitation and wind speed extremes in simulations of the Maunder Minimum versus present day conditions. Clim. Dyn. 2007, 28, 409–423. [Google Scholar] [CrossRef]
- Wang, X.L.; Swail, V.R.; Zwiers, F.W. Changes in extratropical storm tracks and cyclone activity as derived from two global reanalyses and the Canadian CGCM2 projections of future climate. In Proceedings of the Eighth International Workshop on Wave Hindcasting and Forecasting, North Shore, Oahu, HI, USA, 14–19 November 2004.
- Schmith, T.; Kaas, E.; Li, T.-S. Northeast Atlantic winter storminess 1875–1995 re-analysed. Clim. Dyn. 1998, 14, 529–536. [Google Scholar] [CrossRef]
- Fischer-Bruns, I.; von Storch, H.; Gonzalez-Rouco, J.F.; Zorita, E. Modelling the variability of midlatitude storm activity on decadal to century time scales. Clim. Dyn. 2005, 25, 461–476. [Google Scholar] [CrossRef]
- Pinto, J.G.; Froehlich, E.L.; Leckebusch, G.C.; Ulbrich, U. Changing European storm loss potentials under modified climate conditions according to ensemble simulations of the ECHAM5/MPI-OM1 GCM. Nat. Hazard Earth Syst. Sci. 2007, 7, 165–175. [Google Scholar] [CrossRef]
- Fink, A.H.; Brücher, T.; Ermert, V.; Krüger, A.; Pinto, J.G. The European storm Kyrill in January 2007: Synoptic evolution, meteorological impacts and some considerations with respect to climate change. Nat. Hazard Earth Syst. Sci. 2009, 9, 405–423. [Google Scholar] [CrossRef]
- Leggett, J.; Pepper, W.J.; Swart, R.J. Emissions Scenarios for IPCC: An Update. In Climate Change 1992. The Supplementary Report to the IPCC Scientific Assessment; Houghton, J.T., Callander, B.A., Varney, S.K., Eds.; Cambridge University Press: Cambridge, UK, 1992; pp. 69–95. [Google Scholar]
- Intergovernmental Panel on Climate Change (IPCC). Special Report on Emissions Scenarios: A special report of Working Group III of the Intergovernmental Panel on Climate Change; Nakićenović, N., Swart, R., Eds.; Cambridge University Press: Cambridge, UK, 2000. [Google Scholar]
- Van Vuuren, D.P.; Edmonds, J.; Kainuma, M.; Riahi, K.; Thomson, A.; Hibbard, K.; Hurtt, G.C.; Kram, T.; Krey, V.; Lamarque, J.-F.; et al. The representative concentration pathways: An overview. Clim. Chang. 2011, 109, 5–31. [Google Scholar] [CrossRef]
- Leckebusch, G.C.; Ulbrich, U.; Froehlich, L.; Pinto, J.G. Property loss potentials for European midlatitude storms in a changing climate. Geophys. Res. Lett. 2007, 34, L05703. [Google Scholar] [CrossRef]
- Blennow, K.; Olofsson, E. The probability of wind damage in forestry under a changed wind climate. Clim. Chang. 2008, 87, 347–360. [Google Scholar] [CrossRef]
- Tebaldi, C.; Knutti, R. The use of the multi-model ensemble in probabilistic climate projections. Philos. T. R. Soc. A 2007, 365, 2053–2075. [Google Scholar] [CrossRef] [PubMed]
- Hanson, C.E.; Palutikof, J.P.; Osborn, T.; Davies, T.; Holt, T.; Quine, C. An integrated assessment of the potential for change in storm activity over Europe: Implications for forestry in the UK. In Proceedings of the International Conference Wind Effects on Trees, Karlsruhe, Germany, 16–18 September 2003; pp. 129–136.
- Pryor, S.C.; Schoof, J.T.; Barthelmie, R.J. Winds of change? Projections of near-surface winds under climate change scenarios. Geophys. Res. Lett. 2006, 33, L11702. [Google Scholar] [CrossRef]
- Semmler, T.; Varghese, S.; McGrath, R.; Nolan, P.; Wang, S.; Lynch, P.; O'Dowd, C. Regional climate model simulations of North Atlantic cyclones: Frequency and intensity changes. Clim. Res. 2008, 36, 1–16. [Google Scholar] [CrossRef]
- de Winter, R.C.; Sterl, A.; Ruessink, B.G. Wind extremes in the North Sea Basin under climate change: An ensemble study of 12 CMIP5 GCMs. J. Geophys. Res. Atmos. 2012, 118, 1601–1612. [Google Scholar] [CrossRef]
- Walter, A.; Keuler, K.; Jacob, D.; Knoche, R.; Block, A.; Kotlarski, S.; Müller-Westermeier, G.; Rechid, D.; Ahrens, W. A high resolution reference data set of German wind velocity 1951–2001 and comparison with regional climate model results. Meteorol. Z. 2006, 15, 585–596. [Google Scholar] [CrossRef]
- Harvey, B.J.; Shaffrey, L.C.; Woollings, T.J.; Zappa, G.; Hodges, K.I. How large are projected 21st century storm track changes? Geophys. Res. Lett. 2012, 39, L18707. [Google Scholar] [CrossRef]
- Zappa, G.; Shaffrey, L.C.; Hodges, K.I.; Sansom, P.G.; Stephenson, D.B. A multimodel assessment of future projections of North Atlantic and European extratropical cyclones in the CMIP5 climate models. J. Clim. 2013, 26, 5846–5862. [Google Scholar] [CrossRef]
- Geng, Q.; Sugi, M. Possible change of extratropical cyclone activity due to enhanced green-house gases and sulfate aerosols—Study with a high-resolution AGCM. J. Clim. 2003, 16, 2262–2274. [Google Scholar] [CrossRef]
- Gregow, H.; Ruosteenoja, K.; Pimenoff, N.; Jylhä, K. Changes in the mean and extreme geostrophic wind speeds in Northern Europe until 2100 based on nine global climate models. Int. J. Climatol. 2012, 32, 1834–1846. [Google Scholar] [CrossRef]
- Leckebusch, G.C.; Ulbrich, U. On the relationship between cyclones and extreme windstorm events over Europe under climate change. Glob. Planet. Chang. 2004, 44, 181–193. [Google Scholar] [CrossRef]
- Pinto, J.G.; Zacharias, S.; Fink, A.H.; Leckebusch, G.C.; Ulbrich, U. Factors contributing to the development of extreme North Atlantic cyclones and their relationship with the NAO. Clim. Dyn. 2009, 32, 711–737. [Google Scholar] [CrossRef]
- Ulbrich, U.; Pinto, J.G.; Kupfer, H.; Leckebusch, G.C.; Spangehl, T.; Reyers, M. Changing Northern Hemisphere storm tracks in an ensemble of IPCC climate change simulations. J. Clim. 2008, 21, 1669–1679. [Google Scholar] [CrossRef]
- Leckebusch, G.C.; Donat, M.G.; Ulbrich, U.; Pinto, J.G. Mid-latitude cyclones and storms in an ensemble of European AOGCMs under ACC. Clivar Exch. 2008, 13, 3–5. [Google Scholar]
- Leckebusch, G.C.; Renggli, D.; Ulbrich, U. Development and application of an objective storm severity measure for the Northeast Atlantic region. Meteorol. Z. 2008, 17, 575–587. [Google Scholar] [CrossRef] [PubMed]
- Lionello, P.; Boldrin, U.; Giorgi, F. Future changes in cyclone climatology over Europe as inferred from a regional climate simulation. Clim. Dyn. 2008, 30, 657–671. [Google Scholar] [CrossRef]
- McDonald, R.E. Understanding the impact of climate change on Northern Hemisphere extra-tropical cyclones. Clim. Dyn. 2011, 37, 1399–1425. [Google Scholar] [CrossRef]
- Pinto, J.G.; Ulbrich, U.; Leckebusch, G.C.; Spangehl, T.; Reyers, M.; Zacharias, S. Changes in storm track and cyclone activity in three SRES ensemble experiments with the ECHAM5/MPI-OM1 GCM. Clim. Dyn. 2007, 29, 195–210. [Google Scholar] [CrossRef]
- Beersma, J.J.; Rider, K.M.; Komen, G.J.; Kaas, E.; Kharin, V.V. An analysis of extra-tropical storms in the North Atlantic region as simulated in a control and 2 × CO2 time-slice experiment with a high-resolution atmospheric model. Tellus A 1997, 49, 347–361. [Google Scholar] [CrossRef]
- Giorgi, F.; Bi, X.Q.; Pal, J. Mean, interannual variability and trends in a regional climate change experiment over Europe. II: Climate change scenarios (2071–2100). Clim. Dyn. 2004, 23, 839–858. [Google Scholar] [CrossRef]
- Gastineau, G.; Soden, B.J. Model projected changes of extreme wind events in response to global warming. Geophys. Res. Lett. 2009, 36, L10810. [Google Scholar] [CrossRef]
- Löptien, U.; Zolina, O.; Gulev, S.; Latif, M.; Soloviov, V. Cyclone life cycle characteristics over the Northern Hemisphere in coupled GCMs. Clim. Dyn. 2008, 31, 507–532. [Google Scholar] [CrossRef]
- Nikulin, G.; Kjellström, E.; Hansson, U.L.F.; Strandberg, G.; Ullerstig, A. Evaluation and future projections of temperature, precipitation and wind extremes over Europe in an ensemble of regional climate simulations. Tellus A 2011, 63, 41–55. [Google Scholar] [CrossRef]
- Mizuta, R.; Matsueda, M.; Endo, H.; Yukimoto, S. Future change in extratropical cyclones associated with change in the upper troposphere. J. Clim. 2011, 24, 6456–6470. [Google Scholar] [CrossRef]
- Pryor, S.C.; Barthelmie, R.J.; Clausen, N.E.; Drews, M.; MacKellar, N.; Kjellström, E. Analyses of possible changes in intense and extreme wind speeds over northern Europe under climate change scenarios. Clim. Dyn. 2012, 38, 189–208. [Google Scholar] [CrossRef]
- Knippertz, P.; Ulbrich, U.; Speth, P. Changing cyclones and surface wind speeds over the North Atlantic and Europe in a transient GHG experiment. Clim. Res. 2000, 15, 109–122. [Google Scholar] [CrossRef]
- Beniston, M.; Stephenson, D.B.; Christensen, O.B.; Ferro, C.A.T.; Frei, C.; Goyette, S.; Halsnaes, K.; Holt, T.; Jylhä, K.; Koffi, B.; et al. Future extreme events in European climate: An exploration of regional climate model projections. Clim. Chang. 2007, 81, 71–95. [Google Scholar] [CrossRef]
- Gerstengarbe, F.-W.; Werner, P.C.; Oesterle, H.; Burghoff, O. Winter storm- and summer thunderstorm-related loss events with regard to climate change in Germany. Theor. Appl. Climatol. 2013, 114, 715–724. [Google Scholar] [CrossRef]
- Klaus, M.; Holsten, A.; Hostert, P.; Kropp, J.P. Integrated methodology to assess windthrow impacts on forest stands under climate change. For. Ecol. Manag. 2011, 261, 1799–1810. [Google Scholar] [CrossRef]
- Pinto, J.G.; Neuhaus, C.P.; Leckebusch, G.C.; Reyers, M.; Kerschgens, M. Estimation of wind storm impacts over Western Germany under future climate conditions using a statistical-dynamical downscaling approach. Tellus A 2010, 62, 188–201. [Google Scholar] [CrossRef]
- Rauthe, M.; Kunz, M.; Kottmeier, C. Changes in wind gust extremes over Central Europe derived from a small ensemble of high resolution regional climate models. Meteorol. Z. 2010, 19, 299–312. [Google Scholar] [CrossRef]
- Rockel, B.; Woth, K. Extremes of near-surface wind speed over Europe and their future changes as estimated from an ensemble of RCM simulations. Clim. Chang. 2007, 81, 267–280. [Google Scholar] [CrossRef]
- Leckebusch, G.C.; Weimer, A.; Pinto, J.G.; Reyers, M.; Speth, P. Extreme wind storms over Europe in present and future climate: A cluster analysis approach. Meteorol. Z. 2008, 17, 67–82. [Google Scholar] [CrossRef]
- Muskulus, M.; Jacob, D. Tracking cyclones in regional model data: The future of Mediterranean storms. Adv. Geosci. 2005, 2, 13–19. [Google Scholar] [CrossRef] [Green Version]
- Mizuta, R. Intensification of extratropical cyclones associated with the polar jet change in the CMIP5 global warming projections. Geophys. Res. Lett. 2012, 39, L19707. [Google Scholar] [CrossRef]
- Sterl, A.; van den Brink, H.; de Vries, H.; Haarsma, R.; van Meijgaard, E. An ensemble study of extreme storm surge related water levels in the North Sea in a changing climate. Ocean Sci. 2009, 5, 369–378. [Google Scholar] [CrossRef]
- Carnell, R.E.; Senior, C.A.; Mitchell, J.F.B. An assessment of measures of storminess: Simulated changes in northern hemisphere winter due to increasing CO2. Clim. Dyn. 1996, 12, 467–476. [Google Scholar] [CrossRef]
- Ulbrich, U.; Christoph, M. A shift of the NAO and increasing storm track activity over Europe due to anthropogenic greenhouse gas forcing. Clim. Dyn. 1999, 15, 551–559. [Google Scholar] [CrossRef]
- Lambert, S.J.; Fyfe, J.C. Changes in winter cyclone frequencies and strengths simulated in enhanced greenhouse warming experiments: Results from the models participating in the IPCC diagnostic exercise. Clim. Dyn. 2006, 26, 713–728. [Google Scholar] [CrossRef]
- Yin, J.H. A consistent poleward shift of the storm tracks in simulations of 21st century climate. Geophys. Res. Lett. 2005, 32, L18701. [Google Scholar] [CrossRef]
- Laine, A. An energetics study of wintertime Northern Hemisphere storm tracks under 4 × CO2 conditions in two ocean-atmosphere coupled models. J. Clim. 2009, 22, 819–839. [Google Scholar] [CrossRef]
- Catto, J.L.; Shaffrey, L.C.; Hodges, K.I. Northern Hemisphere extratropical cyclones in a warming climate in the HiGEM high-resolution climate model. J. Clim. 2011, 24, 5336–5352. [Google Scholar] [CrossRef]
- Lambert, S.J. The effect of enhanced greenhouse warming on winter cyclone frequencies and strengths. J. Clim. 1995, 8, 1447–1452. [Google Scholar] [CrossRef]
- Schubert, M.; Perlwitz, J.; Blender, R.; Fraedrich, K.; Lunkeit, F. North Atlantic cyclones in CO2-induced warm climate simulations: Frequency, intensity, and tracks. Clim. Dyn. 1998, 14, 827–837. [Google Scholar] [CrossRef]
© 2016 by the authors; licensee MDPI, Basel, Switzerland. This article is an open access article distributed under the terms and conditions of the Creative Commons Attribution (CC-BY) license (http://creativecommons.org/licenses/by/4.0/).