Article

Variability of Black Carbon and Ultrafine Particle Concentration on Urban Bike Routes in a Mid-Sized City in the Po Valley (Northern Italy)

1
Department of Civil and Environmental Engineering, Politecnico di Milano, Milano 20133, Italy
2
Energy and Environment Laboratory Piacenza, Piacenza 29121, Italy
*
Author to whom correspondence should be addressed.
Atmosphere 2017, 8(2), 40; https://doi.org/10.3390/atmos8020040
Submission received: 13 October 2016 / Revised: 21 January 2017 / Accepted: 10 February 2017 / Published: 16 February 2017
(This article belongs to the Special Issue Ultrafine Particles: Determination, Behavior and Human Health Effects)

Abstract

:
Cyclists might experience increased air pollution exposure, due to the proximity to traffic, and higher intake, due to their active travel mode and higher ventilation. Several local factors, like meteorology, road and traffic features, and bike lanes features, affect cyclists’ exposure to traffic-related pollutants. This paper investigates the concentration levels and the effect of the features of the bike lanes on cyclists’ exposure to airborne ultrafine particulate matter (UFP) and black carbon (BC) in the mid-sized city of Piacenza, located in the middle of the Po Valley, Northern Italy. Monitoring campaigns were performed by means of portable instruments along different urban bike routes with bike lanes, characterized by different distances from the traffic source (on-road cycle lane, separated cycle lane, green cycle path), during morning (9:00 am–10:00 am) and evening (17:30 pm–18:30 pm) workday rush hours in both cold and warm seasons. The proximity to traffic significantly affected cyclists’ exposure to UFP and BC: exposure concentrations measured for the separated lane and for the green path were 1–2 times and 2–4 times lower than for the on-road lane. Concurrent measurements showed that exposure concentrations to PM10, PM2.5, and PM1 were not influenced by traffic proximity, without any significant variation between on-road cycle lane, separated lane, or green cycle path. Thus, for the location of this study PM mass-based metrics were not able to capture local scale concentration gradients in the urban area as a consequence of the rather high urban and regional background that hides the contribution of local scale sources, such as road traffic. The impact of route choice on cyclists’ exposure to UFPs and BC during commuting trips back and forth from a residential area to the train station has been also estimated through a probabilistic approach through an iterative Monte Carlo technique, based on the measured data. Compared to the best choice, a worst-route choice can result in an increased cumulative exposure up to about 50% for UFPs, without any relevant difference between cold and warm season, and from 20% in the cold season up to 90% in the warm season for equivalent black carbon concentration (EBC).

1. Introduction

The shift from motor vehicle use to an active transport mode, like bicycling, for short trips in urban areas has been considered helpful to reduce traffic volume and related air pollution emission. In addition, the shift to active transport improves public health thanks to the increased physical activity [1,2,3]. However, due to their proximity to the traffic source, cyclists might be exposed to higher concentrations of traffic-related atmospheric pollutants [4]. Some studies that directly compared the exposure concentrations, i.e., the concentrations to which a person is exposed, among different urban transport modes [5,6,7], reported contrasting results and highlighted the dependency of the exposure levels on a large number of variables, such as road characteristics and meteorological conditions [8,9,10,11,12]. However, most of the available evidence for urban cycling suggests that: (i) the higher the volume of motorized traffic the greater the cyclists' exposure to traffic-related pollutants, and in particular to ultrafine particles (UFPs, diameter smaller than 0.1 μm) and black carbon (BC); and (ii) bicycle paths that offer lateral separation between the cyclists and the motorized traffic reduce the concentration they are exposed to, as increased exposure concentrations are associated with increased proximity to traffic [13]. Additionally, exposure to both high-average levels and to short-duration concentration peaks of UFPs and black carbon particles is more likely to occur because of the proximity to the emission sources [14,15]. Furthermore, bike riding can result in higher particle inhalation due to the higher minute ventilation, because of increased breathing frequency and larger tidal volume due to physical effort [16,17], as well as in a higher lung deposition rate of inhaled particles, because deposition rate increases with exercise [18,19].
Conversely, reductions in cyclists’ exposure have been observed when they take alternative routes along roads with lower traffic density [20,21,22]. Thus, a proper selection of the travelling route through an urban area, as well as travelling outside rush hours, can reduce the exposure of cyclists to both primary traffic-related pollutants and to secondary pollutants [23,24]. However, as far as cycling networks and infrastructures are concerned, there is still a lack of knowledge and little research on how route choice and time can affect cyclists’ exposure to traffic-related atmospheric pollutants [25].
This work provides some additional knowledge by investigating the concentration levels of airborne UFPs and BC, based on field measurements performed while travelling different bicycle routes in the urban area of a mid-sized city in Northern Italy. Both these pollutants trace traffic source emissions and BC were recognized as valuable air quality indicators where primary combustion particles dominate [26]. The measured concentrations actually provide a piece of information on cyclists’ exposure concentrations (hereafter referred to as exposure levels) to traffic-related pollutants not controlled by air quality regulations. The effect of bicycle lane and road features on cyclists’ exposure levels is also investigated by comparing the UFP and BC concentrations measured along the selected bicycle routes, also accounting for the season and for the time of the day. Finally, the impact of route choice on cyclists’ exposure during commuting trips is also estimated through a Monte Carlo approach, based on the measured data.

2. Methods

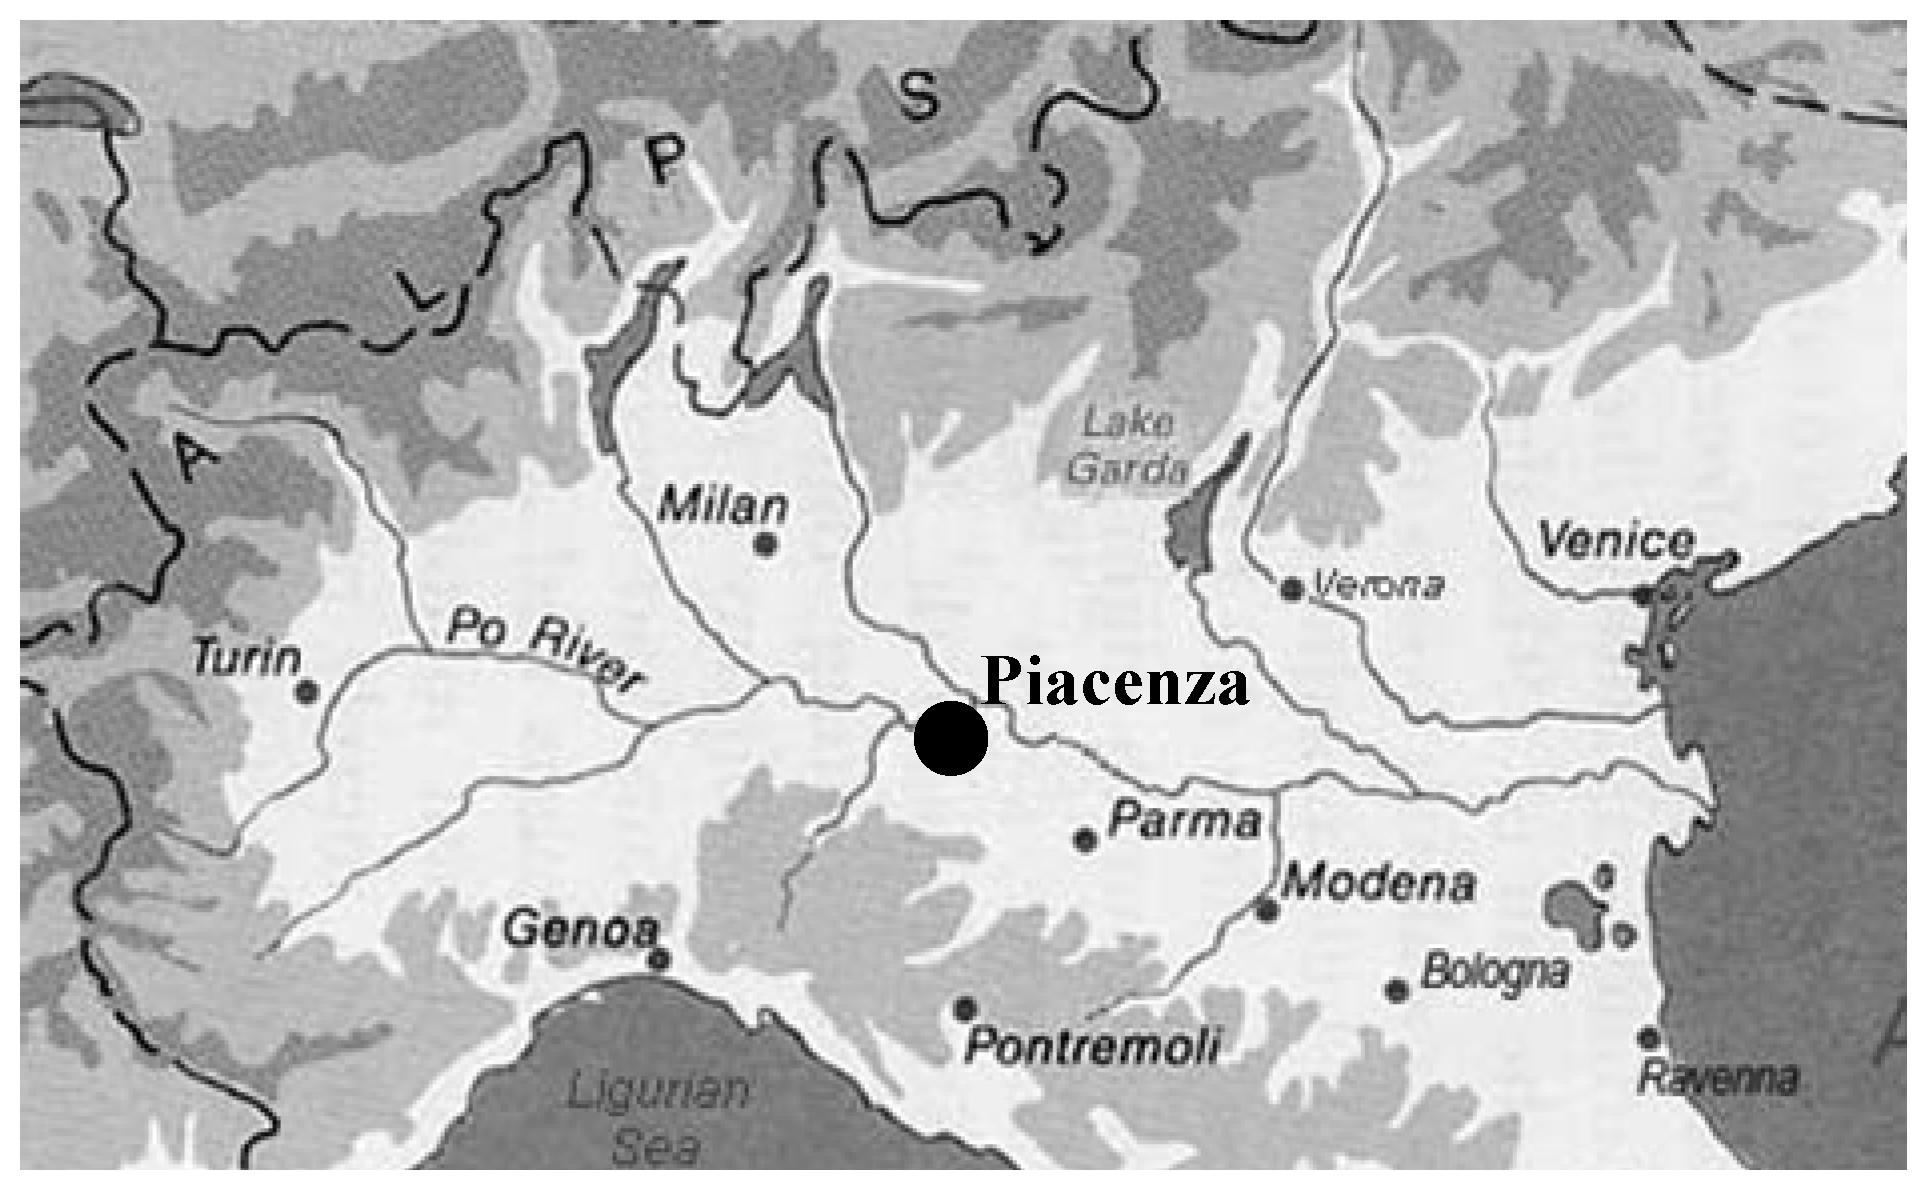
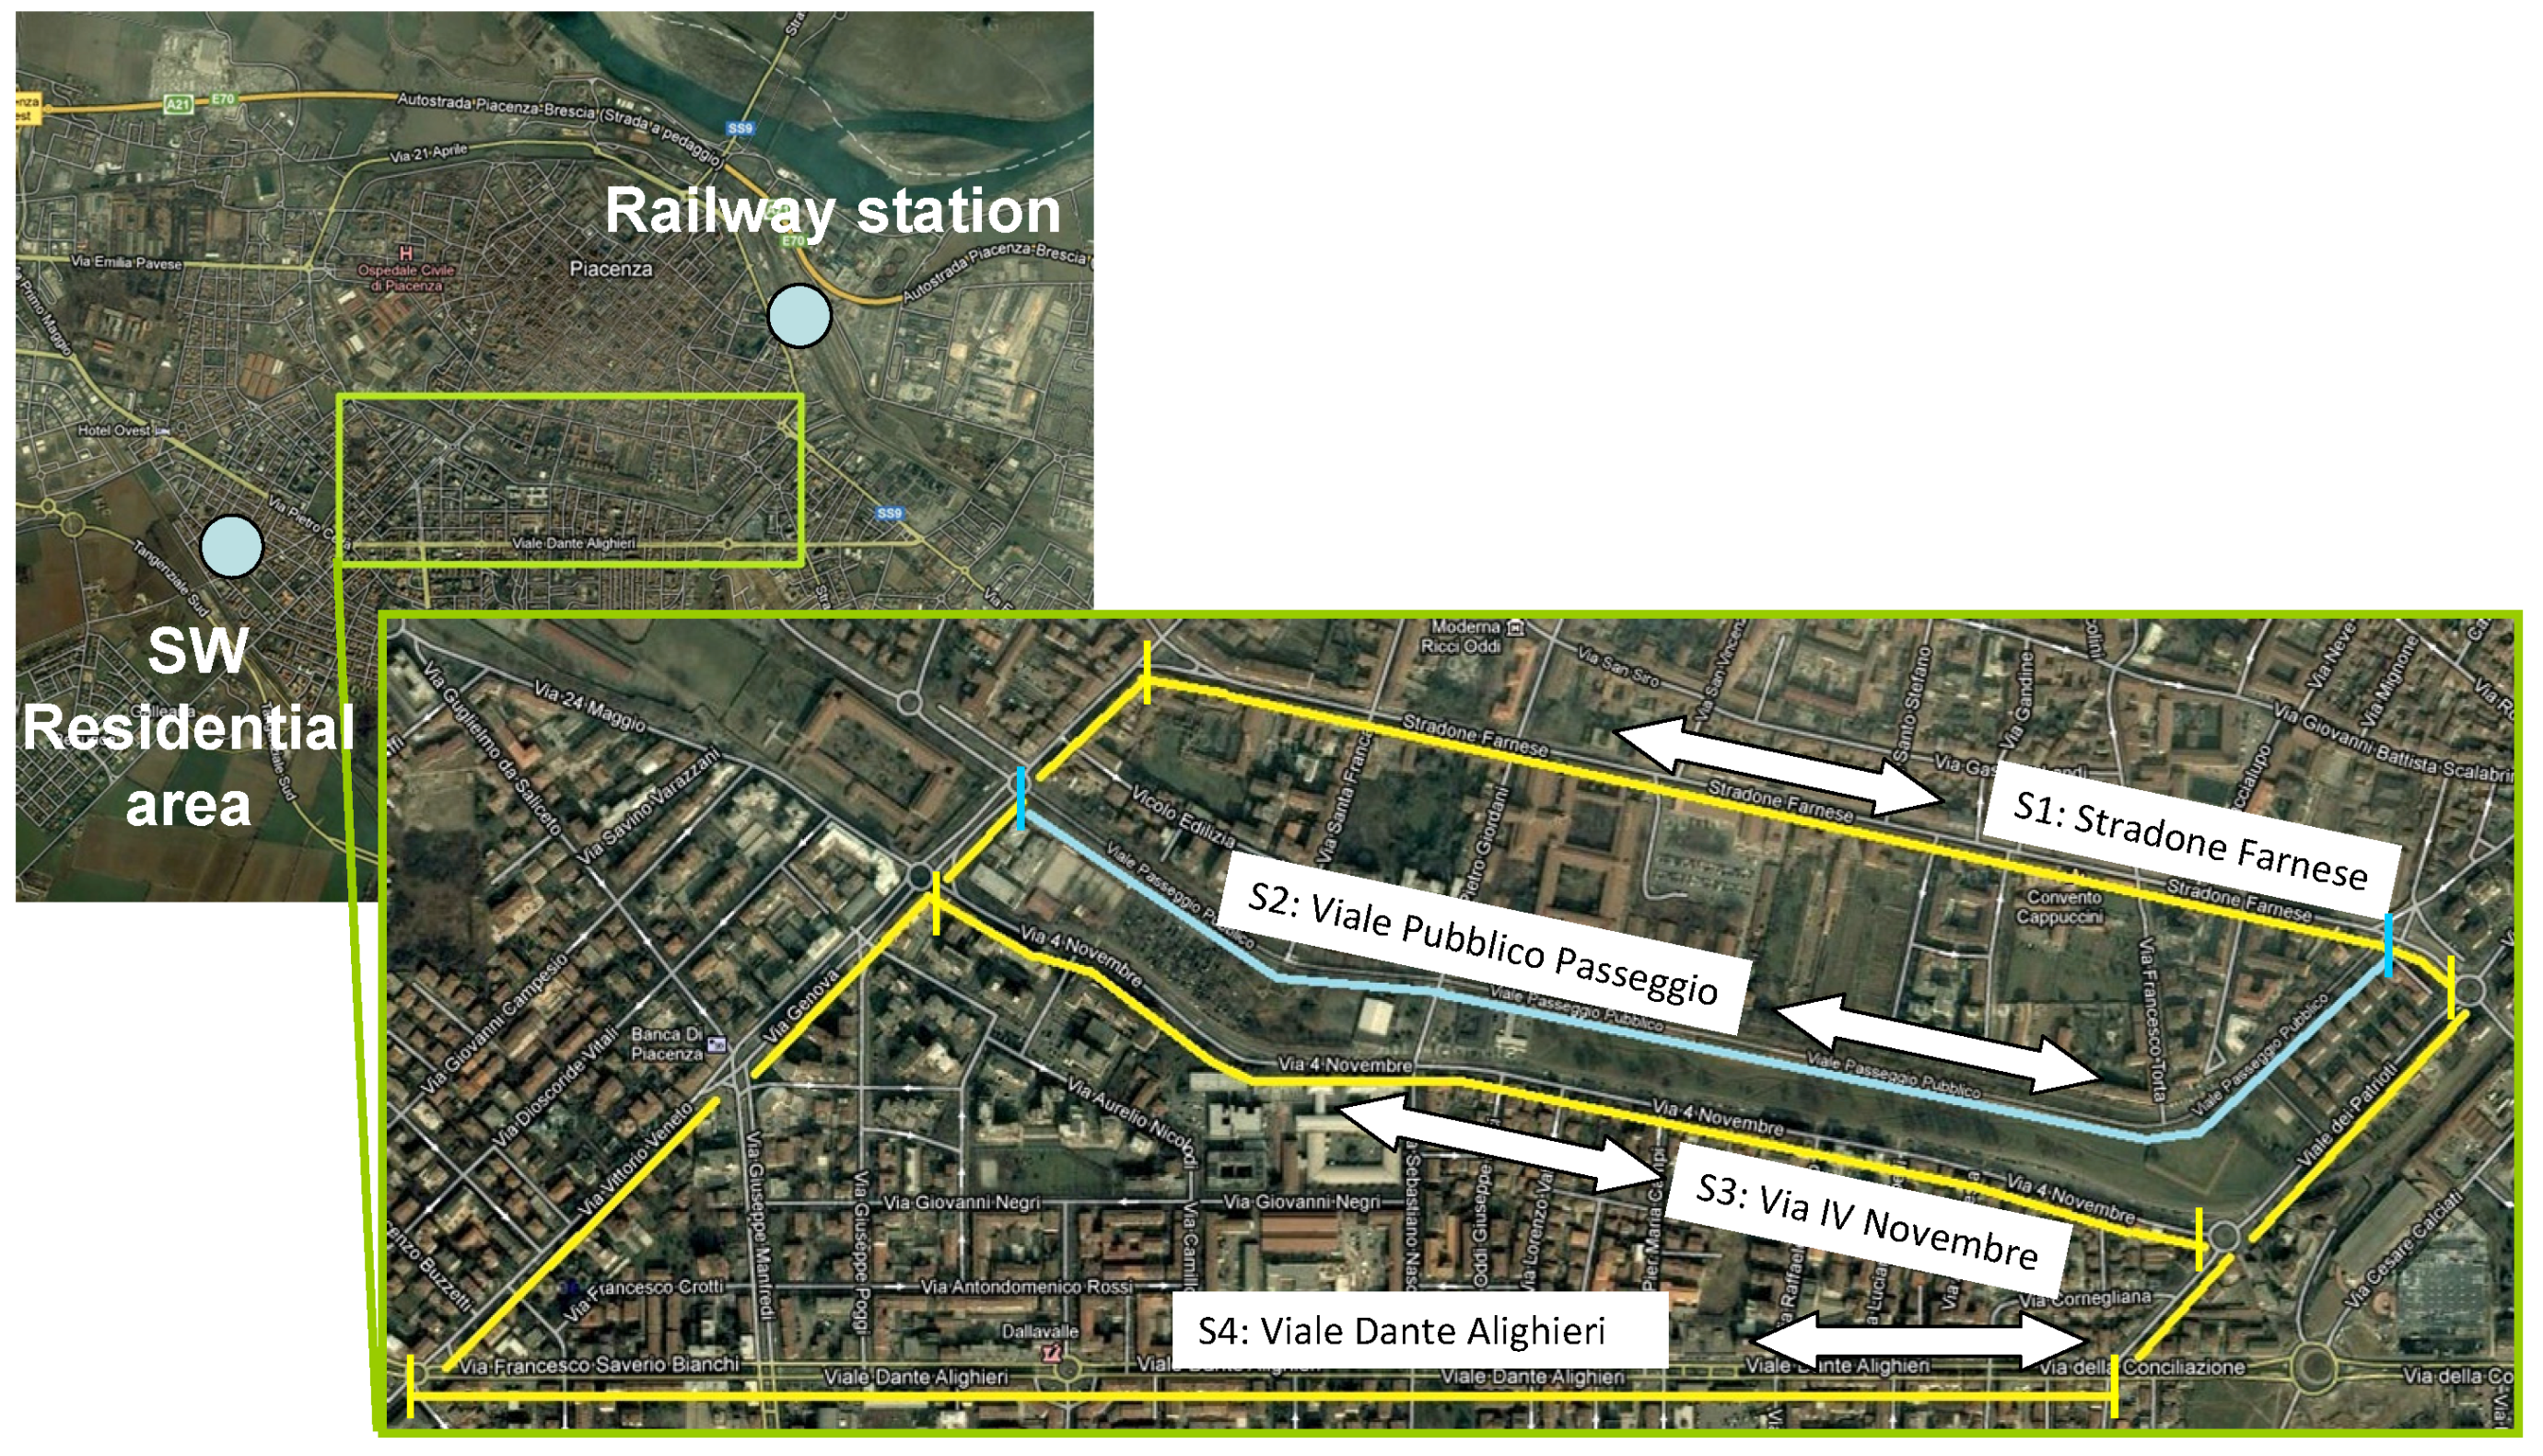
2.1. Monitoring Routes

Monitoring campaigns were performed in the urban area of Piacenza, Italy, a mid-sized city with about 100,000 inhabitants located in the middle of the Po Valley, at about 60 m above sea level (Figure 1). Despite its location in a context of mostly rural and less urbanized compared with the largest metropolitan areas of the region, PM levels in Piacenza hardly comply with the air quality limits, especially as far as the PM10 daily limit is concerned.
Monitoring campaigns were performed during two weeks in July and September 2011 with two daily sessions, during morning (9:00 am–10:00 am) and evening workdays’ rush hours (17:30 pm–18:30 pm). An additional one-week monitoring campaign was performed in December 2012. In order to investigate the role of cycle lane and road features on cyclists’ exposure concentration, the route comprises four route sectors (Figure 2):
Sector S1—on-road cycle lane (S1-OCL): in this city-center road, the cycle lane is marked on the right side of road and cyclists and vehicles travel adjacent without any real separation. The road is bordered on both sides by 3–4-storey buildings, creating a street canyon.
Sector S2—green cycle path (S2-GCP): in this sector the cycle path passes through a green area where motorized vehicles are banned. The cycle path is paved with asphalt. The green area is about 50 meters large and it is bordered by the sector S1 and sector S3 roads.
Sector S3—separated cycle lane (S3-SCL): in this sector the cycle lane is separated from the motorized vehicles lane by a row of parallel parking lots. A minimum distance of about 2.5 m exists between cyclists and traffic flow. The road is bordered by buildings on one side and by a green area on the other side. The cycle path is located at the side of the green area. Sector S3 is part of the ring road that runs around the historical city center.
Sector S4—no cycle lane (S4-NCL): in this road sector cyclists and vehicles share the same lanes, without any kind of separation. The road is bordered on both sides by 3–4-storey buildings as for Sector S1, still creating a street canyon, but with a cross-section wider than in Sector S1. Sector S4 is part of the outer ring road of the city center.
The main features of the four route sectors are summarized in Table 1.
Crossing the city in the east–west direction, the four route sectors were selected because they may be taken by cyclists travelling from the South–Western residential areas to the train station (North–East of the city center) for daily commuting. Route sectors, each about 1.5 km long, were travelled consecutively (i.e., not in parallel) following the same order (S1-OCL, S2-GCP, S3-SCL, and S4-NCL) in each session. Due to their rather small length, during each session the sectors were travelled three times, collecting from 15 to 20 1-min concentration data points per run for each sector. Meteorological conditions during the monitoring days were fairly constant and typical of the area: in particular, there were no rain events, stable atmospheric conditions and weak winds. Daily averaged ambient temperature were in the 21–25 °C range in July–September and in the 3–5 °C range in December; corresponding ranges for relative humidity were 45%–65% July-September and 40%–61% in December. PM pollution levels recorded by the urban background monitoring station as PM10 daily averages were in the 15–25 μg·m−3 range in July-September and in the 27–31 μg·m−3 range in December.

2.2. Instruments

During the monitoring campaigns two portable instruments for the concurrent measurement of black carbon and ultrafine particle number concentration were held in a backpack keeping the instrument inlets near the breathing zone.
Equivalent black carbon concentration (EBC) was measured by means of a portable micro-aethalometer AE51 (microAeth AE51, AethLabs, San Francisco, CA, USA) with 1-s time resolution. Ambient air is drawn by a pump inside the instrument through a Teflon-coated borosilicate glass fiber filter where particles are collected. The rate of change in the attenuation of transmitted light (880 nm wave length) due to continuous collection of aerosol deposit on the filter is measured. Then, black carbon concentration is derived based on the assumption that the change in aerosol light attenuation is proportional to black carbon concentration based on a mass absorption cross-section coefficient of 12.5 m2·g−1 [27,28]. Filters were replaced every day so that particle loading correction was not necessary. Following literature recommendations [28] hereafter the term equivalent black carbon (EBC) is used instead of black carbon (BC) because the absorption properties have been measured by an optical technique.
Ultrafine particle number concentration (PNC) was measured by means of a portable condensation particle counter (P-Trak, TSI Model 8525, Shoreview, MN, USA). P-Trak is able to measure the PNC in the 20–1000 nm size range (PNC0.020–1) at 1-s time resolution, detecting particle concentrations up to 5 × 105 cm−3. Ambient air drawn into the instrument is first saturated with isopropyl alcohol vapor that then condenses onto the particles, causing them to grow into a larger droplets detectable by means of a photo-detector when flashed by a focused laser beam. Despite its measurement range extending beyond 100 nm, P-Trak data are commonly regarded as UFP concentration data since, in urban areas, particles with diameter below 100 account for the majority of the total particle number [29]. Therefore, in this work PNC0.020–1 data are presented as UFP data. No data correction was performed for potential undercounting at high UFP concentrations because recorded levels were far below the 5 × 105 cm−3 detection limit.
As this work is not intended for the high spatial resolution monitoring of UFPs and BC, but to assess and compare their concentrations levels and variability along urban bike routes, 1-min concentration data have been considered. At 1 min-time resolution, light attenuation through the AE51 filters was always in excess of the 0.05 recommended value [30] so that correction of EBC values for noise attenuation was not necessary.
Additionally, for a few monitoring days PM mass concentration (PM10, PM2.5, PM1) were concurrently measured by means of a portable optical particle counter (OPC—Personal DustMonit, Contec, Milano, Italy). The OPC measures the PNCs for seven size bins in the 0.3–10 µm size range at 1-min time resolution by means of laser light scattering technology and estimates size classified PM mass concentrations under some assumptions on particles’ shape and density.

3. Results and Discussion

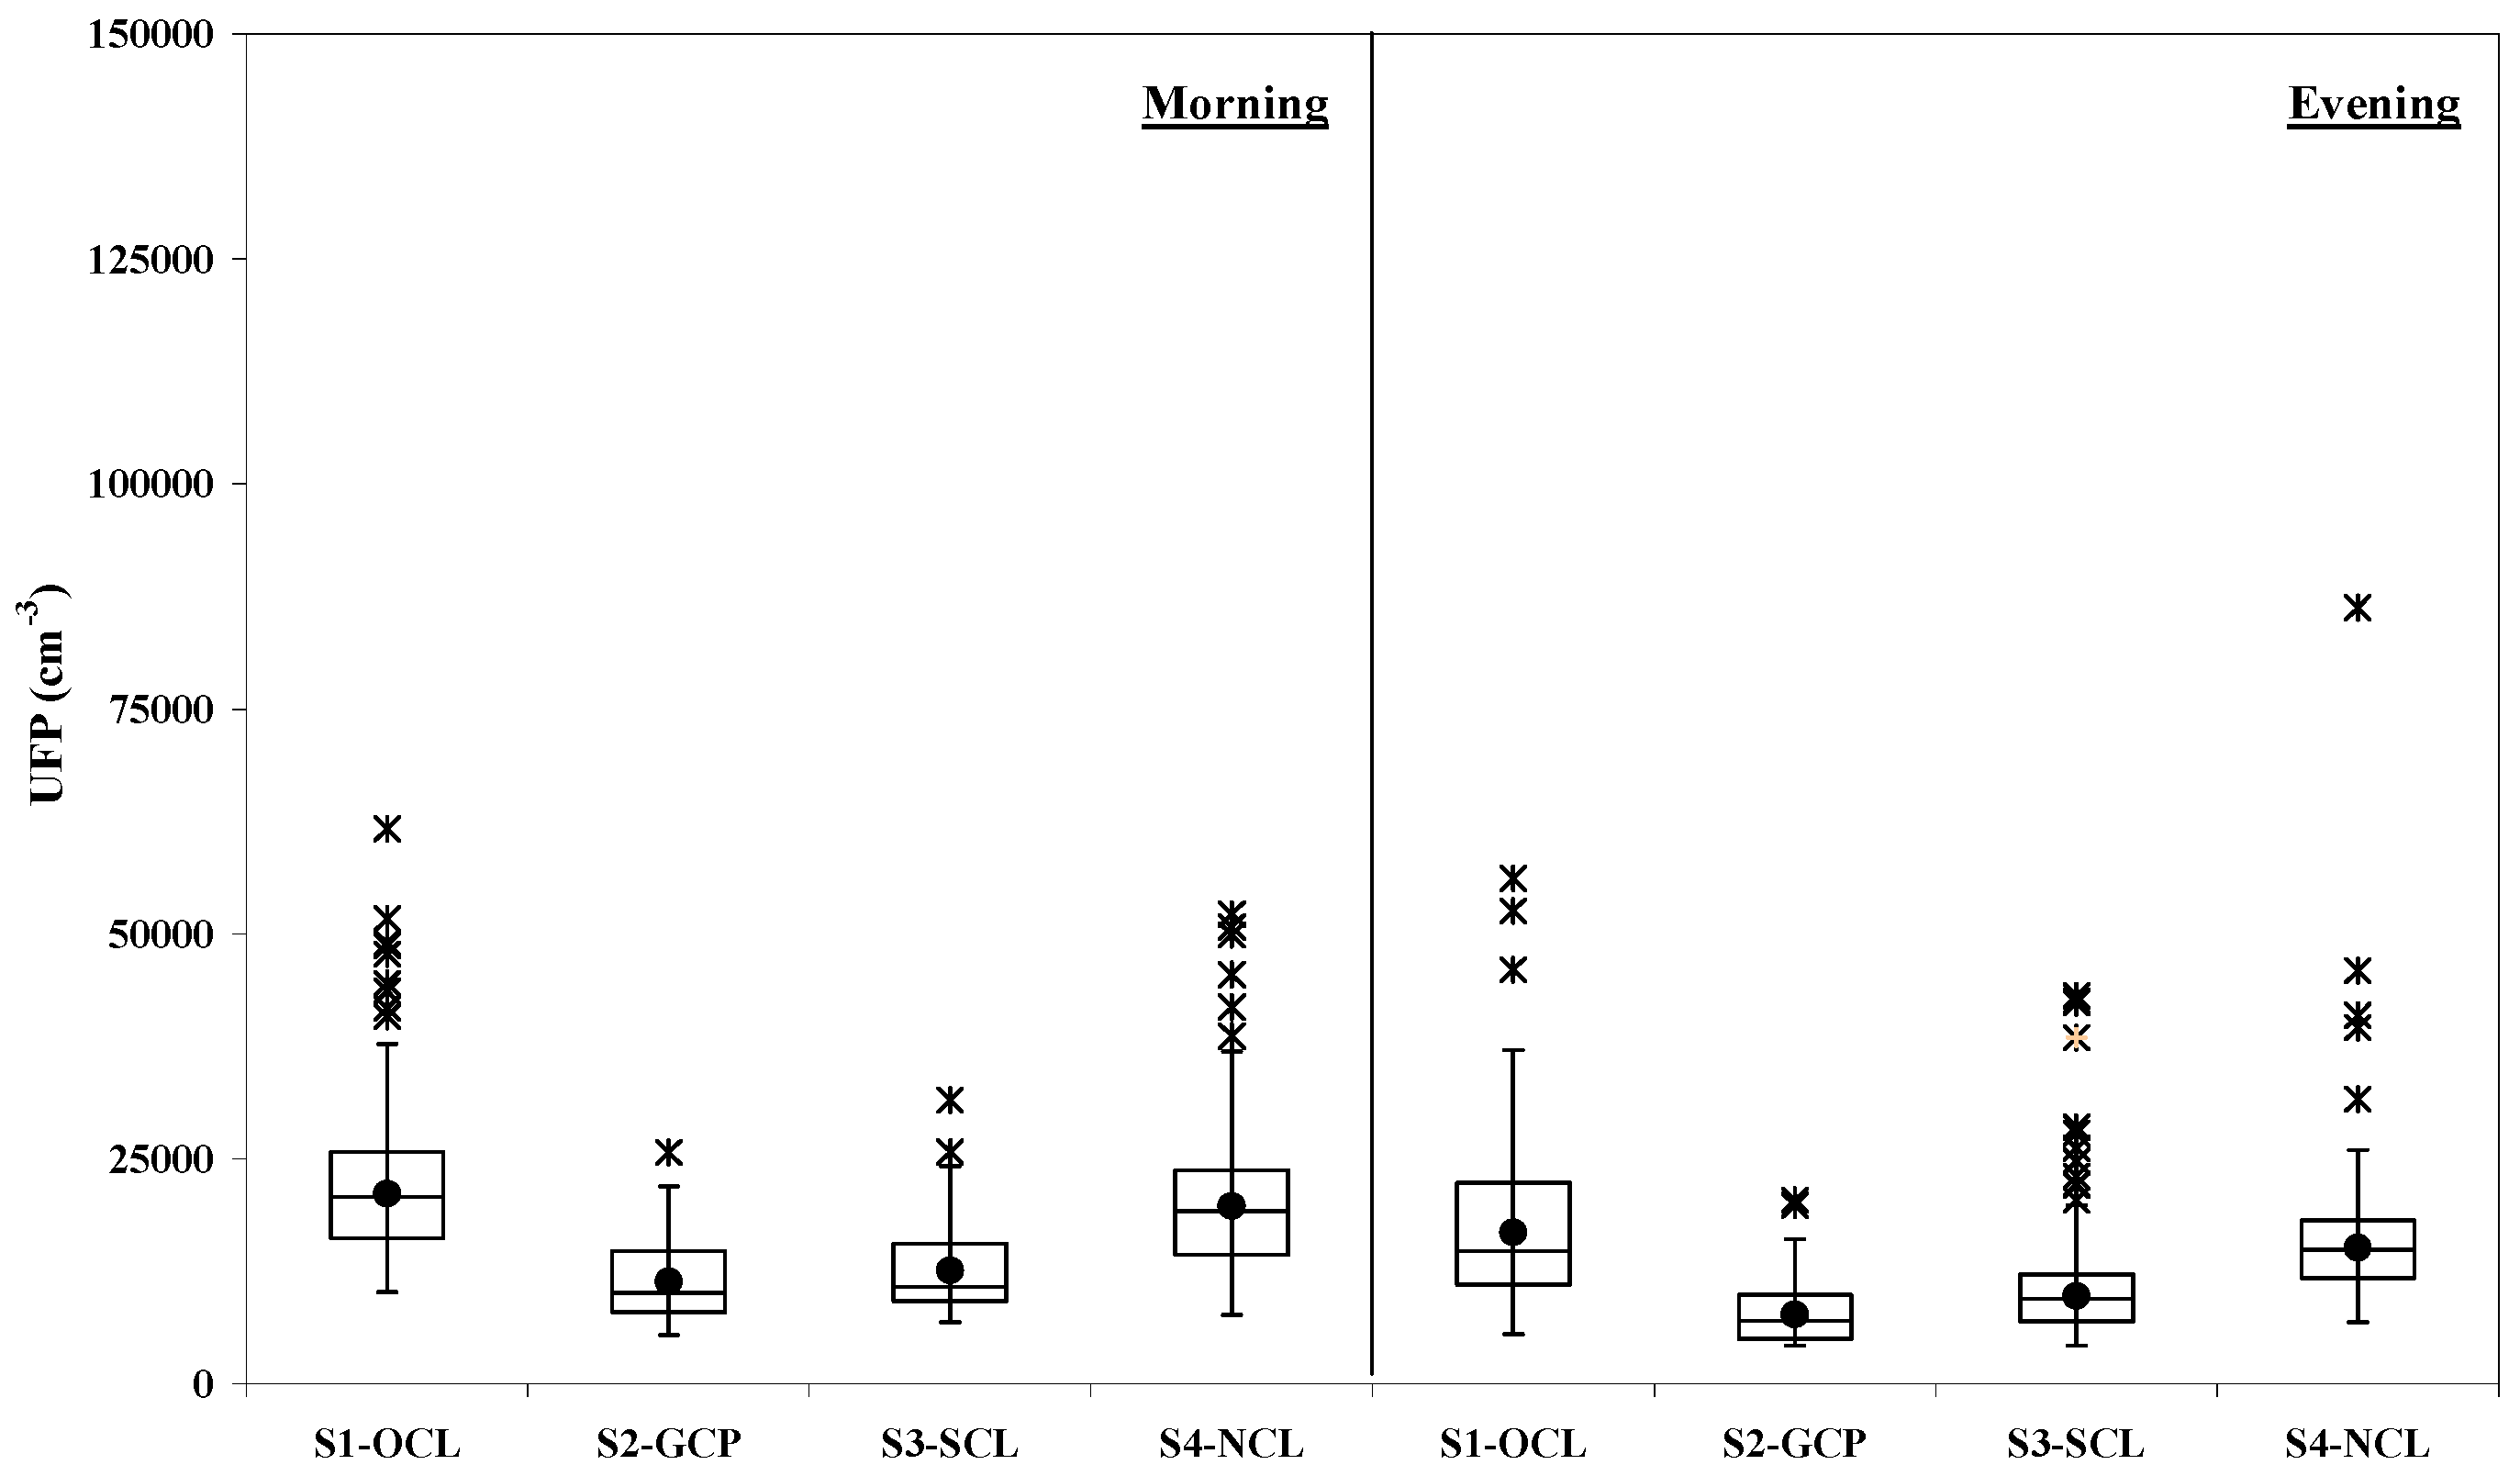
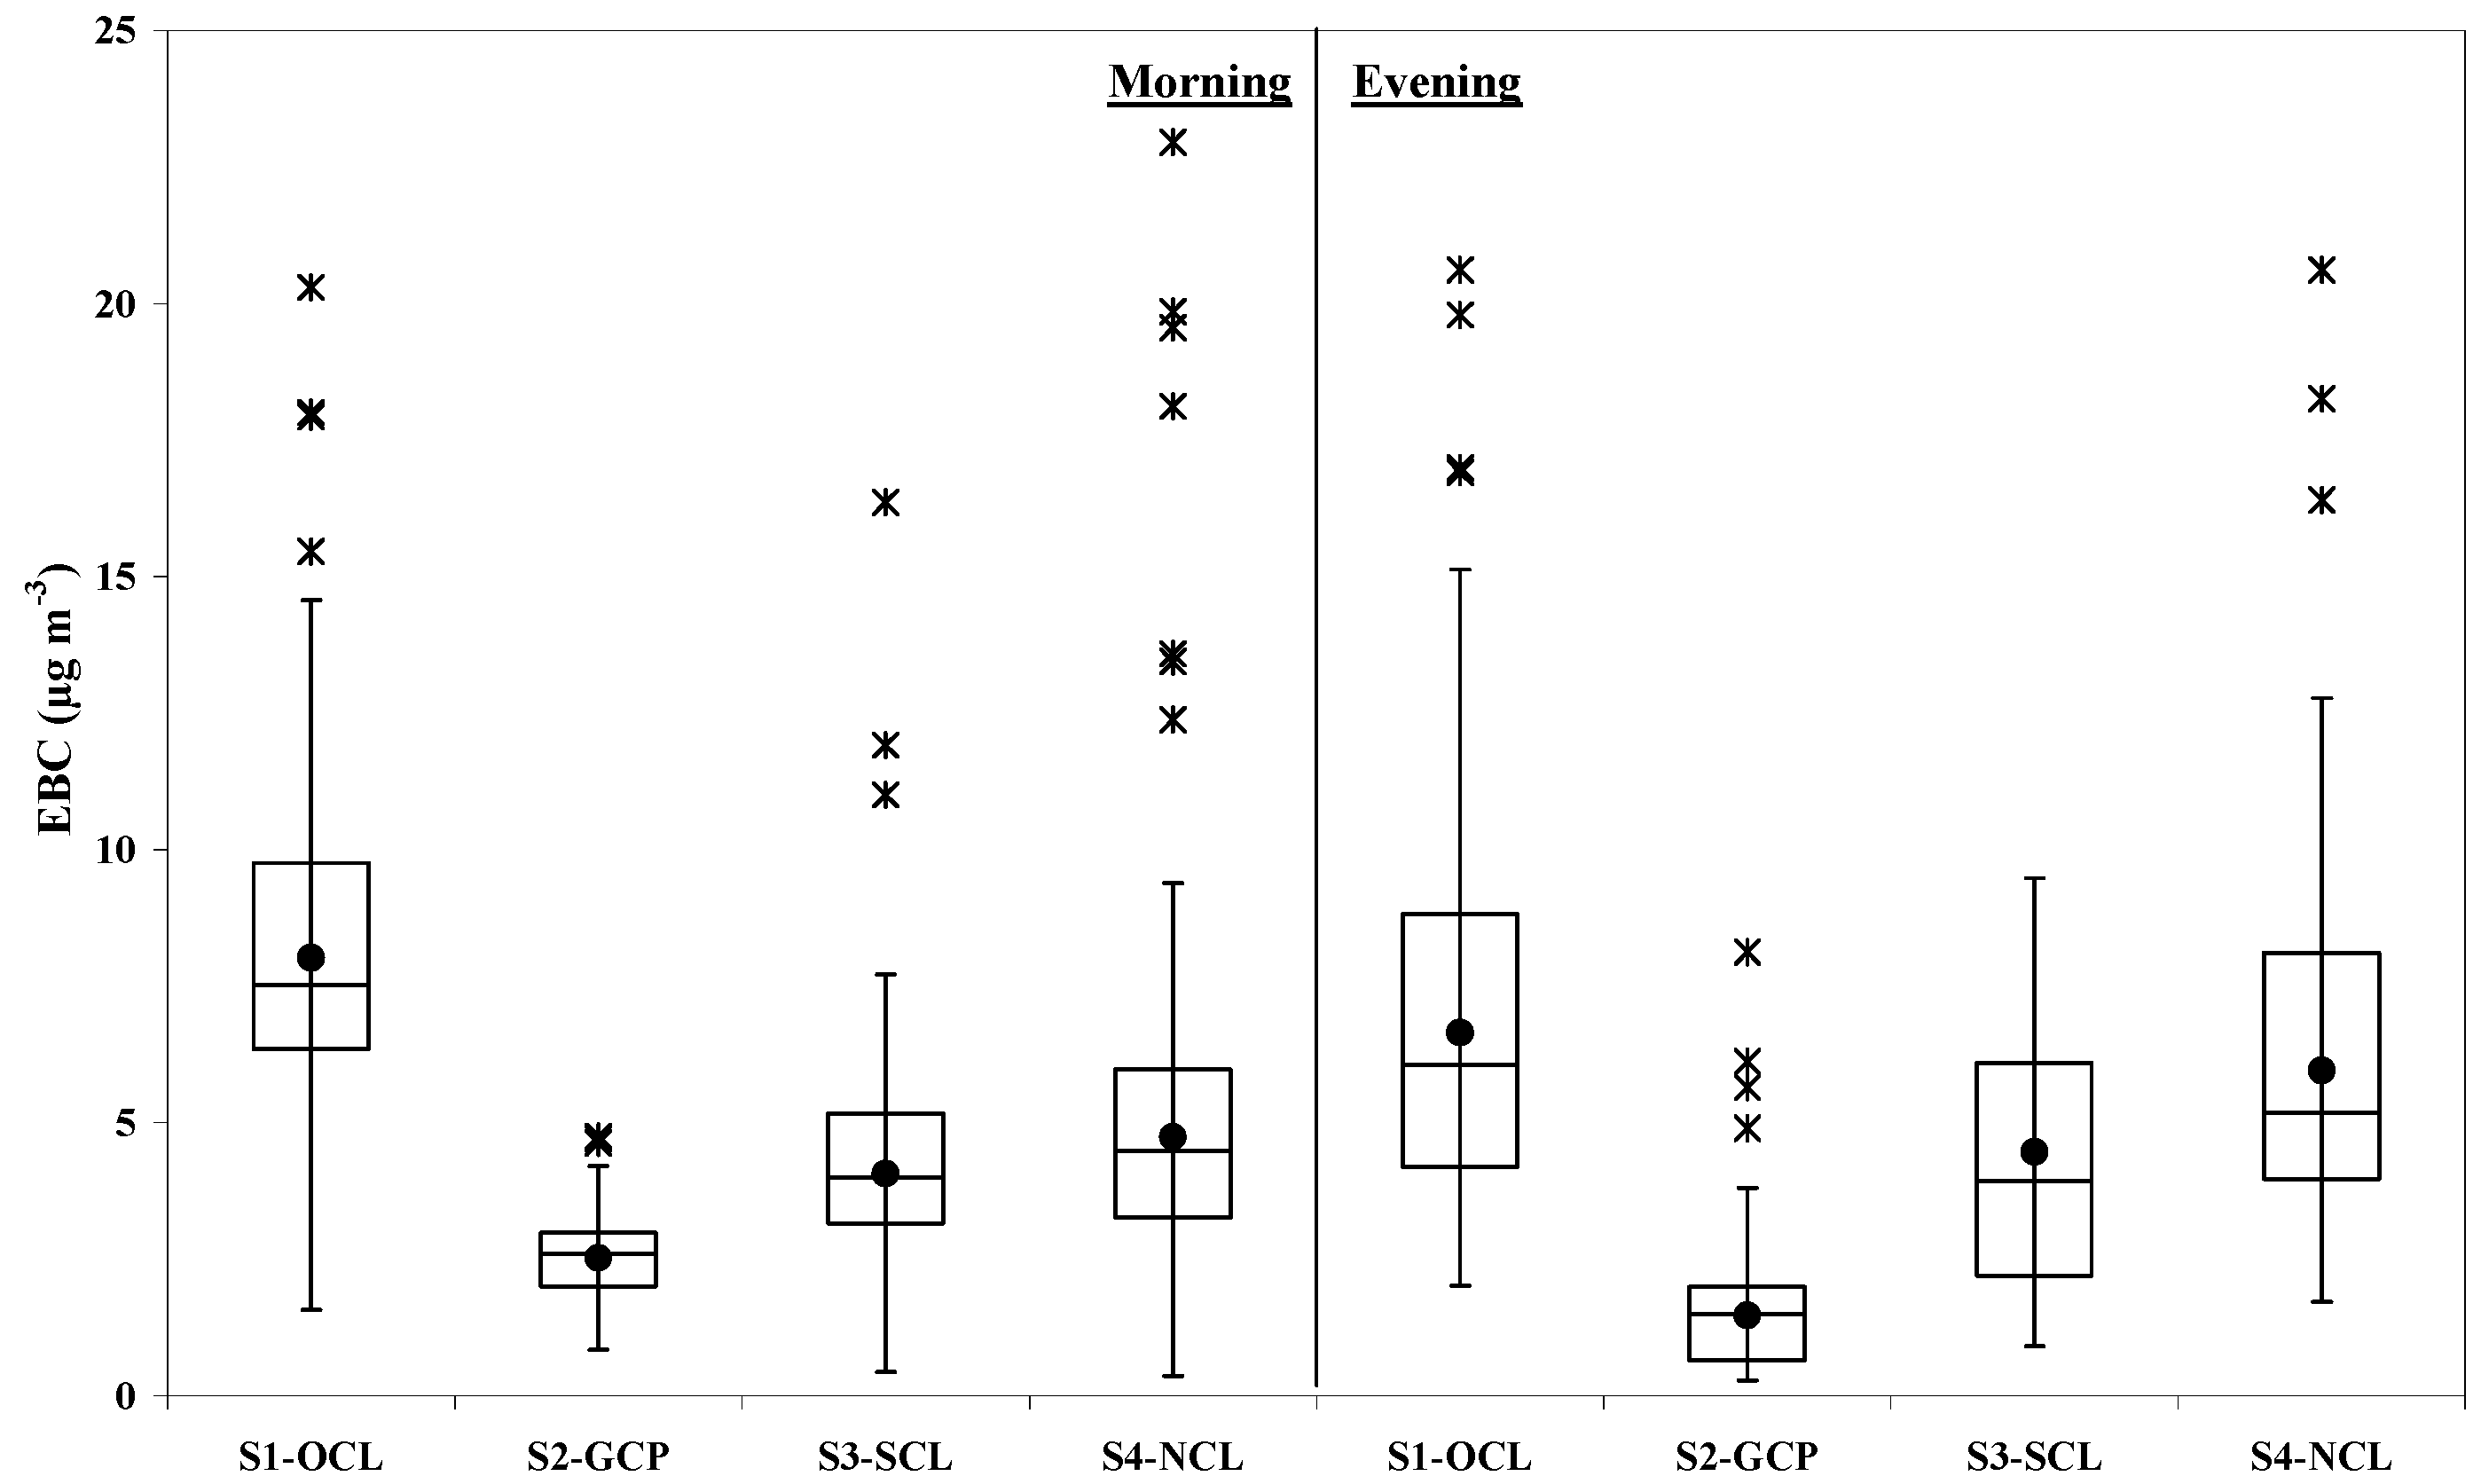
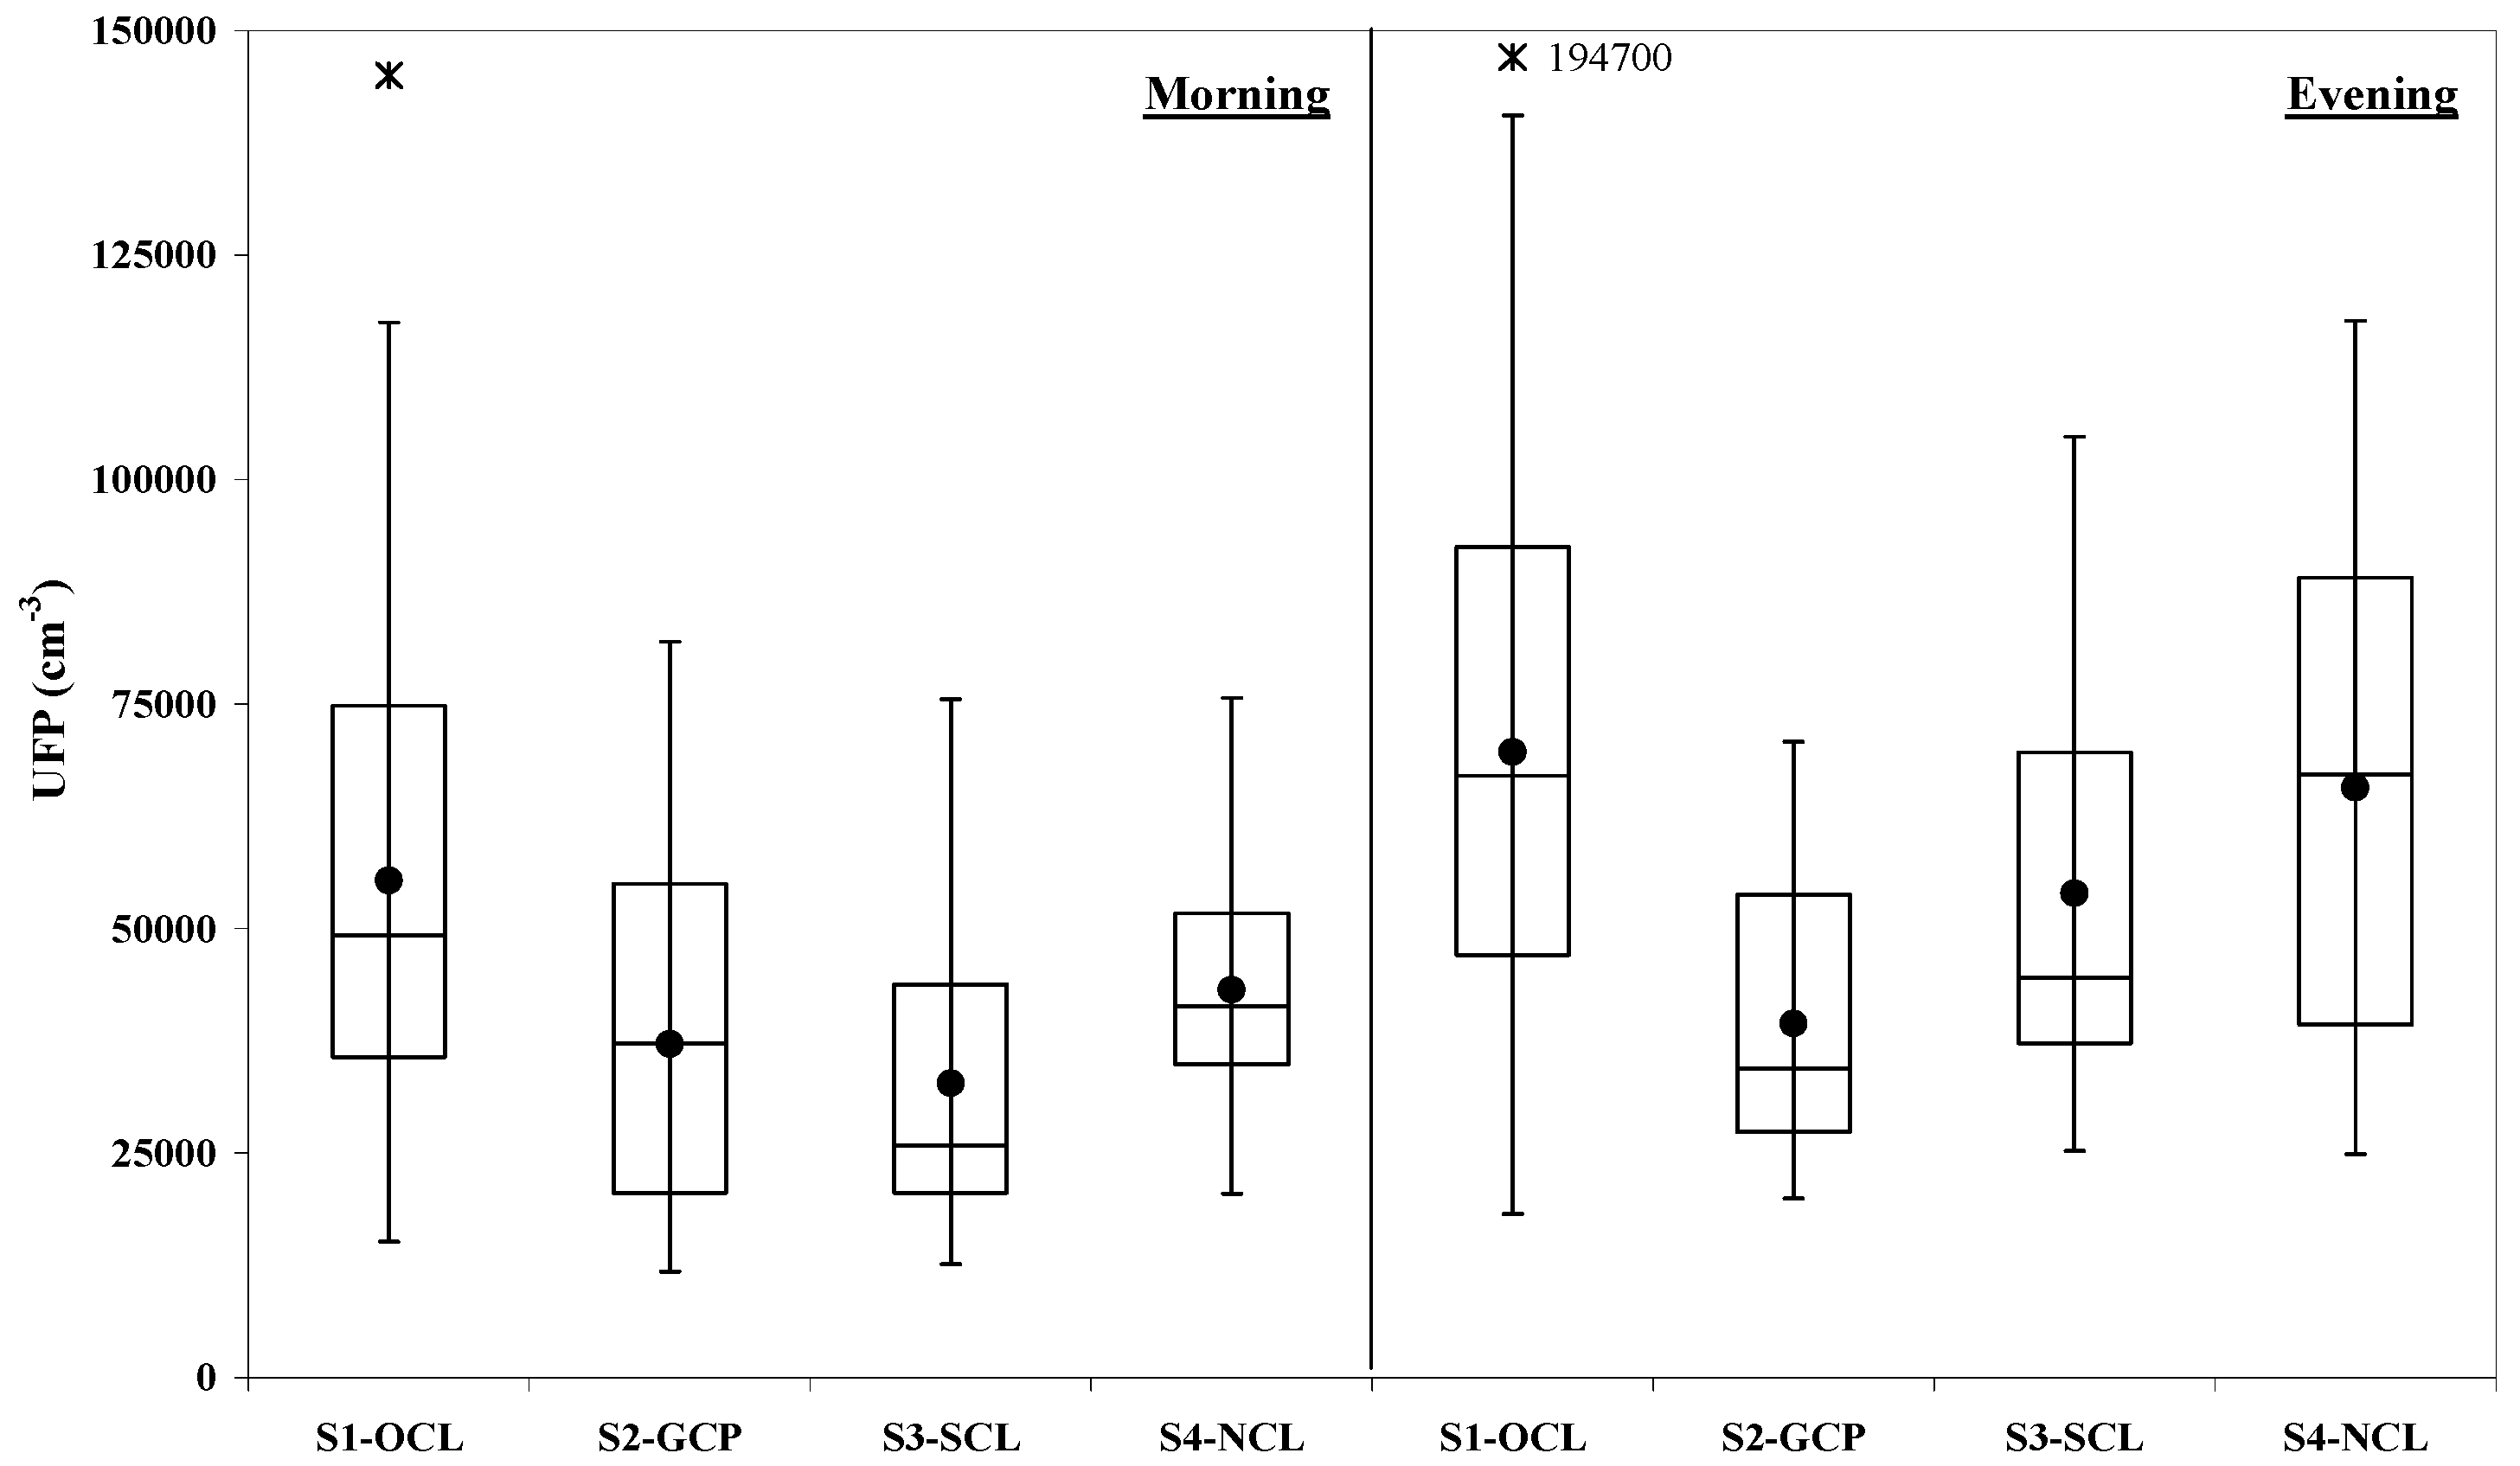
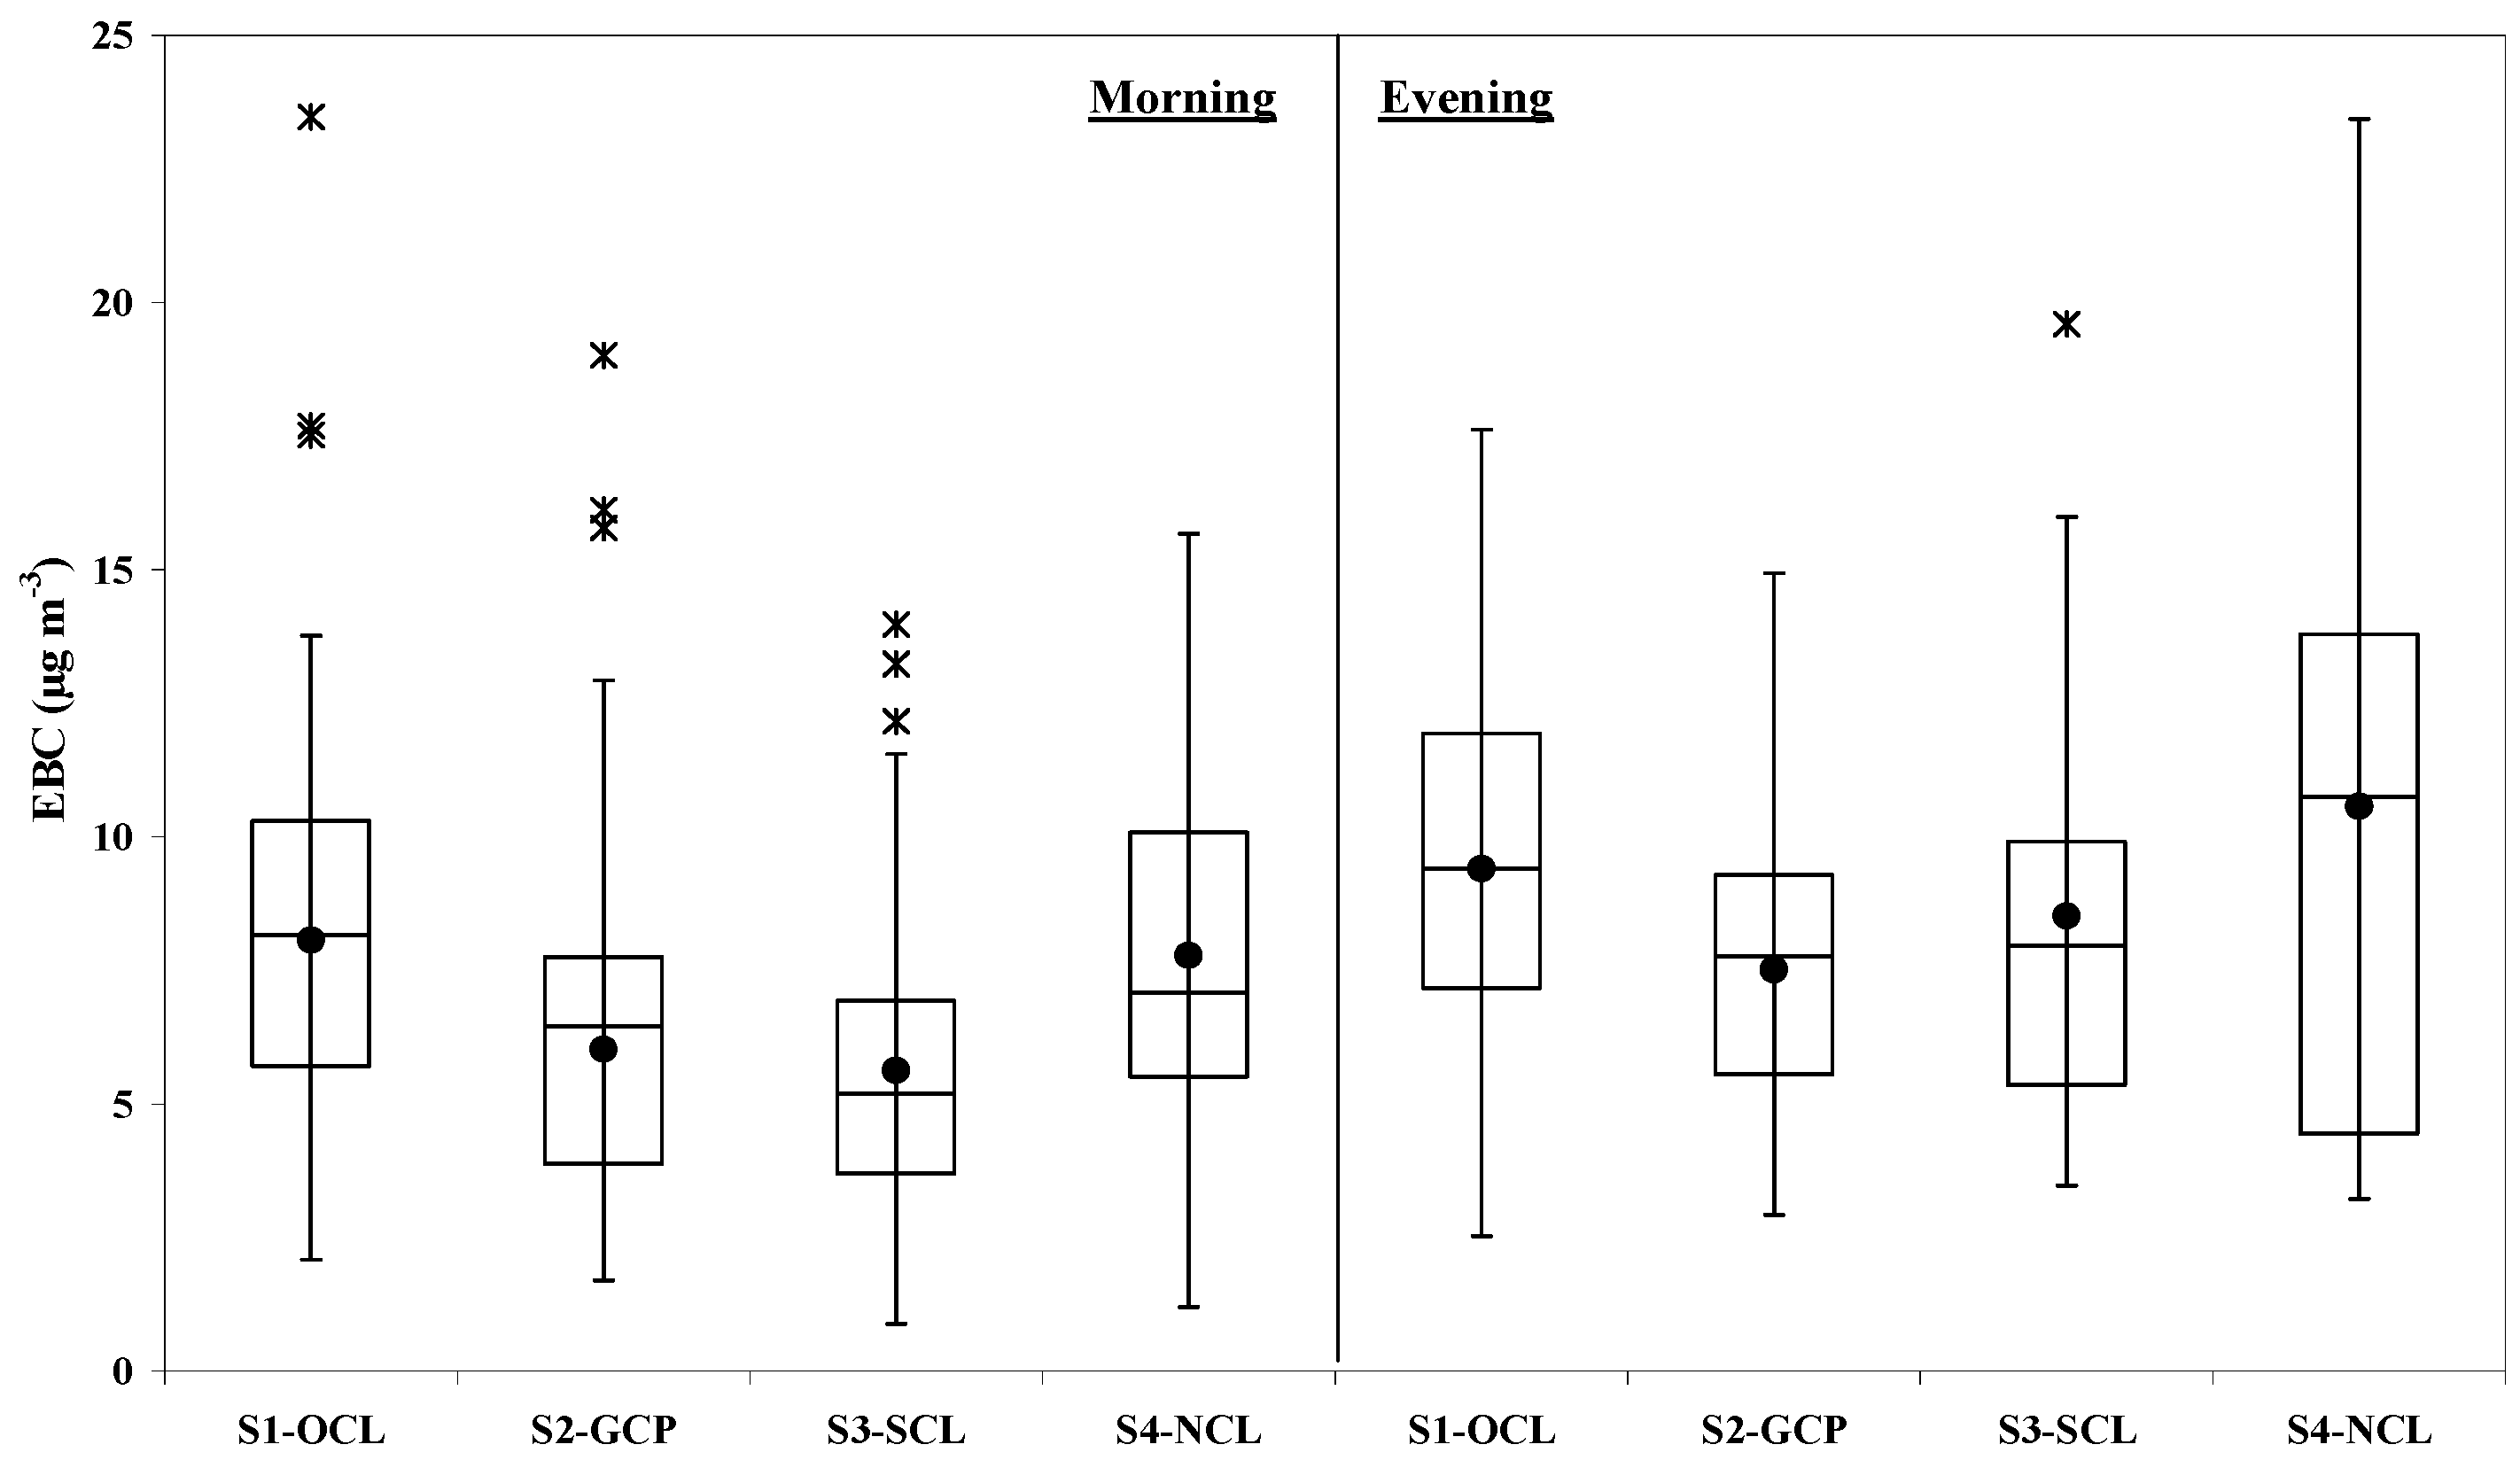
3.1. Concentration Levels

The distributions of one-minute concentration data for EBC and UFP measured along the selected sectors during the morning and evening sessions are summarized in the box-plots presented in Figure 3 and Figure 4 and in Figure 5 and Figure 6 for the cold (December 2012) and warm season (July and September 2011), respectively. Peak concentration data, identified as outliers according to Tukey’s method [31], are also plotted. Though regarded as outliers from the statistical standpoint, these data actually correspond to infrequent situations of high exposure concentrations occurring at busy crossroads or as a consequence of “big emitters” exhaust plumes. After outliers removal, EBC and UFPs seasonal datasets can be described through normal distribution (Kolmogorov–Smirnov test at 5% significance level) with mean and standard deviation values reported in Table 2. Supplementary Tables S1–S4 provide summary statistics for the entire datasets.
UFPs and EBC concentrations in the cold season are always higher than the corresponding warm season values, as a consequence of both less favorable meteorological conditions (lower wind speed, shallower boundary layer) and of stronger emissions (traffic and space heating, including biomass burning for domestic heating). A similar seasonal behavior was also observed for PM concentration data (Supplementary Table S5). However, it can be noticed that the cold/warm season ratio is larger for UFPs than for EBC (on the average, 3.7 vs. 2.1), because of the additional contribution of secondary particle formation, particularly favored by low-temperature conditions.
In the cold season the sector-averaged concentrations for the morning session are in the 3.3 × 10⁴–5.5 × 104 cm−3 range for UFPs and in the 5.6–8.1 µg·m−3 range for EBC; concentration ranges for the evening session are 3.9 × 10⁴–7.0 × 104 cm−3 and 7.5–10.6 µg·m−3, respectively. Corresponding figures for the warm season are 1.1 × 10⁴–2.1 × 104 cm−3 and 2.5–8.0 µg·m−3 for the morning session and 0.8 × 10⁴–1.7 × 104 cm−3 and 1.5–6.6 µg·m−3 for the evening session. Maximum concentration values in the cold season are in the 7.1 × 10⁴–1.4 × 105 cm−3 range for UFPs and in the 12–23 µg·m−3 range for EBC, but mostly around 15 µg·m−3. Warm season maxima are much lower, ranging between 2 × 104 cm−3 and 4 × 104 cm−3 for UFPs and between 4 µg·m−3 and 15 µg·m−3 for EBC. As the warm season distributions are shifted towards lower concentrations values, outliers are mainly observed in this season both for UFPs and EBC and more frequently for the sectors where the proximity to vehicle exhaust is higher (i.e., S1-OCL and S4-NCL). However the highest UFPs outliers are around 5 × 104 cm−3, which is on the same order of the average values for the cold season. Conversely, EBC outliers at the most trafficked sectors are up to about 20 µg·m−3, which is even greater than the cold season maximum levels. The comparison between morning and evening data shows an opposite seasonal behavior: in the cold season concentrations are basically higher in the evening than in the morning, whereas in the warm season evening data are similar or slightly lower than the morning data. This behavior is related to the diurnal development of the planetary boundary layer (PBL), significantly different in the two seasons: indeed, in the cold season the evening session took place after sunset with a reduced PBL depth as solar radiation was no longer active. On the contrary, in the warm season the earlier PBL rise in the morning and its later fall in the evening, resulted in a similar volume for the dispersion of the pollutants during both the daily monitoring sessions. Regardless for the season, sector-averaged UFPs and EBC concentrations are strongly correlated (cold season: R2 = 0.85; warm season: R2 = 0.67; overall: R2 = 0.72), thus confirming the relevant role of primary emissions from traffic on roadside levels for both the pollutants. Such a correlation suggests that cyclists can be concurrently exposed to high UFPs and EBC levels while riding the bike route (Figure 7).

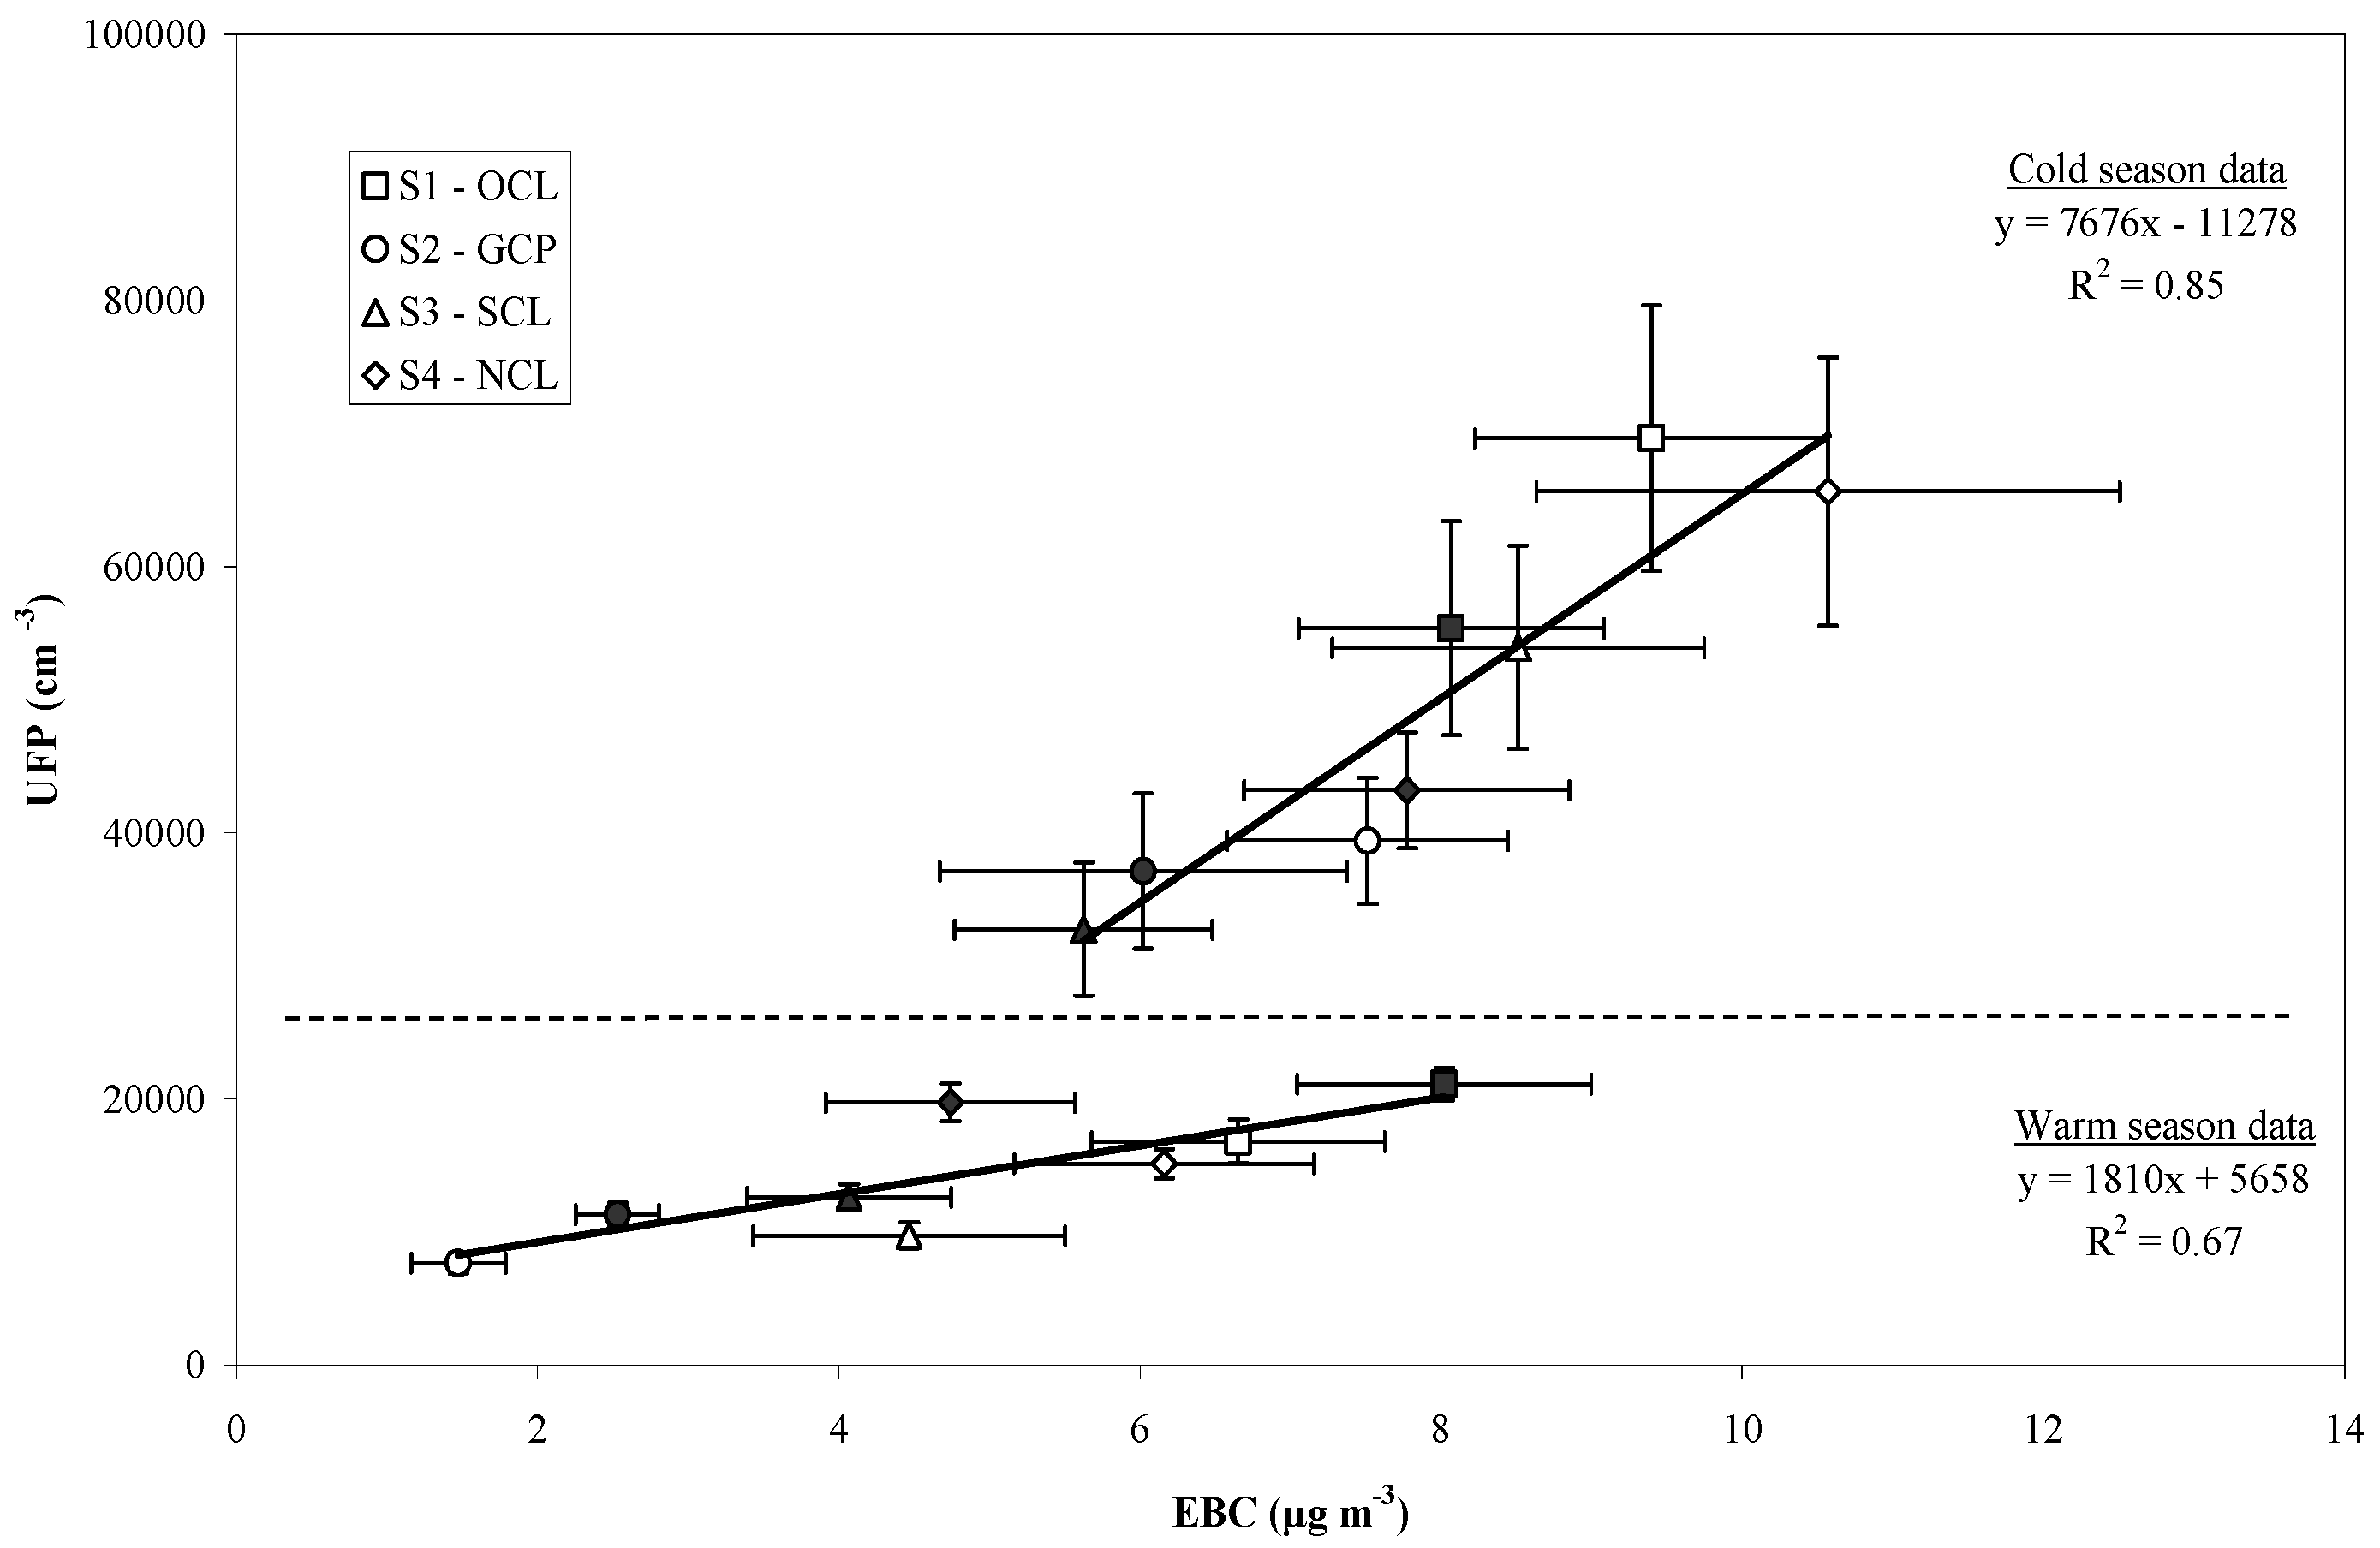
3.2. Spatial Variability

UFPs exposure concentration levels reported in this work are in substantial agreement with literature data, reporting cyclists’ exposure levels in the 1.6 × 10⁴–2.8 × 104 cm−3 range in Italy, Switzerland, Belgium, and The Netherlands [7,12,14,21,32,33] but up to 4.5 × 10⁴–8.4 × 104 cm−3 in other Dutch studies and in Spain [11,22,34]. Peters et al. [10] reported average concentrations of 3.2 × 104 cm−3 for Belgian cities. Reported summertime exposure concentration levels for cyclists in a trafficked road in Milan are about 3 × 104 cm−3 [35].
Relative differences between average road sectors exposure concentrations observed in our work are summarized in Table 3. With respect to sector S1-OCL, in sectors S2-GCP and S3-SCL, where proximity to traffic is reduced, the average exposure concentrations show reductions in the 22%–54% range for UFPs and in the 9%–78% range for EBC depending on season and time of the day. Less relevant reductions, and even a 12.5% increase for EBC on cold season’s evening session, are observed for sector S4-NCL, where proximity to traffic does not change significantly, but the wider road cross-section reduces the urban canyon effect present in the narrower sector S1-OCL.
Similar relative reductions for cycling infrastructures are reported in literature. Comparing cyclists’ exposure concentrations between the roadside cycle lane and separated cycle track (through parallel parking lots) in Portland, Kendrick et al. [15] reported significantly lower average levels for UFPs, with differences ranging between 8% and 38% depending on traffic volume, and fewer exposure concentration peaks on the cycle track. Cole-Hunter et al. [36] reported a 35% decrease in particle number exposure concentration on alternative route of lower proximity to traffic in Brisbane. Farrel et al. [25] reported a 41% decrease in UFP levels between bike trails and major roadways and almost no change between separated bike tracks and major roadways in Montreal; conversely, they reported a decrease in BC levels for both separated bike tracks (19%) and bike trails (40%). The influence of vehicular volume is also reported as concentration decrease is less relevant for local roads than for major roads. MacNaughton et al. [4] reported 20% and 50% increased average exposure concentration levels to BC on designated bike lanes and bike lanes compared with bicycle paths in Boston.
Despite some overlap in the distributions of concentration data, most of the sector-averaged values are statistically different, especially in the warm season, according to paired t-test results at a 5% significance level. In particular, sector S2-GCP mean concentrations (i.e., green path data) are always statistically lower than those of all the other sectors in the warm season, with the only exception for UFPs on mornings when compared to sector S3-SCL. Conversely, the average concentrations for sectors S1-OCL and S4-NCL (i.e., the most trafficked sectors with roadside bike lanes) never show statistically significant differences except for EBC on mornings, when the sector S1-OCL mean is almost twice as high as sector S4-NCL mean (8.0 µg·m−3 vs. 4.7 µg·m−3).
In the cold season, most of the differences still remain significant, namely those between sector GCP and sectors OCL and NCL, or non-significant, as those for sectors S1-OCL and S4-NCL (this time with the only exception for UFPs, instead of EBC during mornings). Conversely, t-tests for the evening session data involving sector S3-SCL show non-significant differences with sectors S1-OCL and S4-NCL for EBC, with average concentration levels still lower (8.5 µg·m−3 vs. 9.4 and 10.6 µg·m−3), but no longer significantly different as in the warm season. A non-significant difference in UFPs levels with respect to sector S4-NCL for the evening session is also observed, contrary to morning data.
Overall, in spite of the rather limited extension of the dataset, these results show that proximity to the traffic source is one of the main drivers affecting exposure concentration for cyclists. Indeed, sector S2-GCP, passing through a non-traffic area, and sector S3-SCL, thanks to the parking lots separating the bike lane, experience lower concentration levels than sectors S1-OCL and S4-NCL, where the bike lane is simply on the rightmost part of the road. The impact of bike lane design is particularly strong for sector S3-SCL where peak-hour traffic flow is higher than in sectors S1-OCL and S4-NCL (about 2300 vehicles·h−1 vs. about 1400–1500 vehicles·h−1): indeed, the lower distance from traffic and the canyon-like configuration of these latter sectors overbalance the lower primary emissions. Canyon-like road features are particularly relevant for the narrow sector S1-OCL where, regardless for season and time of the day, the highest concentrations are usually observed for both UFPs and EBC. However, sector-averaged concentration levels are also influenced by seasonality: actually, in the cold season concentrations levels tend to be more uniform as a consequence of the high background that reduces the effect of local scale emissions. Additionally, the poor atmospheric dispersion favors the build-up of airborne pollutants at the urban scale, smoothing the contrasts between the sectors.
The seasonal influence of spatial concentration gradients is clearly highlighted by the values of the coefficient of variation (CV) for spatially averaged data (i.e., the standard deviation/mean ratio of sector data) reported in Table 4. For both EBC and UFPs, under the cleaner air conditions of the warm season, spatial concentration gradients due to local traffic emissions are more pronounced than in the cold season as stated by the larger CV values. Table 4 also reports CV values computed for PM mass concentration data (PM10, PM2.5, PM1) obtained through the concurrent measurements performed by means of the portable optical particle counter. Compared with EBC and UFP, the smaller CV values (0.03–0.09 range in the cold season; 0.09–0.18 range in the warm season) point out a smaller spatial variability for PM data, thus indicating substantially uniform concentration values within the urban area and a hardly noticeable effect of local emissions from traffic. In this specific urban context, characterized by rather high urban and regional background for PM and by urban traffic composed by passenger cars and light duty vehicles, PM mass data do not appear able to capture the role of the very local- scale emissions of the traffic source as, conversely EBC and UFP data do.
Higher spatial variability for BC and UFPs compared to PM, as a result of the combined effect of source dynamics, street configuration, and distance from the traffic source, was reported in other European studies [32,37,38].

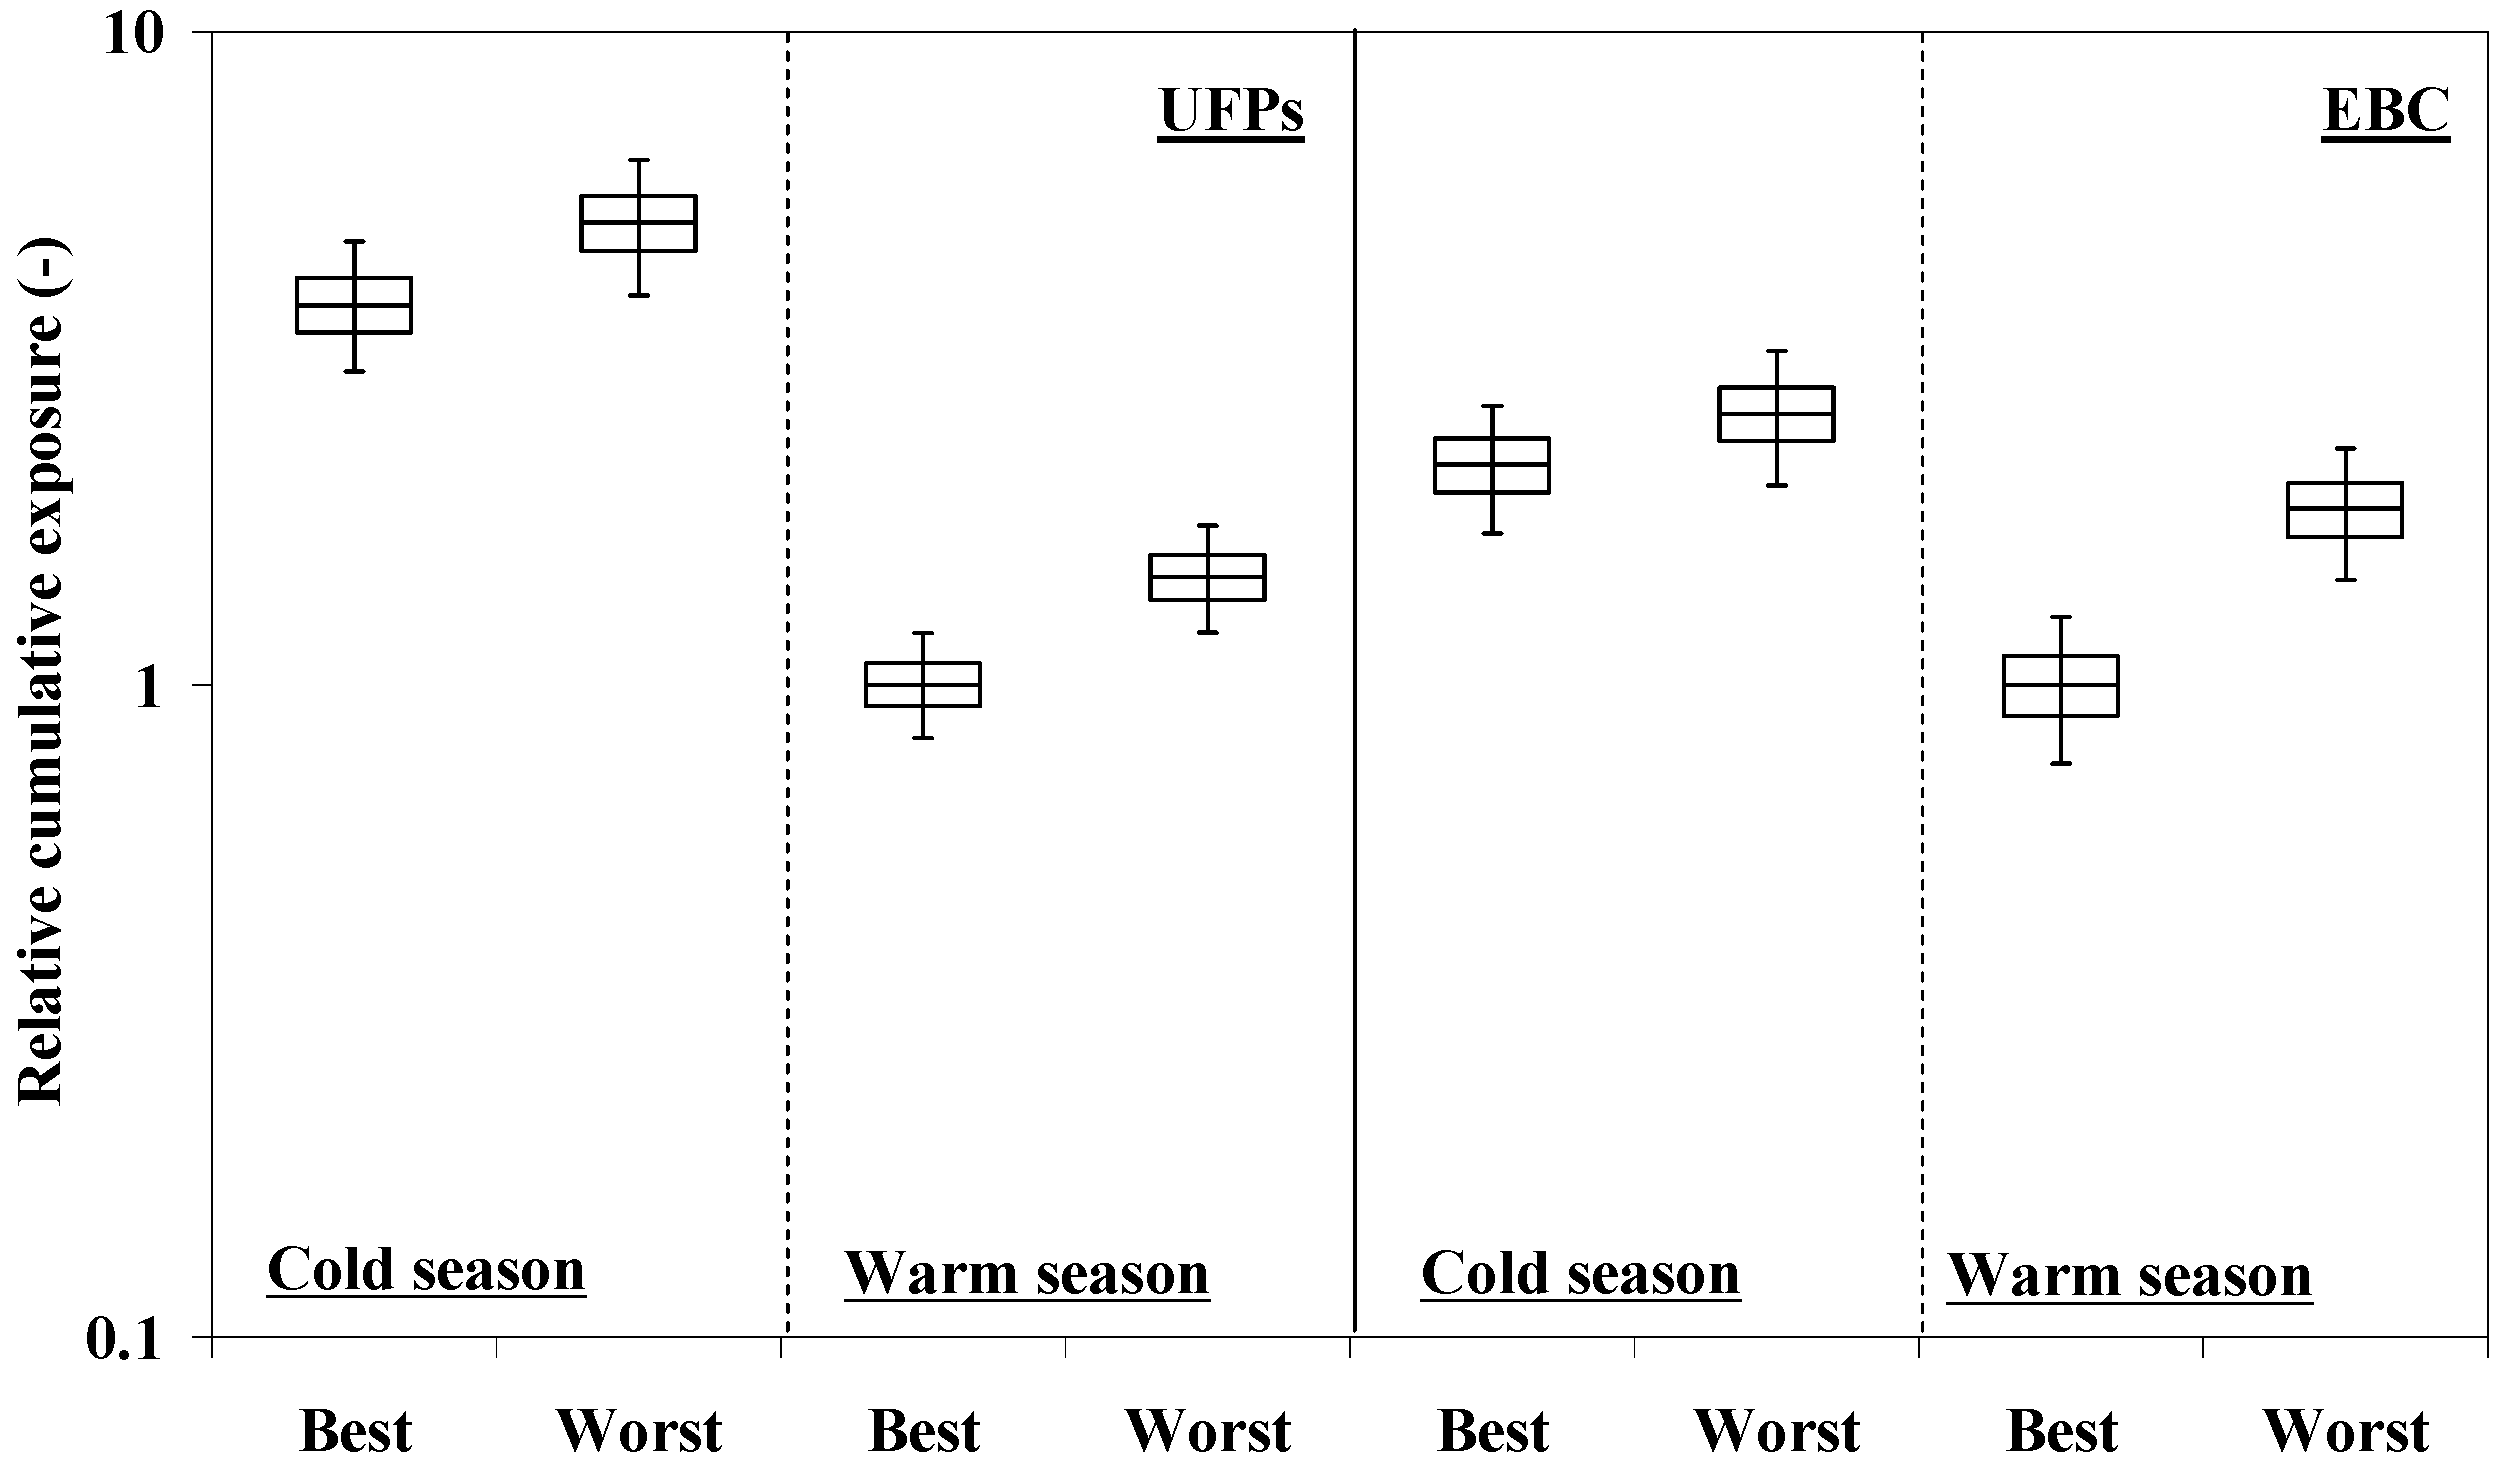
3.3. Route Choice Impact on Cumulative Exposure Assessment

As the observed concentration levels suggest that a proper choice of the travel route across the city may affect the overall exposure to UFPs and EBC, the impact of route choice on cyclists’ exposure during commuting urban trips has been assessed considering four alternative routes travelling from the southwestern residential areas to the train station for daily commuting. All routes are about 3.5 km long and are supposed to be ridden in 12 min. For each route, composite concentration subsets have been randomly generated drawing values from the sector-related concentration data distributions through iterative Monte Carlo technique. Such a probabilistic approach allows accounting for data variability within each sector, thus providing a more reliable assessment than simply relying on sector-averaged concentration values. Subsets for a reference route were formed based on sector S4-NCL data (12 data points). The subsets for the three alternative routes were formed considering six data points from the data distribution of sector S4 and six from those of sectors S1-OCL, S2-GCP, and S3-SCL. Cumulative exposures have been then estimated in terms of the total number of inhaled UFPs and the total mass of inhaled EBC for the morning travel to the train station and for the evening travel back from the train station. As all routes are flat, no variation in exercise is considered and the same ventilation rate was used. The resulting frequency distributions of the computed cumulative exposures have been then compared in order to assess their variability in relation to the route choice. As shown in Figure 8, a worst-route choice can result in an increased cumulative exposure to UFPs up to about 50% with respect to the best option route, without any relevant difference between cold and warm season. Conversely, for EBC seasonality strongly affects the difference in cumulative exposure between worst- and best-route choice: indeed, a worst-route choice leads to an increased exposure around 20% in the cold season, but up to 90% in the warm season.
In the warm season, the best- and the worst-route choice are the same for UFPs and EBC: best choice is to pass through sector S2-GCP on both trips, while the worst one is to pass through sector S1-OCL. In the cold season, as concentration levels tend to be more uniform, route choices also consider passing through sector S3-SCL (morning trip) and sector S2-GCP (evening trip) as the best option for both UFPs and EBC. For UFPs the worst-route choice is still the one passing through sector S1-OCL on both trips, whilst for EBC sector S4-NCL route on the evening trip leads to the higher exposure. Even though quite obvious, given the different concentration levels for the selected road sectors, these results provide a comparative and quantitative assessment of the extent of the different cyclists’ exposure according to the route they choose. In particular, the route choice has a huge effect on EBC exposure in the warm season as the distance from the traffic source takes greater value when the concentrations of primary pollutants, as black carbon, are at their lowest levels and spatial concentration gradients within the urban area are stronger.

3.4. Study Limitations

This study provided results in substantial agreement with those reported in literature, in particular concerning UFPs and BC concentration levels and the impact on these levels of factors, such as proximity to traffic and the typology of roads and cycle lanes. Nevertheless the study is affected by a number of limitations, as the datasets consistency, the non-simultaneous measurements along the road sectors, and the micrometeorological and background differences at the very local scale. Van Poppel et al. [32] investigated the number of runs on a route to obtain a representative picture of spatial variability. Van den Bossche et al. [27] stated that 10 repeated measurement runs can estimate average concentrations with 50% uncertainty. In our study, the number of runs is in this order for UFPs in the warm season, but is slightly lower for UFPs in the cold season and for EBC. Thus, further and longer studies are necessary to strengthen our preliminary results. Additionally, even though all monitoring sessions were taken during traffic rush hours, the non-simultaneous measurements may suffer from systematic differences in traffic intensity. Finally, our study relies on seasonal data for the winter and summer period only, during stable atmospheric conditions typical for the study area in these seasons. Further campaigns should also consider the spring and fall periods, when the lower atmosphere is less stable.

4. Conclusions

Ultrafine particles number and black carbon concentration have been measured in a mid-sized city in Northern Italy while travelling by bike different urban routes in order to assess cyclists’ exposure concentration levels and to investigate the effect of bicycle lane and road features on their exposure.
Despite some limitations, mainly related to the limited dataset and to the non-concurrent route monitoring, the results confirm that reducing cyclists’ proximity to traffic results in significantly lower exposure concentration levels. Indeed, where proximity to traffic is reduced, the average exposure concentrations show reductions in the 22%–54% range for UFPs and in the 9%–78% range for EBC, depending on season and time of the day. Exposure concentrations are also affected by road features as the wider cross road section reduces the urban canyon effect, thus favoring the dispersion of traffic-related pollutants. Seasonality is another relevant factor affecting exposure: the high concentration background in the cold season reduces the effect of local scale traffic emissions, thus smoothing the contrasts between the bike routes. Conversely, exposure concentrations to PM10, PM2.5, and PM1 particle mass were not influenced by traffic proximity, and mass-based PM concentration data did not show the same spatial gradient and route-related variability as EBC and UFPs. Thus, for the location of this study PM mass-based metrics were not able to capture local scale concentration gradients in the urban area as a consequence of the rather high urban and regional background that hides the contribution of local scale sources, such as road traffic.
The impact of route choice in cyclists’ exposure during commuting trips has been also estimated through a Monte Carlo approach, based on the measured data. These results show that, even for a short commuting trip in the urban area, a worst-route choice can result in an increased cumulative exposure to UFPs up to about 50% with respect to the best option route, without any relevant difference between cold and warm season. Conversely, for EBC seasonality strongly affects the difference in cumulative exposure between worst- and best-route choice: indeed, a worst-route choice leads to an increased exposure around 20% in the cold season, but up to 90% in the warm season.

Supplementary Materials

The following are available online at www.mdpi.com/2073-4433/8/2/40/s1.

Acknowledgments

The financial support by Fondazione di Piacenza e Vigevano for funding the UPUPA project (Ultrafine Particles in Urban Piacenza Area) is acknowledged.

Author Contributions

Giovanni Lonati, Giovanna Ripamonti, and Stefano Signorini conceived and designed the experiments; Giovanna Ripamonti, and Stefano Signorini performed the experiments; Giovanni Lonati analyzed the data; Giovanni Lonati and Senem Ozgen wrote the paper. All authors have read and approved the final manuscript.

Conflicts of Interest

The authors declare no conflict of interest.

References

  1. Jarjour, S.; Jerrett, M.; Westerdahl, D.; de Nazelle, A.; Hanning, C.; Daly, L.; Lipsitt, J.; Balmes, J. Cyclist route choice, traffic-related air pollution, and lung function: A scripted exposure study. Environ. Health 2013, 12, 14. [Google Scholar] [CrossRef] [PubMed]
  2. Rojas-Rueda, D.; de Nazelle, A.; Tainio, M.; Nieuwenhuijsen, M.J. The health risks and benefits of cycling in urban environments compared with car use: Health impact assessment study. Br. Med. J. 2011, 343, d4521. [Google Scholar] [CrossRef] [PubMed] [Green Version]
  3. De Nazelle, A.; Morton, B.J.; Jerrett, M.; Crawford-Brown, D. Short trips: An opportunity for reducing mobile-source emissions? Transp. Res. Part D Transp. Environ. 2010, 15, 451–457. [Google Scholar] [CrossRef]
  4. MacNaughton, P.; Melly, S.; Vallarino, J.; Adamkiewicz, G.; Spengler, J.D. Impact of bicycle route type on exposure to traffic-related air pollution. Sci. Total Environ. 2014, 490, 37–43. [Google Scholar] [CrossRef] [PubMed]
  5. Suárez, L.; Mesías, S.; Iglesias, V.; Silva, C.; Cáceres, D.D.; Ruiz-Rudolph, P. Personal exposure to particulate matter in commuters using different transport modes (bus, bicycle, car and subway) in an assigned route in downtown Santiago, Chile. Environ. Sci. Processes Impacts 2014, 16, 1309–1317. [Google Scholar] [CrossRef] [PubMed]
  6. Quiros, D.C.; Lee, E.S.; Wang, R.; Zhu, Y. Ultrafine particle exposures while walking, cycling, and driving along an urban residential roadway. Atmos. Environ. 2013, 73, 185–194. [Google Scholar] [CrossRef]
  7. Ragettli, M.; Corradi, E.; Braun-Fahrländer, C.; Schindler, C.; de Nazelle, A.; Jerrett, M.; Ducret-Stich, R.E.; Künzli, N.; Phuleria, H.C. Commuter exposure to ultrafine particles in different urban locations, transportation modes and routes. Atmos. Environ. 2013, 77, 376–384. [Google Scholar] [CrossRef]
  8. Hankey, S.; Marshall, J.D. On-bicycle exposure to particulate air pollution: Particle number, black carbon, PM2.5, and particle size. Atmos. Environ. 2015, 122, 65–73. [Google Scholar] [CrossRef]
  9. Bigazzi, A.Y.; Figliozzi, M.A. Review of urban bicyclists’ intake and uptake of traffic-related air pollution. Transp. Rev. 2014, 34, 221–245. [Google Scholar] [CrossRef]
  10. Peters, J.; Van Den Bossche, J.; Reggente, M.; van Poppel, M.; de Baets, B.; Theunis, J. Cyclist exposure to UFP and BC on urban routes in Antwerp, Belgium. Atmos. Environ. 2014, 92, 31–43. [Google Scholar] [CrossRef]
  11. De Nazelle, A.; Fruin, S.A.; Westerdahl, D.; Martinez, D.; Ripoll, A.; Kubesch, N.; Nieuwenhuijsen, M. A travel mode comparison of commuters’ exposures to air pollutants in Barcelona. Atmos. Environ. 2012, 59, 151–159. [Google Scholar] [CrossRef]
  12. Int Panis, L.; de Geus, B.; Vandenbulcke, G.; Willems, H.; Degraeuwe, B.; Bleux, N.; Mishra, V.; Thomas, I.; Meeusen, R. Exposure to particulate matter in traffic: A comparison of cyclists and car passengers. Atmos. Environ. 2010, 44, 2263–2270. [Google Scholar] [CrossRef]
  13. Schepers, P.; Fishman, E.; Beelen, R.; Heinen, E.; Wijnen, W.; Parkin, J. The mortality impact of bicycle paths and lanes related to physical activity, air pollution exposure and road safety. J. Transp. Health 2015, 2, 460–473. [Google Scholar] [CrossRef]
  14. Spinazzè, A.; Cattaneo, A.; Scocca, D.R.; Bonzini, M.; Cavallo, D.M. Multi-metric measurement of personal exposure to ultrafine particles in selected urban microenvironments. Atmos. Environ. 2015, 110, 8–17. [Google Scholar] [CrossRef]
  15. Kendrick, C.M.; Moore, A.; Haire, A.; Bigazzi, A.; Figliozzi, M.A.; Monsere, C.M.; George, L.A. Impact of bicycle lane characteristics on exposure of bicyclists to traffic-related particulate matter. J. Transp. Res. Board 2011, 2247, 24–32. [Google Scholar] [CrossRef]
  16. Hofmann, W. Modelling inhaled particle deposition in the human lung: A review. J. Aerosol Sci. 2011, 42, 693–724. [Google Scholar] [CrossRef]
  17. Weichenthal, S.; Kulka, R.; Dubeau, A.; Martin, C.; Wang, D.; Dales, R. Traffic-related air pollution and acute changes in heart rate variability and respiratory function in urban cyclists. Environ. Health Perspect. 2011, 119, 1373–1378. [Google Scholar] [CrossRef] [PubMed]
  18. Daigle, C.C.; Chalupa, D.C.; Gibb, F.R.; Morrow, P.E.; Oberdörster, G.; Utell, M.J.; Frampton, M.W. Ultrafine Particle Deposition in Humans during Rest and Exercise. Inhal. Toxicol. 2003, 15, 539–552. [Google Scholar] [CrossRef] [PubMed]
  19. Chalupa, D.C.; Morrow, P.E.; Oberdörster, G.; Utell, M.J.; Frampton, M.W. Ultrafine particle deposition in subjects with asthma. Environ. Health Perspect. 2004, 112, 879–882. [Google Scholar] [CrossRef] [PubMed]
  20. Good, N.; Mölter, A.; Ackerson, C.; Bachand, A.; Carpenter, T.; Clark, M.L.; Fedak, K.M.; Kayne, A.; Koehler, K.; Moore, B.; et al. The Fort Collins Commuter Study: Impact of route type and transport mode on personal exposure to multiple air pollutants. J. Expo. Sci. Environ. Epidemiol. 2016, 26, 397–404. [Google Scholar] [CrossRef] [PubMed]
  21. Strak, M.; Boogaard, H.; Meliefste, K.; Oldenwening, M.; Zuurbier, M.; Brunekreef, B.; Hoek, G. Respiratory health effects of ultrafine and fine particle exposure in cyclists. Occup. Environ. Med. 2010, 67, 118–124. [Google Scholar] [CrossRef] [PubMed]
  22. Zuurbier, M.; Hoek, G.; Oldenwening, M.; Lenters, V.; Meliefste, K.; van den Hazel, P.; Brunekreef, B. Commuters’ exposure to particulate matter air pollution is affected by mode of transport, fuel type, and route. Environ. Health Perspect. 2010, 118, 783–789. [Google Scholar] [CrossRef] [PubMed]
  23. Hatzopoulou, M.; Weichenthal, S.; Barreau, G.; Goldberg, M.; Farrell, W.; Crouse, D.; Ross, N. A web-based route planning tool to reduce cyclists’ exposures to traffic pollution: A case study in Montreal, Canada. Environ. Res. 2013, 123, 58–61. [Google Scholar] [CrossRef] [PubMed]
  24. Hertel, O.; Hvidberg, M.; Ketzel, M.; Storm, L.; Stausgaard, L. A proper choice of route significantly reduces air pollution exposure—A study on bicycle and bus trips in urban streets. Sci. Total Environ. 2008, 389, 58–70. [Google Scholar] [CrossRef] [PubMed]
  25. Farrel, W.J.; Weichenthal, S.; Goldberg, M.; Hatzopoulou, M. Evaluating air pollution exposures across cycling infrastructure types: Implications for facility design. J. Transp. Land Use 2015, 8, 131–149. [Google Scholar] [CrossRef]
  26. Janssen, N.A.H.; Hoek, G.; Simic-Lawson, M.; Fischer, P.; van Bree, L.; ten Brink, H.; Keuken, M.; Atkinson, R.W.; Anderson, H.R.; Brunekreef, B.; et al. Black carbon as an additional indicator of the adverse health effects of airborne particles compared with PM10 and PM2.5. Environ. Health Perspect. 2011, 119, 1691–1699. [Google Scholar] [CrossRef] [PubMed]
  27. Van Den Bossche, J.; Peters, J.; Verwaeren, J.; Botteldooren, D.; Theunis, J.; de Baets, B. Mobile monitoring for mapping spatial variation in urban air quality: Development and validation of a methodology based on an extensive dataset. Atmos. Environ. 2015, 105, 148–161. [Google Scholar] [CrossRef]
  28. Petzold, A.; Ogren, J.A.; Fiebig, M.; Laj, P.; Li, S.-M.; Baltensperger, U.; Holzer-Popp, T.; Kinne, S.; Pappalardo, G.; Sugimoto, N.; et al. Recommendations for reporting “black carbon” measurements. Atmos. Chem. Phys. 2013, 13, 8365–8379. [Google Scholar] [CrossRef] [Green Version]
  29. Morawska, L.; Ristovski, Z.; Jayaratne, E.R.; Keogh, D.U.; Ling, X. Ambient nano and ultrafine particles from motor vehicle emissions: Characteristics, ambient processing and implications on human exposure. Atmos. Environ. 2008, 42, 8113–8138. [Google Scholar] [CrossRef] [Green Version]
  30. Hagler, G.S.W.; Yelverton, T.L.B.; Vedantham, R.; Hansen, A.D.A.; Turner, J.R. Post-processing method to reduce noise while preserving high time resolution in Aethalometer Real-time black carbon data. Aerosol Air Qual. Res. 2011, 11, 539–546. [Google Scholar] [CrossRef]
  31. Tukey, J. Exploratory Data Analysis; Addison-Wesley: Reading, MA, USA, 1977; p. 688. [Google Scholar]
  32. Van Poppel, M.; Peters, J.; Bleux, N. Methodology for setup and data processing of mobile air quality measurements to assess the spatial variability of concentrations in urban environments. Environ. Pollut. 2013, 183, 224–233. [Google Scholar] [CrossRef] [PubMed]
  33. Berghmans, P.; Bleux, N.; Int Panis, L.; Mishra, V.K.; Torfs, R.; Van Poppel, M. Exposure assessment of a cyclist to PM10 and ultrafine particles. Sci. Total Environ. 2009, 407, 1286–1298. [Google Scholar] [CrossRef] [PubMed]
  34. Kaur, S.; Clark, R.; Walsh, P.T.; Arnold, S.J.; Colvile, R.N.; Nieuwenhuijsen, M.J. Exposure visualization of ultrafine particle counts in a transport microenvironment. Atmos. Environ. 2006, 40, 386–398. [Google Scholar] [CrossRef]
  35. Ozgen, S.; Ripamonti, G.; Malandrini, A.; Ragettli, M.S.; Lonati, G. Particle number and mass exposure concentrations by commuter transport modes in Milan, Italy. AIMS Environ. Sci. 2016, 3, 168–184. [Google Scholar] [CrossRef]
  36. Cole-Hunter, T.; Jayaratne, R.; Stewart, I.; Hadaway, M.; Morawska, L.; Solomon, C. Utility of an alternative bicycle commute route of lower proximity to motorised traffic in decreasing exposure to ultra-fine particles, respiratory symptoms and airway inflammation—A structured exposure experiment. Environ. Health 2013, 12, 29. [Google Scholar] [CrossRef] [PubMed]
  37. Keuken, M.P.; Jonkers, S.; Zandveld, P.; Voogt, M.; Elshout van den, S. Elemental carbon as an indicator for evaluating the impact of traffic measures on air quality and health. Atmos. Environ. 2012, 61, 1–8. [Google Scholar] [CrossRef]
  38. Mishra, V.K.; Prashant, K.; Van Poppel, M.; Bleux, N.; Frijns, E.; Reggente, M.; Berghmans, P.; Int Panis, L.; Samson, R. Wintertime spatio-temporal variation of ultrafine particles in a Belgian city. Sci. Total Environ. 2012, 431, 307–313. [Google Scholar] [CrossRef] [PubMed] [Green Version]
Figure 1. Location of Piacenza in the Po valley.
Atmosphere 08 00040 g001
Figure 2. Selected route sectors.
Atmosphere 08 00040 g002
Figure 3. Box-plots of 1-min concentration data for UFP in the cold season (mean values: dots; min-max range: whiskers: median and interquartile range: boxes).
Atmosphere 08 00040 g003
Figure 4. Box-plots of 1-min concentration data for EBC in the cold season (mean values: dots; min-max range: whiskers: median and interquartile range: boxes).
Atmosphere 08 00040 g004
Figure 5. Box-plots of 1-min concentration data for UFP in the warm season (mean values: dots; min-max range: whiskers: median and interquartile range: boxes).
Atmosphere 08 00040 g005
Figure 6. Box-plots of 1-min concentration data for EBC in the warm season (mean values: dots; min-max range: whiskers: median and interquartile range: boxes).
Atmosphere 08 00040 g006
Figure 7. Scatter plot for sector-related EBC and UFP concentration levels (mean and 95% confidence intervals for the mean). Dark symbols: morning data; white symbols: evening data.
Atmosphere 08 00040 g007
Figure 8. Box-plots of computed cumulative exposure to UFPs and EBC for best- and worst-case route choice for a commuter’s ride in the urban area (mean values: dots; min-max range: whiskers: median and interquartile range: boxes).
Atmosphere 08 00040 g008
Table 1. Main features of the route sectors.
Route SectorLocationBike Lane/Road FeaturesTraffic Rate (vehicles·h−1)
S1-OCLCity center roadOn-road cycle lane
Narrow urban street canyon
1400
S2-GCPGreen cycle pathPaved path in a parkNo road traffic
S3-SCLCity center inner ring roadSeparated cycle path
(2.5 m between cyclists and traffic)
2200
S4-NCLCity center outer ring roadNo cycle lane
Wide urban street canyon
1600
Table 2. Mean and standard deviations of morning and evening (italic type) concentration data for UFP and EBC by route sector.
SeasonPollutantRoute Sector
S1-OCLS2-GCPS3-SCLS4-NCL
Cold seasonUFPs (104 cm−3)5.53 ± 2.813.71 ± 23.27 ± 1.724.31 ± 1.39
6.96 ± 3.183.94 ± 1.445.39 ± 2.276.56 ± 2.9
EBC (µg·m−3)8.0 ± 3.36.0 ± 2.85.6 ± 2.97.7 ± 3.6
9.3 ± 3.77.5 ± 2.88.5 ± 3.610.5 ± 5.5
Warm seasonUFPs (104 cm−3)2.11 ± 0.611.13 ± 0.421.26 ± 0.451.97 ± 0.72
1.68 ± 0.790.76 ± 0.30.97 ± 0.411.51 ± 0.47
EBC (µg·m−3)8.0 ± 3.22.5 ± 0.84.0 ± 1.84.7 ± 2.3
6.6 ± 3.21.4 ± 0.94.4 ± 2.96.1 ± 2.8
Table 3. Relative differences between the average exposure concentrations for road sectors S2-GCP, S3-SCL, and S4-NCL with respect to sector S1-OCL.
SeasonMorning SessionEvening Session
S2-GCPS3-SCLS4-NCLS2-GCPS3-SCLS4-NCL
UFPsCold season32.9%40.8%22.0%43.4%22.5%5.7%
Warm season46.3%40.2%6.5%54.2%41.9%9.9%
EBCCold season25.3%30.3%3.6%20.1%9.4%−12.5%
Warm season68.4%49.3%40.9%77.8%32.9%10.4%
Table 4. Spatial coefficient of variation (CV) computed on seasonal and time of the day basis for EBC, UFP, and PM mass concentration data.
Cold SeasonWarm Season
MorningEveningMorningEvening
EBC0.180.140.480.50
UFPs0.230.240.300.35
PM100.070.090.130.18
PM2.50.030.080.070.17
PM10.040.080.090.13

