
Quantifying Light Absorption of Iron Oxides and Carbonaceous Aerosol in Seasonal Snow across Northern China

1
Key Laboratory for Semi-Arid Climate Change of the Ministry of Education, College of Atmospheric Sciences, Lanzhou University, Lanzhou 730000, China
2
Key Laboratory of Tibetan Environment Changes and Land Surface Processes, Institute of Tibetan Plateau Research, Chinese Academy of Sciences (CAS), Beijing 100101, China
3
CAS Center for Excellence in Tibetan Plateau Earth Sciences, Beijing 100101, China
*
Author to whom correspondence should be addressed.
Atmosphere 2017, 8(4), 63; https://doi.org/10.3390/atmos8040063
Submission received: 26 January 2017
/
Revised: 10 March 2017
/
Accepted: 18 March 2017
/
Published: 28 March 2017
(This article belongs to the Special Issue Dust Storms and Associated Impacts to Human Health and the Environment)
Abstract
:In this study, we attempted to quantify light absorption by insoluble light-absorbing particles (ILAPs) such as black carbon (BC), organic carbon (OC) and iron oxides in snow using an optical method directly and compared the results with those obtained using optical and chemical analysis methods cooperatively in previous studies. The mass absorption coefficients (MACs) and absorption Ångström exponents (AAEs) of pure hematite, goethite and fullerene soot were also measured using an integrating sphere/integrating sandwich (ISSW) spectrophotometer in the laboratory. The results indicated that the MACs of pure hematite and goethite are 0.97 ± 0.02 m2·g−1 and 0.43 ± 0.01 m2·g−1 at 550 nm, and their AAEs are 5.53 ± 0.47 and 2.18 ± 0.16 from 550 nm to 750 nm, respectively. The MAC and AAE of fullerene soot are 6.40 ± 0.42 m2·g−1 at 550 nm and 0.54 ± 0.06 from 450 to 750 nm. By using the regionally average AAEs of non-BC components in snow, we evaluated the performance of a directly optical analysis, rather than combination of the optical and chemical methods, in quantifying the light absorption of BC, OC and Fe in snow samples. We found that the directly optical method used to measure the light absorption of BC and OC in Northern China snow has substantially low biases of 6.29% and 4.27% in median comparing to previous method. However, the high biases in estimating light absorption of Fe (33.01%) may be associated with the significant underestimation of the AAE of Fe.
1. Introduction
Black carbon (BC), water-insoluble organic carbon (hereinafter simply OC) and mineral dust (MD) are three major types of insoluble light-absorbing particles (ILAPs) in the atmosphere. They can significantly influence the regional and global climate by scattering and absorbing solar radiation [1,2], modify cloud microphysical properties [3,4], and thus alter precipitation efficiency [5,6]. Once ILAPs are deposited onto snow or ice, they can significantly reduce the snow albedo and thereby increase the absorption of solar radiation, leading to the acceleration of snow melting (defined as the snow darkening effect; SDE) (e.g., [7,8,9,10,11,12,13,14] and references therein). As the most absorptive impurity per unit mass in snow, BC has attracted a significant amount of attention (e.g., [7,15,16,17,18,19,20,21,22]). Warren and Wiscombe [7] suggested that 1 μg·g−1 BC in snow or less can reduce the visible-wavelength snow albedo by 5%–15%. Hansen and Nazarenko [21] reported that the mean soot effect on spectrally integrated albedos in the Northern Hemisphere land areas is 3%. According to the fifth assessment report of the Intergovernmental Panel on Climate Change (IPCC) [1], the radiative forcing of BC in snow and ice has a global mean of +0.04 W·m−2, with a high degree of uncertainty. OC in snow is not only from combustion but also from soil mixed with snow. According to Wang et al. [16], OC dominates the light absorption in seasonal snow across the grasslands of Inner Mongolia, China. Dang and Hegg [23] showed that OC in snow across North America accounts for approximately 13% of the total absorption. In addition to the carbonaceous aerosols in snow, recent studies have also indicated that there are heavy loadings of mineral dust in the seasonal snow of Inner Mongolia and the Qilian Mountains across Northern China [16]. Moreover, a much higher mass flux of dust than BC can lead to strong positive radiative forcing on glaciers in the Himalayas [24,25]. The light absorption by mineral dust in snow is generally due to the presence of iron oxides [16]. Iron oxides in mineral dust mainly exist as goethite (α-FeOOH) (Gt) and hematite (Fe2O3) (Hmt) and are widely found in dust samples from desert regions worldwide, including East Asia and both North and West Africa [26,27,28,29], which can obviously influence the optical properties of dust [30]. Moreover, aggregation of hematite with quartz or clays can strongly enhance absorption at solar wavelengths [31].
Due to the importance of ILAPs deposited on snow and ice [25,32], it is necessary to better understand the spatial and temporal distributions of ILAPs in snow and quantify the light absorption of different ILAPs. Since the 1980s, filter-based optical techniques have been commonly used to measure the light absorption of BC in snow (e.g., [15,16,19,22,23,33]). Recently, Single Particle Soot Photometer (SP2) [34,35,36] and thermal optical methods [37,38,39] have also been used to measure the mass fraction of BC in snow. In addition, Grenfell et al. [40] developed an Integrating Sphere/Integrating Sandwich (ISSW) spectrophotometer and a corresponding optical method. An ISSW spectrophotometer can determine the BC concentration and partition the light absorption by different ILAPs in snow based on the differences in light absorption wavelength dependence. This method was first applied by Clarke and Noone [22], and large-scale applications have been processed by Doherty et al. [19] in the Arctic and Wang et al. [16] across Northern China. However, in previous studies, the mass concentrations of iron (hereinafter simply Fe) in snow samples have been analyzed by chemical methods (e.g., Inductively Coupled Plasma Mass Spectrometry; ICP-MS) [16,23]. Although Wang et al. [16] already separated the light absorption of ILAPs, the basic assumption of their method is that the iron in mineral dust in seasonal snow is due to goethite. Therefore, the optical properties of iron oxides we hypothesized can lead to large biases and uncertainties due to combining optical methods and chemical analysis.
The novelty of this study is the quantification of the light absorption of ILAPs in snow. First, we measured the mass absorption coefficients (MACs) and absorption Ångström exponents (AAEs) for pure hematite and goethite particles using an ISSW spectrometer in our laboratory; then, a correction method was adopted to decrease the scattering response and multiple absorption of the system following Bond et al. [41]. Based on two datasets of snow field campaigns across Northern China during the winters of 2010 and 2012, a new method was developed to quantify the mass loadings and light absorptions of ILAPs.
2. Materials and Methods
2.1. Sample Collections
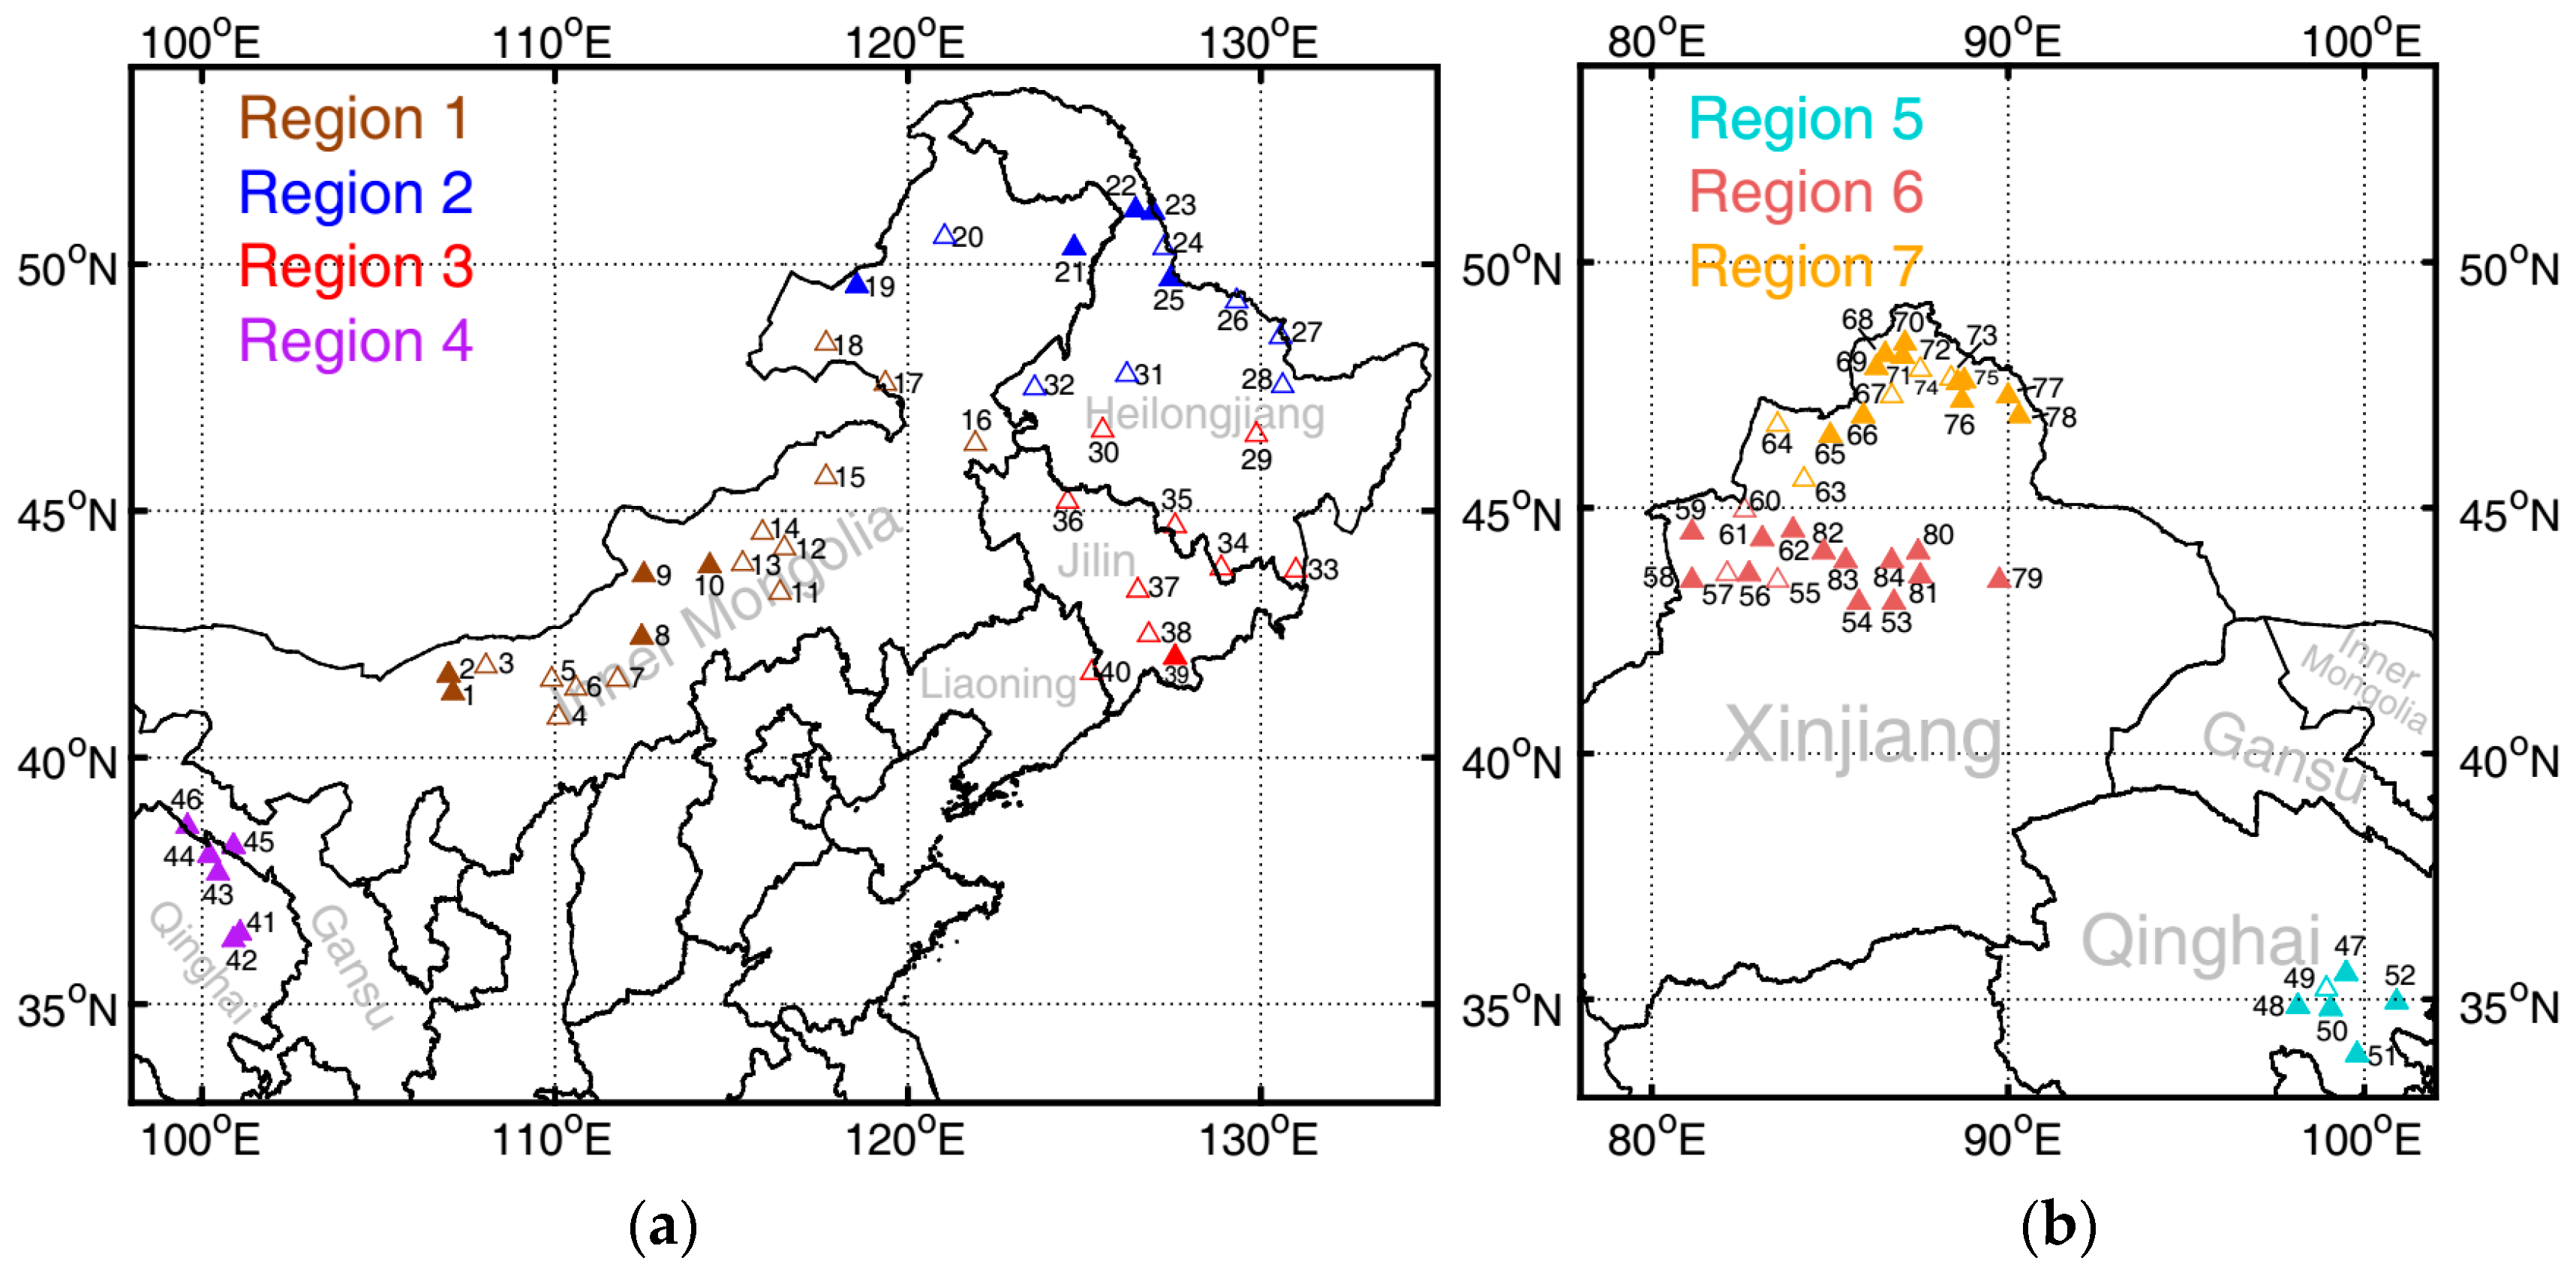
In this study, the optical properties of pure iron oxides (Gt and Hmt) and commercial soot (fullerene soot, as produced by Alfa Aesar, Inc., Ward Hill, MA, USA) were measured using an ISSW spectrometer [40]. The hematite (iron(III) oxide, red (hematite) (99.8%-Fe), Stream Chemicals, Inc., Newburyport, MA, USA) was crimson in color, while the goethite (Sigma Aldrich, Inc., St. Louis, MO, USA) had a fraction of Fe (30%–63%) as sandy brown. Snow samples were collected during two field campaigns conducted in January–February of 2010 and 2012. These campaigns covered seven provinces, including Liaoning, Jilin, Heilongjiang, Xinjiang, Qinghai, Gansu and Inner Mongolia Provinces, which are located across Northern China, and nearly 700 snow samples were collected at 84 sites. These sites were numbered chronologically and their distributions are shown in Figure 1. Details of these field campaigns, such as site distributions, sampling methods, and sample processing, were presented in Huang et al. [42], Wang et al. [16] and Ye et al. [43].
2.2. Filtration Procedure
First, a given mass of samples (e.g., 1.0 mg for fullerene soot and 4.0 mg for hematite or goethite) was weighed using a semi-micro balance. Second, the samples were placed into pre-cleaned glass breakers with a certain volume of ultrapure water (e.g., 1.5 L). Then, the liquid samples were sonicated for 10 min and stirred with a glass bar for effective mixing. To reduce artificial influences and make comparisons, two parallel tests were simultaneously conducted in each experiment. In each parallel test, we filtrated the same volume of samples from a glass breaker. Nuclepore filters of 0.4 μm pore size (fullerene soot) and 0.2 μm pore size (goethite or hematite) were weighed before and after the filtrations. A blank filter was used to decrease uncertainties during the weighing process for the sample filters. Finally, all of the filters were fully dried in a dryer over 24 h.
The procedures for snow samples and fullerene soot/commercial iron oxides are pretty close. The only difference is that most of the snow samples were filtrated through a 0.4 μm Nuclepore filter at temporary labs during snow surveys to prevent the losses of ILAPs due to snow melting in plastic bags. Details have also been reported in previous studies [16,19].
2.3. Spectrophotometric Analysis
2.3.1. MAC and AAE Calculations for Goethite and Hematite
Like many filter-based measurements, such as the Particle Soot Absorption Photometer (PSAP), Aethalometer, Thermal/Optical Carbon Analyzer, etc., the ISSW instrument is commonly used to assess light absorption of ILAPs based on Mie theory. It measures the attenuation (ATN) of a diffusing light field crossing the deposition spot. The ATN is defined as
in which I is the intensity of the light after crossing the particle-loaded filter, and is the signal when the light passes the blank filter.
Similar to the Aethalometer, of specific particles on the filter measured by the ISSW instrument can be calculated as follows [44]:
where L (µg·cm−2) is filter loading of particles deposited on the filter.
Filter-based measurements of light absorption show some responses to multiple absorption and scattering by particles [41]. Weingartner et al. [45] used two empirical factors, C and R (ATN), to convert Aethalometer attenuation measurements to “real” aerosol absorption coefficients. Subsequently, the factors were used to correct the results of Thermal/Optical Carbon Analyzer [44]. Bond et al. [41] presented a method for correcting artifacts in PSAPs:
where K1 and K2 are constants and MSC (unit in m2·g−1) is the mass scattering coefficient of particles deposited on the filter. Alfaro et al. [46] applied Equation (3) to the Aethalometer and calculated the MAC of pure dust samples, which are characterized by high single scattering albedo (SSA) aerosol and quite different from BC. Because we cannot directly derive the MSC, using SSA = MSC/(MSC + MAC), we can transform Equation (3) into the following formula:
where , for convenience below.
K1 and K2 values have been experimentally determined by Bond et al. [41] and for the intercomparison between three filter-based measurements (PSAP, Integrating Plate (IP) and the Hybrid Integrating Plate System (HIPS)). Based on the similar principles between IP and ISSW [22,40,47,48], we adopted values of 0.09 and 1.23 for K1 and K2, respectively, at 550 nm from Bond et al. [41].
Sokolik and Toon [31] illustrated that the SSA for hematite is approximately 0.6 at wavelengths less than 600 nm and shows weak dependence on particle size, ray type and wavelength. Bedidi and Cervelle [49] computed the light scattering albedo of spherical particles with goethite-like refractive indexes. Their study indicated that the SSA of goethite-like particles having diameters exceeding 1 μm is nearly constant (0.60) over the entire spectral range (400 nm to 700 nm). Therefore, we selected 0.6 for the SSAs of both hematite and goethite in our study. The SSA of freshly generated BC has been measured in the range from 0.10 to 0.28 [3]. In this study, we used 0.20 for the SSA of BC, which represents the middle value of this range.
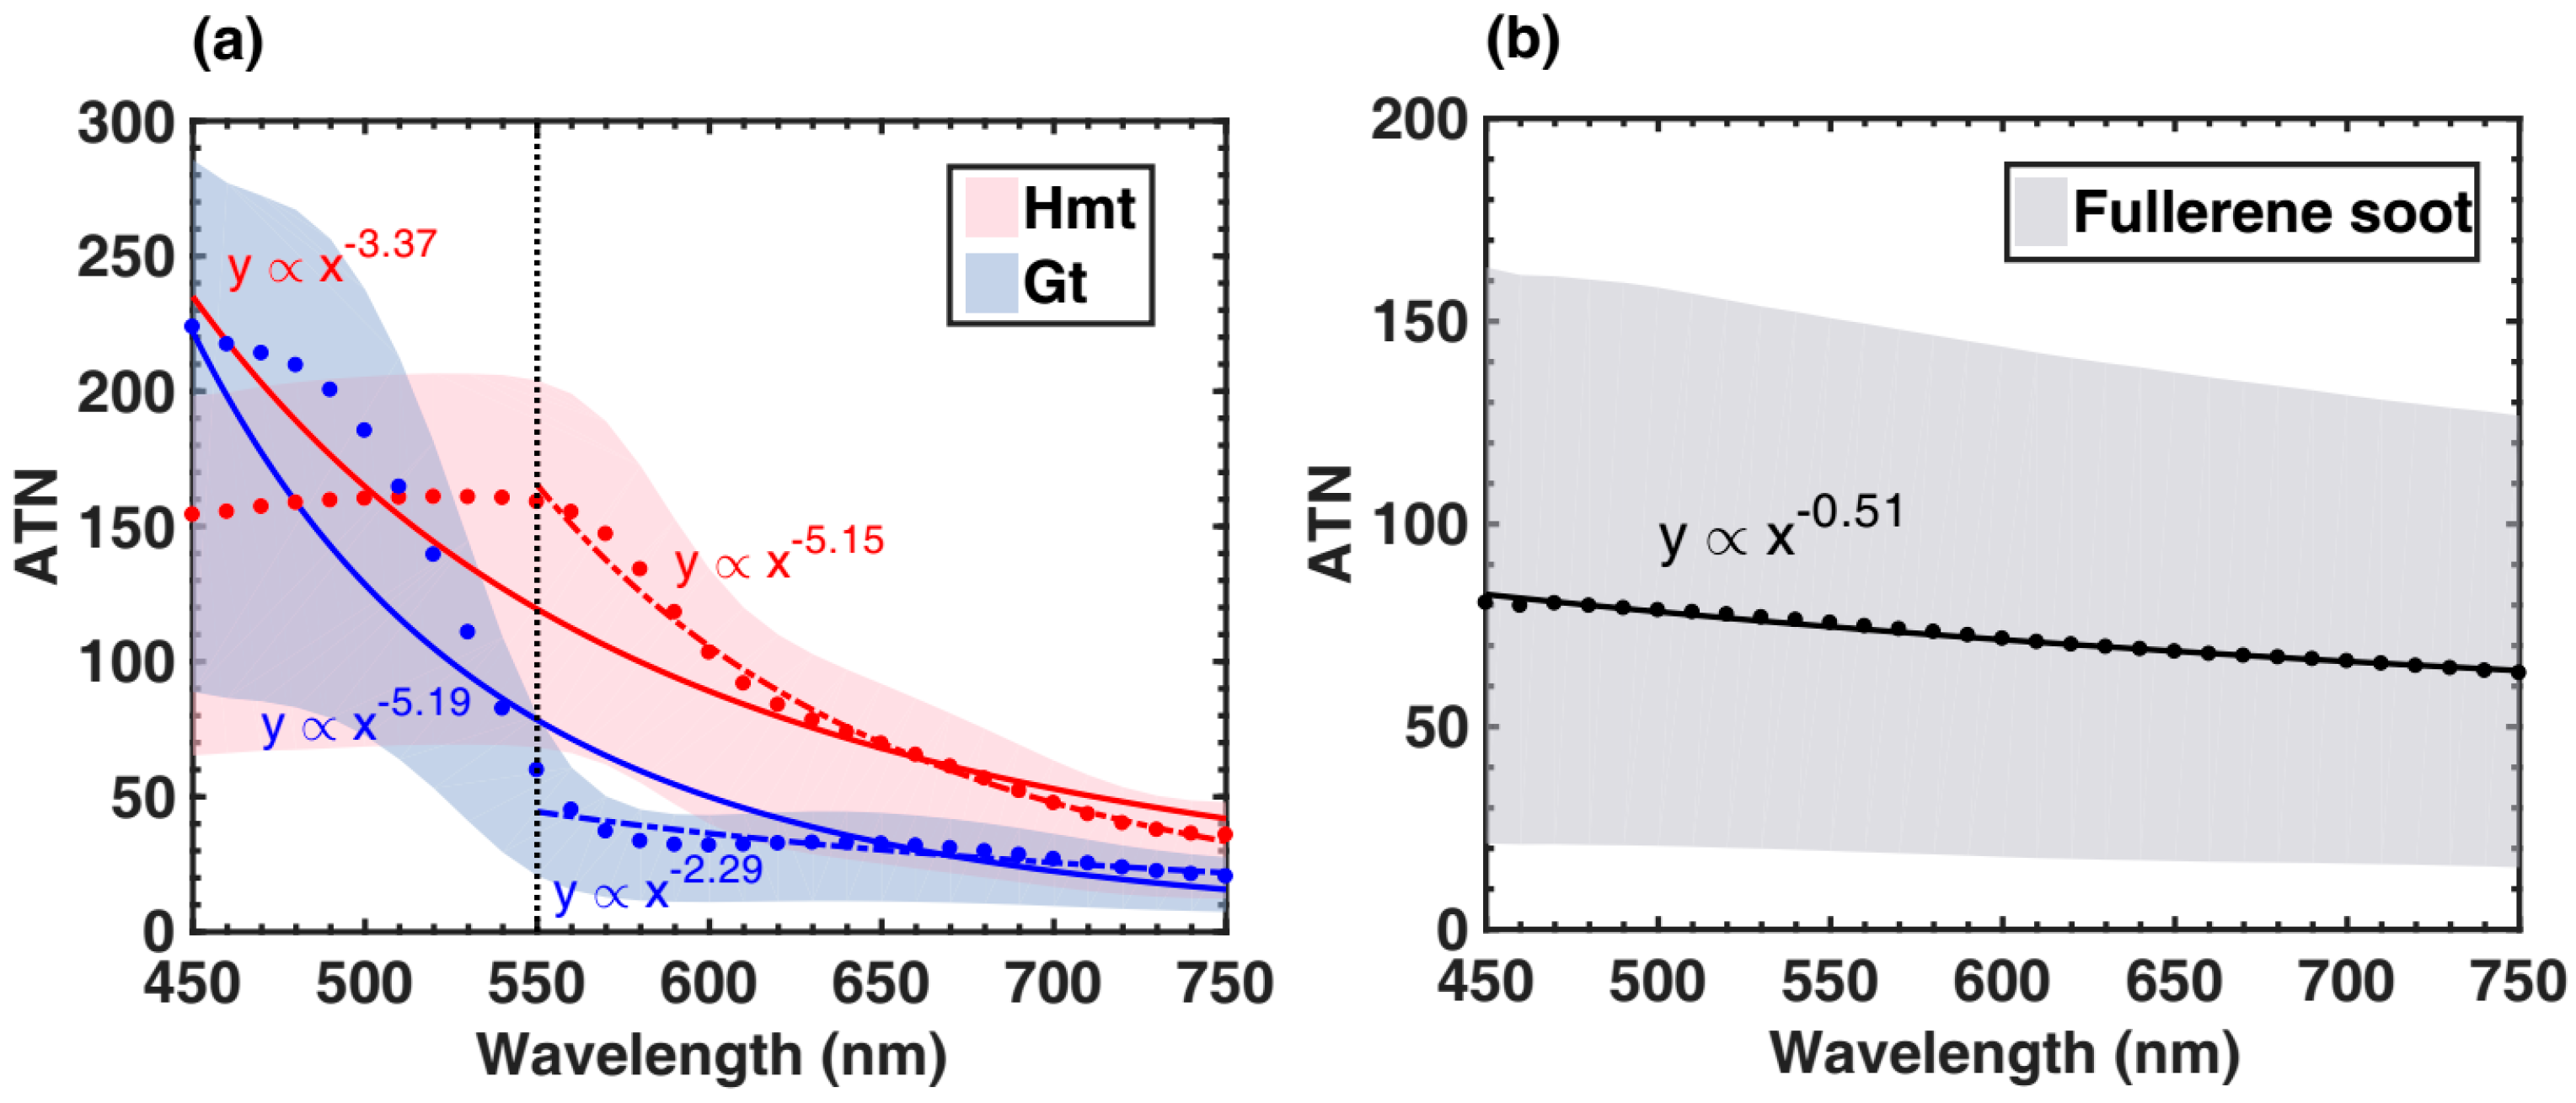
To analyze the wavelength dependence of pure particle samples, we measured the AAEs of goethite, hematite and fullerene soot using power exponent fitting from 450 nm to 750 nm. However, there were some problems in the light absorption spectrum of goethite and hematite within the entire wavelength band. Therefore, only the AAEs of goethite and hematite from 550 nm to 750 nm were used. These issues will be fully discussed in Section 3.2.
2.3.2. Re-Calculating the Light Absorption of BC, OC and Iron Oxides
Based on the measured absorption spectrum, we computed the absorption Ångström exponent of the snow samples, , which describes the absorption wavelength dependence of all the ILAPs on the filters. The exponent is calculated from the following formula:
where the values of , and are 525, 450 and 600 nm, respectively. is the absorption optical depth (AOD) for all ILAPs on the filter.
To separate the absorption contribution from BC and non-BC components (e.g., OC and iron oxides), we used the differences in their absorption Ångström exponents following Grenfell et al. [40], which was also applied in Doherty et al. [19] and Wang et al. [16] for the analysis of Arctic snow and Northern China snow samples, respectively. The absorption Ångström exponent of all ILAPs on a filter () can be described as a linear combination of the exponent for the BC () and non-BC () components weighted by the light absorption fraction of the BC () and non-BC () absorbers using a Taylor series expansion [40]:
where . Therefore, we can calculate () using Equation (S3) in the supplementary material if , and are known. Then using Equation (S4) and Equation (S5), can be derived. In this study, = 1.1 was used, which is a feasible value for the absorption Ångström exponent of externally mixed BC [3]. The value of depends on the content of non-BC ILAPs. The non-BC absorbers are thought to be dominated by iron oxides and organic carbon in the seasonal snow of China [16]. In this study, was assumed to be 3.0 [16]. can vary greatly due to various mix of soil organics and combustion brown carbon from different regions. Some studies have focused on the AAE of organic aerosols, including brown carbon, biomass burning organics and humic-like substance (HULIS) [14,50,51,52,53,54,55]. Clarke et al. [14] showed that the mass absorption efficiency of refractory OC is approximately 0.63 m2·g−1 at 470 nm and 0.09 m2·g−1 at 530 nm based on a field experiment in northern America. Their results indicated a very high AAE, i.e., approximately 16, at such a short wavelength band. Values in other studies have ranged from approximately 3 to 7, depending on the burning material, burning temperature and composition [16]. Following Wang et al. [16], we selected the value of 6 for , which is between the value of 5 used for combustion organics by Doherty et al. [19] in analyzing Arctic snow samples and the higher values of Å (approximately 6–7) for HULIS [54].
Based on the optical analysis for the ILAPs in snow samples, we would like to know whether at every site could be replaced by an average value that is representative of a certain area. If feasible, there is no need for chemical analyses to obtain the iron concentration, making the method much easier and more effective.
After analyzing the data from the two field campaigns, we grouped the sample sites into several regions, as shown in Figure 1. We used the regional average of the non-BC Ångström exponent () instead of the original non-BC Ångström exponent () to recalculate the BC loading for selected sites. When the BC loadings were already known, we calculated the OC and iron oxides AODs and loadings using the following equation:
where the values of , and were chosen to be 6.3 m2·g−1, 0.3 m2·g−1 and 0.9 m2·g−1 at 550 nm, separately, which followed Wang et al. [16]. Using the assumed mass absorption coefficients for BC, OC, and Fe in Equation (7) at the wavelengths of 450 and 600 nm, the mass loadings of OC and Fe could be estimated.
3. Results and Discussion
3.1. MACs of Fullerene Soot and Iron Oxides
The MACs of ILAPs measured in our study are shown in Figure 2 and Table 1. Linear regression equations and correlation coefficients of regressions (R) are also given in Figure 2. The MACs of fullerene soot, hematite and goethite are 6.40 ± 0.42 m2·g−1, 0.97 ± 0.02 m2·g−1 and 0.43 ± 0.01 m2·g−1, respectively, at 550 nm. The measured MAC of fullerene soot is consistent with the assumed used in the optical method (6.3 m2·g−1 at 550 nm) in this study. Some previous studies have measured diesel particle MACs of 7.3, 7.4 and 8.3 m2·g−1 using an integrating plate approach [56,57,58]. In addition, Ballach et al. [59] obtained a value of 6.5 m2·g−1 at 550 nm for pure black carbon using an integrating sphere, and Clarke and Noone [22] reported a range of 6.6 to 8.0 m2·g−1 at 550 nm also for MAC of standard soot particles. These two studies show good agreement with the results of our study, which also indicates that it is suitable to use the K1 and K2 correction factors for IP in this study.
However, limited studies have reported the MACs of goethite and hematite particles. Bedidi and Cervelle [49] simulated the variations of scattering and absorption properties for single spherical mineral particles using goethite- and hematite-like complex refractive indexes as a function of wavelength and particle diameter. For particles with a hematite refractive index and intermediate diameters (0.2 μm to 1.0 μm), the absorption efficiency at 550 nm ranges from approximately 1.0 to 1.2. These results are consistent with our findings. For particles with a diameter of 0.2 μm, the absorption efficiency has been found to be approximately 0.6 at 550 nm, which is slightly higher than the value of 0.43 m2·g−1 in our study. Utry et al. [60] determined the MACs of various mineral dust components using a multi-wavelength photoacoustic instrument system at 1064, 532, 355 and 266 nm. They presented the aerosol-phase MAC spectra of the most abundant mineralogical dust components. The MAC of hematite was found to be 0.54 ± 0.1 m2·g−1 at 532 nm, which is approximately half of our result. The possible reasons for this difference are as follows: (1) The photoacoustic instrument and ISSW spectrometer have different methodological theories. The photoacoustic method is based on the absorption of periodically modulated light and the subsequent non-radiative relaxation of excited aerosol particles [60] and is a filter-free measurement. Alternatively, the ISSW spectrometer is a filter-based instrument and estimates the absorption of aerosols according to light attenuation through blank and loaded filters; (2) The study used different particle grain sizes for the sampled hematite. It is known that the aerosol optical properties are significantly influenced by particle diameters. For instance, volume absorption cross-sections of BC particles range from approximately 1 to 9 m2·cm−3 depending on the particle diameters [61].
3.2. AAEs of Fullerene Soot and Iron Oxides
The AAEs for the measured particles are also shown in Table 1. Measurement studies have shown that externally mixed BC dominates absorption when the AAE is close to 1 [3]. However, sufficiently small BC particles (e.g., diameter of 10 nm) are required for AAE to be 1, and some ambient measurements have provided evidence that large BC cores can result in AAEs of less than 1 [62,63,64]. For example, Bahadur et al. [64] observed a relatively low AAE for ambient BC, i.e., 0.55 ± 0.24, between 440 nm and 675 nm. Gyawali et al. [65] simulated the AAE variations depending on the BC core diameter. Their results showed that the AAE between 405 and 870 nm is approximately 1.11 for a BC particle diameter of 0.07 µm, decreasing toward zero for larger spheres, i.e., diameter of approximately 100 µm. In our study, the average AAE of 0.54 ± 0.06 for fullerene soot is consistent with the results of Bahadur et al. [64] and within the possible range of −0.24 to 1.11 depending on the diameters from the theoretical calculations [65].
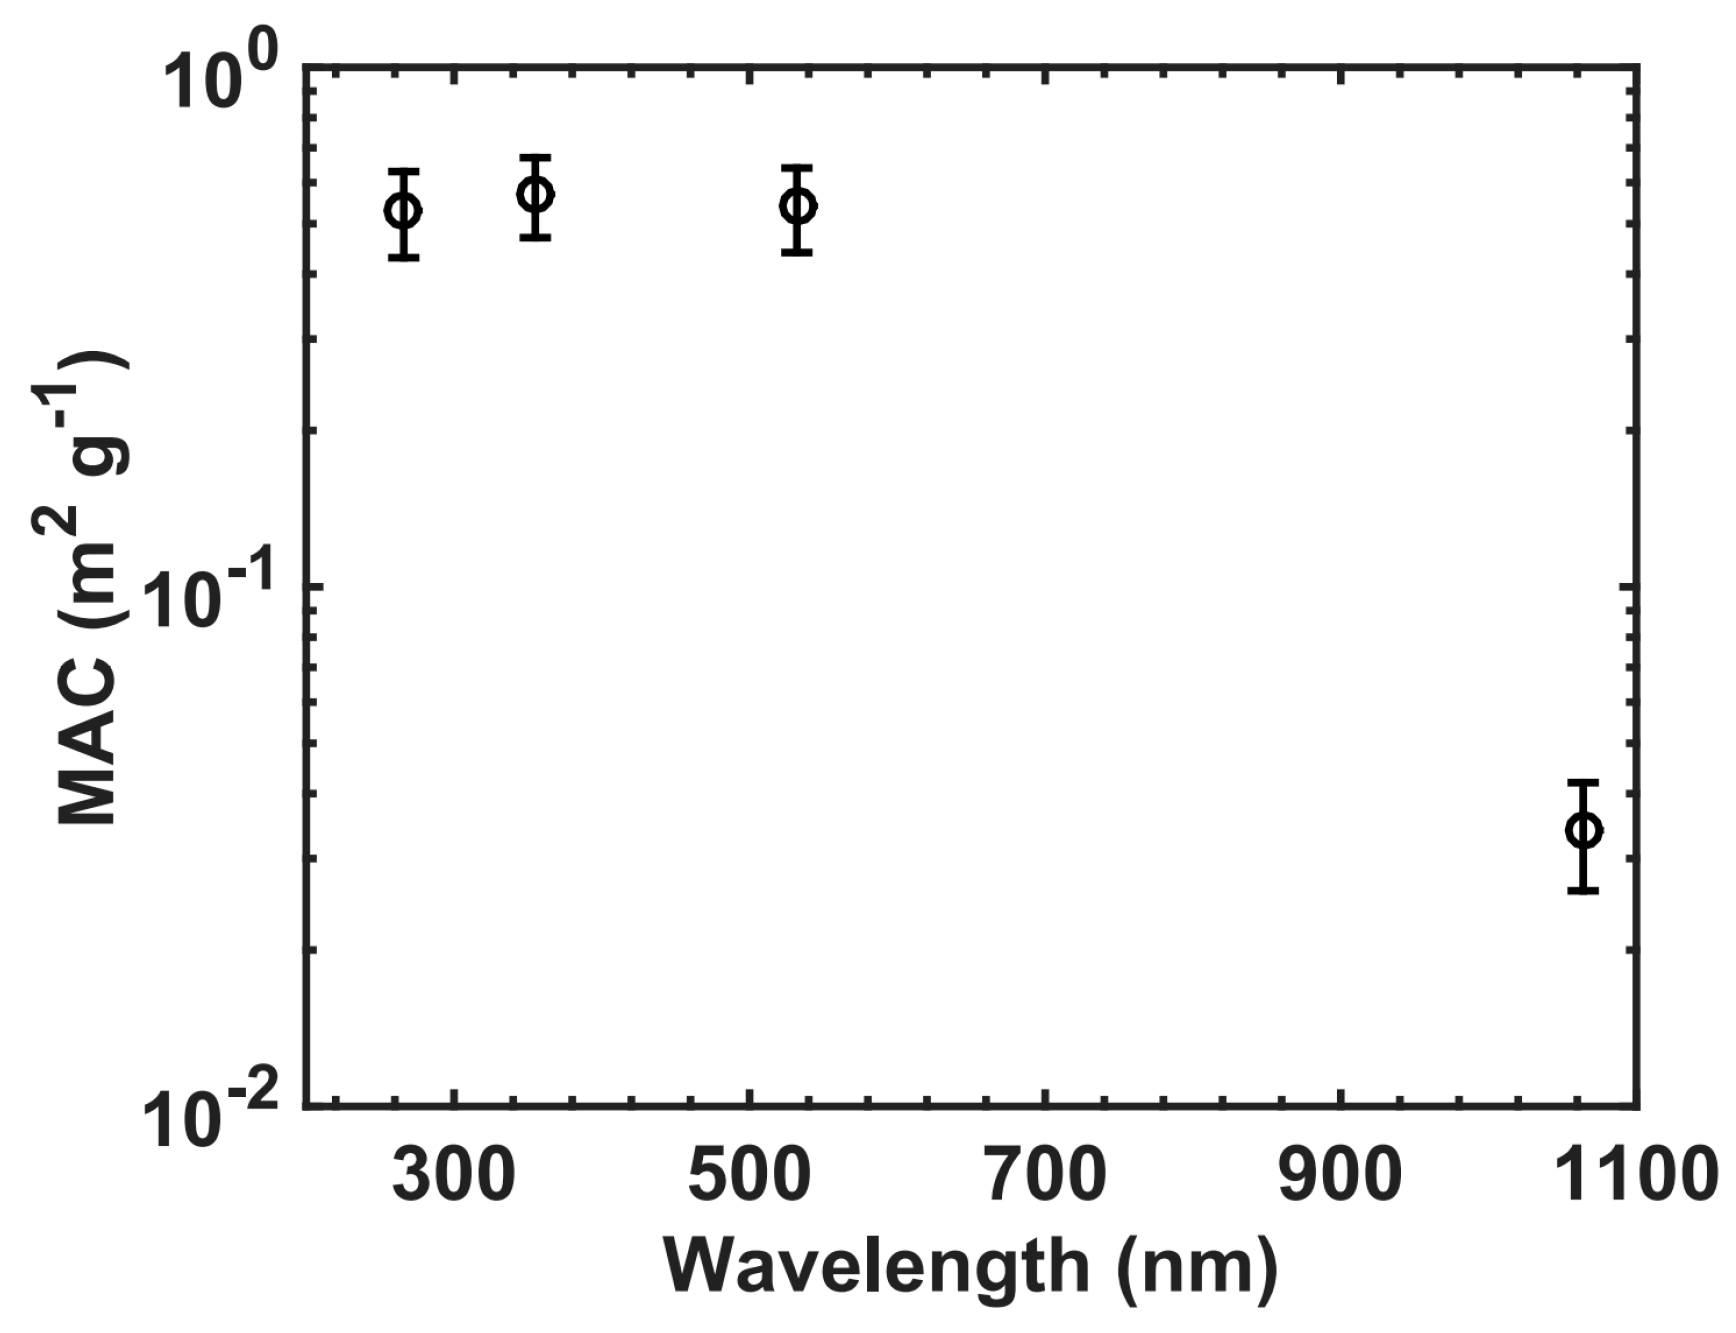
Alfaro et al. [46] reported that the average AAE of mineral dust in the Gobi (China), Sahara (Tunisia) and Sahel (Niger) is approximately 2.74. Moosmüller et al. [30] used ten bulk samples from desert and semi-arid regions and found that the AAEs range from 2.5 to 3.9 (average of 3.2). A dust sample from Morocco containing a detectable hematite mass fraction of 0.6% has been shown to exhibit an AAE of about 4.20 from 266 nm to 532 nm [66]. Yang et al. [52] calculated the wavelength dependence of dust absorption from 470 to 660 nm during a field campaign near Beijing and obtained an average AAE of 3.8. Although previous studies have reported AAE for ambient mineral dust in different regions, we note that few studies have focused on the AAEs of goethite and hematite. As shown in Table 1 and Figure 3, hematite exhibits an AAE of 5.53 ± 0.47 from 550 nm to 750 nm, while the absorption is nearly constant at shorter wavelengths (450 nm to 550 nm). In general, the AAE is 3.67 ± 0.36 for 450 nm to 750 nm. On the contrary, goethite shows a weaker absorption wavelength dependence, with an AAE of 2.18 ± 0.16 from 550 nm to 750 nm, and light absorption increases sharply at shorter wavelengths; finally, the AAE becomes 5.30 ± 0.20 for 450 nm to 750 nm. However, the light absorption of goethite exceeds that of hematite at wavelengths shorter than approximately 510 nm. Coincidentally, a similar absorption spectrum for hematite was also discovered by Utry et al. [60]. As shown in Figure 4, the MAC of hematite increases from 1064 nm to 532 nm and then remains nearly constant. Similar trends for hematite light absorption were found in our study and Utry et al. [60], although further laboratory experiments are needed.
3.3. Comparison of Loading and Light Absorption Fraction of ILAPs
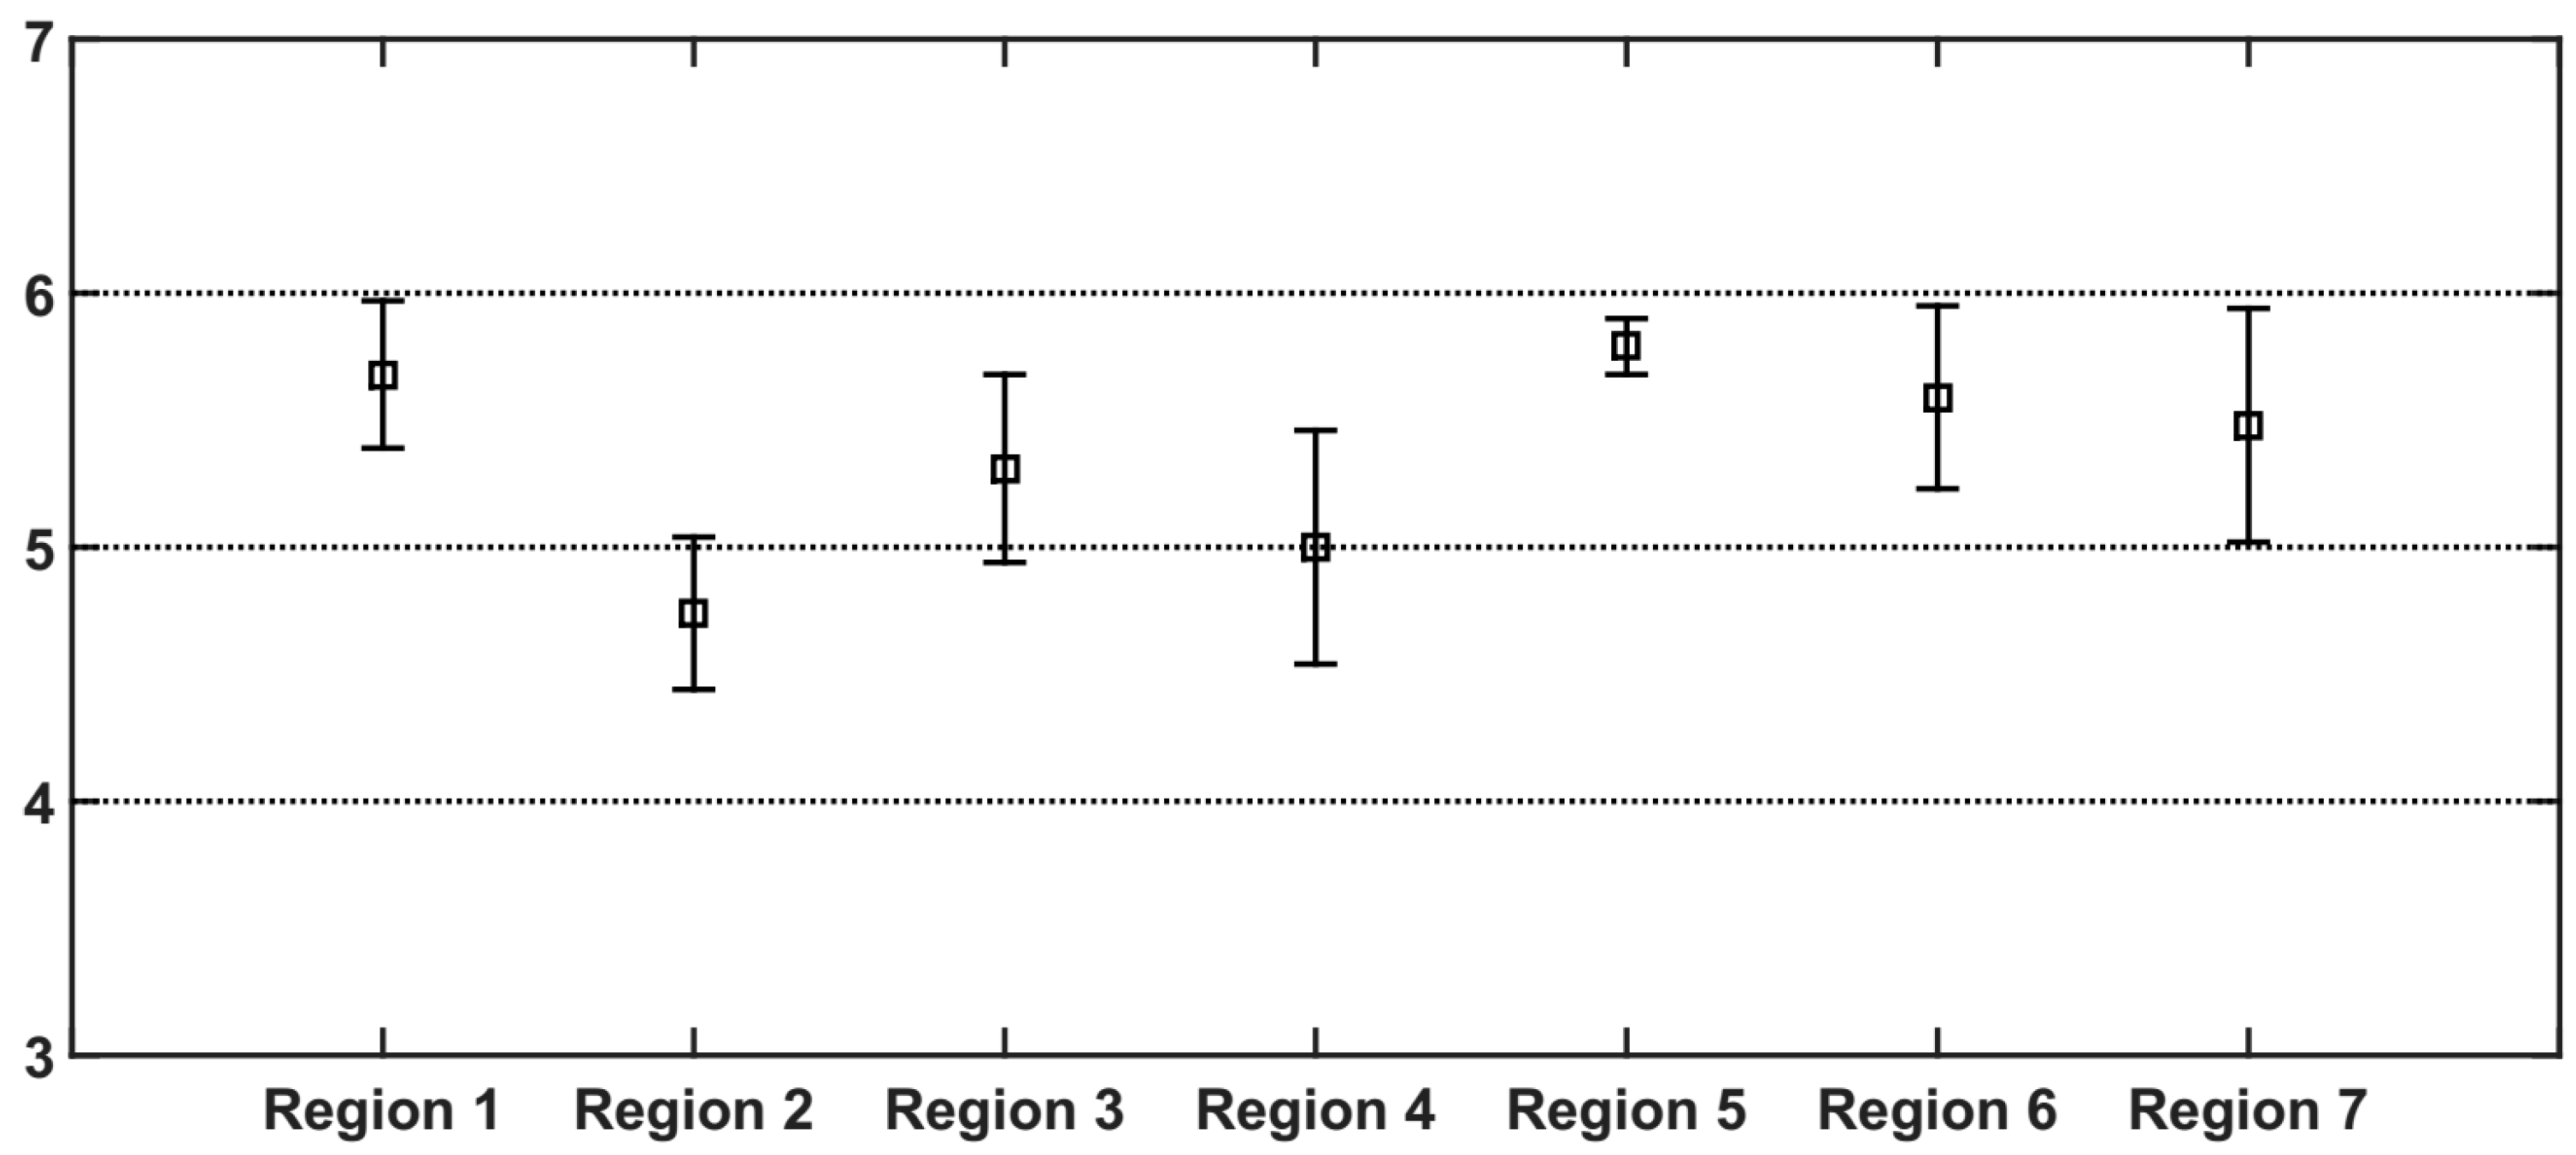
The purpose of this section is to assess a new method to calculate the mass loadings and light absorption fractions of ILAPs using the regionally average instead of the estimated values. First, we separated the snow sampling sites into several regions based on the occurrence of similar ILAP sources as reported by Pu et al. [67] and Wang et al. [16]. The regional averages of are shown in Figure 5. We note that the standard deviations in each region are calculated by using the datasets of all snow samples, which are widely representative for the regionally average absorption Ångström exponents of other light-absorbing impurities than BC. There is an obvious regional variation over Northern China. Region 2 has the smallest (4.7); this is the cleanest region in terms of ILAPs in snow, and the region is located at the northern border of China, which is near Siberia. In this region, BC dominates the particle light absorption, and the relative contributions to absorption by OC and Fe are roughly equal [16]. On the contrary, Region 5 has the largest (5.8); this area is located on the eastern edge of the Tibetan Plateau in Qinghai Province and is characterized by thin and patchy snow. In this region, OC dominates the absorption in seasonal snow, and the fractional contribution reaches approximately 70%. However, the light absorption fraction of Fe is quite small (approximately 5%) [67]. in the other five regions varies between the values of Region 2 and Region 5. Subsequently, we replaced the estimated by the regionally average values to calculate the mass loadings and fractional light absorptions of BC, OC and Fe based on Equation (7). Here, we define the mass loadings () and light absorption fractions () derived by as the measured values. For those calculated using , they are defined as the calculated values and denoted as (loading) and (light absorption fraction), where the subscript i represents the different types of ILAPs (BC, OC or Fe).
3.3.1. Variations in the Loadings and Relative Absorption Fractions of BC and OC
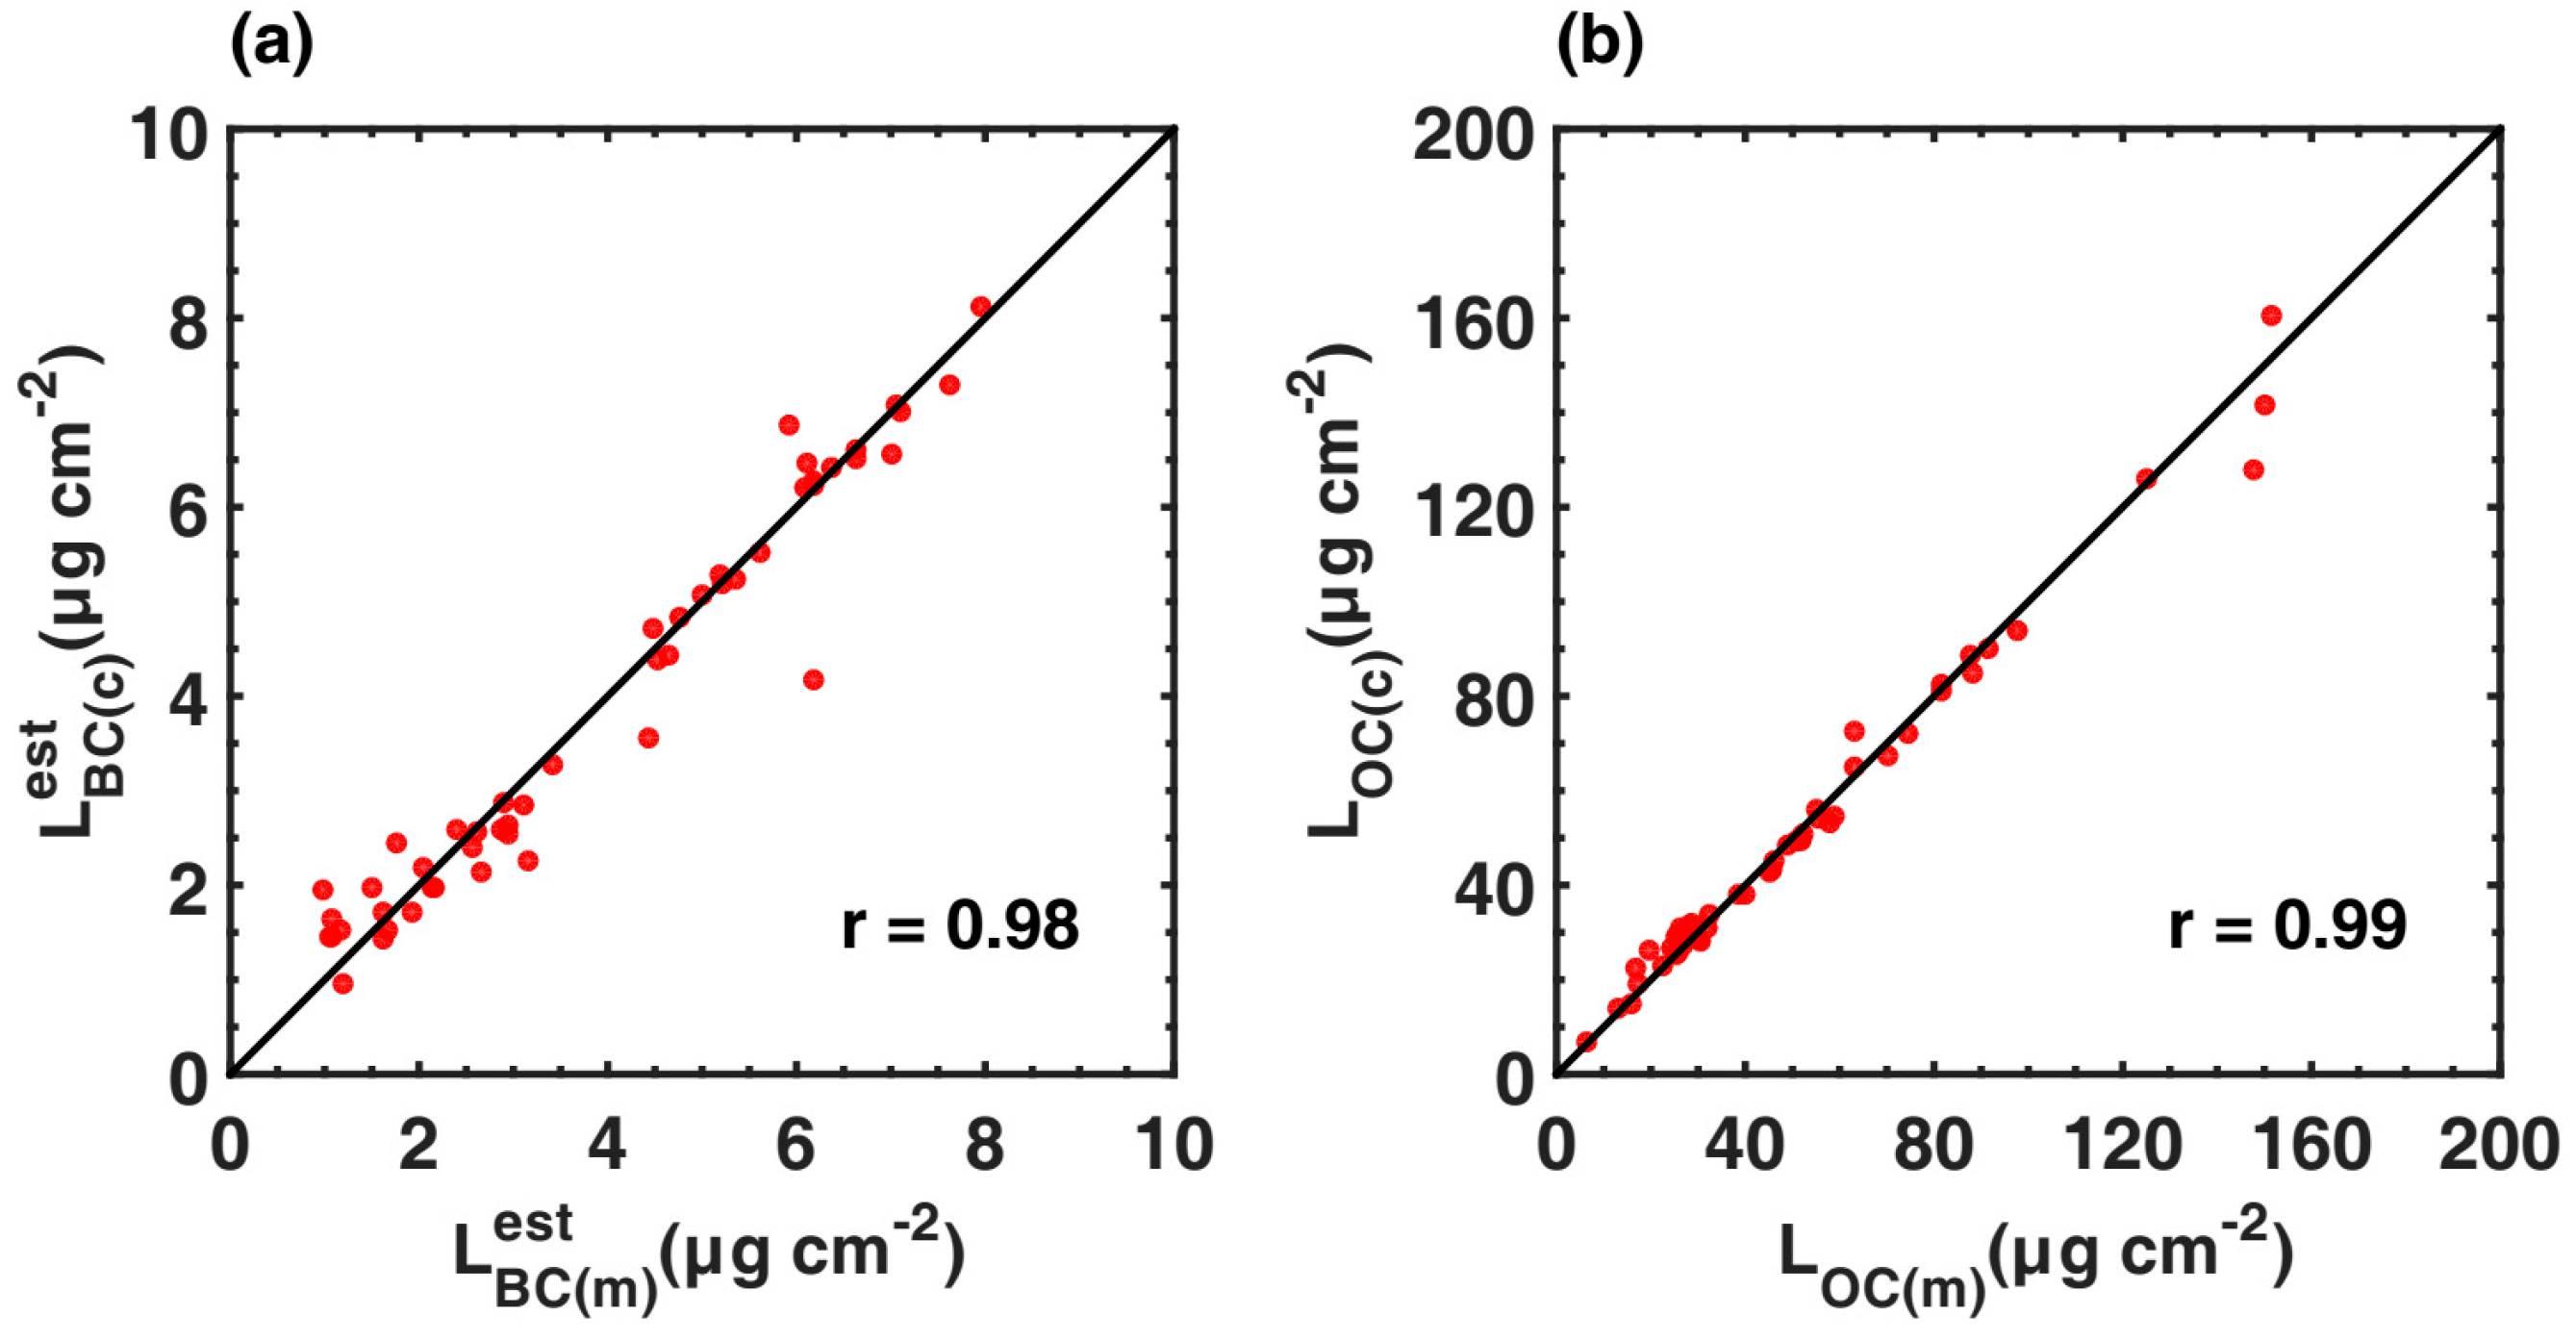
Figure 6 shows comparisons between (a) and and (b) and ; the linear correlation coefficients (r) are also shown. The statistical significance of r is at a confidence level >99%. Table 2 shows the relative biases of the loadings (or fractional absorptions) as a result of using the regionally average instead of the estimated values; the relative biases are denoted as , where the subscript i represents different types of ILAPs (BC, OC or Fe). Due to the definitions of relative bias and fractional absorption, the values of calculated from the loading and fractional absorption are similar at each site, which is also shown in Table 3. As shown in Figure 6a, and are in good agreement (r = 0.98). In Table 2, also shows low value of the 50th percentile (median), which is only 6.29%. In Figure 6b, shows even smaller variation, with a high correlation coefficient of 0.99 and median value of that is only 4.27%, which is smaller than the median . Since the measured and calculated loadings of BC and OC show good correlation, the new method is reasonable and reliable for calculating the BC and OC loadings in Northern China snow.
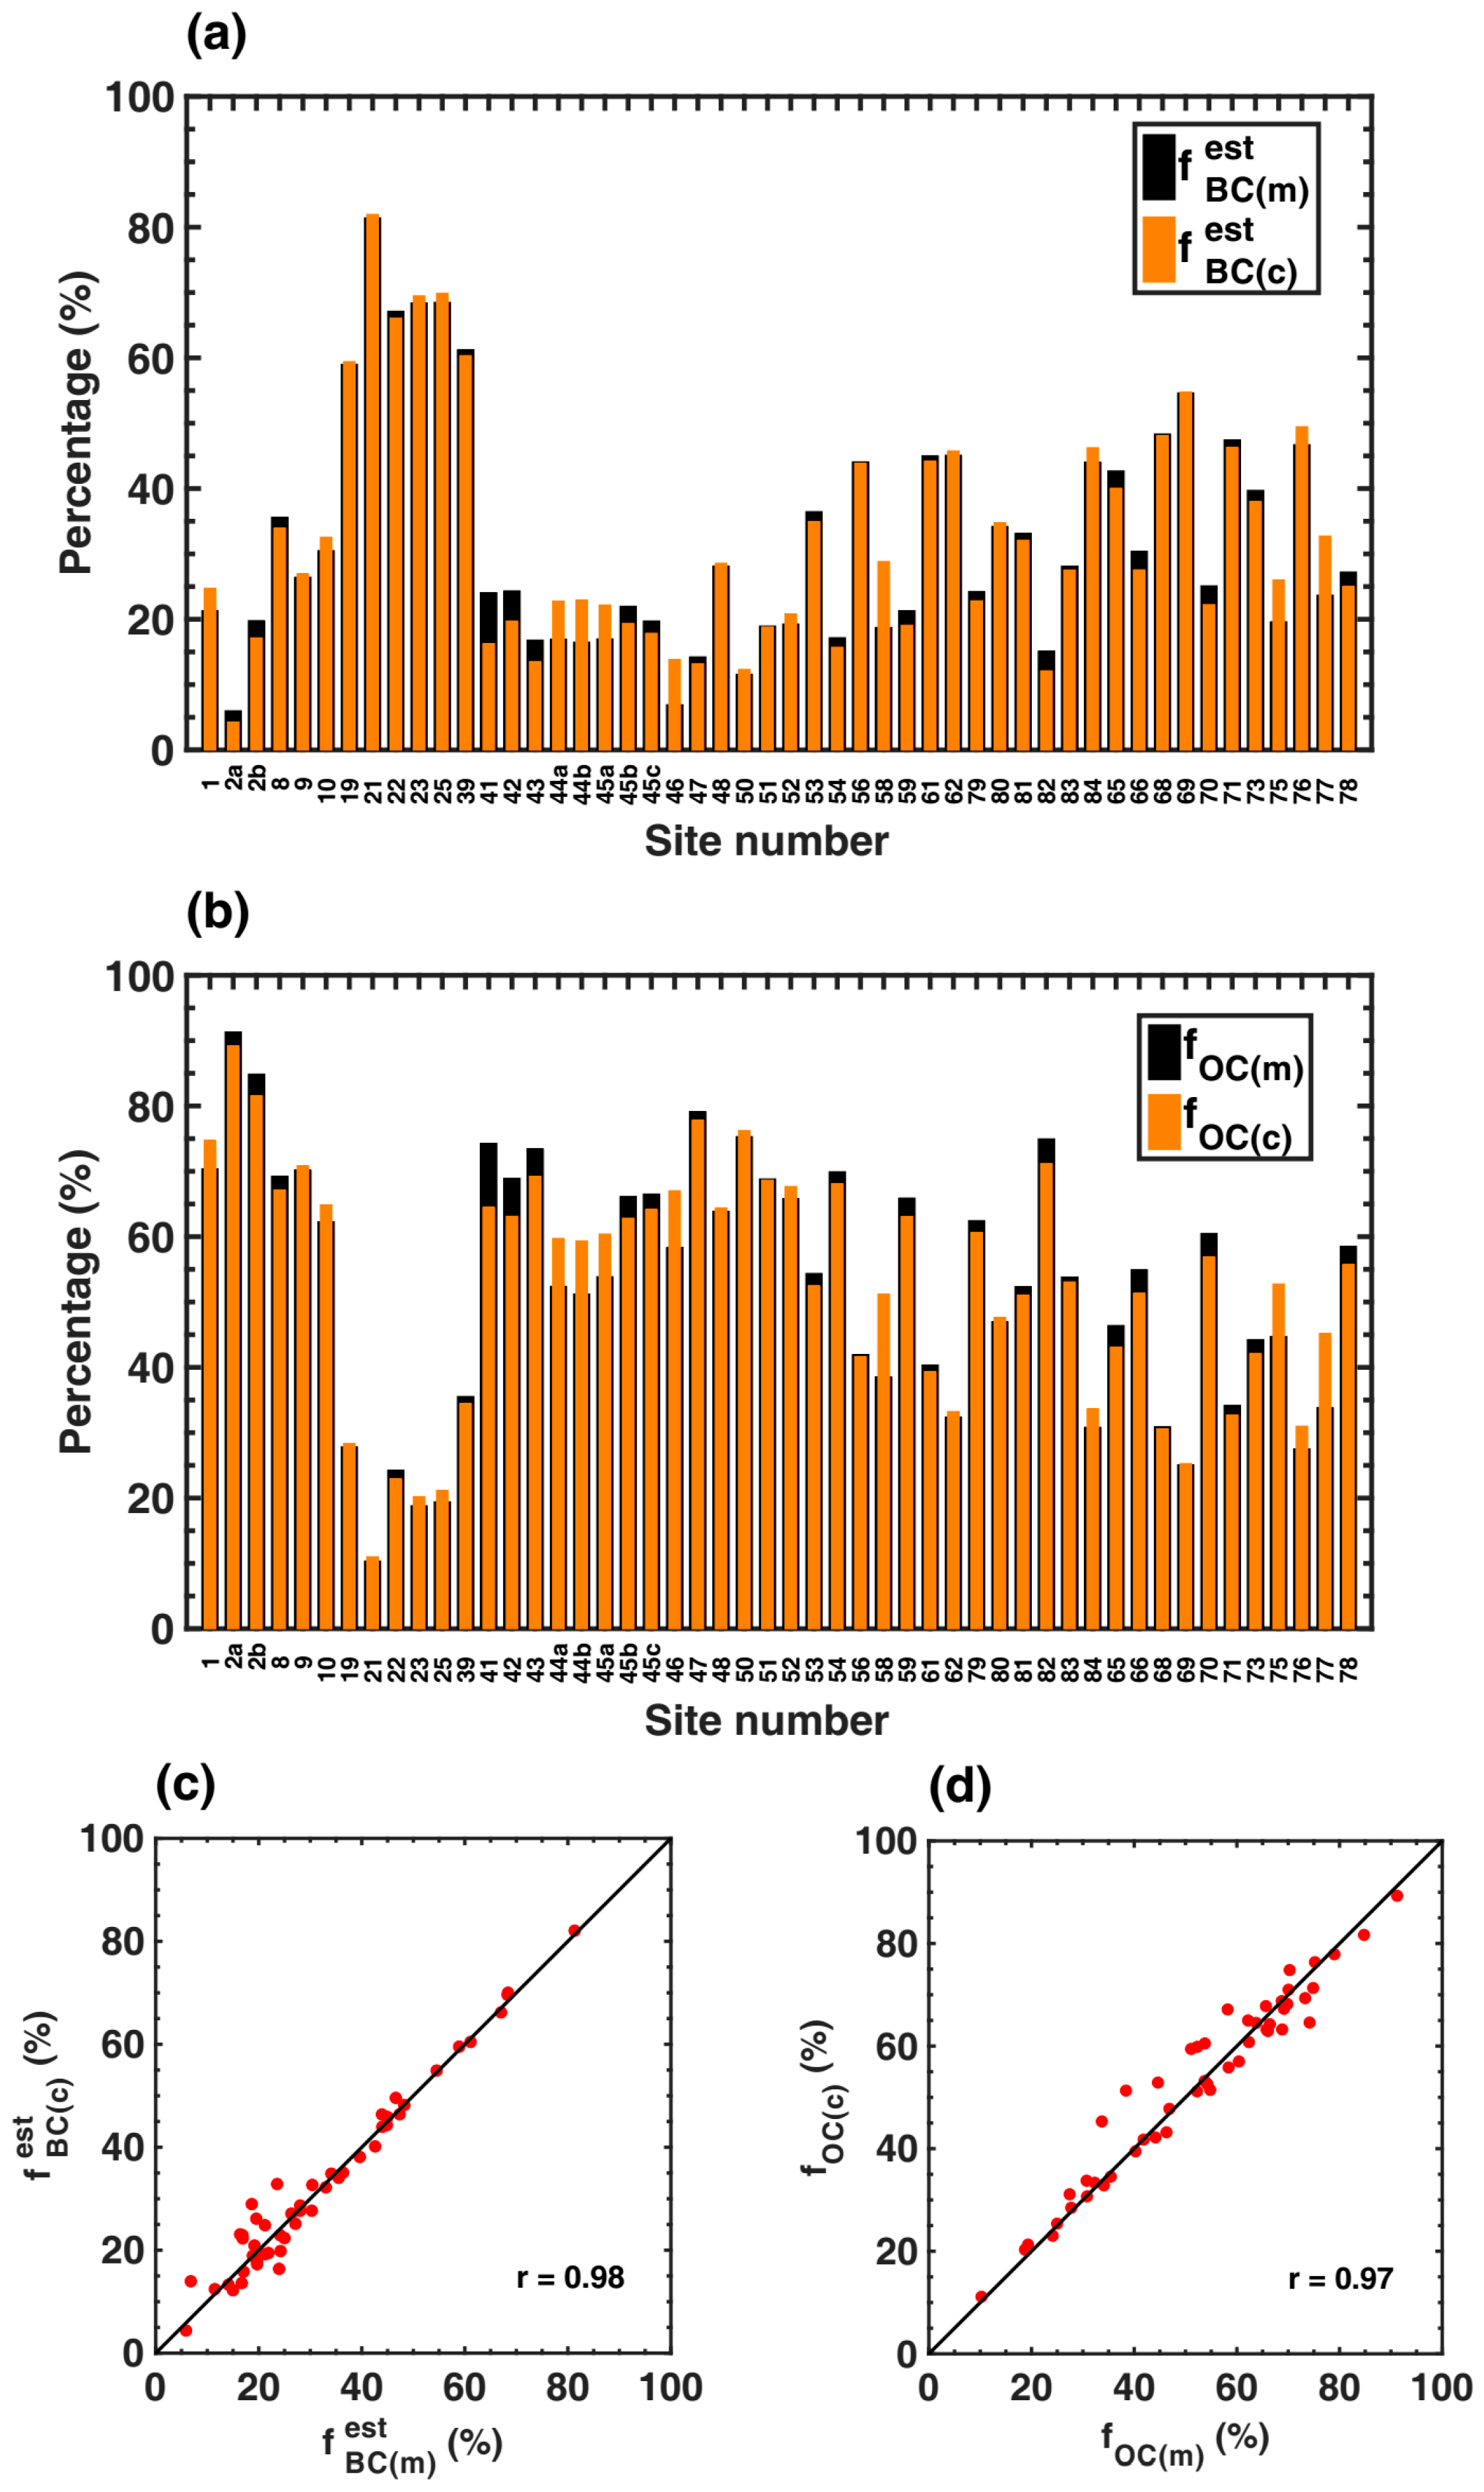
Given that ILAPs deposited on snow and ice can affect the climate by absorbing solar radiation, we are more interested in the light absorption rather than their amounts. Figure 7a shows the differences between (black) and (orange) at different sites (the relative light absorption contributions were measured at 450 nm, and the same below). The variations between the black and orange bars are not remarkable. However, there are still apparent differences at some sites. For instance, overestimated by approximately 100% at site 46, and was overestimated by approximately 53% at site 58, although such sites were limited. Figure 7c shows comparisons between and . The variation of is small, with a correlation coefficient of 0.98 between the measured and calculated BC absorption fractions. Correspondingly, the variations of at different sites (Figure 7b) and versus (Figure 7d) are also shown. At sites 58 and 77, was overestimated by 33% and 34% and the other sites had even lower biases. A good correlation (r = 0.97) appeared between and , which was slightly lower than that of . The measured and calculated loadings of BC and OC generally exhibit high consistency, and the relative absorption distributions of BC and OC at selected sites only changed slightly using the new method. Hence, using to replace is practicable when calculating mass loadings and light absorptions of BC and OC in Northern China seasonal snow.
In Table 2, the percentiles of are also shown, which indicates that the relative biases of iron have the largest variations among the studied ILAPs in snow. The median value of (33.01%) is more than five times and eight times above and , respectively. In the next section, variations in the loading and relative absorption fractions of iron are discussed in detail based on sensitivity experiments that account for possible biases in the mass absorption coefficient and absorption Ångström exponents of ILAPs.
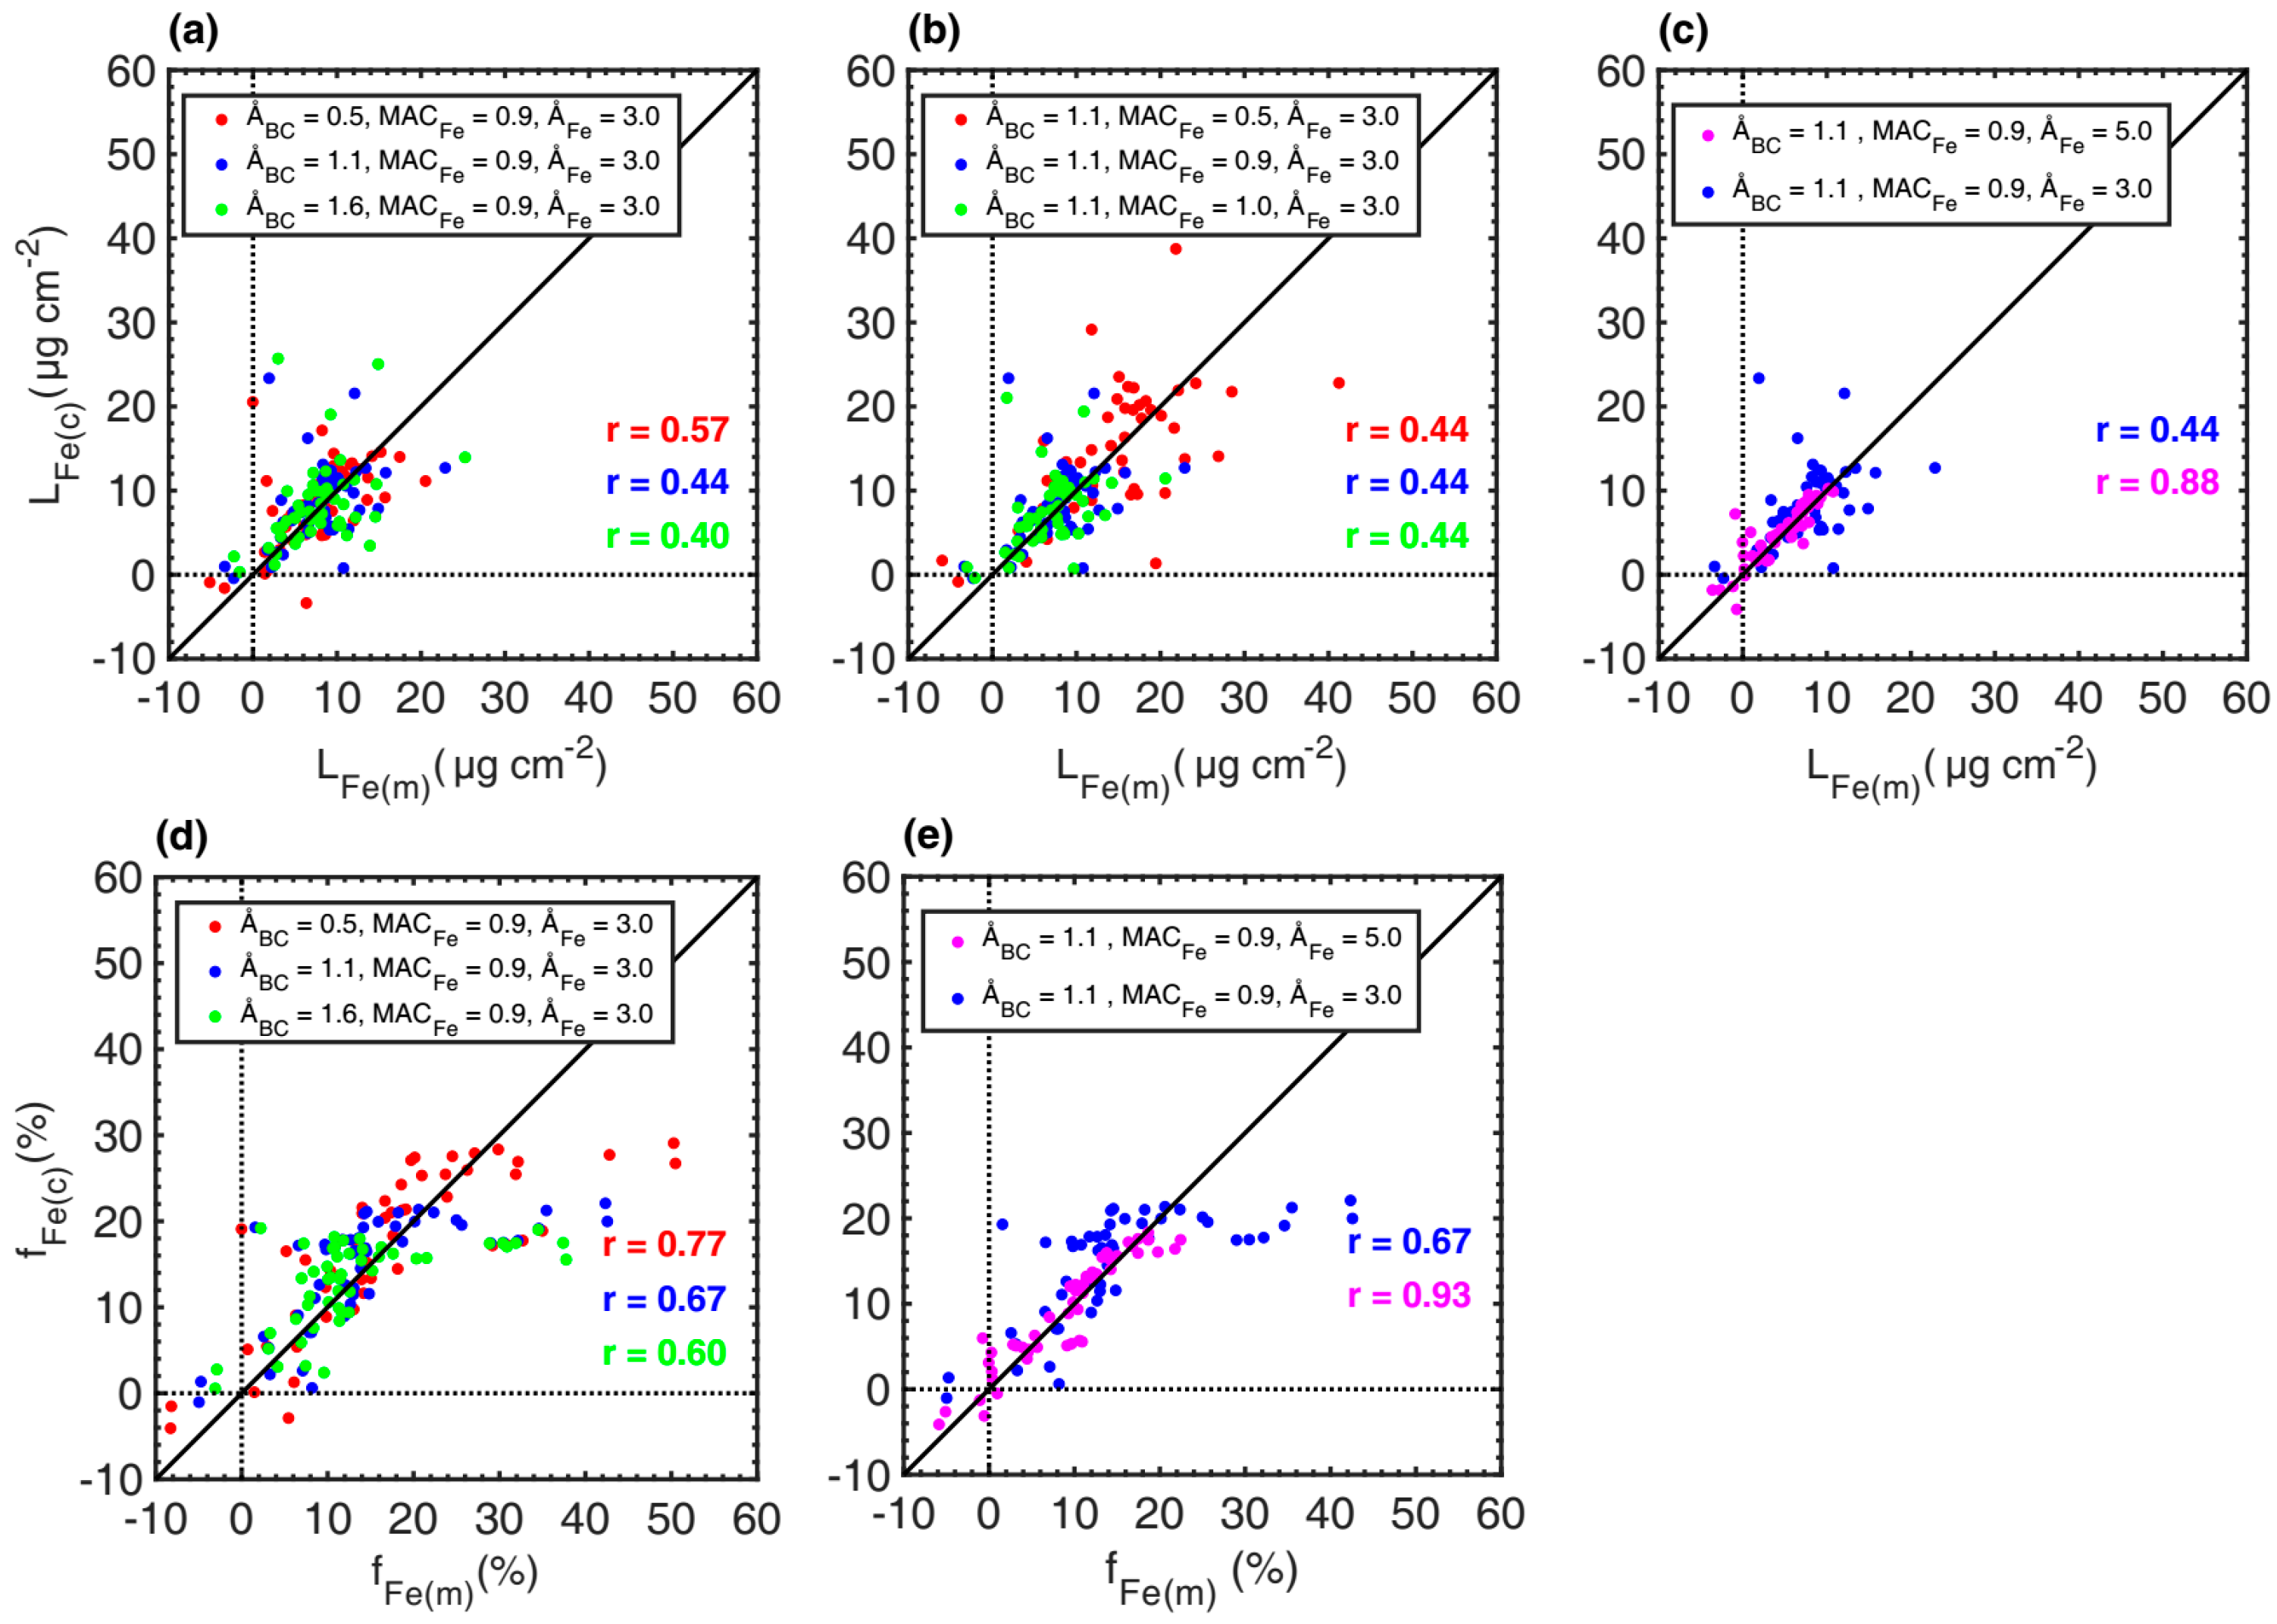
3.3.2. Sensitivities of the Loading and Relative Absorption Fraction of Iron
As mentioned above, the largest biases are due to iron oxides when calculating the mass loadings and fractional light absorptions of ILAPs. To calculate the mass loadings of iron, we estimated the MAC of iron to be 0.9 m2·g−1 at 550 nm by assuming that all iron oxides are goethite based on Wang et al. [16]. However, there are respectable amounts of hematite in Northern China snow. The higher MAC of hematite results in a lower derived iron loading. In our experiments, 0.43 and 0.97 m2·g−1 were derived as the MACs of goethite and hematite, respectively, at 550 nm; thus, the values of 0.4, 0.9 and 1.0 were used in the sensitivity tests. To calculate the non-BC absorption Ångström exponents of the ILAP samples, we assumed that = 3.0 for goethite, although the of hematite was 5.3 from 550 nm to 750 nm based on our results. To calculate the light absorption fraction of BC, we assumed a value of 1.1 for , which is an estimated value for atmospheric soot particles [3]. In this study, the measured was lower (i.e., 0.54), and the theoretical upper bound possible for can be as high as 1.6 according to Lack and Cappa [62]. Hence, the values of 0.5, 1.1 and 1.6 for were selected for the sensitivity test.
The comparison between and and between and in different cases denoted in the legend are shown in Figure 8, and the percentiles of these six cases are listed in Table 3. The blue dots in Figure 8 were derived under the conditions of , and ; for the convenience of discussion, this will be called the “base case” hereinafter. Other cases are shown in different colors. The linear correlation coefficients (r) of different cases are also shown in the figure, and the statistical significance of the correlation coefficients are all at a confidence level >99%.
For Figure 8a, and were held constant, and we replaced with 0.5 and 1.6. When is 0.5, the correlation coefficient is 0.57, and when is 1.6, the calculated loadings exhibit poorer agreement with the measured values (r = 0.40). However, these correlation coefficients change relatively little when compared with the “base case” (r = 0.44). For varying from 0.5 to 1.6, the distributions of are roughly consistent, as shown in Table 3. Then, we replaced the MAC of Fe with 0.5 and 1.0 and held the other parameters constant (Figure 8b). When is larger (smaller) than 0.9, and are smaller (larger) than those in the “base case”. However, the different MACs of Fe do not change r and between and . This finding indicates that has no effects on the uncertainties of iron loadings in the new method. As shown in Figure 8c, we changed to 5.0 and held the other parameters fixed. The linear coefficient between and improves dramatically to 0.88; much lower (14.40% in median) than that in the “base case” (33.01% in median) appears. Variations between the measured and calculated light absorption fraction of iron are also shown. In Figure 8d, when is 0.5 and 1.6, the correlation coefficients are 0.77 and 0.60 between and , respectively. Compared to the r value of 0.67 in the “base case”, these changes are small. In Figure 8e, using of 5.0, the pattern changes significantly, i.e., and are much more relevant (r = 0.93) than in the “base case”. remains the same regardless of whether = 0.5 or = 1.0; thus, these results are not shown in Figure 8.
We found that results in the largest variations in and , while changes the correlation between the measured and calculated values slightly. has no effect on the uncertainties of iron loadings in the new method. Therefore, we suspect that the underestimation of is responsible for the uncertainties when calculating iron mass loadings and light absorption fractions.
We note that most of the values agree well in Figure 8, although there are still some negative values. The reason can be concluded as the lowest relative light absorption contribution of Fe compared with BC and OC. Therefore, a slight change in the BC loading may lead to a negative AOD of iron according to Equation (7) and a negative Fe loading. However, we found that even when using the original non-BC absorption Ångström exponents for the snow samples, 4% of the values remained negative, which is comparable with the results calculated from . Therefore, we posit that the new method of using ISSW instruments to separate the light absorption of ILAPs in snow should be effective and accurate.
4. Conclusions
The MACs and AAEs of goethite, hematite and fullerene soot were measured using an ISSW spectrometer. To correct for light scattering and multiple absorption artifacts, we adopted the correction method from Bond et al. [41]. The MACs of fullerene soot, hematite and goethite were 6.40 ± 0.42, 0.97 ± 0.02 and 0.43 ± 0.01 m2·g−1, respectively, at 550 nm after correction. The AAE of fullerene soot was 0.54 ± 0.06 from 450 to 750 nm. The AAEs of goethite and hematite were approximately 2.18 ± 0.16 and 5.53 ± 0.47, respectively, from 550 nm to 750 nm. Within the shorter wavelengths (450 nm to 550 nm), the absorption of hematite became nearly constant, and the AAE decreased to 3.67 ± 0.36 from 450 nm to 750 nm. Moreover, the absorption of goethite increased sharply at short wavelengths, and the AAE approached 5.30 ± 0.20 over the entire wavelength band (450 nm to 750 nm).
We developed a new method to calculate mass loadings and light absorption fractions for ILAPs in Northern China snow using the average non-BC absorption Ångström exponents, which have regional characteristics, instead of estimated values. Comparisons between the measured and calculated values of , , , and all show good agreement; the correlation coefficients were found to be 0.98, 0.98, 0.99 and 0.97, respectively. The median relative biases of BC and OC were only 6.29% and 4.27%, respectively. However, high relative biases of Fe (median of 33.01%) were found. We note that exhibited a large variation when was changed within the assumed possible values; variations of affected slightly, whereas had no effect on .
We posit that the new method to calculate the mass loading and fractional light absorption of ILAPs is reliable. However, quantifying the light absorption by iron oxides still represents significant challenges. To improve the optical method, more accurate optical properties of ILAPs, especially the AAEs of iron oxides, are requested. Therefore, many more laboratory tests and field campaigns are needed.
Supplementary Materials
The following are available online at www.mdpi.com/2073-4433/8/4/63/s1.
Acknowledgments
This research was supported by the Foundation for Innovative Research Groups of the National Science Foundation of China (41521004), the National Science Foundation of China under Grants (41522505 and 41675065) and the Fundamental Research Funds for the Central Universities (lzujbky-2015-k01 and lzujbky-2016-k06).
Author Contributions
Yue Zhou and Xin Wang conceived and designed the experiments; Xueqin Wu performed the experiments; Yue Zhou analyzed the data and wrote this manuscript; Zhiyuan Cong and Guangming Wu contributed the experiment materials; Mingxia Ji designed the sensitivity tests and analyzed the results.
Conflicts of Interest
The authors declare no conflict of interest.
References
- IPCC. Climate Change 2013: The Physical Science Basis. Contribution of Working Group I to the Fifth Assessment Report of the Intergovernmental Panel on Climate Change; Cambridge University Press: Cambridge, UK; New York, NY, USA, 2013. [Google Scholar]
- Huang, J.P.; Minnis, P.; Lin, B.; Wang, T.H.; Yi, Y.H.; Hu, Y.X.; Sun-Mack, S.; Ayers, K. Possible influences of Asian dust aerosols on cloud properties and radiative forcing observed from MODIS and CERES. Geophys. Res. Lett. 2006, 33. [Google Scholar] [CrossRef]
- Bond, T.C.; Doherty, S.J.; Fahey, D.W.; Forster, P.M.; Berntsen, T.; DeAngelo, B.J.; Flanner, M.G.; Ghan, S.; Karcher, B.; Koch, D.; et al. Bounding the role of black carbon in the climate system: A scientific assessment. J. Geophys. Res. Atmos. 2013, 118, 5380–5552. [Google Scholar] [CrossRef]
- Yin, Y.; Wurzler, S.; Levin, Z.; Reisin, T.G. Interactions of mineral dust particles and clouds: Effects on precipitation and cloud optical properties. J. Geophys. Res. Atmos. 2002, 107. [Google Scholar] [CrossRef]
- Rosenfeld, D.; Rudich, Y.; Lahav, R. Desert dust suppressing precipitation: A possible desertification feedback loop. Proc. Nat. Acad. Sci. USA 2001, 98, 5975–5980. [Google Scholar] [CrossRef] [PubMed]
- Rosenfeld, D.; Lohmann, U.; Raga, G.B.; O’Dowd, C.D.; Kulmala, M.; Fuzzi, S.; Reissell, A.; Andreae, M.O. Flood or drought: How do aerosols affect precipitation? Science 2008, 321, 1309–1313. [Google Scholar] [CrossRef] [PubMed]
- Warren, S.G.; Wiscombe, W.J. A Model for the Spectral Albedo of Snow. 2. Snow Containing Atmospheric Aerosols. J. Atmos. Sci. 1980, 37, 2734–2745. [Google Scholar]
- Painter, T.H.; Barrett, A.P.; Landry, C.C.; Neff, J.C.; Cassidy, M.P.; Lawrence, C.R.; McBride, K.E.; Farmer, G.L. Impact of disturbed desert soils on duration of mountain snow cover. Geophys. Res. Lett. 2007, 34. [Google Scholar] [CrossRef]
- Painter, T.H.; Bryant, A.C.; Skiles, S.M. Radiative forcing by light absorbing impurities in snow from MODIS surface reflectance data. Geophys. Res. Lett. 2012, 39. [Google Scholar] [CrossRef]
- Yasunari, T.J.; Koster, R.D.; Lau, W.K.M.; Kim, K.M. Impact of snow darkening via dust, black carbon, and organic carbon on boreal spring climate in the Earth system. J. Geophys. Res. Atmos. 2015, 120, 5485–5503. [Google Scholar] [CrossRef]
- Flanner, M.G.; Zender, C.S.; Randerson, J.T.; Rasch, P.J. Present-day climate forcing and response from black carbon in snow. J. Geophys. Res. Atmos. 2007, 112. [Google Scholar] [CrossRef]
- Flanner, M.G.; Zender, C.S.; Hess, P.G.; Mahowald, N.M.; Painter, T.H.; Ramanathan, V.; Rasch, P.J. Springtime warming and reduced snow cover from carbonaceous particles. Atmos. Chem. Phys. 2009, 9, 2481–2497. [Google Scholar] [CrossRef]
- Aoki, T.; Kuchiki, K.; Niwano, M.; Kodama, Y.; Hosaka, M.; Tanaka, T. Physically based snow albedo model for calculating broadband albedos and the solar heating profile in snowpack for general circulation models. J. Geophys. Res. Atmos. 2011, 116. [Google Scholar] [CrossRef]
- Clarke, A.; McNaughton, C.; Kapustin, V.; Shinozuka, Y.; Howell, S.; Dibb, J.; Zhou, J.; Anderson, B.; Brekhovskikh, V.; Turner, H.; et al. Biomass burning and pollution aerosol over North America: Organic components and their influence on spectral optical properties and humidification response. J. Geophys. Res. Atmos. 2007, 112. [Google Scholar] [CrossRef]
- Doherty, S.J.; Dang, C.; Hegg, D.A.; Zhang, R.D.; Warren, S.G. Black carbon and other light-absorbing particles in snow of central North America. J. Geophys. Res. Atmos. 2014, 119, 12807–12831. [Google Scholar] [CrossRef]
- Wang, X.; Doherty, S.J.; Huang, J. Black carbon and other light-absorbing impurities in snow across Northern China. J. Geophys. Res. Atmos. 2013, 118, 1471–1492. [Google Scholar] [CrossRef]
- Painter, T.H.; Flanner, M.G.; Kaser, G.; Marzeion, B.; VanCuren, R.A.; Abdalati, W. End of the Little Ice Age in the Alps forced by industrial black carbon. Proc. Nat. Acad. Sci. USA 2013, 110, 15216–15221. [Google Scholar] [CrossRef] [PubMed]
- Hadley, O.L.; Kirchstetter, T.W. Black-carbon reduction of snow albedo. Nat. Clim. Chang. 2012, 2, 437–440. [Google Scholar] [CrossRef]
- Doherty, S.J.; Warren, S.G.; Grenfell, T.C.; Clarke, A.D.; Brandt, R.E. Light-absorbing impurities in Arctic snow. Atmos. Chem. Phys. 2010, 10, 11647–11680. [Google Scholar] [CrossRef]
- Xu, B.Q.; Cao, J.J.; Hansen, J.; Yao, T.D.; Joswia, D.R.; Wang, N.L.; Wu, G.J.; Wang, M.; Zhao, H.B.; Yang, W.; et al. Black soot and the survival of Tibetan glaciers. Proc. Nat. Acad. Sci. USA 2009, 106, 22114–22118. [Google Scholar] [CrossRef] [PubMed]
- Hansen, J.; Nazarenko, L. Soot climate forcing via snow and ice albedos. Proc. Nat. Acad. Sci. USA 2004, 101, 423–428. [Google Scholar] [CrossRef] [PubMed]
- Clarke, A.D.; Noone, K.J. Soot in the Arctic Snowpack—A Cause for Perturbations in Radiative-Transfer. Atmos. Environ. 1985, 19, 2045–2053. [Google Scholar] [CrossRef]
- Dang, C.; Hegg, D.A. Quantifying light absorption by organic carbon in Western North American snow by serial chemical extractions. J. Geophys. Res. Atmos. 2014, 119. [Google Scholar] [CrossRef]
- Ginot, P.; Dumont, M.; Lim, S.; Patris, N.; Taupin, J.D.; Wagnon, P.; Gilbert, A.; Arnaud, Y.; Marinoni, A.; Bonasoni, P.; et al. A 10 year record of black carbon and dust from a Mera Peak ice core (Nepal): Variability and potential impact on melting of Himalayan glaciers. Cryosphere 2014, 8, 1479–1496. [Google Scholar] [CrossRef]
- Kaspari, S.; Painter, T.H.; Gysel, M.; Skiles, S.M.; Schwikowski, M. Seasonal and elevational variations of black carbon and dust in snow and ice in the Solu-Khumbu, Nepal and estimated radiative forcings. Atmos. Chem. Phys. 2014, 14, 8089–8103. [Google Scholar] [CrossRef]
- Wu, G.; Xu, T.; Zhang, X.; Zhang, C.; Yan, N. The visible spectroscopy of iron oxide minerals in dust particles from ice cores on the Tibetan Plateau. Tellus B 2016, 68, 29191. [Google Scholar] [CrossRef]
- Lafon, S.; Sokolik, I.N.; Rajot, J.L.; Caquineau, S.; Gaudichet, A. Characterization of iron oxides in mineral dust aerosols: Implications for light absorption. J. Geophys. Res. 2006, 111. [Google Scholar] [CrossRef]
- Formenti, P.; Rajot, J.L.; Desboeufs, K.; Caquineau, S.; Chevaillier, S.; Nava, S.; Gaudichet, A.; Journet, E.; Triquet, S.; Alfaro, S.; et al. Regional variability of the composition of mineral dust from western Africa: Results from the AMMA SOP0/DABEX and DODO field campaigns. J. Geophys. Res. Atmos. 2008, 113. [Google Scholar] [CrossRef]
- Zhang, X.L.; Wu, G.J.; Zhang, C.L.; Xu, T.L.; Zhou, Q.Q. What is the real role of iron oxides in the optical properties of dust aerosols? Atmos. Chem. Phys. 2015, 15, 12159–12177. [Google Scholar] [CrossRef]
- Moosmüller, H.; Engelbrecht, J.P.; Skiba, M.; Frey, G.; Chakrabarty, R.K.; Arnott, W.P. Single scattering albedo of fine mineral dust aerosols controlled by iron concentration. J. Geophys. Res. Atmos. 2012, 117, 90–100. [Google Scholar] [CrossRef]
- Sokolik, I.N.; Toon, O.B. Incorporation of mineralogical composition into models of the radiative properties of mineral aerosol from UV to IR wavelengths. J. Geophys. Res. Atmos. 1999, 104, 9423–9444. [Google Scholar] [CrossRef]
- Wang, X.; Xu, B.Q.; Ming, J. An Overview of the Studies on Black Carbon and Mineral Dust Deposition in Snow and Ice Cores in East Asia. J. Meteorol. Res. 2014, 28, 354–370. [Google Scholar] [CrossRef]
- Doherty, S.J.; Grenfell, T.C.; Forsstrom, S.; Hegg, D.L.; Brandt, R.E.; Warren, S.G. Observed vertical redistribution of black carbon and other insoluble light-absorbing particles in melting snow. J. Geophys. Res. Atmos. 2013, 118, 5553–5569. [Google Scholar] [CrossRef]
- Wendl, I.A.; Menking, J.A.; Farber, R.; Gysel, M.; Kaspari, S.D.; Laborde, M.J.G.; Schwikowski, M. Optimized method for black carbon analysis in ice and snow using the Single Particle Soot Photometer. Atmos. Meas. Tech. 2014, 7, 2667–2681. [Google Scholar] [CrossRef]
- Doherty, S.J.; Hegg, D.A.; Johnson, J.E.; Quinn, P.K.; Schwarz, J.P.; Dang, C.; Warren, S.G. Causes of variability in light absorption by particles in snow at sites in Idaho and Utah. J. Geophys. Res. Atmos. 2016, 121, 4751–4768. [Google Scholar] [CrossRef]
- Sterle, K.M.; McConnell, J.R.; Dozier, J.; Edwards, R.; Flanner, M.G. Retention and radiative forcing of black carbon in eastern Sierra Nevada snow. Cryosphere 2013, 7, 365–374. [Google Scholar] [CrossRef]
- Ming, J.; Cachier, H.; Xiao, C.; Qin, D.; Kang, S.; Hou, S.; Xu, J. Black carbon record based on a shallow Himalayan ice core and its climatic implications. Atmos. Chem. Phys. 2008, 8, 1343–1352. [Google Scholar] [CrossRef]
- Li, C.L.; Bosch, C.; Kang, S.C.; Andersson, A.; Chen, P.F.; Zhang, Q.G.; Cong, Z.Y.; Chen, B.; Qin, D.H.; Gustafsson, O. Sources of black carbon to the Himalayan-Tibetan Plateau glaciers. Nat. Commun. 2016, 7, 12574. [Google Scholar] [CrossRef] [PubMed]
- Lim, S.; Fain, X.; Zanatta, M.; Cozic, J.; Jaffrezo, J.L.; Ginot, P.; Laj, P. Refractory black carbon mass concentrations in snow and ice: Method evaluation and inter-comparison with elemental carbon measurement. Atmos. Meas. Tech. 2014, 7, 3307–3324. [Google Scholar] [CrossRef]
- Grenfell, T.C.; Doherty, S.J.; Clarke, A.D.; Warren, S.G. Light absorption from particulate impurities in snow and ice determined by spectrophotometric analysis of filters. Appl. Opt. 2011, 50, 2037–2048. [Google Scholar] [CrossRef] [PubMed]
- Bond, T.C.; Anderson, T.L.; Campbell, D. Calibration and Intercomparison of Filter-Based Measurements of Visible Light Absorption by Aerosols. Aerosol Sci. Technol. 1999, 30, 582–600. [Google Scholar] [CrossRef]
- Huang, J.P.; Fu, Q.A.; Zhang, W.; Wang, X.; Zhang, R.D.; Ye, H.; Warren, S.G. Dust And Black Carbon in Seasonal Snow across Northern China. Bull. Am. Meteorol. Soc. 2011, 92, 175–181. [Google Scholar]
- Ye, H.; Zhang, R.D.; Shi, J.S.; Huang, J.P.; Warren, S.G.; Fu, Q. Black carbon in seasonal snow across northern Xinjiang in northwestern China. Environ. Res. Lett. 2012, 7, 044002. [Google Scholar] [CrossRef]
- Cheng, Y.; He, K.B.; Zheng, M.; Duan, F.K.; Du, Z.Y.; Ma, Y.L.; Tan, J.H.; Yang, F.M.; Liu, J.M.; Zhang, X.L.; et al. Mass absorption efficiency of elemental carbon and water-soluble organic carbon in Beijing, China. Atmos. Chem. Phys. 2011, 11, 11497–11510. [Google Scholar] [CrossRef]
- Weingartner, E.; Saathoff, H.; Schnaiter, M.; Streit, N.; Bitnar, B.; Baltensperger, U. Absorption of light by soot particles: Determination of the absorption coefficient by means of aethalometers. J. Aerosol Sci. 2003, 34, 1445–1463. [Google Scholar]
- Alfaro, S.C.; Lafon, S.; Rajot, J.L.; Formenti, P.; Gaudichet, A.; Maille, M. Iron oxides and light absorption by pure desert dust: An experimental study. J. Geophys. Res. Atmos. 2004, 109. [Google Scholar] [CrossRef]
- Clarke, A.D. Effects of Filter Internal-Reflection Coefficient on Light-Absorption Measurements Made Using the Integrating Plate Method. Appl. Opt. 1982, 21, 3021–3031. [Google Scholar] [PubMed]
- Clarke, A.D. Integrating Sandwich—A New Method of Measurement of the Light-Absorption Coefficient for Atmospheric Particles. Appl. Opt. 1982, 21, 3011–3020. [Google Scholar] [PubMed]
- Bedidi, A.; Cervelle, B. Light scattering by spherical particles with hematite and goethitelike optical properties: Effect of water impregnation. J. Geophys. Res. Solid Earth 1993, 98, 11941–11952. [Google Scholar]
- Wonaschutz, A.; Hitzenberger, R.; Bauer, H.; Pouresmaeil, P.; Klatzer, B.; Caseiro, A.; Puxbaum, H. Application of the Integrating Sphere Method to Separate the Contributions of Brown and Black Carbon in Atmospheric Aerosols. Environ. Sci. Technol. 2009, 43, 1141–1146. [Google Scholar] [PubMed]
- Chakrabarty, R.K.; Moosmuller, H.; Chen, L.W.A.; Lewis, K.; Arnott, W.P.; Mazzoleni, C.; Dubey, M.K.; Wold, C.E.; Hao, W.M.; Kreidenweis, S.M. Brown carbon in tar balls from smoldering biomass combustion. Atmos. Chem. Phys. 2010, 10, 6363–6370. [Google Scholar] [CrossRef]
- Yang, M.; Howell, S.; Zhuang, J.; Huebert, B. Attribution of aerosol light absorption to black carbon, brown carbon, and dust in China–interpretations of atmospheric measurements during EAST-AIRE. Atmos. Chem. Phys. 2009, 9, 2035–2050. [Google Scholar]
- Barnard, J.C.; Volkamer, R.; Kassianov, E.I. Estimation of the mass absorption cross section of the organic carbon component of aerosols in the Mexico City Metropolitan Area. Atmos. Chem. Phys. 2008, 8, 6665–6679. [Google Scholar] [CrossRef]
- Hoffer, A.; Gelencser, A.; Guyon, P.; Kiss, G.; Schmid, O.; Frank, G.P.; Artaxo, P.; Andreae, M.O. Optical properties of humic-like substances (HULIS) in biomass-burning aerosols. Atmos. Chem. Phys. 2006, 6, 3563–3570. [Google Scholar] [CrossRef]
- Kirchstetter, T.W.; Novakov, T.; Hobbs, P.V. Evidence that the spectral dependence of light absorption by aerosols is affected by organic carbon. J. Geophys. Res. Atmos. 2004, 109. [Google Scholar] [CrossRef]
- Szkarlat, A.C.; Japar, S.M. Optical and Chemical-Properties of Particle Emissions from on-Road Vehicles. J. Air Pollut. Control Assoc. 1983, 33, 592–597. [Google Scholar] [CrossRef]
- Scherrer, H.C.; Kittelson, D.B.; Dolan, D.F. Light Absorption Measurements of Diesel Particulate Matter; SAE Technical Paper 810181; SAE Technical Paper: Warrendale, PA, USA, 1981. [Google Scholar]
- Japar, S.M.; Szkarlat, A.C.; Gorse, R.A. Optical-Properties of Particulate-Emissions from on-Road Vehicles. Atmos. Environ. 1981, 15, 2063–2070. [Google Scholar]
- Ballach, J.; Hitzenberger, R.; Schultz, E.; Jaeschke, W. Development of an improved optical transmission technique for black carbon (BC) analysis. Atmos. Environ. 2001, 35, 2089–2100. [Google Scholar] [CrossRef]
- Utry, N.; Ajtai, T.; Pintér, M.; Tombácz, E.; Illés, E.; Bozóki, Z.; Szabó, G. Mass-specific optical absorption coefficients and imaginary part of the complex refractive indices of mineral dust components measured by a multi-wavelength photoacoustic spectrometer. Atmos. Meas. Tech. 2015, 8, 401–410. [Google Scholar] [CrossRef]
- Bond, T.C.; Bergstrom, R.W. Light absorption by carbonaceous particles: An investigative review. Aerosol Sci. Technol. 2006, 40, 27–67. [Google Scholar]
- Lack, D.A.; Cappa, C.D. Impact of brown and clear carbon on light absorption enhancement, single scatter albedo and absorption wavelength dependence of black carbon. Atmos. Chem. Phys. 2010, 10, 4207–4220. [Google Scholar]
- Russell, P.B.; Bergstrom, R.W.; Shinozuka, Y.; Clarke, A.D.; DeCarlo, P.F.; Jimenez, J.L.; Livingston, J.M.; Redemann, J.; Dubovik, O.; Strawa, A. Absorption Angstrom Exponent in AERONET and related data as an indicator of aerosol composition. Atmos. Chem. Phys. 2010, 10, 1155–1169. [Google Scholar] [CrossRef]
- Bahadur, R.; Praveen, P.S.; Xu, Y.Y.; Ramanathan, V. Solar absorption by elemental and brown carbon determined from spectral observations. Proc. Nat. Acad. Sci. USA 2012, 109, 17366–17371. [Google Scholar] [CrossRef] [PubMed]
- Gyawali, M.; Arnott, W.P.; Lewis, K.; Moosmuller, H. In situ aerosol optics in Reno, NV, USA during and after the summer 2008 California wildfires and the influence of absorbing and non-absorbing organic coatings on spectral light absorption. Atmos. Chem. Phys. 2009, 9, 8007–8015. [Google Scholar] [CrossRef]
- Linke, C.; Mohler, O.; Veres, A.; Mohácsi, Á. Optical properties and mineralogical composition of different Saharan mineral dust samples: A laboratory study. Atmos. Chem. Phys. 2006, 6, 3315–3323. [Google Scholar] [CrossRef]
- Pu, W.; Wang, X.; Wei, H.; Zhou, Y.; Shi, J.; Hu, Z.; Jin, H.; Chen, Q. Properties of black carbon and other insoluble light-absorbing particles in seasonal snow of northwest China. Cryosphere Discuss. 2016, 2016. [Google Scholar] [CrossRef]
Figure 1.
Snow sampling locations, site numbers, and regional groupings for the (a) 2010 and (b) 2012 field campaigns. The open symbols indicate that the mass loadings of the estimated BC in surface snow exceed 8 μg·cm−2, which could lead to large biases and are not used in calculation.
Figure 1.
Snow sampling locations, site numbers, and regional groupings for the (a) 2010 and (b) 2012 field campaigns. The open symbols indicate that the mass loadings of the estimated BC in surface snow exceed 8 μg·cm−2, which could lead to large biases and are not used in calculation.

Figure 2.
Dependence of light attenuation (ATN) measured at 550 nm on (a) hematite loading; (b) goethite loading and (c) fullerene soot loading.
Figure 2.
Dependence of light attenuation (ATN) measured at 550 nm on (a) hematite loading; (b) goethite loading and (c) fullerene soot loading.
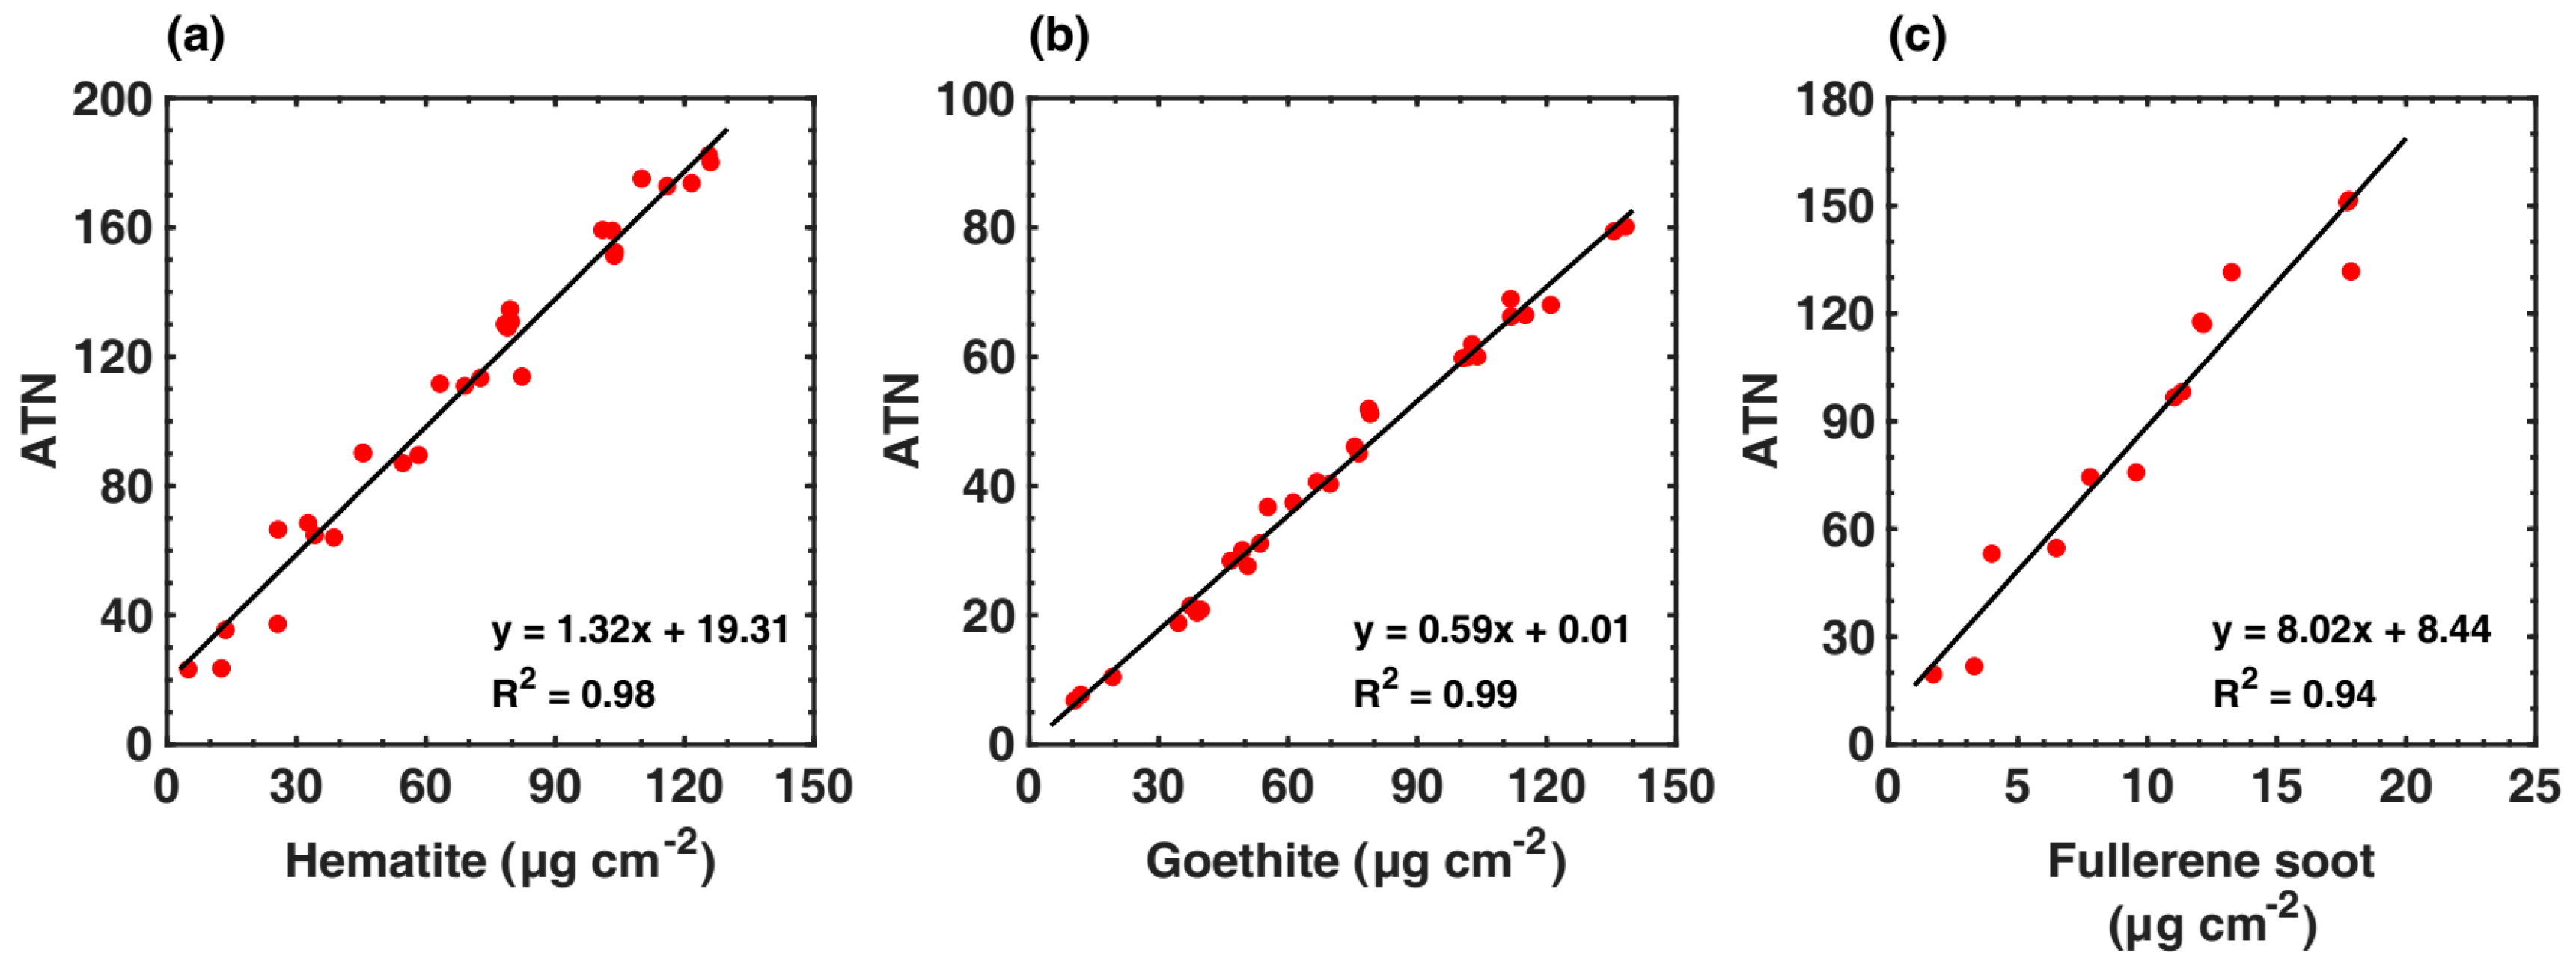
Figure 3.
Wavelength dependence of light attenuation for (a) goethite, hematite and (b) fullerene soot. The filled areas show the light attenuation wavelength dependence range for different loadings of samples. The dots show an example of the light attenuation wavelength dependence for one median loading filter (Hmt in red, Gt in blue and fullerene soot in black; same below). The solid lines show the power exponent fitting from 450 nm to 750 nm. The dotted lines in panel (a) show the power exponent fitting from 550 nm to 750 nm.

Figure 4.
The mass absorption coefficient of hematite measured by Utry et al. [60].
Figure 4.
The mass absorption coefficient of hematite measured by Utry et al. [60].

Figure 5.
Regional averages of the non-BC ILAPs absorption Ångström exponent of corresponding samples. Error bars show the standard deviation of for all samples in each region.
Figure 5.
Regional averages of the non-BC ILAPs absorption Ångström exponent of corresponding samples. Error bars show the standard deviation of for all samples in each region.

Figure 6.
(a) versus and (b) versus for selected sites.

Figure 7.
Differences between (a) and and (b) and at different sites. Comparisons of (c) versus and (d) versus . The factional absorptions were determined at 450 nm.
Figure 7.
Differences between (a) and and (b) and at different sites. Comparisons of (c) versus and (d) versus . The factional absorptions were determined at 450 nm.

Figure 8.
The first row: comparisons of and with different (a) ; (b) and (c) values. The second row: comparisons of and with different (d) and (e) values, the factional absorptions were determined at 450 nm. The correlation coefficients in different colors correspond to the cases denoted in the legend.


Table 1.
Optical characteristics of particles measured in this study.
| Particle Types | K1* | (m2·g−1) | (m2·g−1) | AAE (450–750 nm) | AAE (550–750 nm) |
|---|---|---|---|---|---|
| Hematite | 0.135 | 1.32 ± 0.03 | 0.97 ± 0.02 | 3.67 ± 0.36 | 5.53 ± 0.47 |
| Goethite | 0.135 | 0.59 ± 0.02 | 0.43 ± 0.01 | 5.30 ± 0.20 | 2.18 ± 0.16 |
| Fullerene soot | 0.023 | 8.02 ± 0.53 | 6.40 ± 0.42 | 0.54 ± 0.06 | – |
Table 2.
The percentiles of the relative bias () for different ILAPs. values are derived using and similarly in Table 3.
Table 2.
The percentiles of the relative bias () for different ILAPs. values are derived using and similarly in Table 3.
| Relative Biases | 10th Percentile | 25th Percentile | 50th Percentile | 75th Percentile | 90th Percentile |
|---|---|---|---|---|---|
| 0.74% | 1.76% | 6.29% | 16.11% | 33.41% | |
| 1.04% | 2.47% | 4.27% | 7.29% | 14.46% | |
| 6.60% | 14.47% | 33.01% | 46.65% | 73.93% |
Table 3.
Statistics for in the following cases.
| Cases | 10th Percentile | 25th Percentile | 50th Percentile | 75th Percentile | 90th Percentile |
|---|---|---|---|---|---|
| Base case | 6.60% | 14.47% | 33.01% | 46.65% | 73.93% |
| 5.19% | 12.38% | 29.66% | 46.32% | 93.64% | |
| 7.26% | 17.29% | 30.56% | 54.34% | 73.17% | |
| 6.60% | 14.47% | 33.01% | 46.65% | 73.93% | |
| 6.60% | 14.47% | 33.01% | 46.65% | 73.93% | |
| 2.31% | 5.80% | 14.40% | 25.06% | 83.15% |
© 2017 by the authors. Licensee MDPI, Basel, Switzerland. This article is an open access article distributed under the terms and conditions of the Creative Commons Attribution (CC BY) license (http://creativecommons.org/licenses/by/4.0/).
Share and Cite
MDPI and ACS Style
Zhou, Y.; Wang, X.; Wu, X.; Cong, Z.; Wu, G.; Ji, M. Quantifying Light Absorption of Iron Oxides and Carbonaceous Aerosol in Seasonal Snow across Northern China. Atmosphere 2017, 8, 63. https://doi.org/10.3390/atmos8040063
AMA Style
Zhou Y, Wang X, Wu X, Cong Z, Wu G, Ji M. Quantifying Light Absorption of Iron Oxides and Carbonaceous Aerosol in Seasonal Snow across Northern China. Atmosphere. 2017; 8(4):63. https://doi.org/10.3390/atmos8040063
Chicago/Turabian StyleZhou, Yue, Xin Wang, Xueqin Wu, Zhiyuan Cong, Guangming Wu, and Mingxia Ji. 2017. "Quantifying Light Absorption of Iron Oxides and Carbonaceous Aerosol in Seasonal Snow across Northern China" Atmosphere 8, no. 4: 63. https://doi.org/10.3390/atmos8040063
Note that from the first issue of 2016, this journal uses article numbers instead of page numbers. See further details here.