1. Introduction
Nowcasting is the science of anticipating the ordinary and severe weather events in the next few hours (0–6 h) [
1]. Severe convective weather events can include heavy rainfall, strong winds, hail, and/or tornadoes [
2]. Various sectors of society need to be able to prepare for these events in order to prevent loss of life and damage to property. The issuing of weather-related warnings for such events in South Africa is the mandate of the South African Weather Service (SAWS). In an ideal world, radar systems provide the most useful information about the intensity, movement, and characteristics of severe weather events, but these data sources are expensive to obtain and require extensive maintenance. In South Africa, radar systems do not provide coverage of the entire country and this leaves gaps between radar systems. In other southern African countries, very few operational radar systems exist. Despite the shortcomings in data resources, all meteorological centers still have to warn the public of pending severe weather events in order to save lives and property.
The geostationary Meteosat Second Generation (MSG) satellite provides data coverage over all African countries every 15 min and has a nominal (at nadir) resolution of 3 km for most of the 12 channels. Over South Africa, the resolution of satellite data is between 4 and 5 km in a north-south direction and between 3 and 4 km in an east-west direction (depending on the location in South Africa) [
3]. The operational use of satellite images and derived products, as a possible tool for nowcasting of severe convective weather events in these data-sparse regions, is increasingly important for these National Meteorological and Hydrological Services (NMHS). Using MSG data, in combination with input from numerical weather prediction (NWP) models, can be an excellent second option for nowcasting purposes in areas that are not covered by radar data or where no radar systems are available [
4].
In order to optimize the use of satellite data, different centers—so-called Satellite Application Facilities (SAF)—were established in the European region to develop derived products for different purposes, including nowcasting [
5]. The Nowcasting (NWC) SAF developed various products, some of which can be very useful for the nowcasting of severe weather events. One of the products, developed within the NWC SAF framework by Météo-France, is called the “Rapidly Developing Thunderstorms” (RDT) product. The RDT product uses mainly geostationary (MSG) satellite data and provides information on cloud characteristics and phases related to significant convective systems [
6]. An objective validation of the RDT product (using the 2011 version of the software) was conducted over Europe from June to August 2008 and April to October 2009 (Northern Hemisphere summer) by the developers. Cloud-to-ground (CG) lightning activity over the European region was used as ground truth. The conclusion of the validation report states: “RDT provides an accurate depiction of convective phenomena, from triggering phase to mature stage. The RDT object allows pointing out some areas of interest of a satellite image. The RDT provides relevant information on triggering and development clouds and on mature systems.” [
7]. Histories of previous time-steps of the RDT polygons are used together with the latest time-step to estimate the direction in which the storm cell will move in the next few minutes (extrapolation technique). This makes the RDT product useful to identify and nowcast the storms within the next few minutes. The 2013 version of the NWC SAF (used in this study) did not have the capability to provide forecasted tracks of where storms will be in the next 15, 30, 45, and 60 min. This feature was introduced into the 2016 version of the software, which was released at the end of 2016, and will enhance the lead-time of nowcasts made by RDT for up to an hour in advance.
Other satellite-based storm tracking algorithms exist, such as Cb-TRAM (Cumulonimbus Tracking and Monitoring), MASCOTTE (Maximum Spatial Correlation Tracking Technique), and ForTraCC (Forecast and Tracking the Evolution of Cloud Clusters) [
8]. The Cb-TRAM algorithm from the German Aerospace Center (DLR), detects, tracks, and nowcasts thunderstorms with data from MSG and is similar to the RDT product. As with the RDT, evaluations of the Cb-TRAM product over Europe and South Africa against lightning data also showed favorable results [
9]. A major advantage of RDT compared to Cb-TRAM is that RDT forms part of the NWC SAF software that is freely available on the NWC SAF website, which makes it more accessible to developing countries [
10].
In 2013, the 2012 version of the NWC SAF software was installed in South Africa. Improvements are frequently made to the software by the developers and a 2013 version of the software soon followed. This 2013 version of the NWC SAF software was installed and made operational in South Africa during 2014. For the southern African region, the software uses the local version of the United Kingdom Meteorological Office (UKMO) Unified Model (UM). The version of the UM used in this study was available once a day, using a 12 km horizontal resolution and 38 vertical levels. The UM has an hourly output for up to 48 h ahead [
11]. Satellite data from the MSG are readily available every 15 min. Aside from using MSG (mandatory) and UM (optional) data, the RDT product can be used with an auxiliary lightning dataset. Initial tests were done to validate the RDT objects (without using lightning data as input) against the occurrence of lightning objects over South Africa [
12]. The results were very encouraging and showed that the RDT product can be very useful for the identification and tracking of the more intense parts of thunderstorms using MSG and NWP data.
The developers of the RDT product recommend that lightning data should, if possible, be used as input data into the software to characterize electrical activity of convective systems in order to force the identification of convective systems. The South African Lightning Detection Network (SALDN) consists of 25 Vaisala LS 7000 and 7001 sensors across the country and detects lightning with a theoretical detection efficiency of 90% and location accuracy of 500 m. These sensors detect mostly CG lightning and thus do not capture most of the intra-cloud (IC) lightning or cloud-to-cloud (CC) lightning [
13]. During the developing phase of a thunderstorm predominantly IC lightning is found, while in the mature phase of a storm most of the CG and IC lightning occur [
14].
The aim of this work was to test the effect of including lightning data as auxiliary dataset into the RDT product. This was achieved by verifying the RDT (with and without lightning data added as input data) to the software algorithms against radar reflectivity over South Africa. The results of twenty-five case studies over the South African domain showed that the RDT product already provides favorable results when lightning data is omitted from the software and that the inclusion of lightning data further enhances the performance of the product. In regions not covered by radar systems, the RDT could provide additional information on possible severe or intense storms and can have many applications, such as for the aviation industry in assisting with the navigation of air traffic around the intense thunderstorms.
2. Materials and Methods
A detailed description of the RDT software can be found in the NWC SAF documentation [
6]. The RDT product (together with other NWC SAF products that feed into the RDT) requires the use of eleven of the twelve channels from the MSG satellite. This includes: High Resolution Visible, Visible (VIS) 0.6, VIS 0.8, Infrared (IR) 1.6, IR 3.9, Water Vapor (WV) 6.2, WV 7.3, IR 8.7, IR 10.8, IR 12.0, and IR 13.4 µm. The NWP fields that are needed in the RDT includes: 2 meter (m) temperature, 2 m relative humidity, 2 m dew point temperature, surface pressure, temperature and humidity at all the levels of the NWP, temperature of the tropopause, geopotential at the surface, as well as a land sea mask [
15]. The local version of the UM used for the case studies was available once a day at a horizontal resolution of 12 km, with hourly output for 48 h ahead.
Similar to the satellite data, the RDT product updates every 15 min and is available during day and nighttime. The RDT algorithm consists of three parts, namely, the detection, tracking, and discrimination of cloud systems. During the detection of cells, the RDT algorithm uses an adaptive threshold deduced from the brightness temperature patterns of each cell and its surroundings (from the IR 10.8 satellite channel) [
6]. The tracking algorithm uses the speed and movement of cells between two consecutive time steps to track a cell based on the principle of overlapping. Characteristics of the cells between two time steps, such as volume and cooling rate, are used as input into the discrimination algorithm [
6]. The discrimination algorithm identifies the convective elements from all cloud cells by using statistical and empirical rules tuned on a learning database. Five MSG channels (IR 10.8, IR 8.7, IR 12.0, WV 7.3, and WV 6.2) together with NWP parameters are used in the discrimination algorithm. The different phases of the storms are determined by using the cell history, cooling or warming of the cells, vertical extent, expansion rate, and whether there is convective activity in the storm (if lightning data are used as input). NWP data are used to identify areas that are stable and where no convective development should occur. The final output provides polygons of the rapidly developing cells that have a phase of growing, mature, or decaying [
6,
12].
For the purpose of this work, twenty-five cases, listed in
Table 1, were used between September and March (southern hemisphere spring/summer) when most convective activity occurs in South Africa. Nine cases from 2011, 2012, and 2013 were selected based on the availability of satellite and model data, as well as the availability of computer resources to process the data. In order to cover a more extensive period, sixteen more cases from 15 to 30 March 2015 were added to the dataset. On each of these days, the times between 1100 and 1800 Coordinated Universal Time (UTC) were considered, as this coincides with the time when most heat driven convection in South Africa occurs (i.e., late afternoon and early evening in summer time) [
16]. The study focused on the area inside the borders of South Africa covered by radar systems.
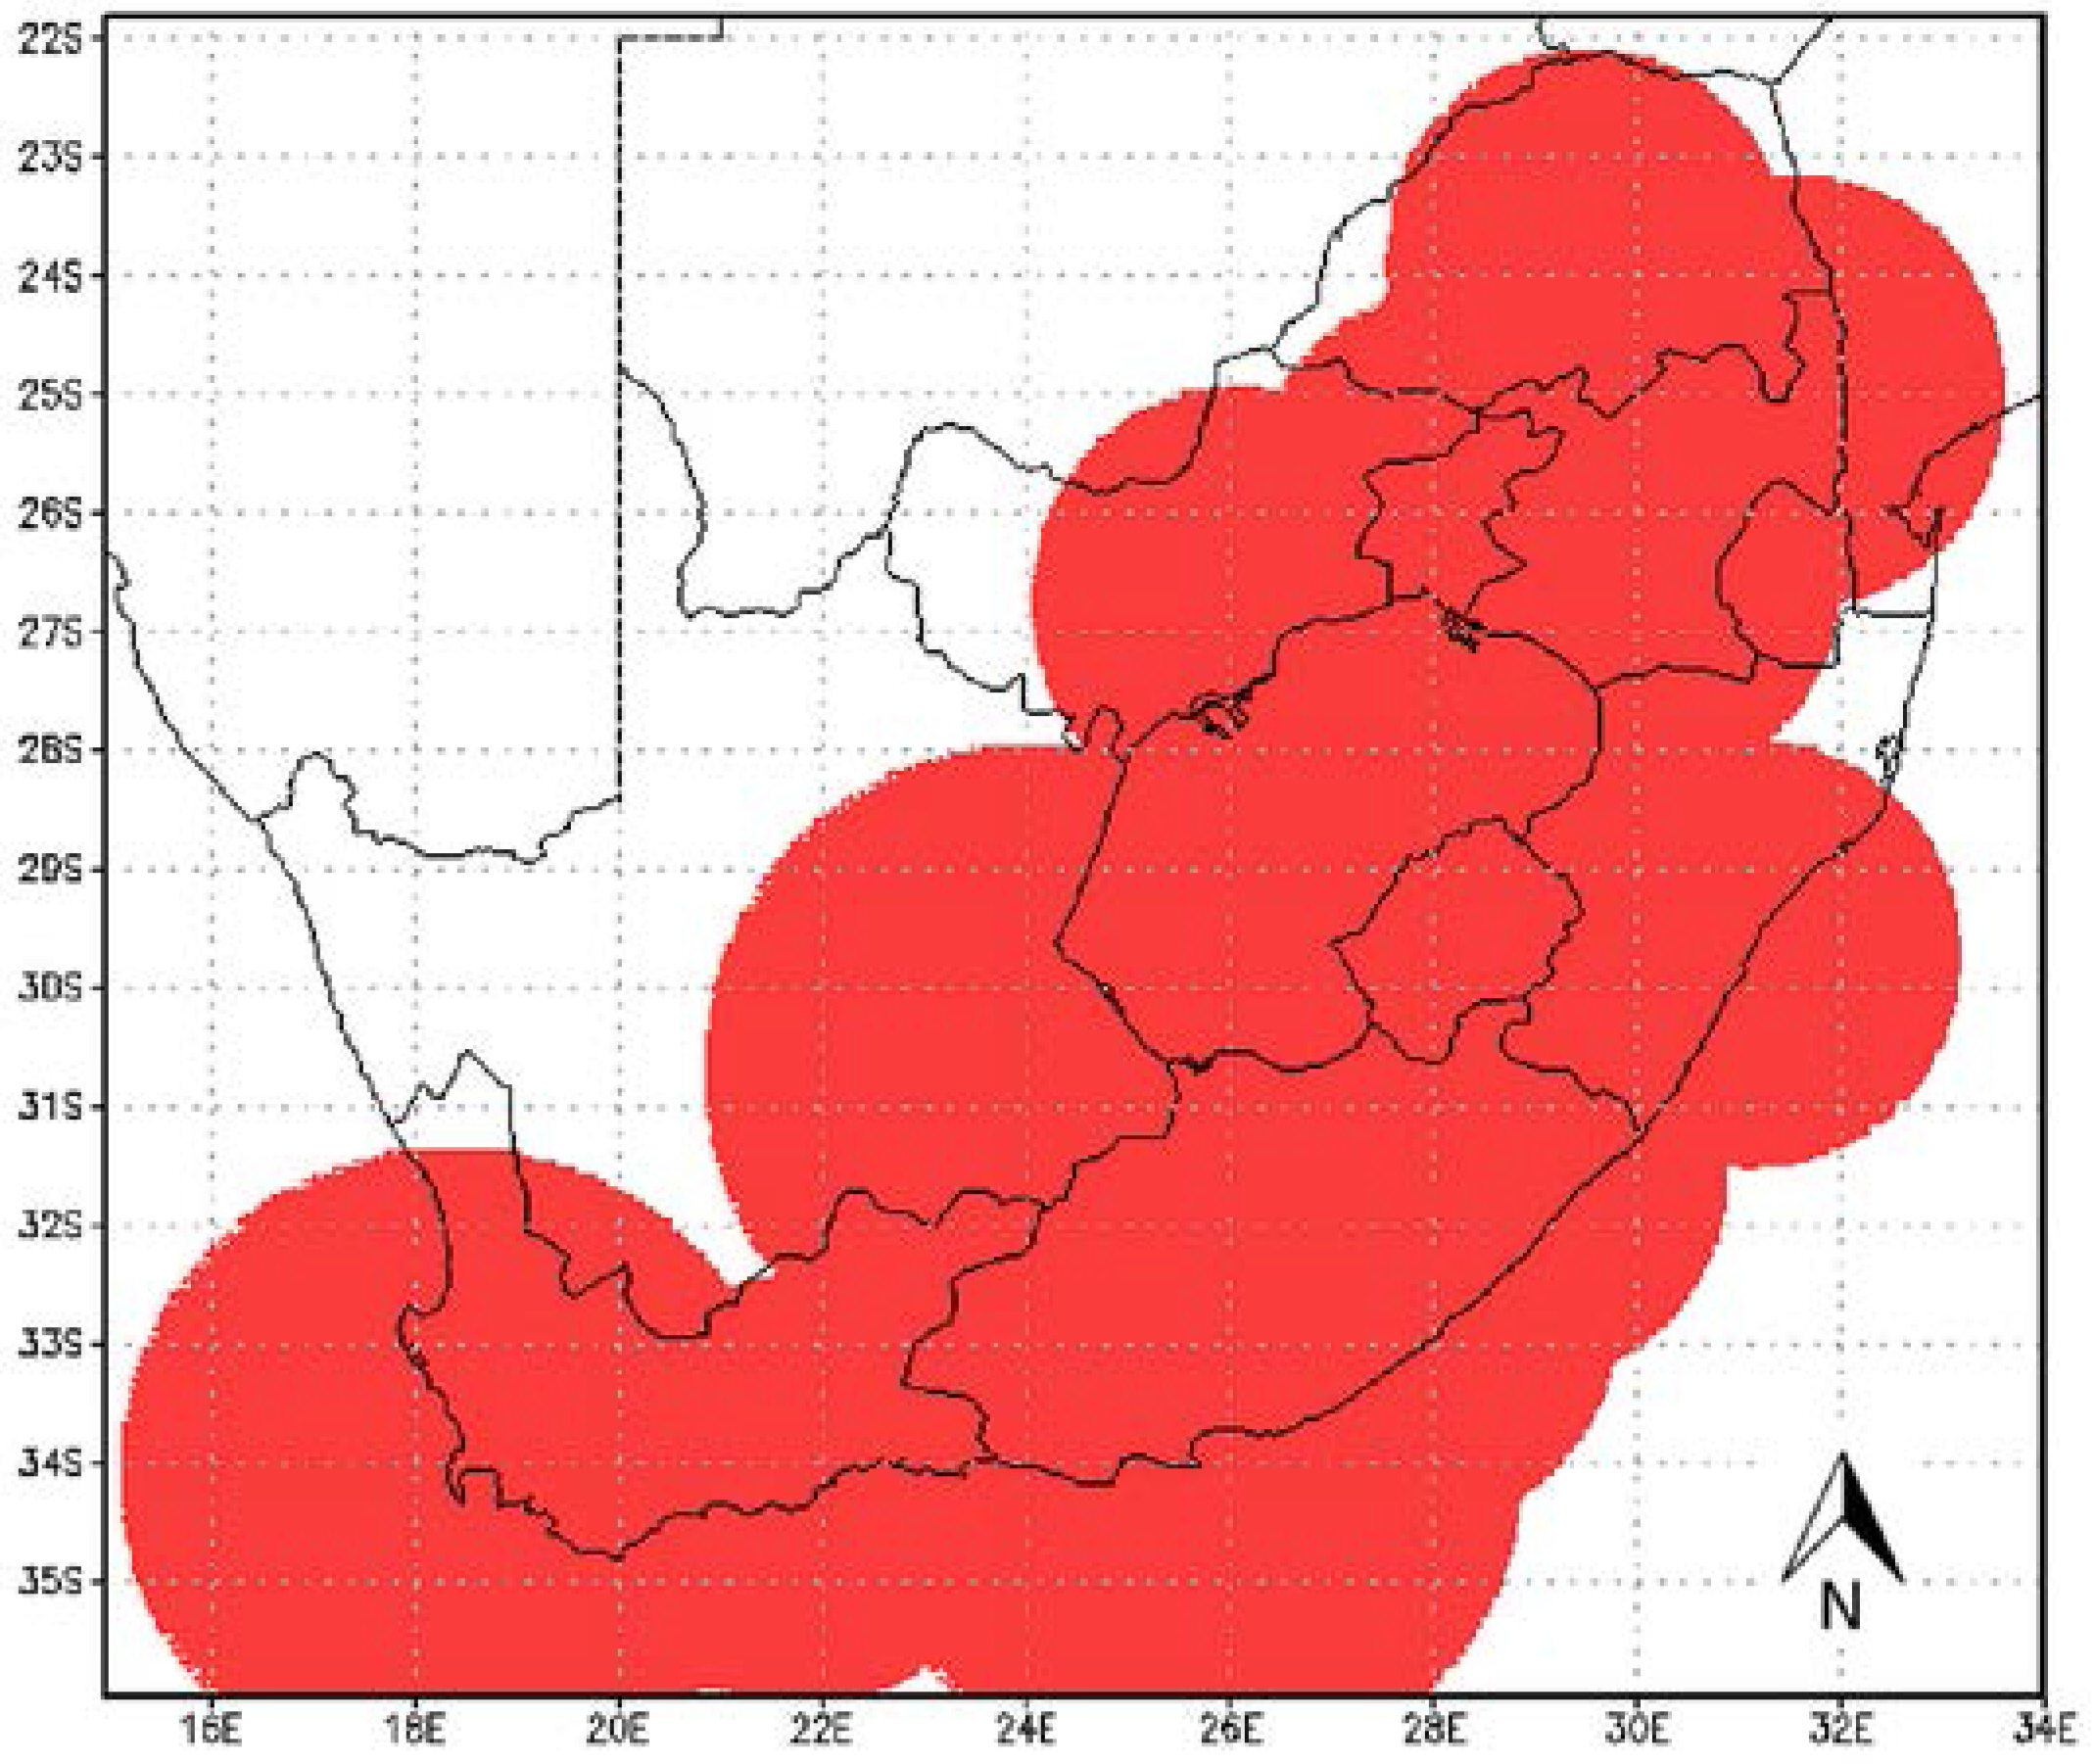
Radar data from 11 S-band (operating on a wavelength of 8–15 cm and a frequency of 2–4 GHz) and 3 C-band (operating on a wavelength of 4–8 cm and a frequency of 4–8 GHz) radars were used as ground truth for validation of the RDT polygons. The radar systems in South Africa are frequently calibrated to ensure that they operate at optimal performance. Unfortunately, radar data are not always available due to a number of reasons. The areas covered by radar across the country varied from day-to-day and even from time to time, during any day. To deal with these variations, the first step was to identify the radar systems which were available (or operational) between 1100 and 1800 UTC of each of the case dates.
Figure 1 shows a map of the radar system mosaic over South Africa if all radars were operational (red) and this was taken as the study domain for the evaluation. When radar data were not available, the coverage domain of that radar was removed from the study domain when calculating the evaluation statistics.
A second challenge when using radar data is that the scanning interval of the radars changed from 5 min intervals to 6 min intervals in 2014. For the older (2011, 2012, and 2013) case days, the interval of radar mosaic data was every 5 min, while the intervals of the 2015 cases were every 6 min. The interval of RDT data—which relates to satellite data—on the other hand, is every 15 min. For the cases prior to 2014, the maximum radar reflectivity in the 10 min before and after the RDT timestamp was used for the evaluation. For the 2015 cases, the 6 min interval radar data does not correspond so well with the RDT time stamps. MSG data is available every 15 min (at 00, 15, 30, and 45 min), while the 6 min radar data were available at 00, 06, 12, 18, 24, 30, 36, 42, 48, and 54 min past the hour. As a result, the RDT times of 15 and 45 min do not correspond easily with radar data times. When the RDT timestamp was 00 or 30 min past the hour, the radar data for the 6 min following the RDT time were used. When the RDT timestamp was 15 and 45 min past the hour, the radar data for the 6 min surrounding the RDT time (3 min before and after RDT) were used.
Lightning data supplied by the SALDN was used as input into the RDT product. To include lightning data into the processing for RDT, two settings are made in the configuration file. On recommendation of the developers: (a) 600 s (10 min) before and after each RDT time step are used as the time window for lightning data to be included in the calculation; (b) three satellite pixels are set as the distance between the satellite cell and the lightning stroke with which it is associated; and (c) 15 or more lightning strokes must be associated with the satellite cell [
17]. This means that the calculations of the RDT product considers all lightning strokes that occur in the 10 min before and after the RDT time step, and considers lightning strokes up to a distance of three satellite pixels from the satellite cell in order to take into account lightning outside a cell. Furthermore, at least 15 lightning strokes must be associated with a cell based on the previously mentioned conditions. Evaluation of the RDT product was performed with and without lightning data added to the algorithm to determine if the lightning data adds value to the product.
The RDT algorithm is an object-orientated methodology to identify and track thunderstorms by means of polygons for different phases of the convective storms—triggering, growing, and mature. To validate these objects against radar reflectivity requires an object-orientated methodology, which was also followed by the developers [
7]. An overview of the research done on spatial validation methodology is provided by [
18]. Object-based approaches identify different attributes (such as position and size) to each individual pair of forecast/observed “objects” [
18]. The methodology behind object-orientated methods forms part of the statistical software package called SpatialVx [
19] as part of the “R” programming language [
20].
Figure 2 shows an example of how the SpatialVx software [
19] transforms features of the RDT and radar over the study domain into objects and matches these objects.
Figure 2a shows the RDT overlaid on satellite imagery for 9 October 2012 at 1315 UTC.
Figure 2b shows how the SpatialVx software transforms these RDT polygons into objects (
Figure 2b-right), transforms radar data into objects (
Figure 2b-left), and then matches these RDT and radar objects as indicated by the corresponding colors.
Based on these objects or features, new definitions for hits, misses, and false alarms can be calculated according to the identified objects. Contingency table verification metrics like the probability of detection (POD), probability of false detection (POFD), false alarm ratio (FAR), and Heidke skill score (HSS) could then be calculated from the hits, misses, and false alarms [
21].
Table 2 gives the range and perfect score values for the verification metrics used in this study. This software package was used to do an object-orientated validation of the RDT polygons against the radar reflectivity polygons in this study. The standard output statistics calculated by the SpatialVx package, namely the POD, POFD, FAR, and HSS were used in this study. The hits, misses, false alarms, and correct negatives could also be used to calculate other statistical scores, but these were not considered in this paper.
When radar data are considered, 35 dBZ is usually seen as a threshold to start tracking thunderstorms. A reflectivity value of <30 dBZ indicates light rain, 30–40 dBZ indicates light to moderate rain, 40–50 dBZ indicates moderate to heavy rain, and >50 dBZ heavy rain. At reflectivity values above 50 dBZ, hail is likely [
22]. Using an object approach, cell-tracking algorithms define such an object as an area where the reflectivity exceeds a threshold—35, 40, and 45 dBZ are most typically used [
23,
24]. In order to consider all the phases of the storms in the evaluation of the RDT product, radar reflectivity greater and equal to 35 dBZ were used, to exclude less significant storms and align with the RDT principle of rapidly developing and/or intense parts of thunderstorms. The threshold of 35 dBZ was also used and recommended in the validation of the RDT by Météo-France: “35 dBZ is the first threshold we use to follow radar-detected convection” and “our aeronautical end-user defines the 36 dBZ as moderate convection” [
25]. The RDT polygons were thus validated against all radar reflectivity polygons that are greater or equal to 35 dBZ.
4. Discussion
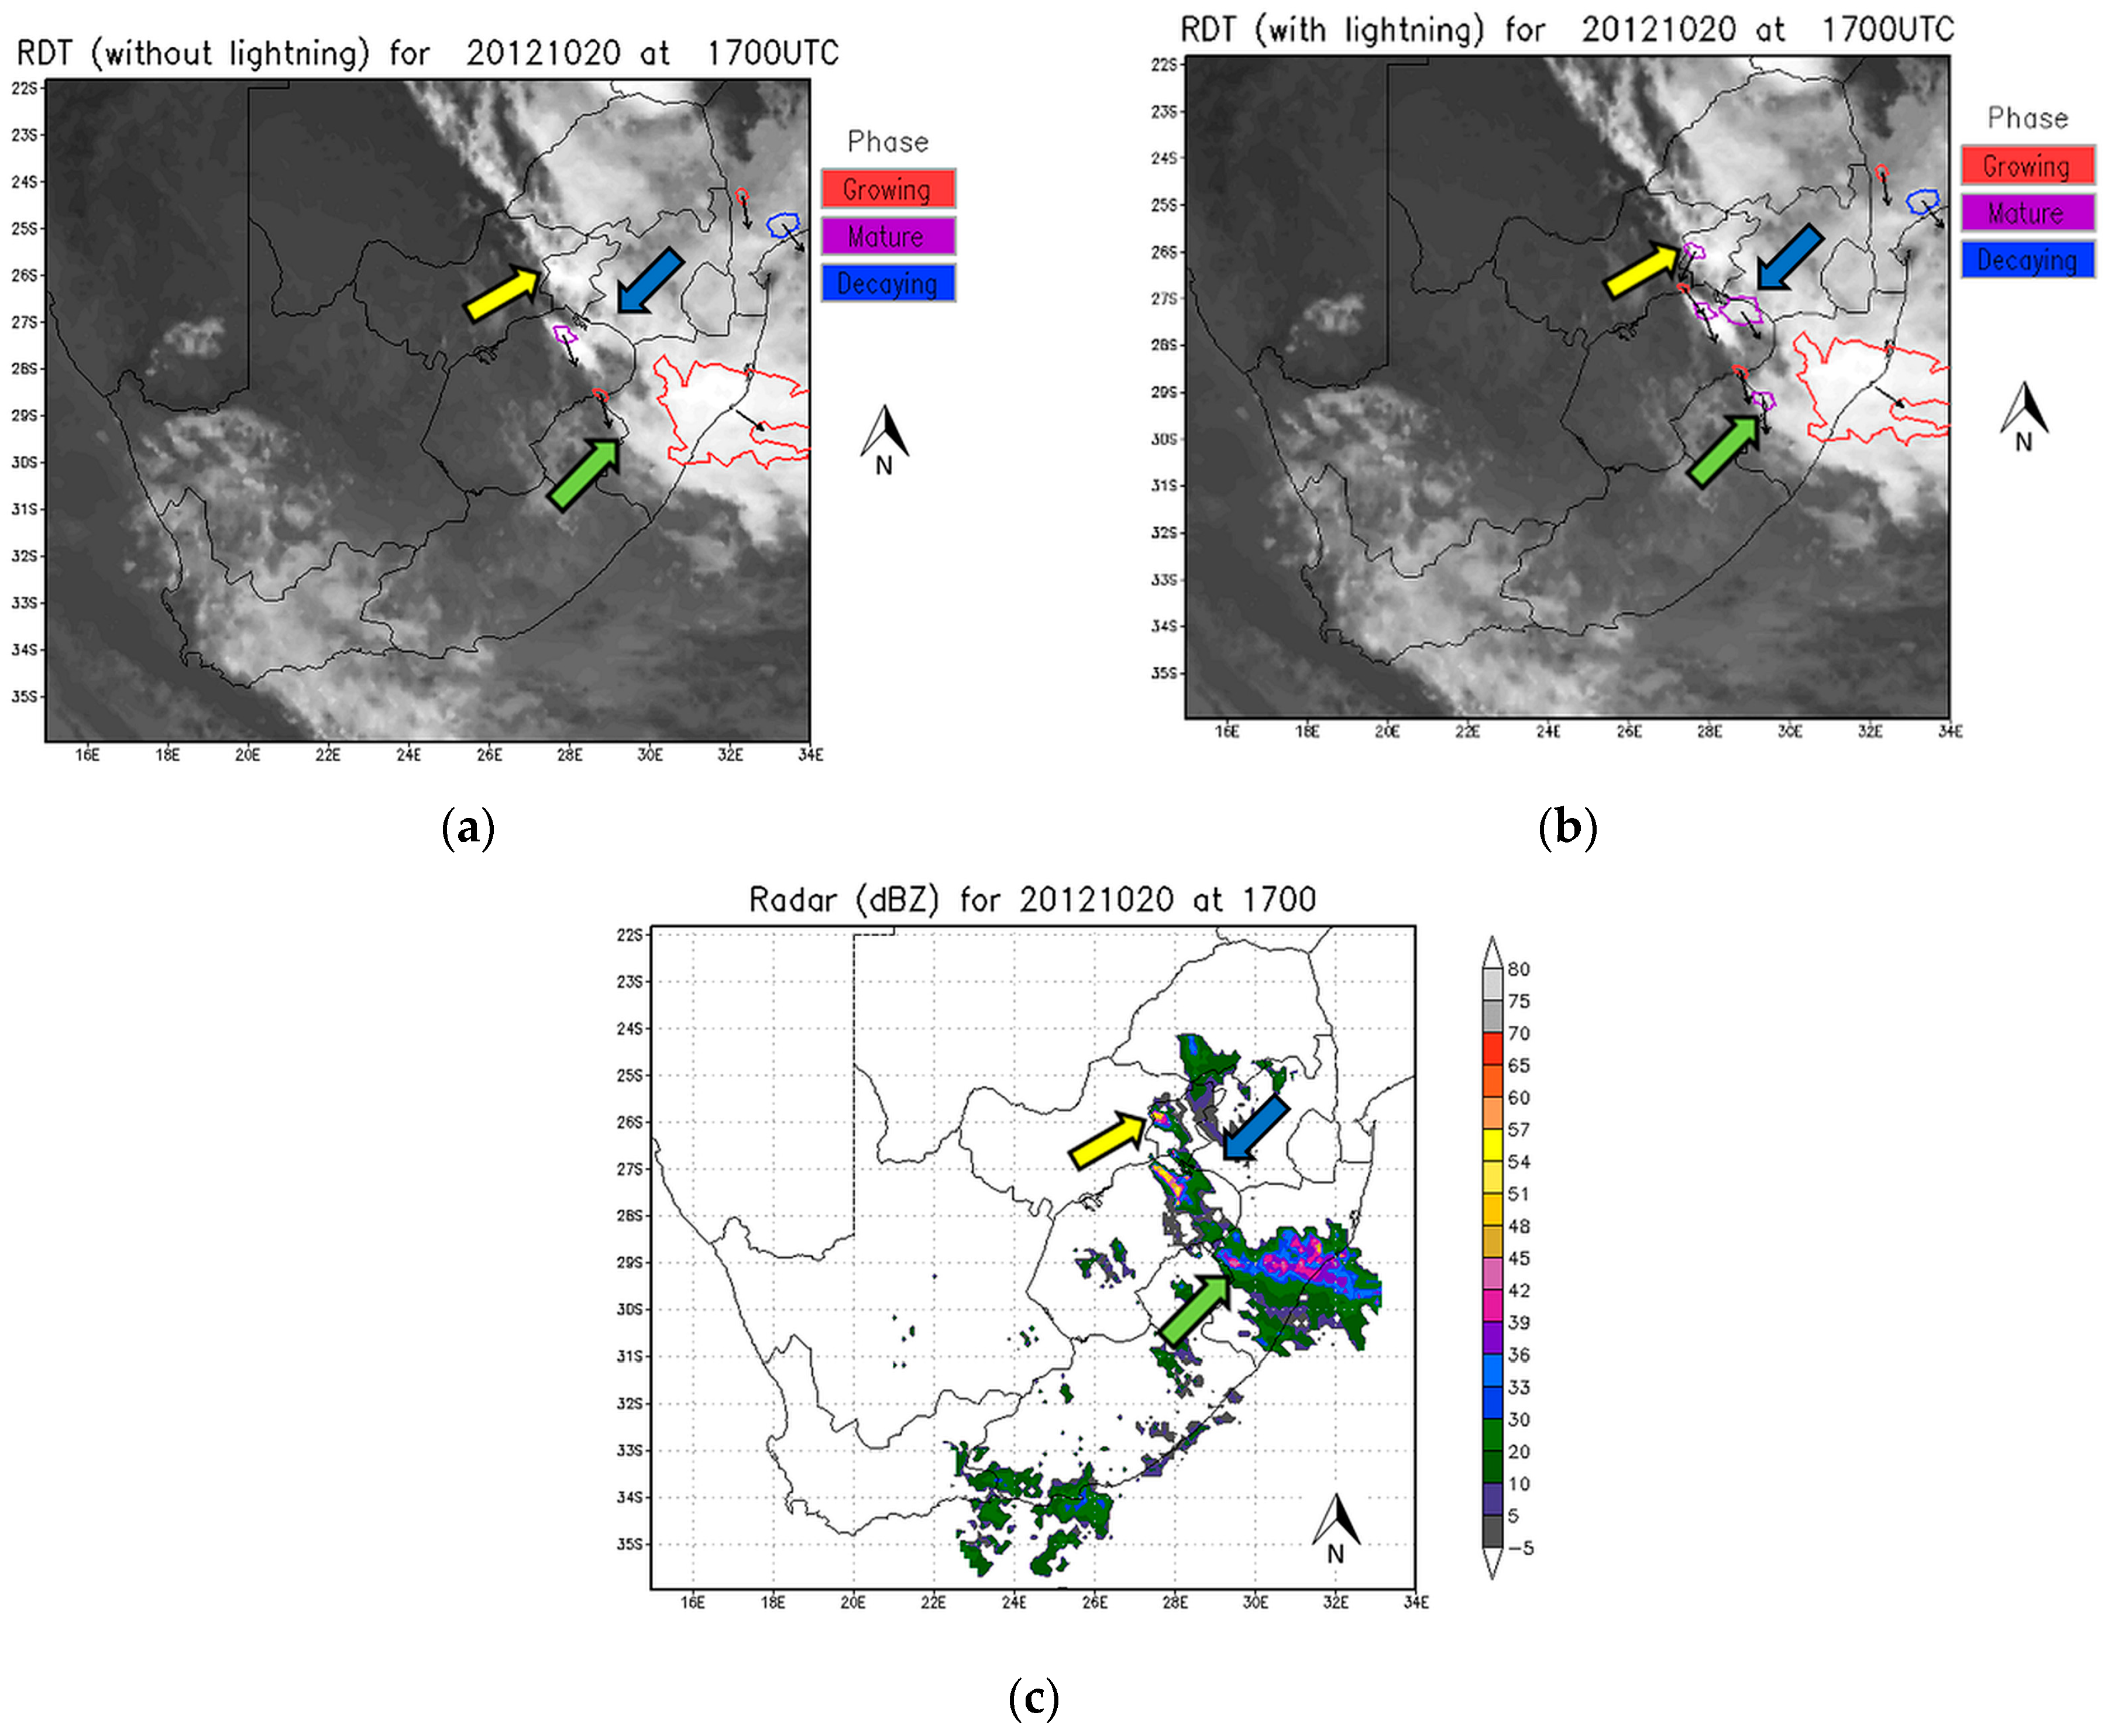
Twenty-five cases between September and March (convective season) were used to validate the RDT product that uses satellite and NWP data to identify and track more intense parts of thunderstorms, with and without lightning data included in the input dataset over South Africa. Statistical scores were calculated in an object-oriented way using radar reflectivity data greater than 35 dBZ from the SAWS radar network as ground truth for each time step between 1100 and 1800 UTC. In the majority of the cases, the inclusion of lightning data was beneficial to the RDT product. Changes could be seen when images for individual times were compared. In many cases, the inclusion of lightning data into the software led to the identification of convective storms that were missed based on MSG data alone. These convective storms could have been missed due to the MSG signatures either not satisfying the criteria for being classified as a rapidly developing convective storm or the NWP data could have declassified these storms. With the inclusion of lightning data, these storms were reclassified and added to the output as rapidly developing convective storms. The inclusion of lightning data also resulted in some of the storm phases being adjusted based on the amount of lightning activity. For example, some of the storms were originally classified as being in the decaying phase, and the inclusion of lightning into the software reclassified these storms as mature storms based on the electrical activity.
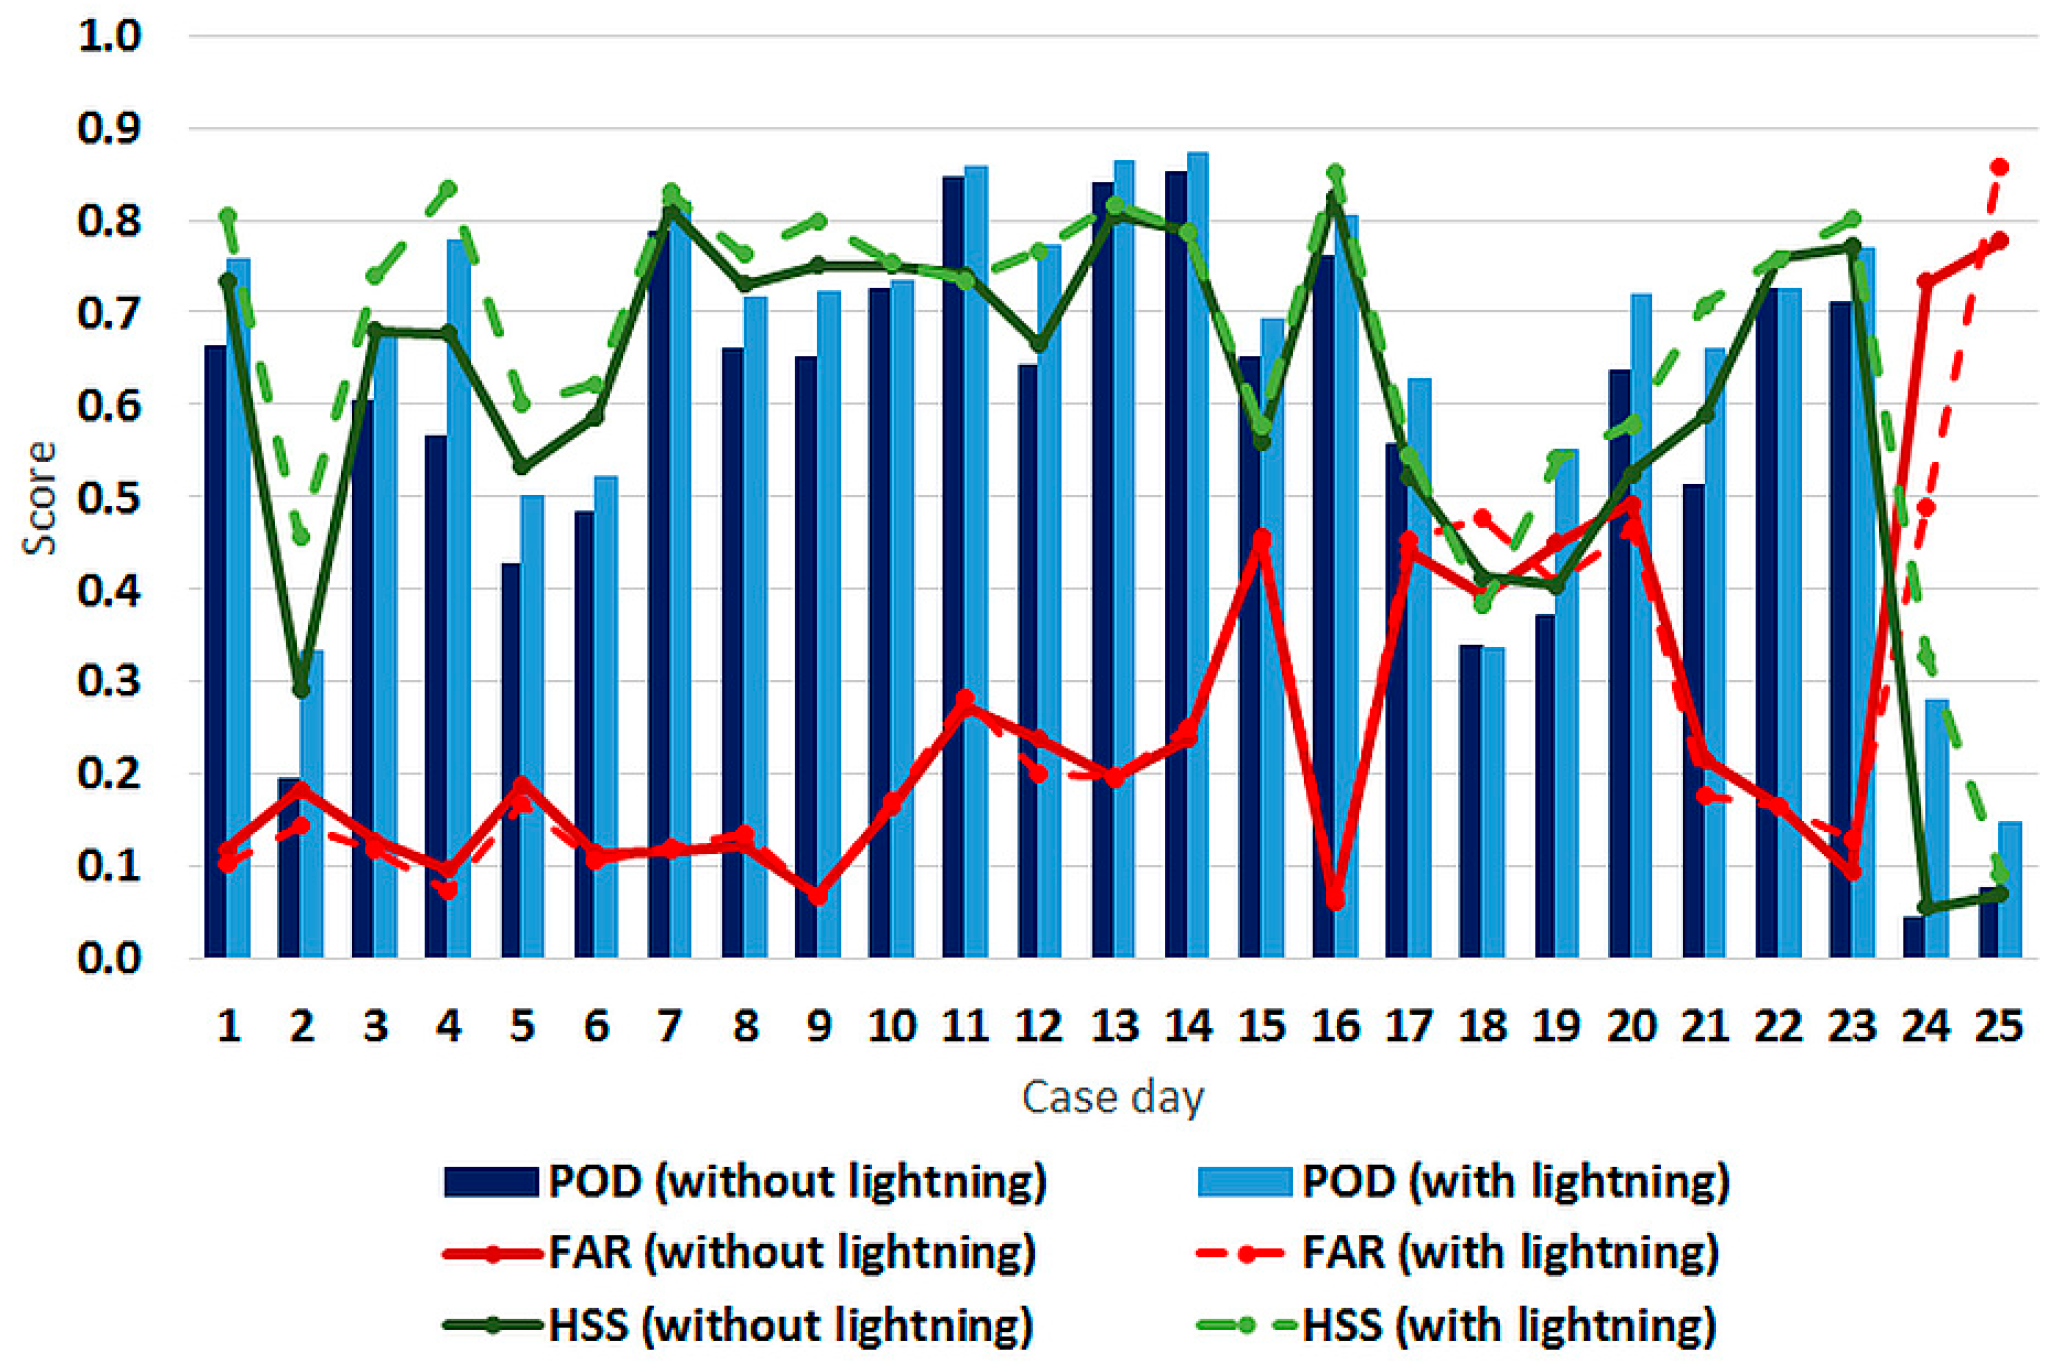
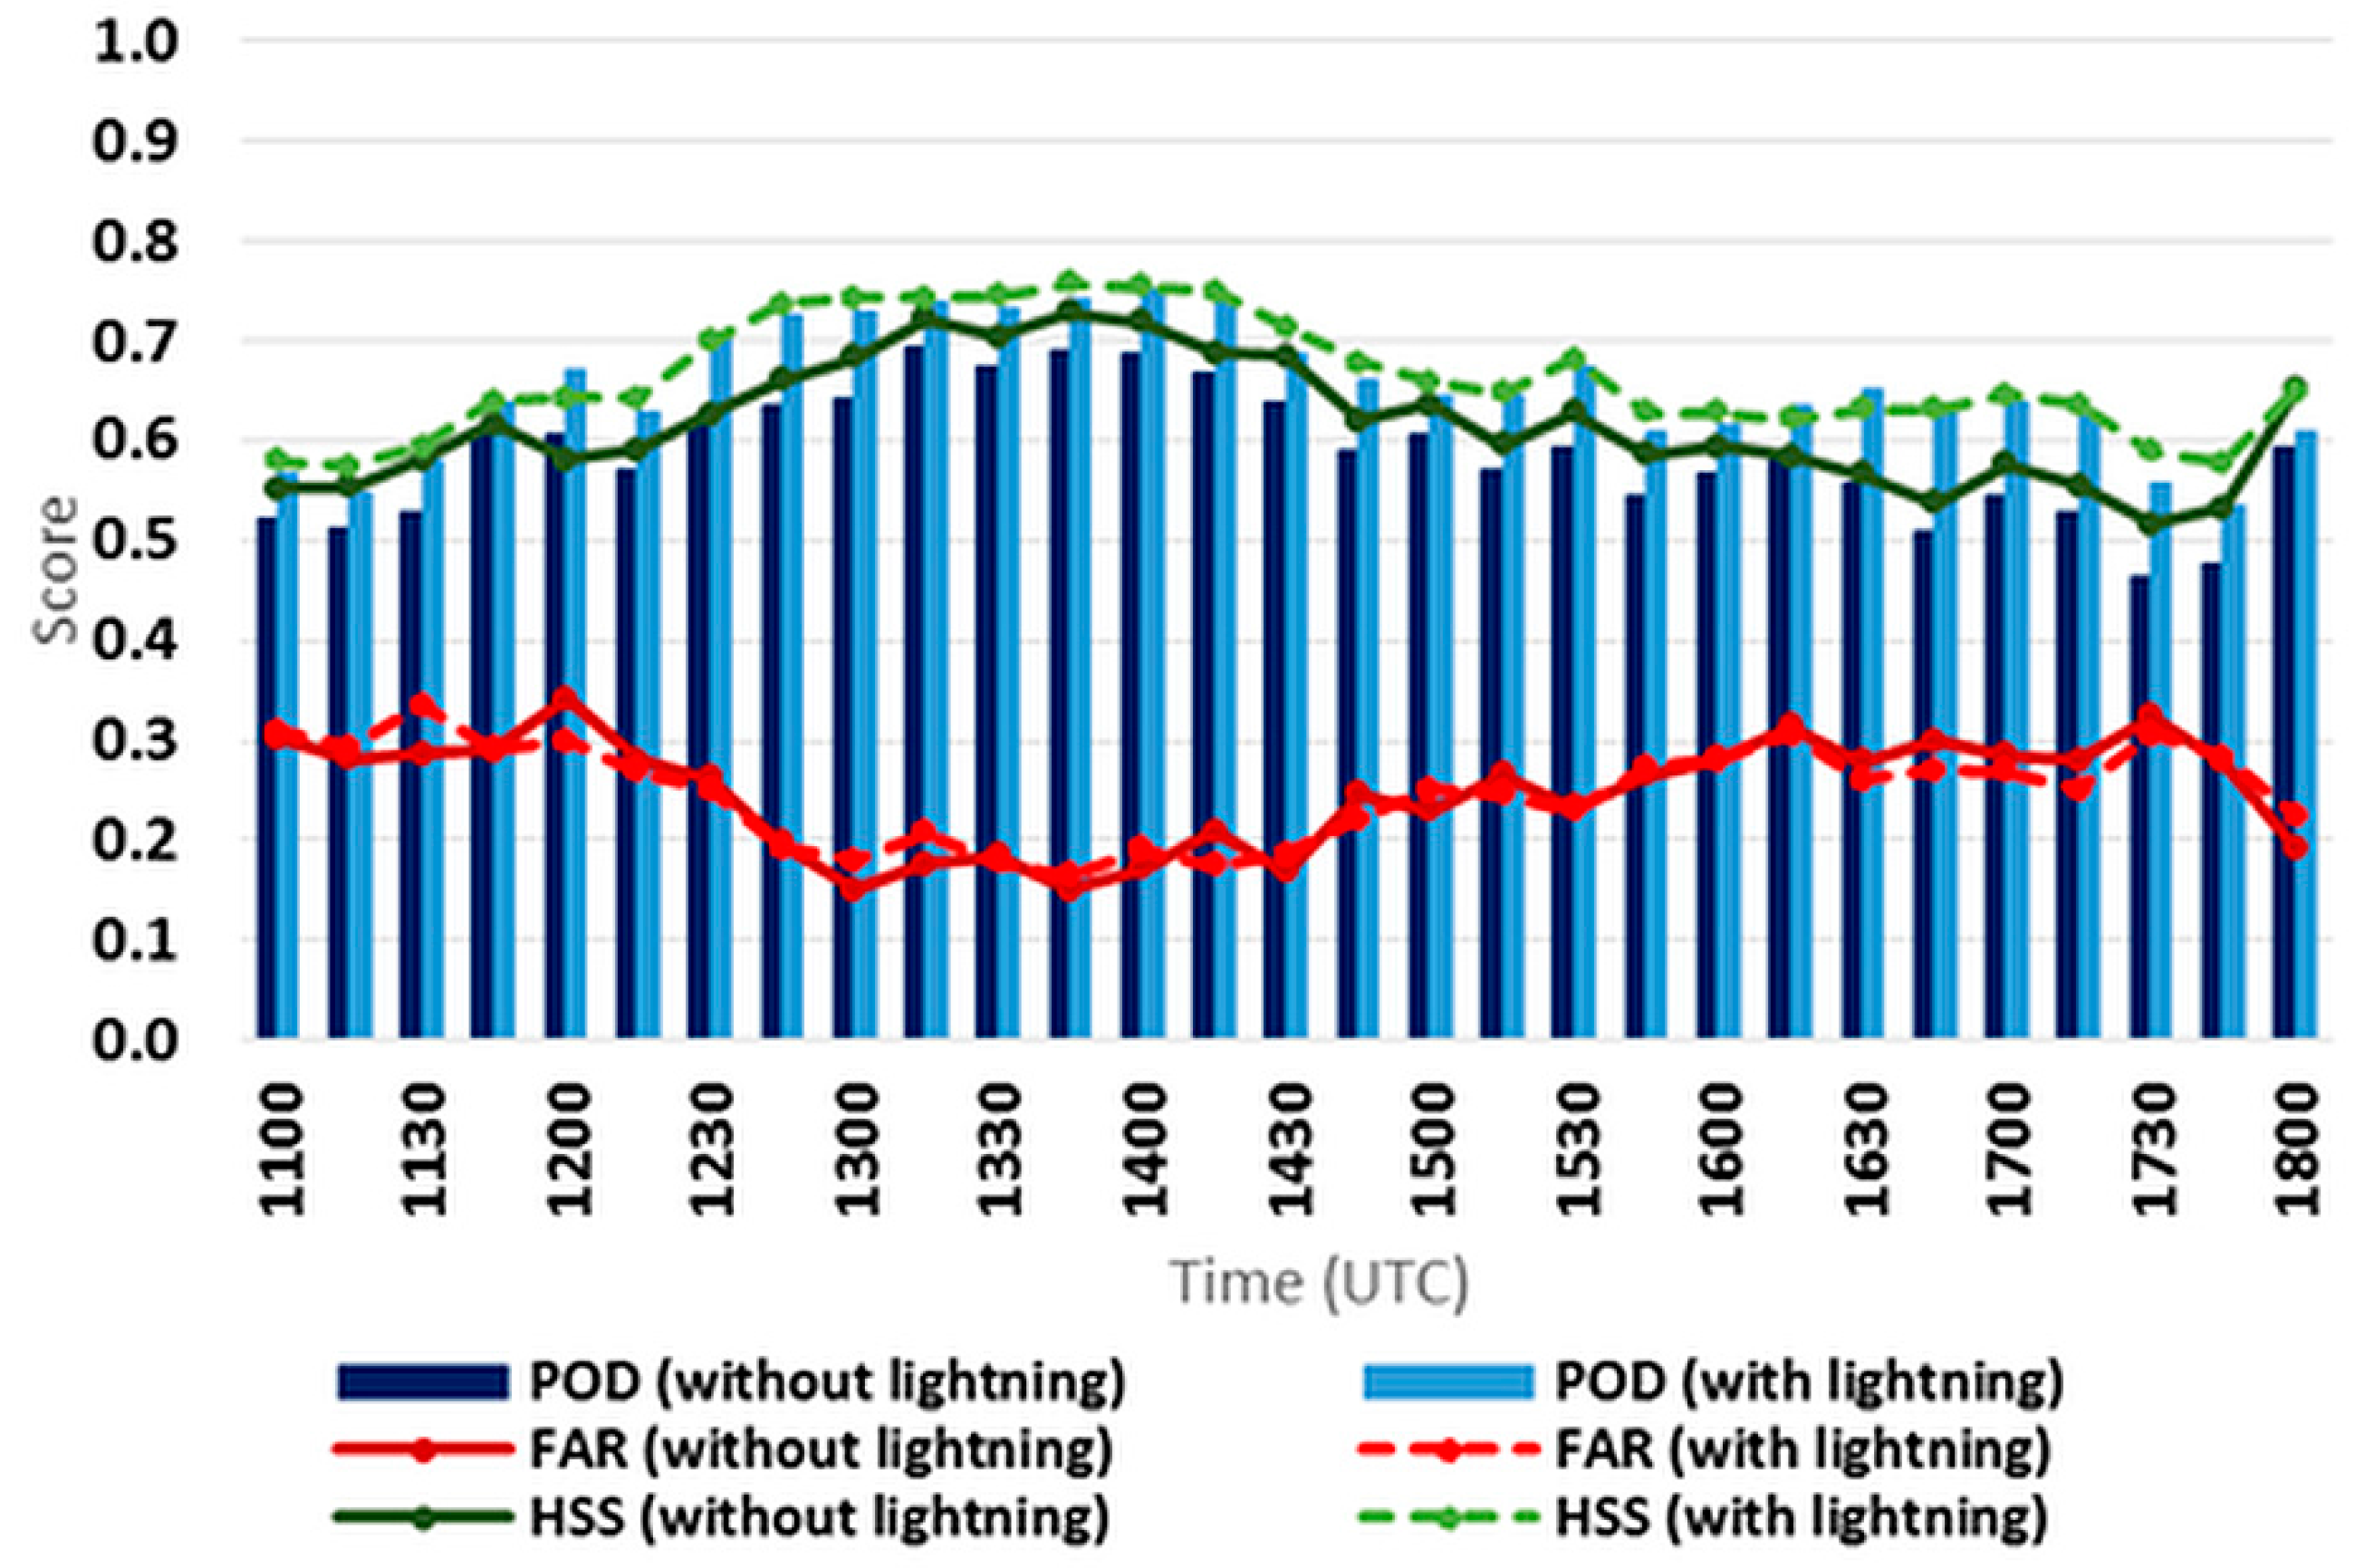
On average, for these twenty-five cases and for all time steps, the POD improved by 6.6% (0.59 to 0.65), the HSS by 4.6% (0.62 to 0.66), and the FAR by 0.1% (0.249 to 0.248) with the inclusion of lightning data. The POFD remained similar, but decreased in performance by 0.06% (0.0149 to 0.0155). For 21 of the 25 cases the HSS showed improvement when lightning data was included, in 23 of the 25 cases, the POD improved, the FAR remained similar, showing a marginal improvement in 13 of the cases and a marginal increase in 12 of the cases. The FAR did not change significantly when lightning data were included in the software since the aim of the lightning data is to force additional storms that are electrically active and were missed by satellite alone. Since none of the storm cells will be removed based on lightning data, an improvement in the FAR was not expected. The addition of a few electrically active cells that should be associated with reflectivity values exceeding 35 dBZ could have improved the overall FAR scores slightly since a few more hits could have been included in the FAR calculations without the number of false alarm being affected. The results from this study, however, show that the FAR remains similar and shows that the inclusion of lightning data does not have a negative effect on the FAR. These statistical results show that the RDT product performs well even when lightning data is not added to the software. The addition of lightning data further enhances the product to give an even better representation of the rapidly developing thunderstorms.
The results obtained in this study compare well with the evaluation performed on the RDT by the developers over Europe. The evaluations performed over Europe did not include lightning as input into the processing software of the RDT since they evaluated the product against lightning data. They found that (using a time step approach) for low lightning activity (RDT associated with at least one lightning flash) the POD was 0.63, the POFD was 0.015, and the FAR was 0.2. For moderate lightning activity (RDT associated with at least five flashes) the POD was 0.65, the POFD was 0.015, and the FAR was 0.2 [
7]. In this study, without (with) lightning added, the POD was 0.59 (0.65), the POFD was 0.015 (0.016), and the FAR was 0.249 (0.248).
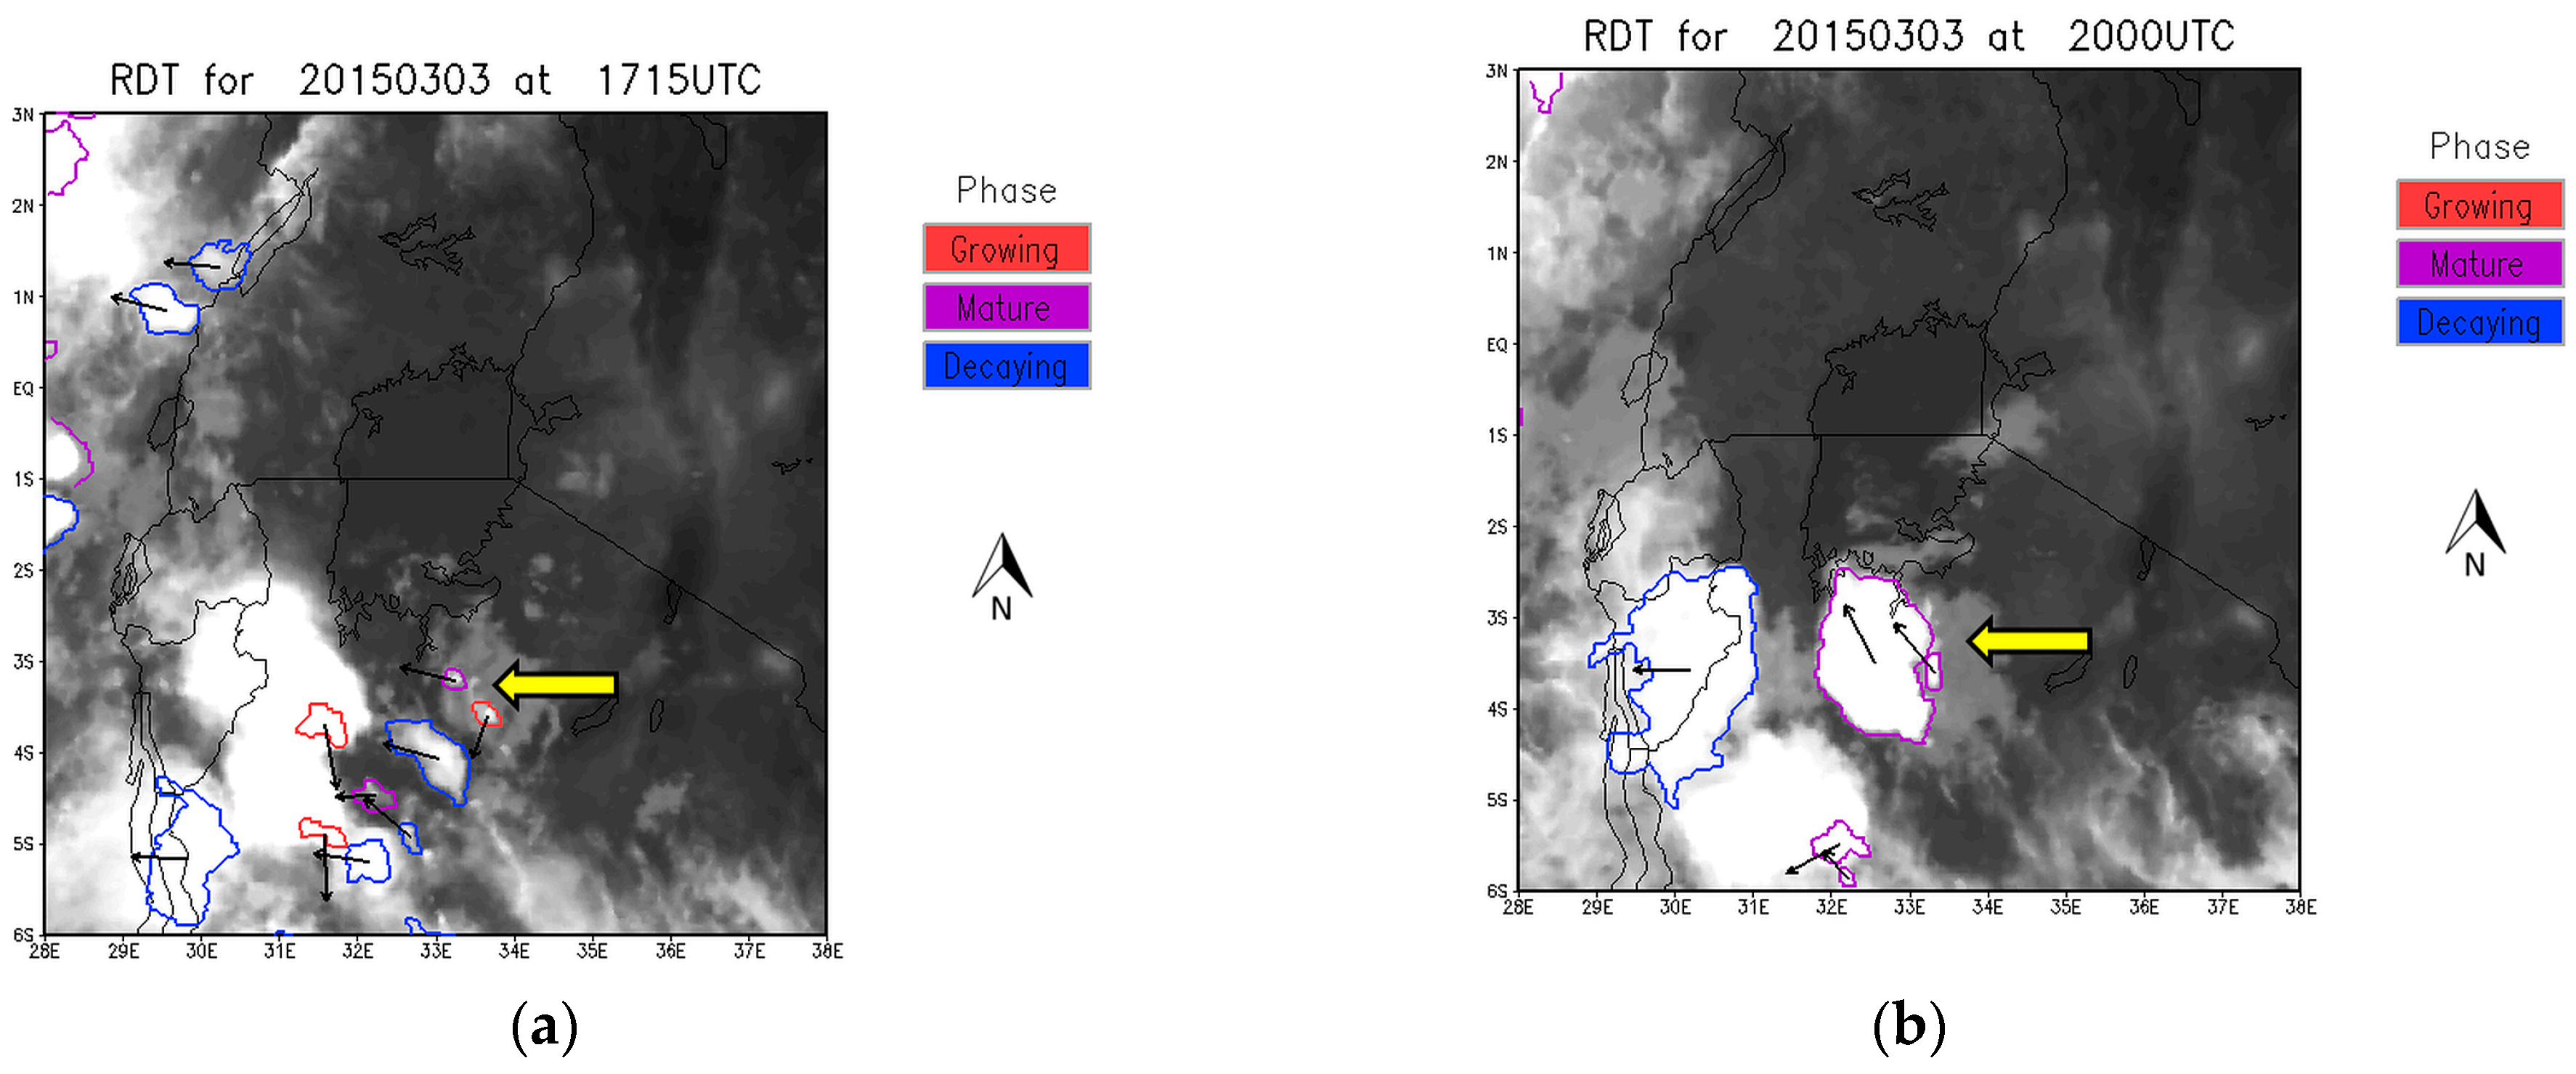
This work is specifically applicable for data sparse regions, where radar systems are not available. This includes areas over South Africa not covered by radar, as well as other southern African countries where very little observation networks are available. The MSG satellite covers the entire African continent and this makes MSG an ideal tool to monitor and track convection. By validating this product against the available radar systems in South Africa, it is evident that there is good agreement between the RDT polygons and radar reflectivity of more than 35 dBZ even when lightning data is not used as an auxiliary dataset. This should provide the needed confidence that countries without radar systems can see the RDT product as a very good second option to radar data for convection and severe convection. This is evident from the 3 March 2015 example in
Figure 8 over the Lake Victoria area, where the RDT identified rapidly developing storms at 1715 UTC, which developed into a severe thunderstorm with hail, strong winds, and heavy rainfall as can be seen at 2000 UTC.
The SAWS currently runs the NWC SAF software over the Southern African Developing Community (SADC) domain (African countries south of the equator), and makes the output of the RDT available on the Regional Specialized Meteorological Centre webpage [
29]. This forms part of the WMO SWFDP that aims to improve the forecasting of severe weather over developing and least developed countries by means of forecast information on a website [
2]. This website is accessible by all NMHS centers in the southern African SWFDP and provides valuable information to forecasters in data sparse countries. The RDT product is an extremely valuable tool over these countries and will be highly beneficial for the nowcasting of rapidly developing storms.
Future research options would include various aspects. Where lightning detection networks are available, these can be included into the input data or used as validation of the RDT (if lightning was not in the input dataset). When the next generation geostationary satellite for Europe and Africa is launched in 2019/20 by European Organisation for the Exploitation of Meteorological Satellites (EUMETSAT) in collaboration with the European Space Agency—the so-called Meteosat Third Generation (MTG)—a lightning imager will be on board, which will make lightning data for the entire African continent available. This will be a very rich source of data for this data sparse continent. Validation of how useful the RDT will be in this region with the MTG lightning data will have to be done, but should enhance the product over African countries.
The NWC SAF regularly upgrades the software suite and this is freeware available on the NWC SAF website [
10]. A new version for the NWC SAF was released in 2016 and this should improve the RDT product. One of the improvements in the 2016 version of the RDT is the addition of forecast tracks and can provide a 15, 30, 45, and/or 60 min forecast of storms [
30]. It will also be beneficial to evaluate the RDT product over South Africa for an extended period, preferably over the different seasons, but will depend on data availability and storage space. It would be recommended that as many countries as possible use satellite based nowcasting products, such as the RDT, to enhance nowcasting capabilities where other observations might be inadequate.


