
An Objective Prototype-Based Method for Dual-Polarization Radar Clutter Identification

1
LACS, Institute of Atmospheric Physics, Chinese Academy of Sciences, Beijing 100029, China
2
Australian Bureau of Meteorology, Melbourne, VIC 3008, Australia
*
Author to whom correspondence should be addressed.
Atmosphere 2017, 8(4), 72; https://doi.org/10.3390/atmos8040072
Submission received: 22 January 2017
/
Revised: 12 March 2017
/
Accepted: 31 March 2017
/
Published: 10 April 2017
Abstract
:A prototype-based method is developed to discriminate different types of clutter (ground clutter, sea clutter, and insects) from weather echoes using polarimetric measurements and their textures. This method employs a clustering algorithm to generate data groups from the training dataset, each of which is modeled as a weighted Gaussian distribution called a “prototype.” Two classification algorithms are proposed based on the prototypes, namely maximum prototype likelihood classifier (MPLC) and Bayesian classifier (BC). In the MPLC, the probability of a data point with respect to each prototype is estimated to retrieve the final class label under the maximum likelihood criterion. The BC models the probability density function as a Gaussian mixture composed by the prototypes. The class label is obtained under the maximum a posterior criterion. The two algorithms are applied to S-band dual-polarization CP-2 weather radar data in Southeast Queensland, Australia. The classification results for the test dataset are compared with the NCAR fuzzy-logic particle identification algorithm. Generally good agreement is found for weather echo and ground clutter; however, the confusion matrix indicates that the techniques tend to differ from each other on the recognition of insects.
1. Introduction
Polarimetric weather radar is employed for a wide range of applications, including rainfall rate estimation [1,2,3,4], drop size distribution retrievals [5,6,7,8], and hydrometeor classification [9,10,11,12,13]. The quality of all these radar products is affected by the correct identification of non-meteorological echoes, generally denoted in the radar community as “clutter”, including ground clutter, sea clutter, insects, etc. There are many varied filtering approaches to identify and remove different types of clutter from the radar meteorological echoes (e.g., [2]). However, after applying those filters, residual echoes of ground clutter and other non-meteorological targets, such as insects, exist on the radar measurements. Some of these are useful, e.g., Doppler velocities in clear air and regions with insects for data assimilation into weather prediction models [14], but for many applications including quantitative rainfall estimation, clutter should be recognized, classified and removed.
Many classification techniques have been proposed based on the polarimetric characteristics of radar echoes. Most of them can be categorized into three classes: (1) those based on a decision tree method (e.g., [15,16]), (2) those adopting a fuzzy logic framework [17,18], and (3) those using a training approach, such as a neural network [19] or a Bayesian method [20]. The major difference between the three types of techniques is the way that the polarimetric characteristics are used in the clutter identification scheme. In decision tree methods, polarimetric characteristics are summarized with logic decision thresholds, whereas fuzzy-logic algorithms allow these thresholds to cross each other to obtain a “soft” classification. The neural network and Bayesian method use training datasets to “learn” the relationship between clutter types and radar measurements.
The above-mentioned studies use the polarimetric variables as the discriminants for clutter identification. New discriminates can be developed to achieve a better performance than that of the conventional polarimetric radar measurements. Li et al. [21] proposed a simple Bayesian method, where the power ratio is combined with polarimetric variables to avoid the false detection of weather signals with zero velocity and small spectrum width. Hubbert et al. [22] and Hubbert et al. [23] presented the clutter phase alignment based on the phase variability of time series data for a certain radar range gate, and used the fuzzy-logic-based clutter mitigation decision for clutter echo identification.
As demonstrated in Wen et al. [11] and Wen et al. [12], clustering techniques provide an objective way to characterize the relationship between the polarimetric radar measurements and radar echo types because these techniques do not rely on predefined boundaries for the polarimetric variables of each hydrometeor type. However, the problems of discriminating non-meteorological from meteorological echoes, and further classifying non-meteorological echoes, were not treated in [11,12], as already post-processed radar datasets were used to focus on hydrometeor types exclusively.
This study extends the clustering approach [11,12] to the discrimination of weather echoes from a variety of clutter echoes. In this approach, we seek to objectively identify criteria that can be assigned to different scatter types, including hydrometeors and various clutter types. To do so, clusters are derived using a series of volumetric PPI scans. These clusters are individually investigated using the same technique as that described in [11], and they are then promoted as prototypes of weather or different clutter types. Each prototype is represented as a Gaussian distribution associated with a weight. Finally, the maximum prototype likelihood classifier (MPLC) and Bayesian classifier (BC) are used to automatically discriminate the echo types based on the likelihood between the data and prototypes, and posterior probability, respectively, in a high-dimensional phase space defined by radar measurements [12]. In comparison with other training approaches, such as the neural network and Bayesian methods, the prototype-based method requires a smaller amount of training datasets to optimize a probabilistic model. Each individual prototype is derived from a subset of training data, and more prototypes can be added as more radar data becomes available [11]. This paper aimed to test the feasibility of the prototype-based method for the clutter identification problem. Further studies will be conducted to merge the algorithm into the particle identification system described in [11,12] to obtain a robust radar echo classification for ground-based weather radars.
Section 2 reviews the polarimetric characteristics of clutter echoes. Section 3 describes the radar and its measurements used in this study. Section 4 recalls the principle of the clustering technique based on the Expectation-Maximization algorithm and the prototype-based classification method. Section 5 presents the main results of three cases observed by the CP-2 S-band radar and compares with the National Center for Atmospheric Research (NCAR) fuzzy-logic particle identification algorithm. Finally, Section 6 summarizes this paper
2. Review of Polarimetric Signatures of Clutter Echoes
It is well known that the radar signals associated with clutter have distinctive characteristics according to variations in cross-sections of the scatterers between two orthogonal polarizations, a different spatial variability with range compared with weather echoes [15,17] and differences associated with side lobes in the beam patterns in the case of ground clutter [24].
Ground clutter detection has used the textures of reflectivity fields [17], and for non-polarimetric radar, vertical profile of reflectivity has also been used to assist clutter detection taking a Bayesian approach [25]. Polarimetric radars offer more opportunities for ground clutter discrimination, e.g., Zrnić et al. [26] investigated probability distributions of correlation coefficient for ground clutter, and Ryzhkov and Zrnić [27] considered < 0.7 and > ~10°–12° (variation of differential phase) as a robust criterion for rejecting ground clutter using S-band polarimetric radar observations of summer storms. Giuli et al. [28] used the texture of differential reflectivity Zdr to detect clutter regions. In the Joint Polarization Experiment (JPOL), a fuzzy-logic system was adopted to classify ground clutter and biological scatterers with radar reflectivity Zh, differential reflectivity Zdr, correlation coefficient and textures of Zh and differential phase [29]. Power spectrum can also be used to discriminate weather and clutter signatures from Doppler radars [30].
Sea clutter are due to (1) the diffraction or specular reflection from the water surface, (2) backscattering of the droplets of spray lifted by the wind, and (3) small facets or patches drifted on the sea surface with backscattering properties similar to inclined plates. The electromagnetic waves interact with the above scatterers to produce radar echoes. Thus, sea clutter is often observed on the lower elevation scans, typically with large Zh, very low , and Doppler velocity less than 5 m·s−1 [31]. Differential reflectivity is highly azimuthal dependent due to wind effect. The crests of breaking waves largely contribute to the radar reflectivity at the horizontal polarization. In contrast, the capillary waves on the slopes of larger-scale wind-driven waves affect the values of vertical radar reflectivity. Therefore, Zdr exhibits a distinct feature if the wind direction is parallel to the electrometric wave compared to when the wind is perpendicular to it.
Biological echoes are often considered as radar clutter and are eliminated before quantitative precipitation estimation and radar data assimilation. A fuzzy-logic approach has proven to be efficient for WSR-88D radars [10,29]. For Doppler radar data, insect echoes are a passive tracer for air motion. However, birds/bats have different Doppler velocity characteristics from wind fields [32,33,34]. Zhang et al. [35] and Liu et al. [36] identified the velocity contamination of migrating birds for WSR-88D radars. This method eliminates the Doppler velocity sweeps rather than a single contaminated range gate, thus some useful information in the radar data is discarded by this technique. Insects and birds/bats cannot be simply identified by using the texture or vertical profile of radar reflectivity or Doppler velocity, because they have similar features to that of stratiform rainfall. Zhang et al. [37] demonstrated that polarimetric radar can not only separate meteorological and non-meteorological echoes, but also discriminate birds and insects. Polarimetric variables, such as Zdr and , have signatures very distinct from weather echoes. Differential reflectivity for insects can reach up to 10 dB, whereas that for birds/bats is significantly lower (−1–3 dB). Correlation coefficient for the two types exhibits very low values, typically 0.3 to 0.5 in the case of study [38]. However, the model study shows some asymmetry pattern of insects along the azimuths [39], due to variation of orientations and species of insects illuminated by a simultaneously transmitted and received radar.
3. Radar Measurements
This study utilizes the CP-2 S-band polarimetric weather radar located at Redbank Plains (Latitude 27°40.0′ S, Longitude 152°51.5′ E) near Brisbane on the coastal zone of eastern Australia [40]. The scanning strategy of the CP-2 radar is a series of nine- or ten-tilt volumetric PPI scans, scanning at 0.5, 1.0, 1.5, 2.0, 3.0, 4.0, 6.0, 9.0, 12.0, and 17.0 degrees. The temporal resolution for PPI scanning is 6 minutes, the azimuthal resolution is 1°, the radial resolution is 150 m, and the maximum range is 142 km.
In this study, three CP-2 S-band radar measurements are investigated: (1) reflectivity factor at the horizontal polarization (Zh), (2) differential reflectivity (Zdr), and (3) cross-correlation coefficient between horizontally and vertically polarized radar signals at zero lag (). In addition to explicit values of these variables, their textures are used to examine various gate-to-gate relationships in Zh, Zdr, and differential phase shifts on propagation . Texture is calculated as
where a and b are the azimuth and range of a gate, respectively, m and n are the number of bins and adjacent beams used for processing the texture, respectively. For CP-2 radar data, m = 7, and n = 1 were chosen. Results presented thereafter are found to be insensitive to slight variations of these parameters. This study used a symmetric padding to process the borders, i.e., the values of padding points are a mirror reflection of the borders. If a missing value exists within the calculation range, the texture is not used, but the other variables are considered. Six data fields are input to the clustering algorithm, where , , and are the textures of Zh (dBZ), Zdr (dB), and (degree), respectively. In addition, is corrected with signal to noise ratio following the procedures in [41].
4. The Prototype-Based Method
The objective of clustering of radar data is to derive the statistics of polarimetric radar parameters associated with each type of radar echo. The first step of this work is to build a training radar dataset large enough to include all possible types of radar echoes. In this study, the training dataset contains radar observations of 22 time periods, which are listed in Table 1. For each period, this study inspected the polarimetric observations and provided a visual interpretation for each radar scan. Although it may seem subjective, it is important to note that such visual inspection is a very powerful tool to classify radar echoes as in-situ measurements are generally unavailable. The challenge is to convert that knowledge into an automatic classifier, which is the objective of this study. This manual classification is to provide some qualitative evaluation of the automated classification techniques. Such an approach was also successfully adopted in [20]. This study also set aside 17 cases in a test dataset (Table 2). These cases are not included in the training dataset to provide an opportunity to evaluate the classification technique on an independent dataset.
4.1. Clustering of Radar Data
To obtain the relationship between the polarimetric measurements and a variety of echo types, this study used a clustering technique similar to that used for CP-2 radar hydrometeor identification. Details about this technique are discussed in detail in [11].
Figure 1 shows the flowchart of the clustering procedures and the prototype-based classification method. Prior to the application of the clustering procedures, an initial step is used to separate the data above the sea and above the land according to the location of the Australian eastern coastline. This is useful because the polarimetric signatures of sea clutter and ground clutter are similar. The clustering technique is applied individually on each dataset sorted by the coastline location. An Expectation-Maximization (EM) clustering based on Gaussian Mixture Models (GMMs) is applied to group the data objectively. Initials of the cluster means and covariances are obtained by a K-means algorithm with assumptions that the cluster number is larger than the number of echo types to be identified in the classification steps. This study assumes five clusters above the ground and three above the sea. The obtained clusters are associated with one of the clutter types by interpreting the radar returns and comparing the clusters to typical classification boundaries for radar echoes in previous studies (e.g., [17,26,42]). The boundaries used in this study are summarized in Table 3. Four types of radar echoes are identified in the training dataset, including ground clutter (GC), sea clutter (SC), insects (IN), and weather echoes (WE). The accurate identification of the IN category is critical for some applications, especially radar data assimilation, since Doppler winds associated with the IN pixels can be directly assimilated in models. These clusters are promoted as prototypes, each of which is modeled as a Gaussian function with a weight. To reduce the computation complexity caused by the increasing prototype number, a Kullback-Leibler divergence approach [43] is implemented to select and merge the prototypes with similar means and covariances, but retain the original shape composed by all the prototypes together. Finally, these prototypes are organized in a collection by normalizing the weights associated with the Gaussian functions.
In this study, 358 prototypes were obtained from the training dataset: 131 prototypes for GC, 60 for SC, 127 for IN, and 40 for WE. Figure 2 illustrates the means of these prototypes with a color corresponding to each clutter type for selected pairs of polarimetric variables used as inputs. The prototype collection is maintained in a database and then utilized by the classification algorithm. Figure 2 shows that the Zh-Zdr pair is clearly the most powerful pair to identify IN, since most of the prototype means have Zh < 30 dBZ and Zdr > 3 dB. Weather echoes can be discriminated from non-meteorological echoes, as they are characterized by high ( > 0.8) and lowest values of the Zh and Zdr texture fields associated with Zh > 5 dBZ. The pair of Zh- has high information content for discriminating the GC/SC with > 2 dBZ, IN with Zh < 30 dBZ and 1 < < 5 dBZ, and WE with Zh > 5 dBZ and 1 < < 4 dBZ. In comparison with Zh-, the pairs of Zh- and Zh- are also found to have good discrimination power to identify IN, GC, and SC from WE.
4.2. Automated Classification of Radar Data
The prototype collection is computed once and for all from the training dataset, and pre-stored to proceed with the classification algorithm. The MPLC and BC are then used to classify the radar echo types from a new scan.
In the MPLC, each prototype is modeled as a Gaussian distribution, P, associated with a weight . The probability of a data vector, , with respect to each prototype is calculated by
where d, and are data dimensionality (six in this study), mean and covariance of the prototype, P, respectively. The probability of to be generated by P is measured in terms of a likelihood function,
To determine a label for , the class C associated with P is retrieved and assigned to , that is
where “arg max” stands for the argument of the maximum, i.e., the class label given argument for which the given function attains its maximum value.
The BC models the probability density function as a Gaussian mixture composed by a number of prototypes, which is formulated as
If the prior probability is given as , the posterior probability is calculated as
Under the maximum a posterior criterion, the final class label is obtained by
5. Results and Discussion
The methodology to assess the performance of the prototype-based technique is to use the “manual” classification of some clutter features as reported in Table 1, Table 2 and Table 3. This study also compares the results with those from the NCAR particle identification algorithm [44]. The NCAR algorithm is a fuzzy-logic-based method that achieves a soft transition in polarimetric measurements among particle types instead of simple thresholds. It uses nine inputs, including Zh, Zdr, LDR, , Kdp, a temperature profile, and textures of radial velocity, Zdr, and , whereas LDR, Kdp, and ambient temperature are not considered in the prototype-based method, as these variables do not have exploitable signatures for non-meteorological echoes. Furthermore, the texture of Doppler velocity is not used, either, to avoid removing some echoes related to turbulence. The NCAR algorithm identifies 17 categories of radar echoes, within which 14 are hydrometeors and three are non-meteorological echoes, including flying insects, second trip echoes, and ground clutter. This study focuses on comparisons between types of non-meteorological echoes; therefore, the 14 hydrometeor types are combined to compare with WE in the prototype-based methods, while the second trip echoes are marked as unknown (UN) and ground clutters are separated as GC and SC following the location of the coastline. It is important to note that the membership functions used in the NCAR fuzzy logic algorithm have not been tuned to the local meteorology.
5.1. Assessing Performance with Training Dataset
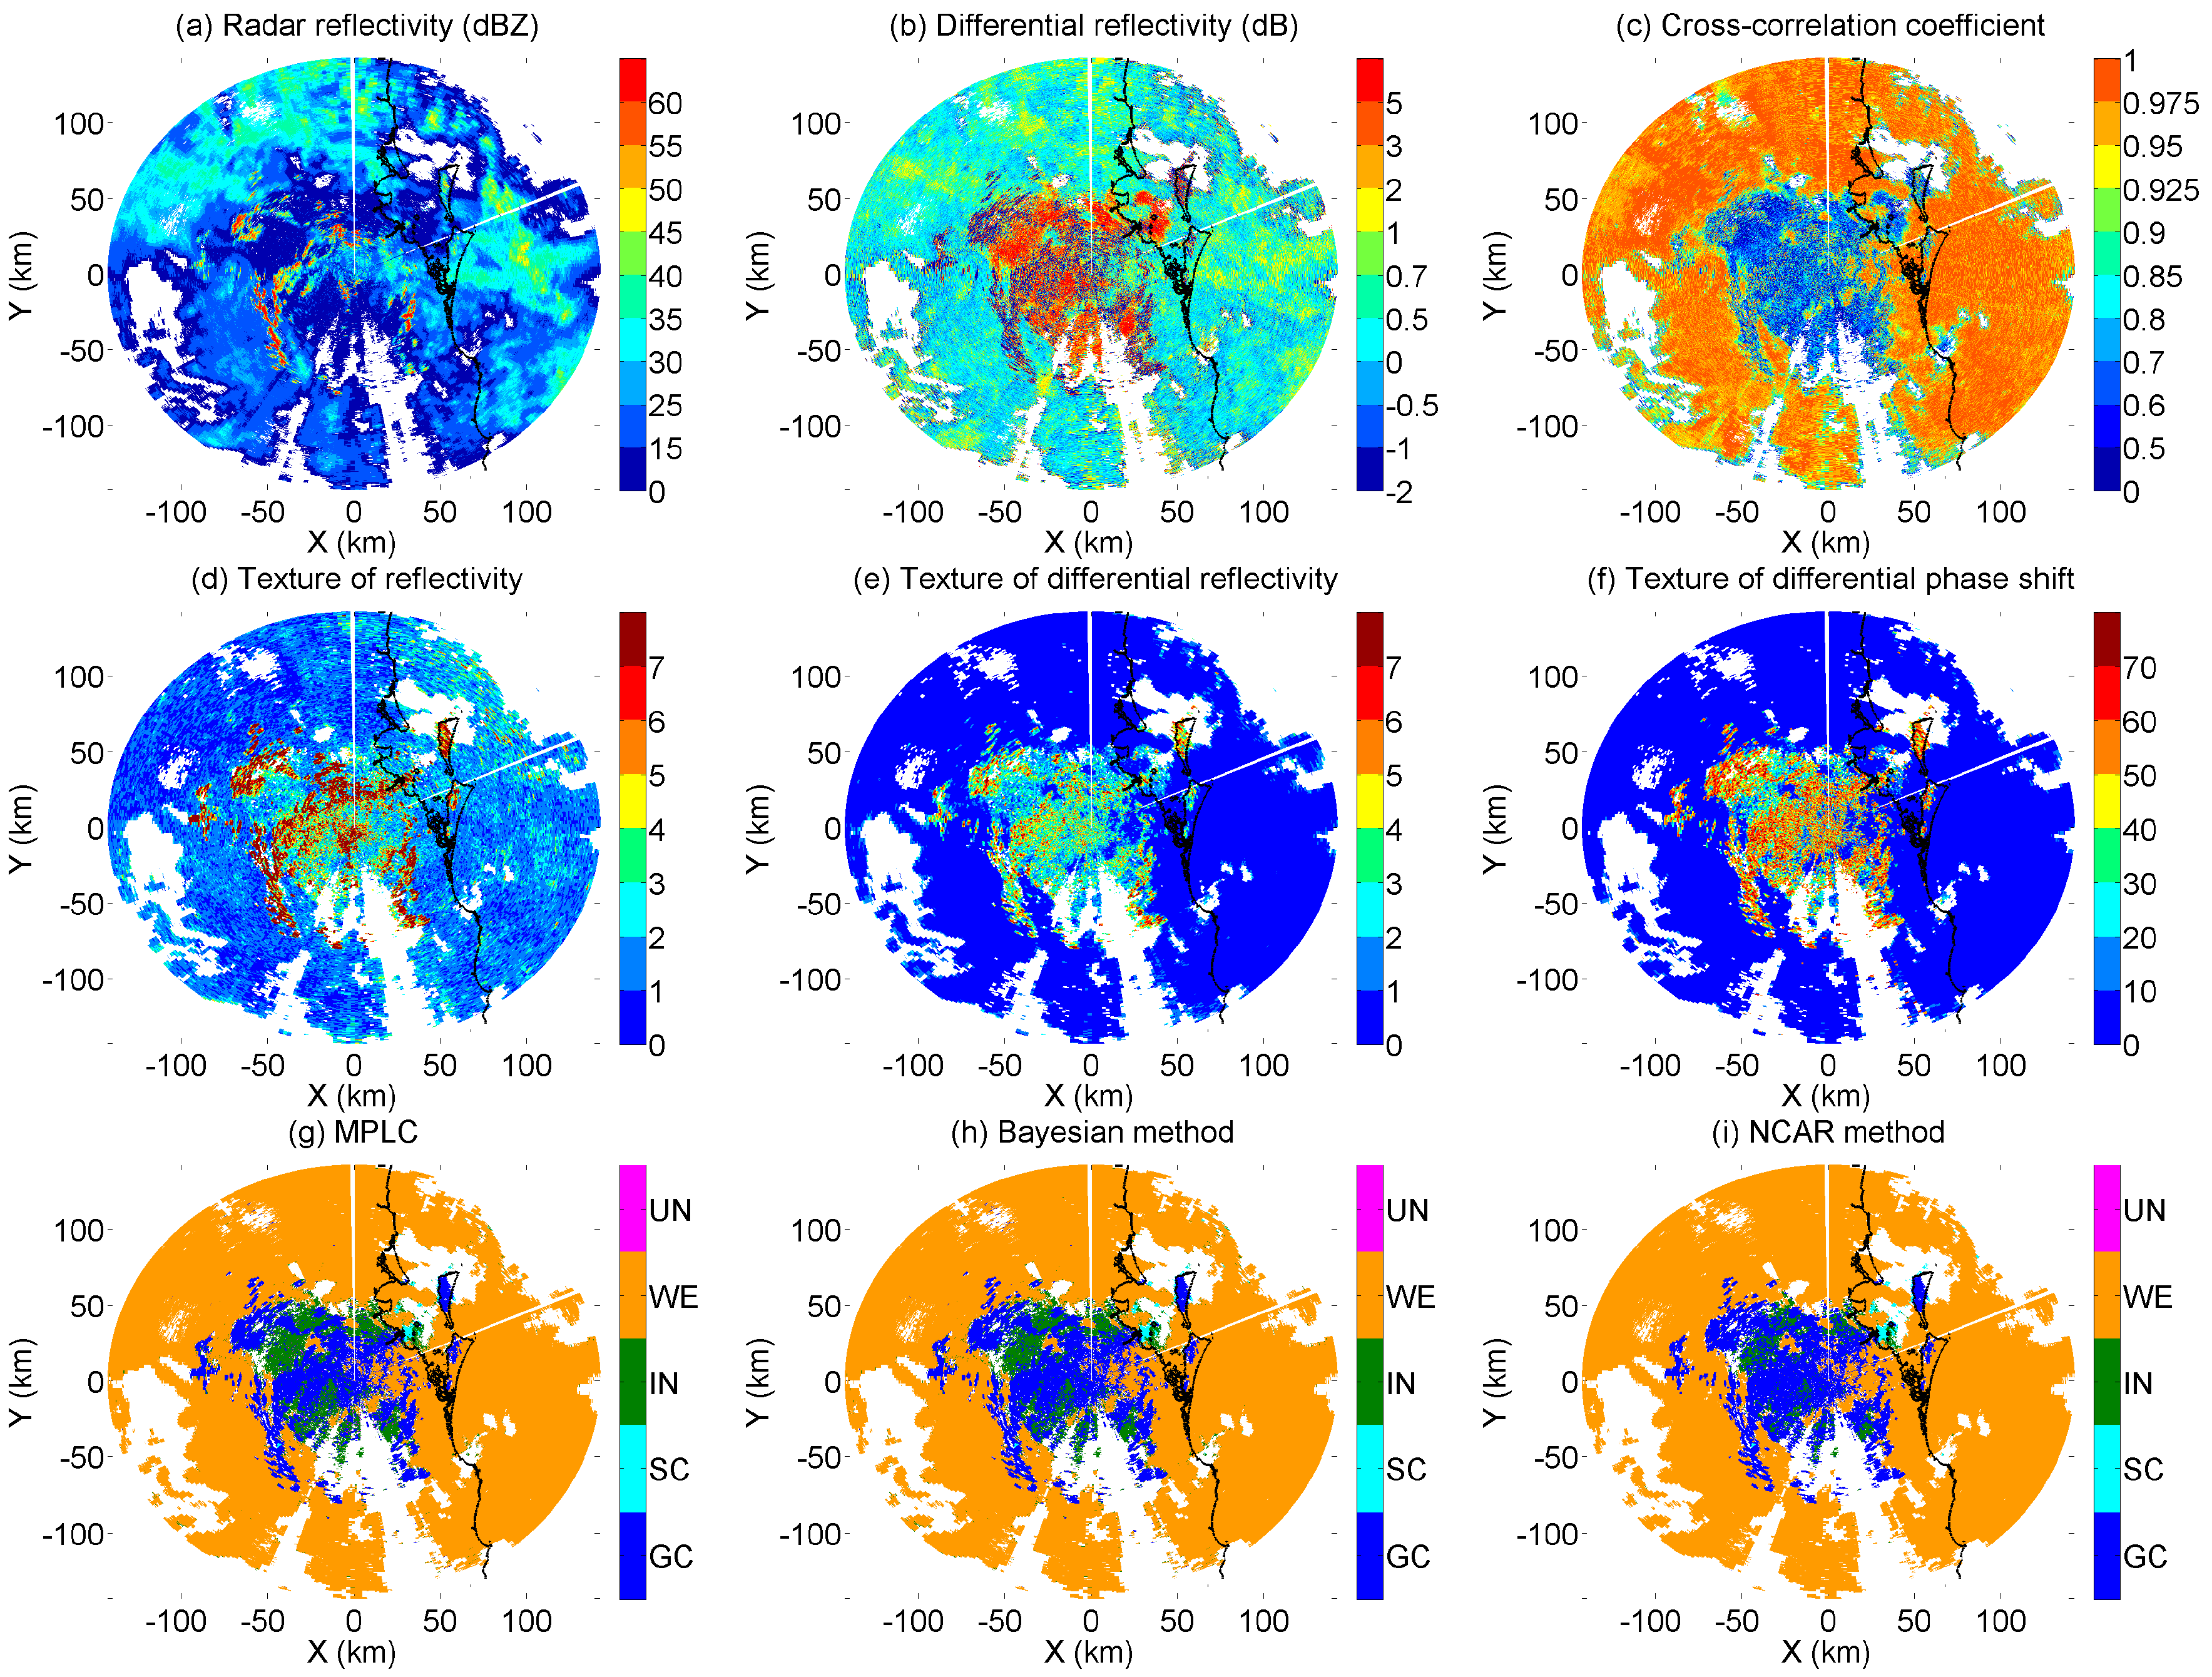
The prototype-based method is first applied to the training dataset (Table 1) to examine the consistency of classification. Figure 3 illustrates the CP-2 radar data and identification results at a 0.5° elevation angle on 1033 UTC, 8 November 2008. Weak radar reflectivity is observed in 50 km from the radar site, they are likely to be insects as described in the hydrometeor classification algorithm [10]. Low values of (Figure 3c), large values of Zh (Figure 3a) and highly textured Zdr (Figure 3e) exist within and outside the insect region, indicative of clutter on these locations. Similar echoes are also found on two islands off the east coast. Stratiform rain is developing outside 50 km away from radar characterized by 15–30 dBZ reflectivity.
The MPLC and BC (Figure 3g,h) can effectively discriminate GC from uniformly distributed stratiform precipitation by comparing to the NCAR fuzzy-logic method (Figure 3h). The region associated with Zh < 15 dBZ (Figure 3a), Zdr > 3 dB (Figure 3b), and < 0.7 (Figure 3c) is dominated by biological scatterers. The local time is 20:30 in the evening, these echoes are likely produced by insects. The MPLC, BC, and NCAR method identify these echoes as IN, whereas the IN area in the NCAR method is smaller than that the other two algorithms. As migrating birds are not often observed in southeast Queensland [20], this study was not able to build a reliable probability density function for Bayesian classification. As a result, the bird echoes would be classified as unknown (UN) if present. In addition, previous studies [37,38,42] demonstrated meteorological echoes are associated with much higher values (close to 1) of than GC and IN. These criteria are summarized in Table 1. The identifications of WE in MPLC and BC are generally consistent with that in NCAR.
5.2. Application to Independent Test Datasets
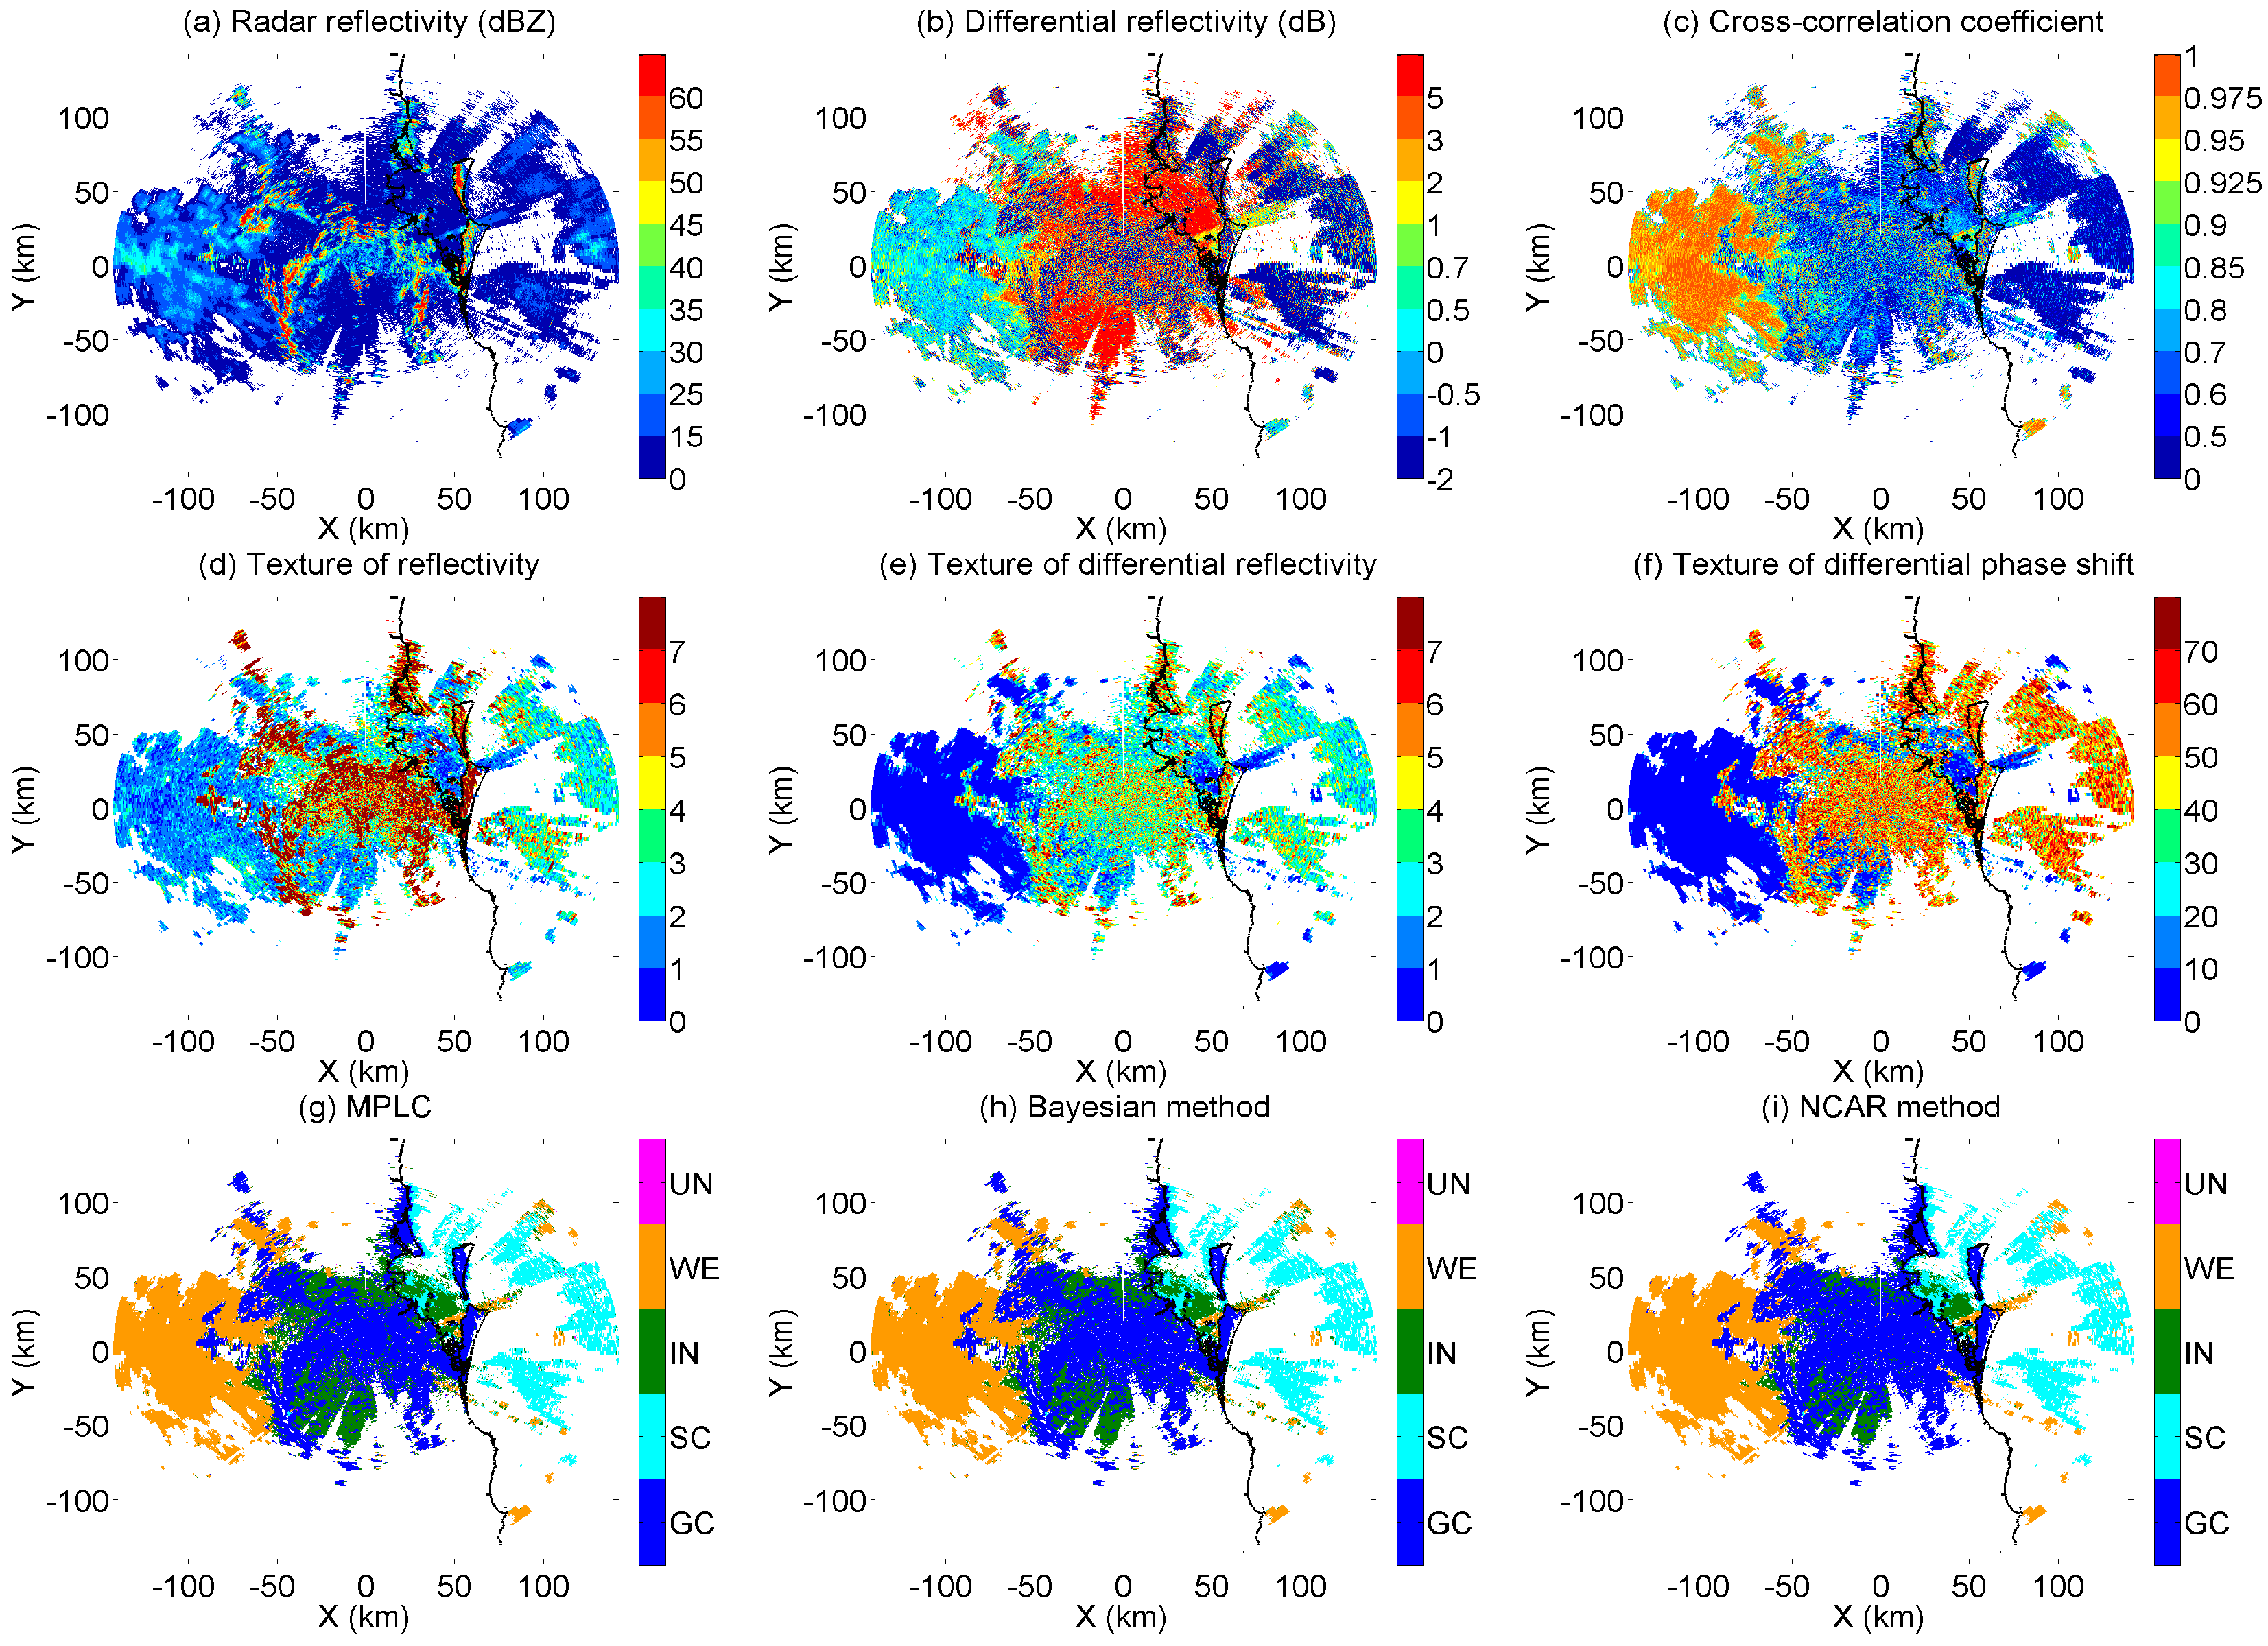
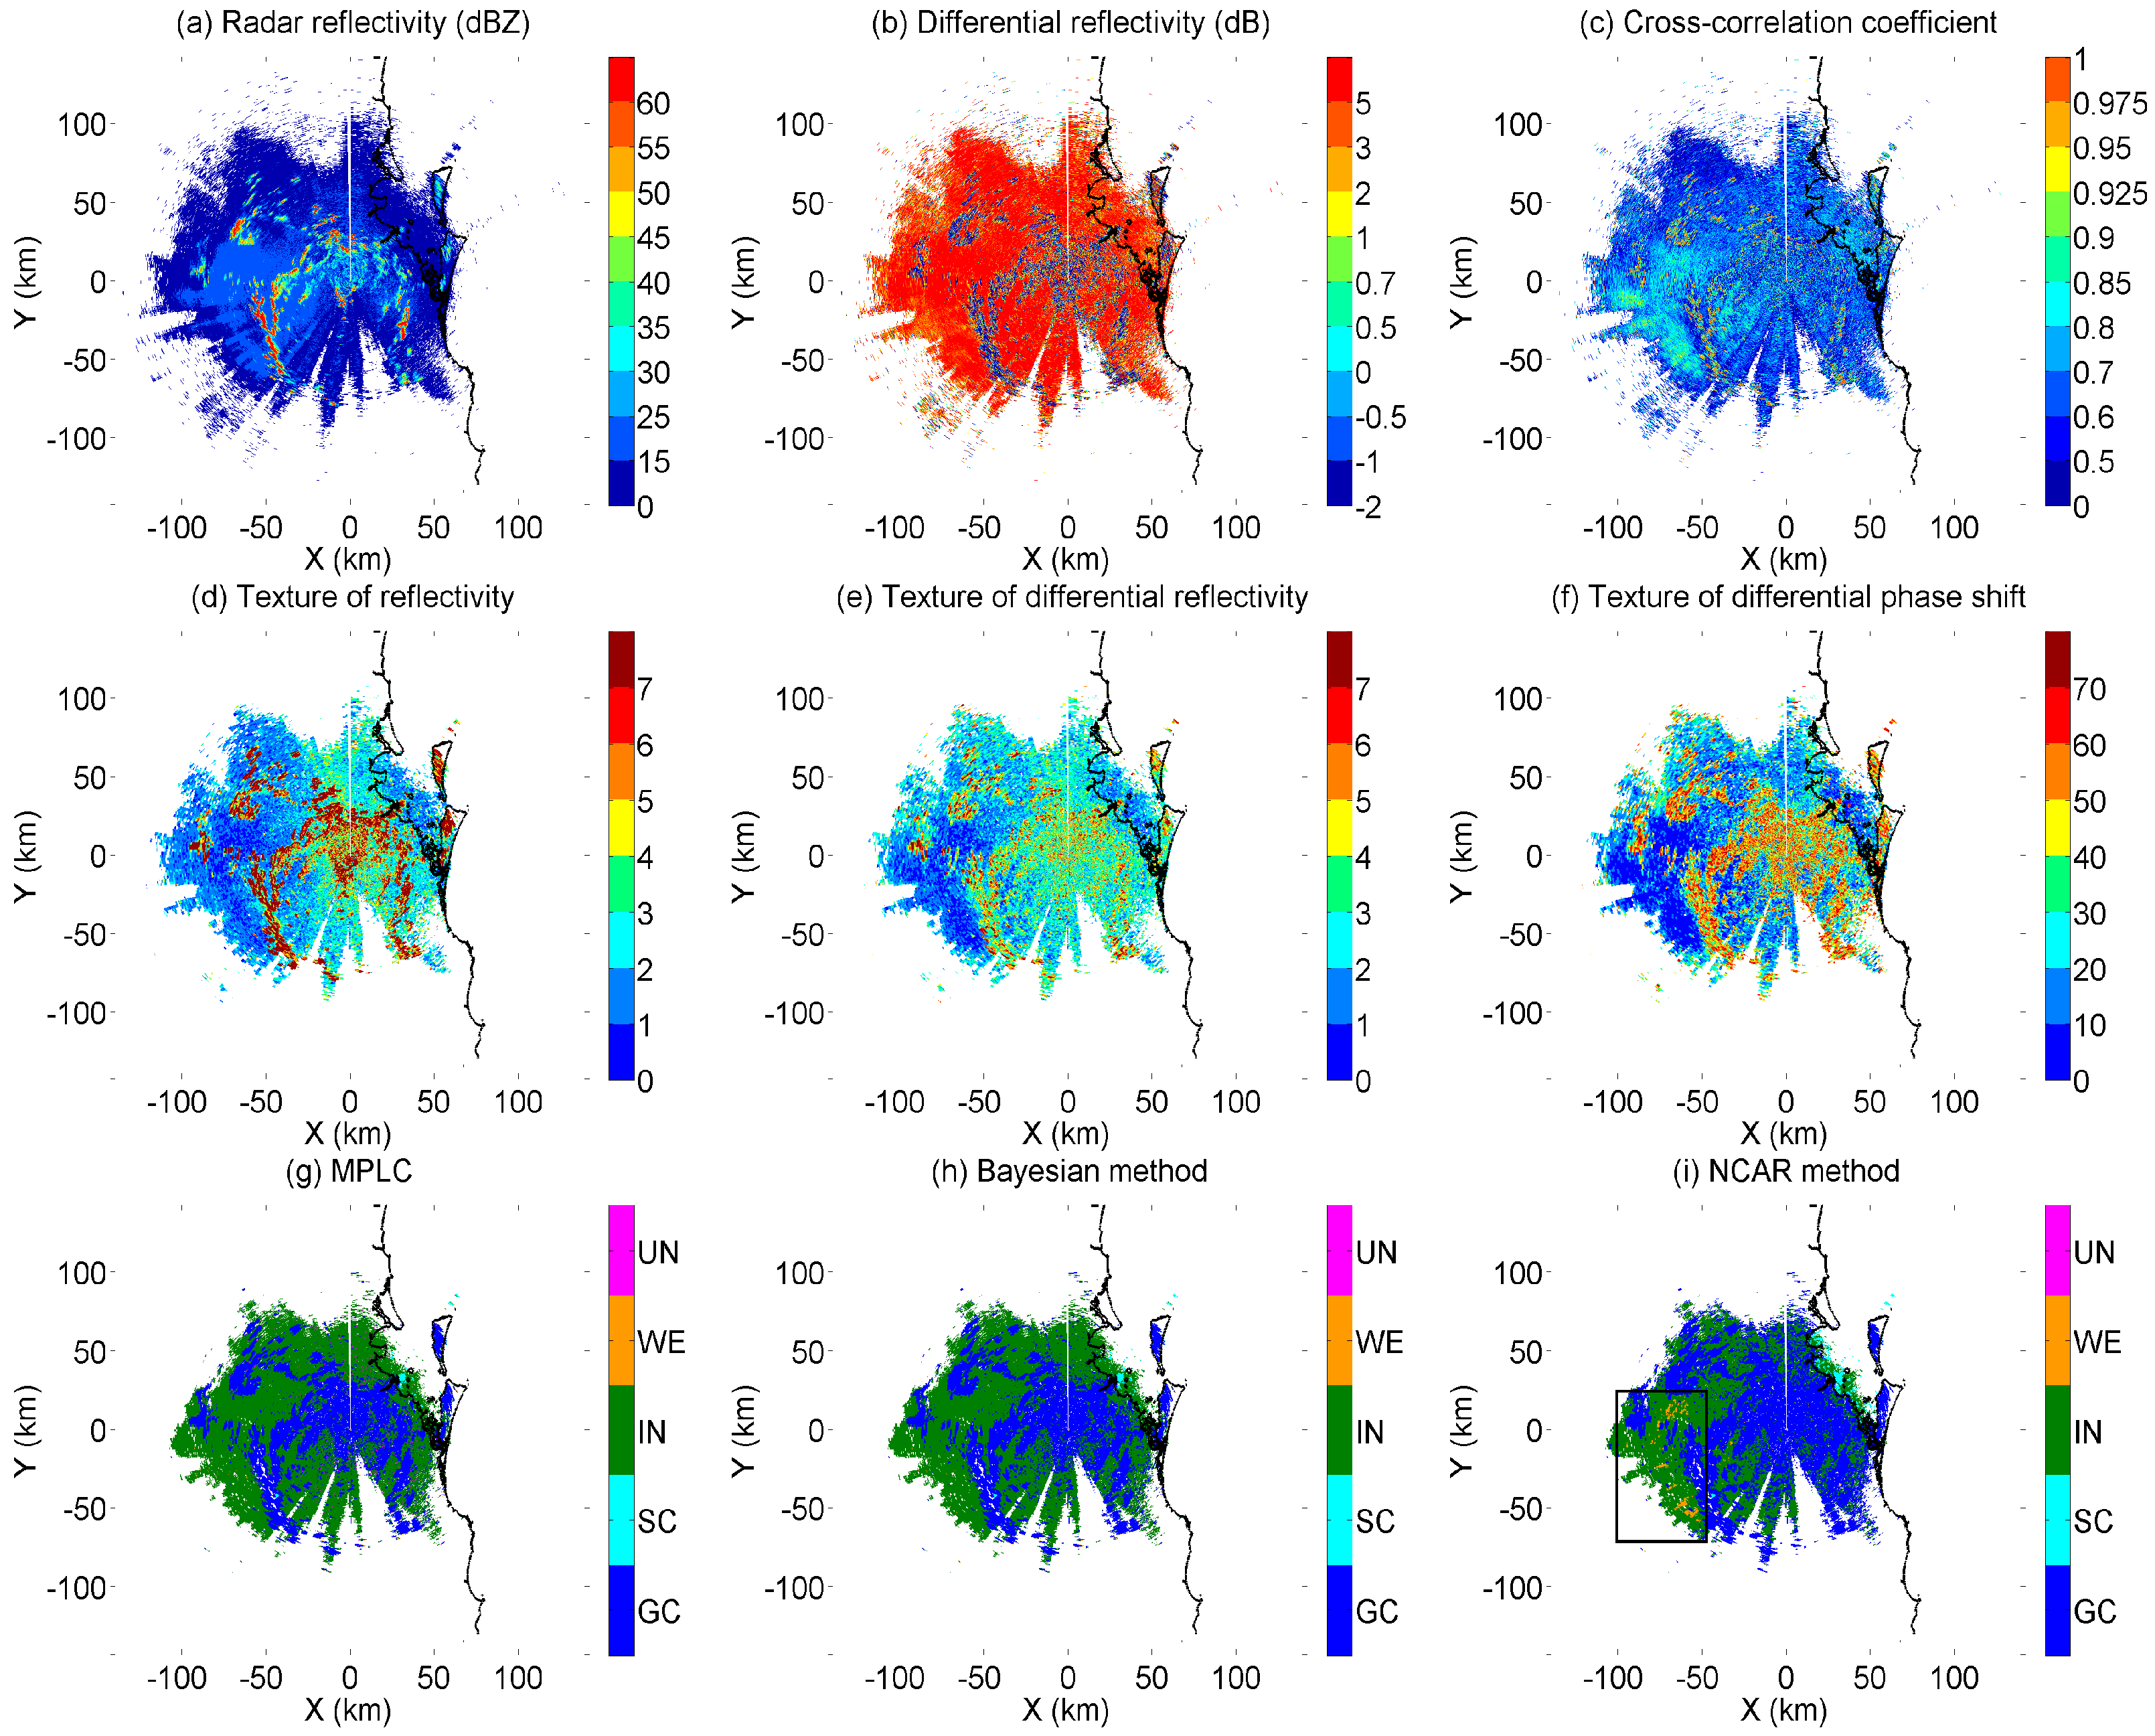
The prototype-based method is also evaluated with an independent test dataset (Table 2). Figure 4 shows the polarimetric data and identification results at a 0.4° elevation angle on 0936 UTC, 6 November 2008. This is an interesting case as the radar data only contains echoes from biological scatterers and ground clutter. The widespread echoes with Zh < 25 dBZ (Figure 4a), Zdr > 5 dB (Figure 4b), and < 0.8 (Figure 4c) are signatures of biological scatterers. As the local time is 19:36 in the evening, IN dominates in the biological region. In addition, ground clutter echoes are found around the radar location, northwest region, and two islands off the eastern coast.
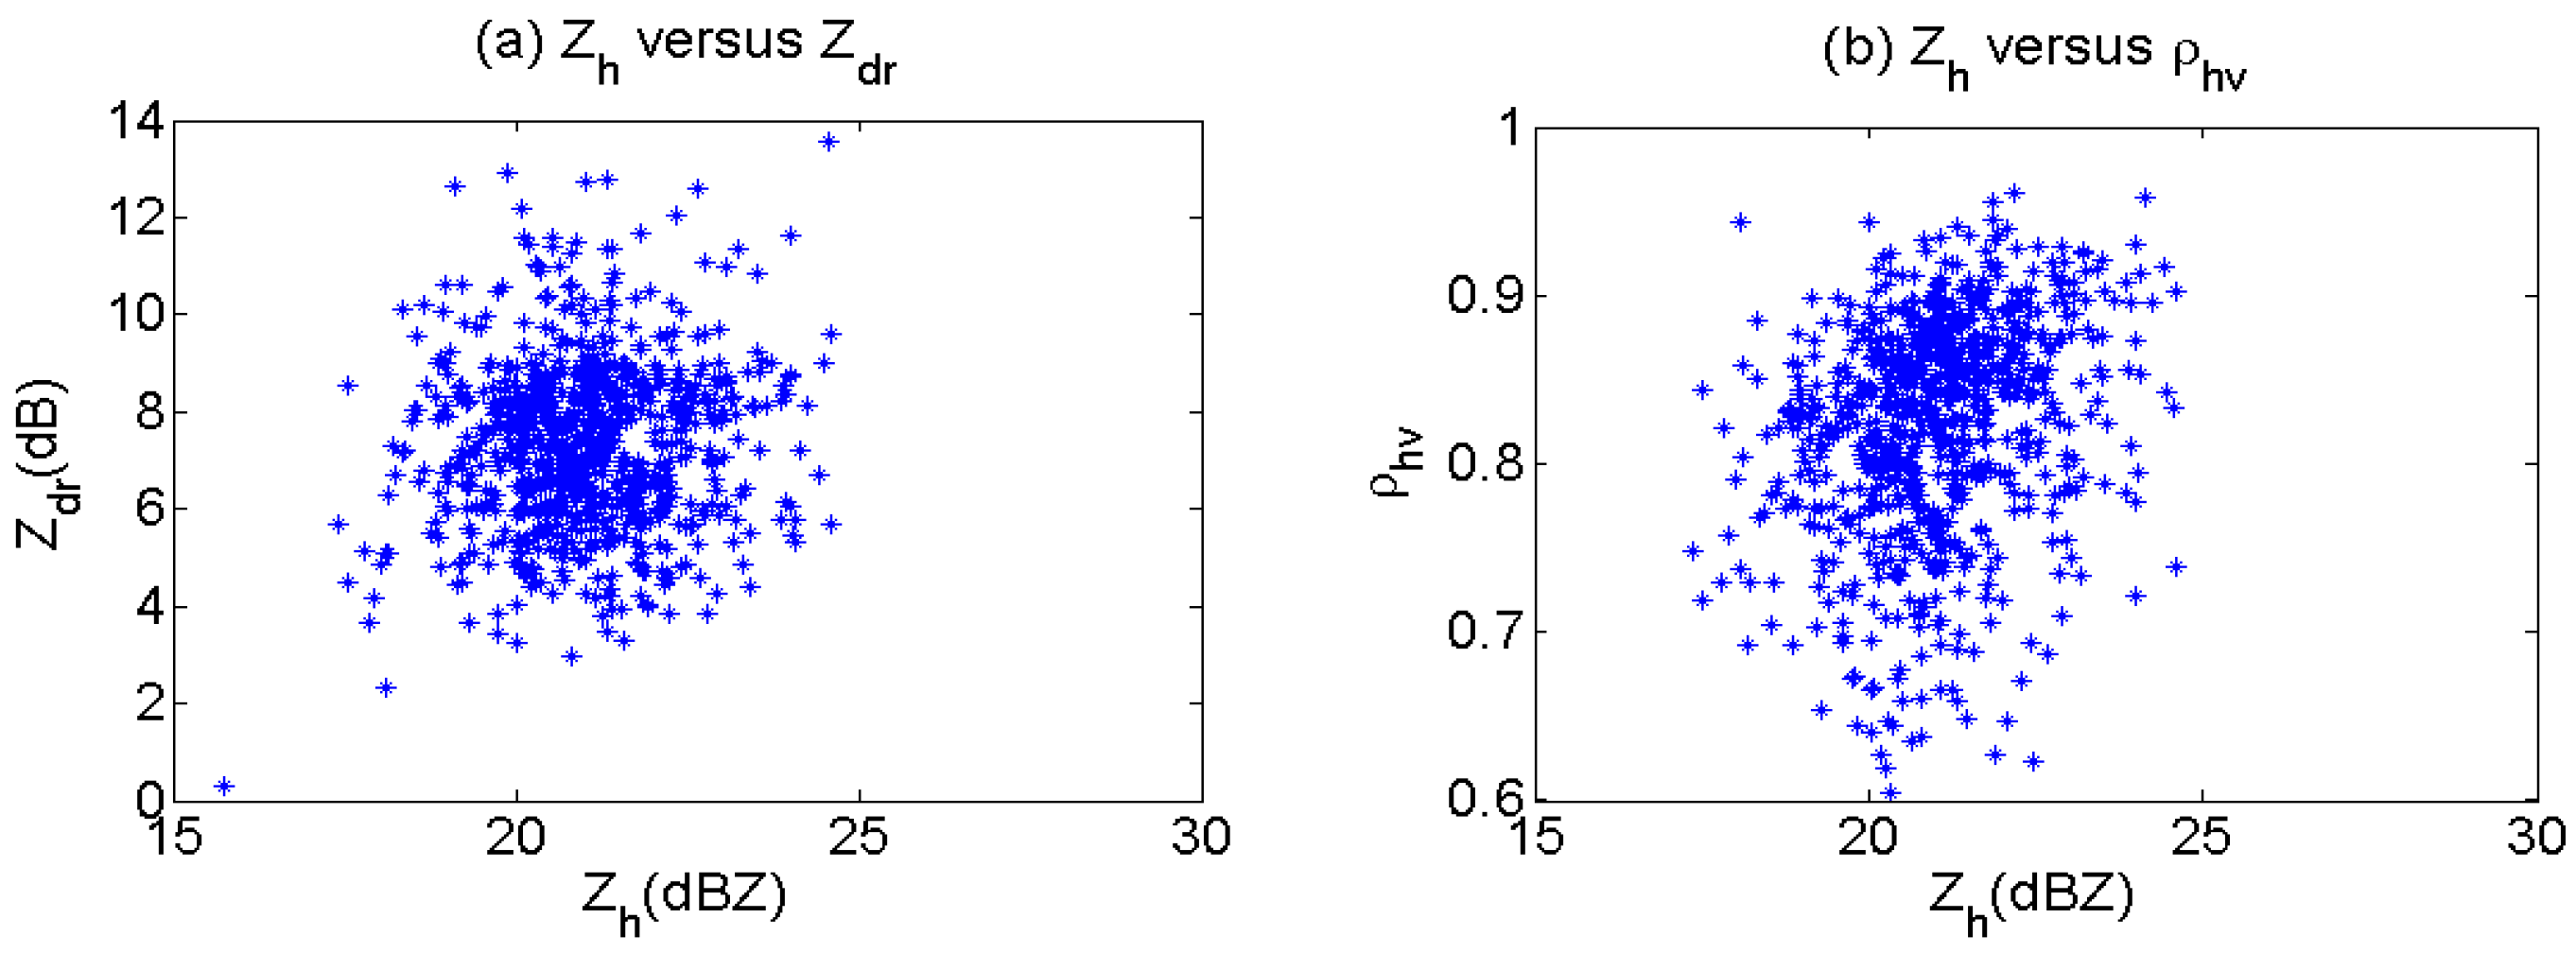
The MPLC, BC, and NCAR algorithms have the capacity to detect insect echoes. Previous studies confirm that biological scatterers are associated with high Zdr and low . However, the NCAR algorithm identifies some points within the IN zone in the western part of the radar domain as WE, due to smaller local variations of as shown in a black rectangle in Figure 4i. Scatterplots (Figure 5) show that most of these data points have a value of Zdr > 3dB (Figure 5a) and < 0.95 (Figure 5b), indicating a signature of insect echoes. In contrast, the MPLC and BC predominantly identifies these echoes as IN, which makes more sense physically by comparing the Zh-Zdr and Zh- pairs to the thresholds in Table 3. The NCAR method also produces a reduced IN and extended GC area than MPLC and BC. Figure 6 illustrates that Zdr in this region ranges from 3 to 8 dB with high Doppler velocity (V > 3 m/s). Comparing to the polarimetric thresholds in Table 3, this signature should be produced by IN, as indicated in the MPLC and BC. This result implies that the prototype-based method has better performance than the NCAR method at classifying IN echoes for those cases in a subtropical environment. That is not to say that the NCAR technique should not be used, since the membership functions could be tuned to better match the local meteorology. However, this study posits that this result is a perfect illustration of the strengths of our cluster-based approach compared to the use of pre-defined membership functions in a fuzzy logic process. It also highlights the importance of using all polarimetric variables together to identify the “IN” echoes to avoid ambiguous classification.
Figure 7 shows a second case collected at a 0.4° elevation angle on 1800 UTC, 21 November 2008. A precipitating cloud system is developing in the western part of the domain (X < −50 km), producing radar reflectivity between 15 to 35 dBZ (Figure 7a) and larger than 0.925 (Figure 7c). As described in the previous cases, the biological scatterers and the ground clutter echoes are mixed in the radar center. The methods exhibit good agreement on classification of GC, IN, and WE for this case.
In the eastern part of the domain of Figure 7, the echoes with weak Zh and negative Zdr correspond to sea clutter caused by strong wind. These echoes have relatively larger Doppler velocity than ground clutter near the radar center. By analyzing the radar data at different elevations, it can be found that this type of echoes is exclusively detected at the lowest scan (0.5°). All the methods classify these echoes with low ( < 0.6) and negative Zdr as SC.
5.3. Statistical Comparisons
To further assess the differences between the algorithms statistically, the so-called “confusion matrix” is calculated from the entire test dataset as shown in Table 4. It presents a one-to-one correspondence between the values of the NCAR algorithm, MPLC, and BC. The diagonal elements give a measure of the consistent results, while elements outside the diagonal indicate mismatches in classification. The relative frequencies are calculated by dividing each tabulated entry by the sample size. In other words, this matrix indicates for each of one class how often the other agrees. To compute this matrix using the same echo types for the NCAR classifier and our classifiers, the “clutter” class in NCAR is split into GC and SC according to the geophysical information, while the meteorological echoes such as rain, hail, and snow, are all combined as a “WE” category.
Table 5 also lists scalar attributes of the 2 × 2 decomposition of the 4 × 4 confusion matrix. Each 2 × 2 decomposition is constructed by regarding one of the four original events are combined as the event being matched, and the remaining four original events combined as complementary, i.e., a mismatched event. For example, the 2 × 2 decomposition of WE lump GC to IN as “not WE.” The statistical attributes include threat score (TS, the number of matched samples divided by the total sample size), odds ratio (, the ratio of the conditional odds of a hit, given that the event occurs, to the conditional odds of a false alarm, given that the event does not occur), bias (B, the ratio of the number of correct values in a row to that in a column), false alarm ratio (FAR, the fraction of correct values that turn out to be wrong), hit rate (H0, the ratio of correct values in a row to the number of times this event occurred), and false alarm rate (F0, the ratio of false alarms to the total number of non-occurrences of the event).
When lumping all classes from Table 4 together, it is found that for the entire test dataset, 81.9% of the class labels in MPLC match the results of NCAR. The agreement between BC and NCAR increases to 85.5%, while this agreement reaches 93.6% by comparing BC and MPLC. In the left-hand part of the confusion matrix, the best agreement between BC (or MPLC) and NCAR is obtained for WE, and it also has the largest threat scores, odds ratio and hit rate, and the smallest false alarm ratio (Table 5), implying that the WE classification is more consistent than for the other four types of radar echoes. The right-hand part gives additional evidences to support this conclusion. The largest differences are found for the IN category, with NCAR agreeing only 47% (54%) of the time when MPLC classifies an echo as IN and 46% (37%) of IN points in MPLC (BC) being identified as GC by NCAR. This result is consistent with the case study shown in Figure 4, Figure 5, Figure 6 and Figure 7. The second largest difference is that 35% of the radar pixels classified by MPLC or BC as SC is classified as WE by NCAR. The top part of the confusion matrix shows that MPLC disagrees 36% and 21% with NCAR on SC and GC, respectively, the two percentages for BC reduce to 28% and 14%, respectively. When NCAR detects SC, MPLC, and BC generally agree, although 34% and 27% of SC in NCAR are IN in MPLC and BC, respectively. The bottom part of the confusion matrix describes the joint distribution of BC and MPLC. The highest probability of the diagonal components is achieved by GC and WE, while that of SC and IN are all above 80%. The best agreement between the MPLC and BC techniques is not surprising, since the first step of the technique is the same, consisting of the clustering technique to either build a series of prototypes for each echo type in MPLC or build the PDFs of polarimetric variables in BC.
For the top part of Table 5, the threat score is TS = 0.45 for IN, which is small, but not zero. The odds ratio is = 48, suggesting better than the performance for GC. The bias is 1.91, indicating that approximately twice as many IN were classified in MPLC as NCAR did. The false alarm ratio for IN is FAR = 0.53, which expresses the fact that a large fraction of MPLC did not eventually appear as NCAR predicted. On the other hand, the hit rate is H = 0.90 and the false alarm rate is F = 0.15, showing that the majority of IN in MPLC matched that in NCAR, whereas a very small portion of the non-SC is falsely identified by MPLC. In the middle part, BC presents a similar trend for IN, while the scalar attributes are slightly improved by comparing to MPLC. In addition, Heidke Skill Score (HSS) and Peirce Skill Score (PSS) for the confusion matrix in Table 4 are HSS = 0.710 and PSS = 0.766 for MPLC versus NCAR, and HSS = 0.759 and PSS = 0.742 for BC versus NCAR, respectively. The difference between the HSS and the PSS for the test dataset is small, since MPLC or BC does not show large bias.
6. Conclusions
A prototype-based method was applied to separate weather echoes from different classes of non-meteorological echoes (ground clutter, sea clutter, and insects). A collection of prototypes attributed to these different echoes was generated using a clustering technique. Each data point was classified as an echo type with the maximum prototype likelihood classifier and Bayesian classifier. The prototype-based method was evaluated with a test dataset collected by the CP-2 radar located near Brisbane, Australia. Three examples were provided to qualitatively and quantitatively analyze the differences between our algorithms and the NCAR fuzzy-logic particle identification algorithm. By examining the classification differences between the two techniques, it was found that the prototype-based methods can better identify the insects than the baseline NCAR algorithm in this subtropical environment. Correctly identifying insect echoes is critical for radial velocity assimilation in models [20].The reason for this better identification of insects is that, by construction, the prototypes are derived through the clustering technique specifically for this region and this radar, while the baseline NCAR algorithm, which uses pre-defined membership functions, would need to be tuned to work better for this specific environment, which can potentially be achieved through a subjective trial and error approach. This result highlights a major strength of our clustering technique, which by construction adjusts to a variety of radars and locations.
In the near future, the prototype-based method will be merged with that described in [12] to produce a full classification of non-meteorological echoes and hydrometeor types, such as that provided by the NCAR fuzzy-logic classifier, but based on clustering techniques and Gaussian mixture approximation of the probability density functions of each echo type.
Acknowledgments
The authors thank Mike Dixon from the National Center of Atmospheric Research (NCAR), who helped to process the NCAR particle identification, and Michael Whimpey and Susan Rennie from the Australian Bureau of Meteorology, who provided assistance with the CP-2 radar data and helped with case selection and manual classification, respectively. This work was partially supported by the China Postdoctoral Science Foundation (grant no. 2015M580123), the National Key Basic Research 973 Program of China (Grant Nos. 2014CB441403, 2013CB430105), and the National Natural Science Foundation of China (Grant Nos. 41575037, 41605019). The authors would like to express our sincere thanks to the anonymous reviewers for their valuable comments and suggestions.
Author Contributions
The work presented here was carried out in collaboration with all authors. Guang Wen designed and performed the calculation and wrote the manuscript; Alain Protat and Hui Xiao contributed to the reviewing and revising of the manuscript.
Conflicts of Interest
The authors declare no conflict of interest.
References
- Cifelli, R.; Chandrasekar, V.; Lim, S.; Kennedy, P.C.; Wang, Y.; Rutledge, S.A. A new dual-polarization radar rainfall algorithm: Application in Colorado precipitation events. J. Atmos. Ocean. Technol. 2011, 28, 352–364. [Google Scholar] [CrossRef]
- May, P.T.; Strauch, R.G. Reducing the effect of ground clutter on wind profiler velocity measurements. J. Atmos. Ocean. Technol. 1998, 15, 579–586. [Google Scholar] [CrossRef]
- Ryzhkov, A.V.; Giangrande, S.E.; Schuur, T.J. Rainfall estimation with a polarimetric prototype of WSR-88D. J. Appl. Meteor. 2005, 44, 502–515. [Google Scholar] [CrossRef]
- Zrnić, D.S.; Ryzhkov, A.V. Polarimetry for weather surveillance radars. Bull. Am. Meteorol. Soc. 1999, 80, 389–406. [Google Scholar] [CrossRef]
- Bringi, V.N.; Williams, C.R.; Thurai, M.; May, P.T. Using dual-polarized radar and dual-frequency profiler for dsd characterization: A case study from Darwin, Australia. J. Atmos. Ocean. Technol. 2009, 26, 2107–2122. [Google Scholar] [CrossRef]
- Illingworth, A.J.; Blackman, T.M. The need to represent raindrop size spectra as normalized Gamma distributions for the interpretation of polarization radar observations. J. Appl. Meteor. 2002, 41, 286–297. [Google Scholar] [CrossRef]
- Tang, Q.; Xiao, H.; Guo, C.; Feng, L. Characteristics of the raindrop size distributions and their retrieved polarimetric radar parameters in northern and southern China. Atmos. Res. 2014, 135–136, 59–75. [Google Scholar] [CrossRef]
- Zhang, G.; Vivekanandan, J.; Brandes, E.A.; Meneghini, R.; Kozu, T. The shape–slope relation in observed gamma raindrop size distributions: Statistical error or useful information? J. Atmos. Ocean. Technol. 2003, 20, 1106–1119. [Google Scholar] [CrossRef]
- Liu, H.; Chandrasekar, V. Classification of hydrometeors based on polarimetric radar measurements: Development of fuzzy logic and neuro-fuzzy systems, and in situ verification. J. Atmos. Ocean. Technol. 2000, 17, 140–164. [Google Scholar] [CrossRef]
- Park, H.S.; Ryzhkov, A.V.; Zrnić, D.S.; Kim, K.E. The hydrometeor classification algorithm for the polarimetric WSR-88D: Description and application to an MCS. Weather Forecast. 2009, 24, 730–748. [Google Scholar] [CrossRef]
- Wen, G.; Protat, A.; May, P.T.; Wang, X.; Moran, W. A cluster-based method for hydrometeor classification using polarimetric variables. Part i: Interpretation and analysis. J. Atmos. Ocean. Technol. 2015, 32, 1320–1340. [Google Scholar] [CrossRef]
- Wen, G.; Protat, A.; May, P.T.; Moran, W.; Dixon, M. A cluster-based method for hydrometeor classification using polarimetric variables. Part II: Classification. J. Atmos. Ocean. Technol. 2016, 33, 45–60. [Google Scholar] [CrossRef]
- Wen, G.; Oue, M.; Protat, A.; Verlinde, J.; Xiao, H. Ice particle type identification for shallow arctic mixed-phase clouds using X-band polarimetric radar. Atmos. Res. 2016, 182, 114–131. [Google Scholar] [CrossRef]
- Wilson, J.W.; Weckwerth, T.M.; Vivekanandan, J.; Wakimoto, R.M.; Russell, R.W. Boundary layer clear-air radar echoes: Origin of echoes and accuracy of derived winds. J. Atmos. Ocean. Technol. 1994, 11, 1184–1206. [Google Scholar] [CrossRef]
- Steiner, M.; Smith, J.A. Use of three-dimensional reflectivity structure for automated detection and removal of nonprecipitating echoes in radar data. J. Atmos. Ocean. Technol. 2002, 19, 673–686. [Google Scholar] [CrossRef]
- Tang, L.; Zhang, J.; Langston, C.; Krause, J.; Howard, K.; Lakshmanan, V. A physically based precipitation–nonprecipitation radar echo classifier using polarimetric and environmental data in a real-time national system. Weather Forecast. 2014, 29, 1106–1119. [Google Scholar] [CrossRef]
- Kessinger, C.; Ellis, S.; Andel, J.V. The Radar Echo Classifier: A Fuzzy Logic Algorithm for the WSR-88D. In Proceedings of the Third Conference on Artificial Intelligence Applications to the Environmental Science, Long Beach, CA, USA, 8–11 February 2003; pp. 1–11. [Google Scholar]
- Berenguer, M.; Sempere-Torres, D.; Corral, C.; Sánchez-Diezma, R. A fuzzy logic technique for identifying nonprecipitating echoes in radar scans. J. Atmos. Ocean. Technol. 2006, 23, 1157–1180. [Google Scholar] [CrossRef]
- Lakshmanan, V.; Karstens, C.; Krause, J.; Tang, L. Quality control of weather radar data using polarimetric variables. J. Atmos. Ocean. Technol. 2014, 31, 1234–1249. [Google Scholar] [CrossRef]
- Rennie, S.J.; Curtis, M.; Peter, J.; Seed, A.W.; Steinle, P.J.; Wen, G. Bayesian echo classification for Australian single-polarization weather radar with application to assimilation of radial velocity observations. J. Atmos. Ocean. Technol. 2015, 32, 1341–1355. [Google Scholar] [CrossRef]
- Li, Y.; Zhang, G.; Doviak, R.J. Ground clutter detection using the statistical properties of signals received with a polarimetric radar. IEEE Trans. Signal Process. 2014, 62, 597–606. [Google Scholar] [CrossRef]
- Hubbert, J.C.; Dixon, M.; Ellis, S.M.; Meymaris, G. Weather radar ground clutter. Part I: Identification, modeling, and simulation. J. Atmos. Ocean. Technol. 2009, 26, 1165–1180. [Google Scholar] [CrossRef]
- Hubbert, J.C.; Dixon, M.; Ellis, S.M. Weather radar ground clutter. Part II: Real-time identification and filtering. J. Atmos. Ocean. Technol. 2009, 26, 1181–1197. [Google Scholar] [CrossRef]
- Doviak, R.J.; Zrnić, D.S. Doppler Radar and Weather Observations, 2nd ed.; Dover Publications, Inc.: Mineola, NY, USA; 2006; p. 562. [Google Scholar]
- Peter, J.R.; Seed, A.; Steinle, P.J. Application of a Bayesian classifier of anomalous propagation to single-polarization radar reflectivity data. J. Atmos. Oceanic Technol. 2013, 30, 1985–2005. [Google Scholar] [CrossRef]
- Zrnić, D.S.; Melnikov, V.M.; Ryzhkov, A.V. Correlation coefficients between horizontally and vertically polarized returns from ground clutter. J. Atmos. Ocean. Technol. 2006, 23, 381–394. [Google Scholar] [CrossRef]
- Ryzhkov, A.V.; Zrnić, D.S. Polarimetric rainfall estimation in the presence of anomalous propagation. J. Atmos. Ocean. Technol. 1998, 15, 1320–1330. [Google Scholar] [CrossRef]
- Giuli, D.; Gherardelli, M.; Freni, A.; Seliga, T.A.; Aydin, K. Rainfall and clutter discrimination by means of dual-linear polarization radar measurements. J. Atmos. Ocean. Technol. 1991, 8, 777–789. [Google Scholar] [CrossRef]
- Ryzhkov, A.V.; Schuur, T.J.; Burgess, D.W.; Heinselman, P.L.; Giangrande, S.E.; Zrnic, D.S. The Joint Polarization Experiment: Polarimetric rainfall measurements and hydrometeor classification. Bull. Am. Meteorol. Soc. 2005, 86, 809–824. [Google Scholar] [CrossRef]
- Dixon, M.J.; Kessinger, C.J.; Hubbert, J.C. Echo Classification within the Spectral Domain to Discriminate Ground Clutter from Meteorological Targets. In Proceedings of the 86th AMS Annual Meeting, Atlanta, GA, USA, 28 January–3 February 2006. [Google Scholar]
- Ryzhkov, A.; Zhang, P.; Doviak, R.; Kessinger, C. Discrimination between Weather and Sea Clutter using Doppler and Dual-Polarization Weather Radars. In Proceedings of the 27th General Assembly of the International Union of Radio Science, Maastricht, The Netherlands, 17–24 August 2002; p. 3. [Google Scholar]
- Bachmann, S.; Zrnić, D. Spectral density of polarimetric variables separating biological scatterers in the vad display. J. Atmos. Oceanic Technol. 2007, 24, 1186–1198. [Google Scholar] [CrossRef]
- Martin, W.J.; Shapiro, A. Discrimination of bird and insect radar echoes in clear air using high-resolution radars. J. Atmos. Oceanic Technol. 2007, 24, 1215–1230. [Google Scholar] [CrossRef]
- Zaugg, S.; Saporta, G.; Van Loon, E.; Schmaljohann, H.; Liechti, F. Automatic identification of bird targets with radar via patterns produced by wing flapping. J. R. Soc. Interface 2008, 5, 1041–1053. [Google Scholar] [CrossRef] [PubMed]
- Zhang, P.; Liu, S.; Xu, Q. Identifying Doppler velocity contamination caused by migrating birds. Part I: Feature extraction and quantification. J. Atmos. Oceanic Technol. 2005, 22, 1105–1113. [Google Scholar] [CrossRef]
- Liu, S.; Xu, Q.; Zhang, P. Identifying Doppler velocity contamination caused by migrating birds. Part II: Bayes identification and probability tests. J. Atmos. Oceanic Technol. 2005, 22, 1114–1121. [Google Scholar] [CrossRef]
- Zhang, P.; Ryzhkov, A.; Zrnić, D. Observations of Insects and Birds with a Polarimetric Prototype of the WSR-88D Radar. In Proceedings of the 32d International Conference on Radar Meteorology, Albuquerque, NM, USA, 22 October 2005. [Google Scholar]
- Van Den Broeke, M.S. Polarimetric radar observations of biological scatterers in hurricanes irene (2011) and sandy (2012). J. Atmos. Ocean. Technol. 2013, 30, 2754–2767. [Google Scholar] [CrossRef]
- Melnikov, V.M.; Istok, M.J.; Westbrook, J.K. Asymmetric radar echo patterns from insects. J. Atmos. Ocean. Technol. 2015, 32, 659–674. [Google Scholar] [CrossRef]
- Keenan, T.; Wilson, J.; Lutz, J.; Glasson, K.; May, P. Rationale and Use of the CP2 Testbed in Brisbane, Australia. In Proceedings of the 33rd Conference on Radar Meteorology, Cairns, Australia, 6–10 August 2007. [Google Scholar]
- Schuur, T.; Ryzhkov, A.; Heinselman, P. Observation and Classification of Echoes with the Polarimetric WSR-88D Radar; NOAA/NSSL: Oklahoma, OK, USA, 2003; p. 46. [Google Scholar]
- Zrnić, D.S.; Ryzhkov, A.V. Observations of insects and birds with a polarimetric radar. IEEE Trans. Geosci. Remote 1998, 36, 661–668. [Google Scholar] [CrossRef]
- Runnalls, A.R. A Kullback-leibler approach to Gaussian mixture reduction. IEEE Trans. Aerosp. Electron. Syst. 2007, 43, 989–999. [Google Scholar] [CrossRef]
- Vivekanandan, J.; Ellis, S.M.; Oye, R.; Zrnić, D.S.; Ryzhkov, A.V.; Straka, J. Cloud microphysics retrieval using S-band dual-polarization radar measurements. Bull. Am. Meteorol. Soc. 1999, 80, 381–388. [Google Scholar] [CrossRef]
Figure 1.
Flowchart of the prototype-based method.
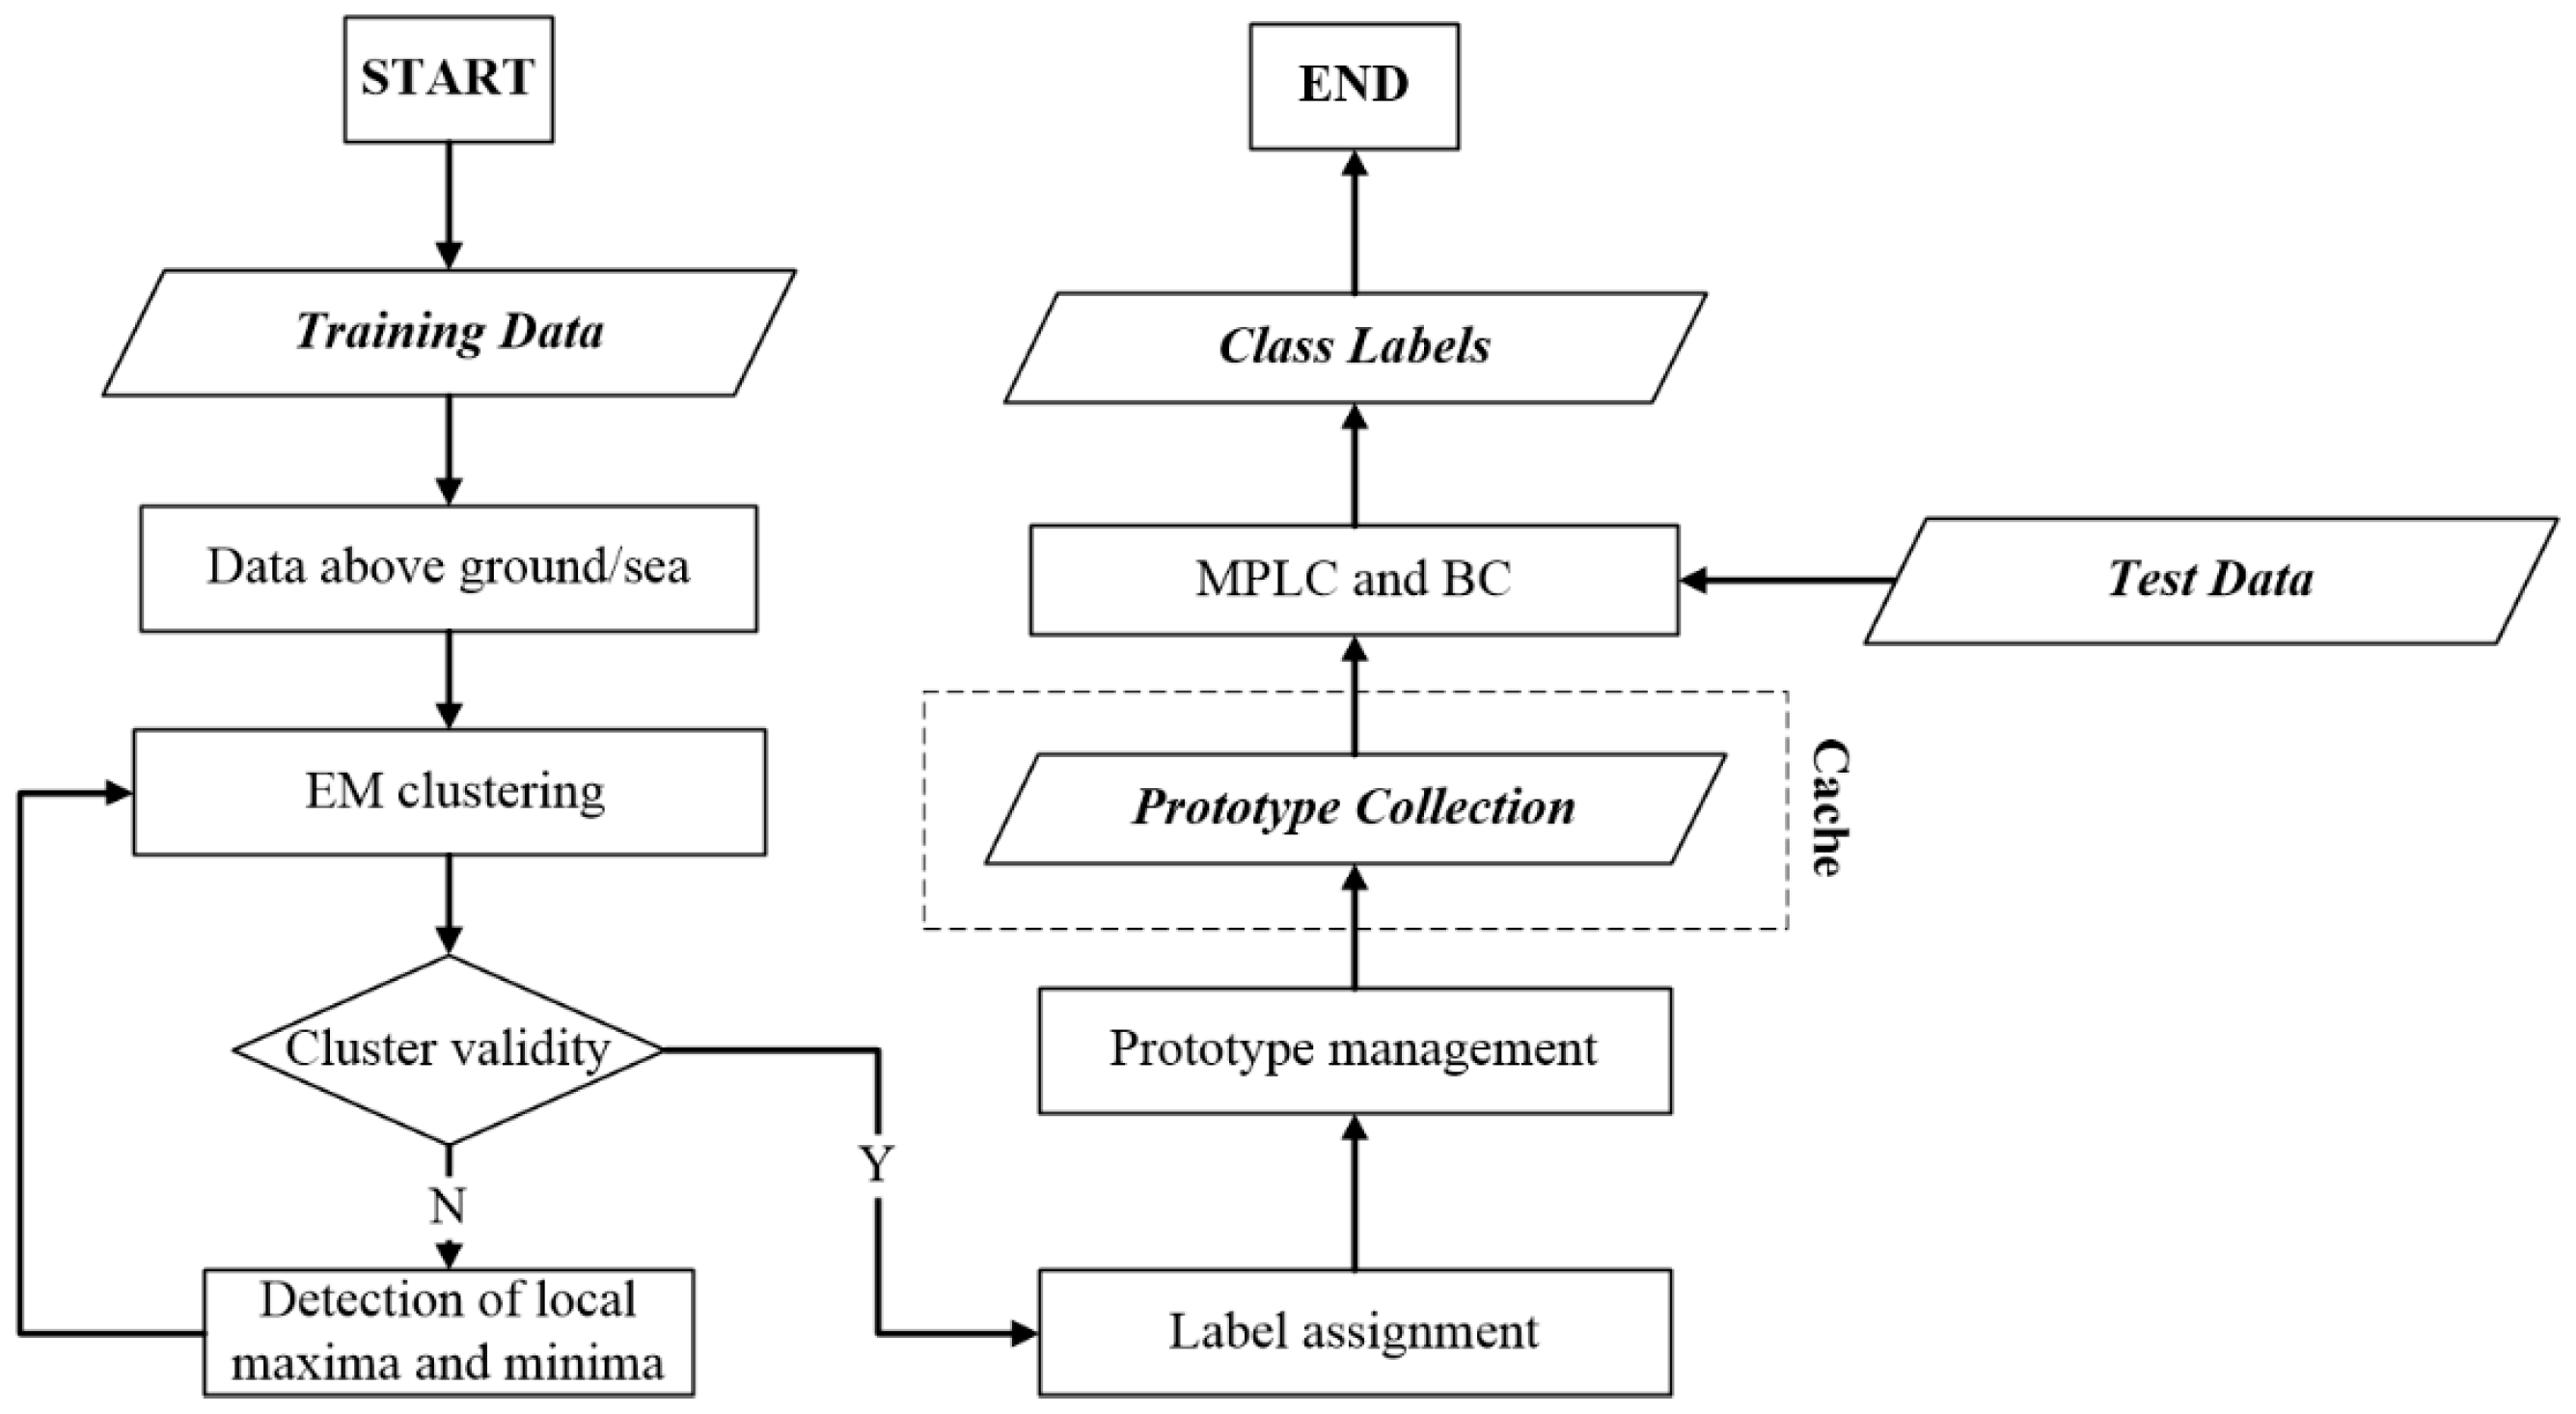
Figure 2.
Prototype means of (a) Zh-Zdr, (b) Zh-, (c) Zh-, (d) Zh-, and (e) Zh-for clutter types.
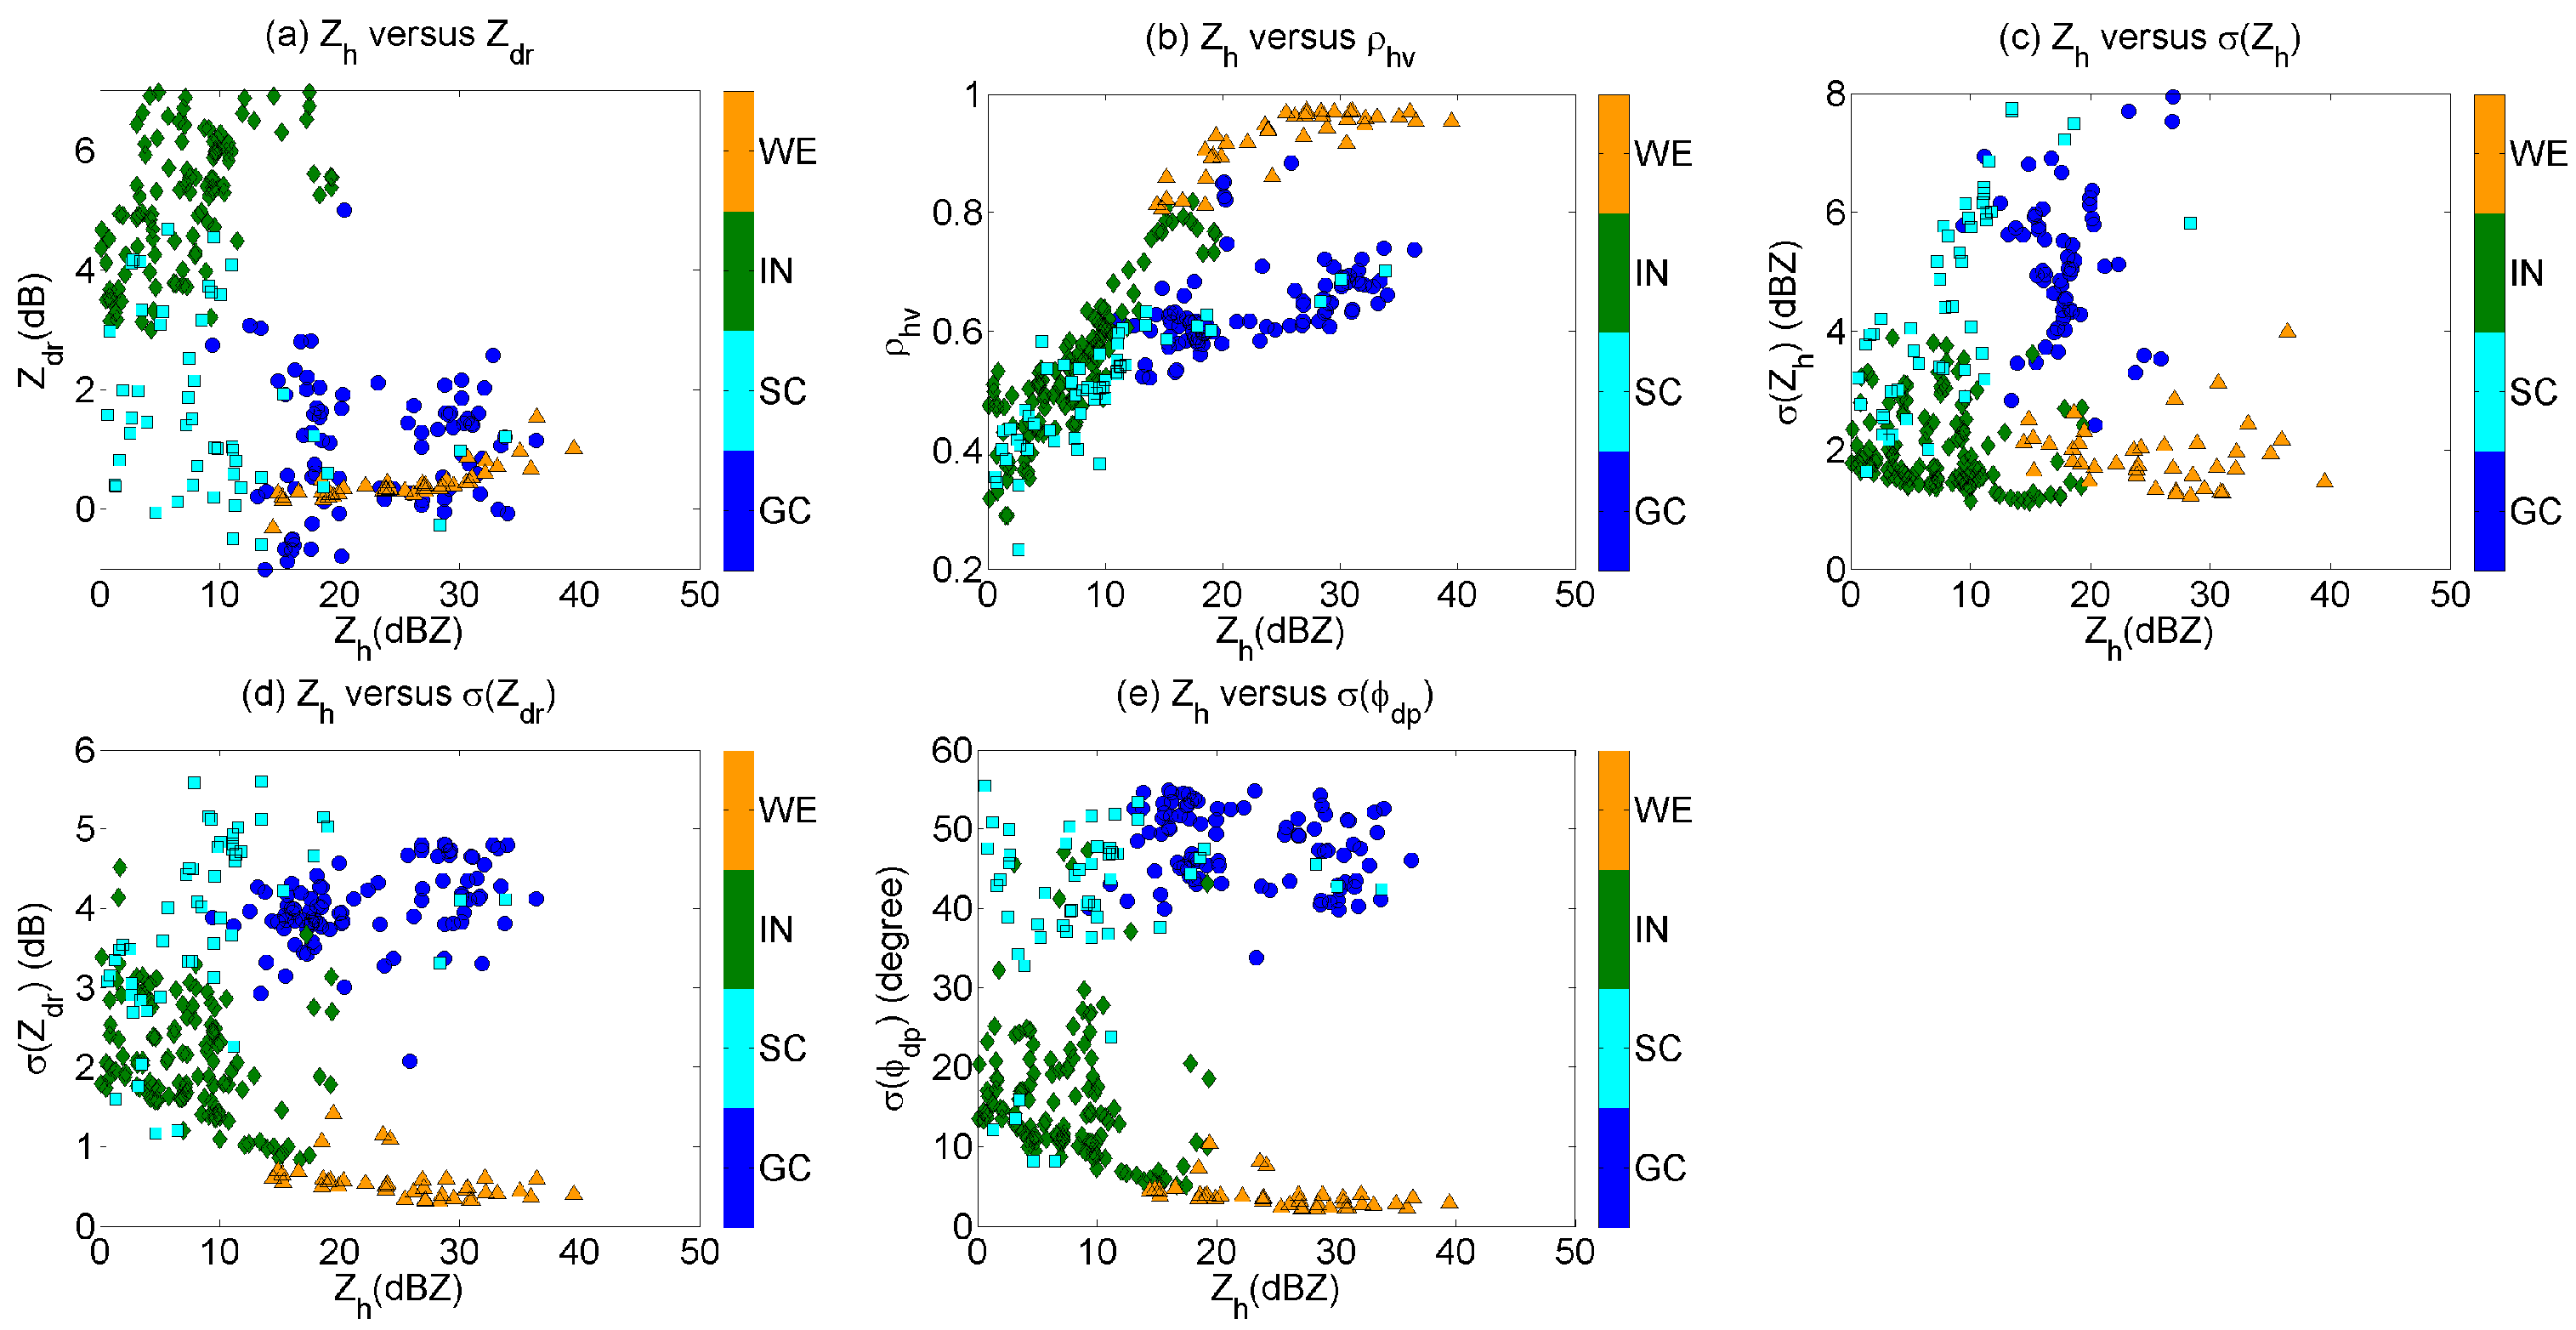
Figure 3.
Plan position indicators (PPIs) of (a) Zh, (b) Zdr, (c) , (d) , (e) , (f) , (g) maximum prototype likelihood classifier (MPLC), (h) Bayesian classifier (BC), and (i) National Center for Atmospheric Research (NCAR). The hydrometeor types in the NCAR method are mapped to weather echoes (WE) in the prototype-based methods, second trip echoes are marked as unknown (UN), and ground clutter is separated as ground clutter (GC) and sea clutter (SC) following the location of the coastline. Data were collected at a 0.5° elevation angle on 1033 UTC 8 November 2008.

Figure 4.
Same as Figure 3. Data were collected at a 0.4° elevation angle on 0936 UTC 6 November 2008.
Figure 4.
Same as Figure 3. Data were collected at a 0.4° elevation angle on 0936 UTC 6 November 2008.

Figure 5.
Scatterplots of (a) Zh-Zdr and (b) Zh- for the data classified as WE in the NCAR method, but non-WE in the MPLC.
Figure 5.
Scatterplots of (a) Zh-Zdr and (b) Zh- for the data classified as WE in the NCAR method, but non-WE in the MPLC.

Figure 6.
Contours of (a) Zh-Zdr and (b) Zh-Velocity for the data classified as GC in the NCAR method, but IN in the prototype-based method.
Figure 6.
Contours of (a) Zh-Zdr and (b) Zh-Velocity for the data classified as GC in the NCAR method, but IN in the prototype-based method.
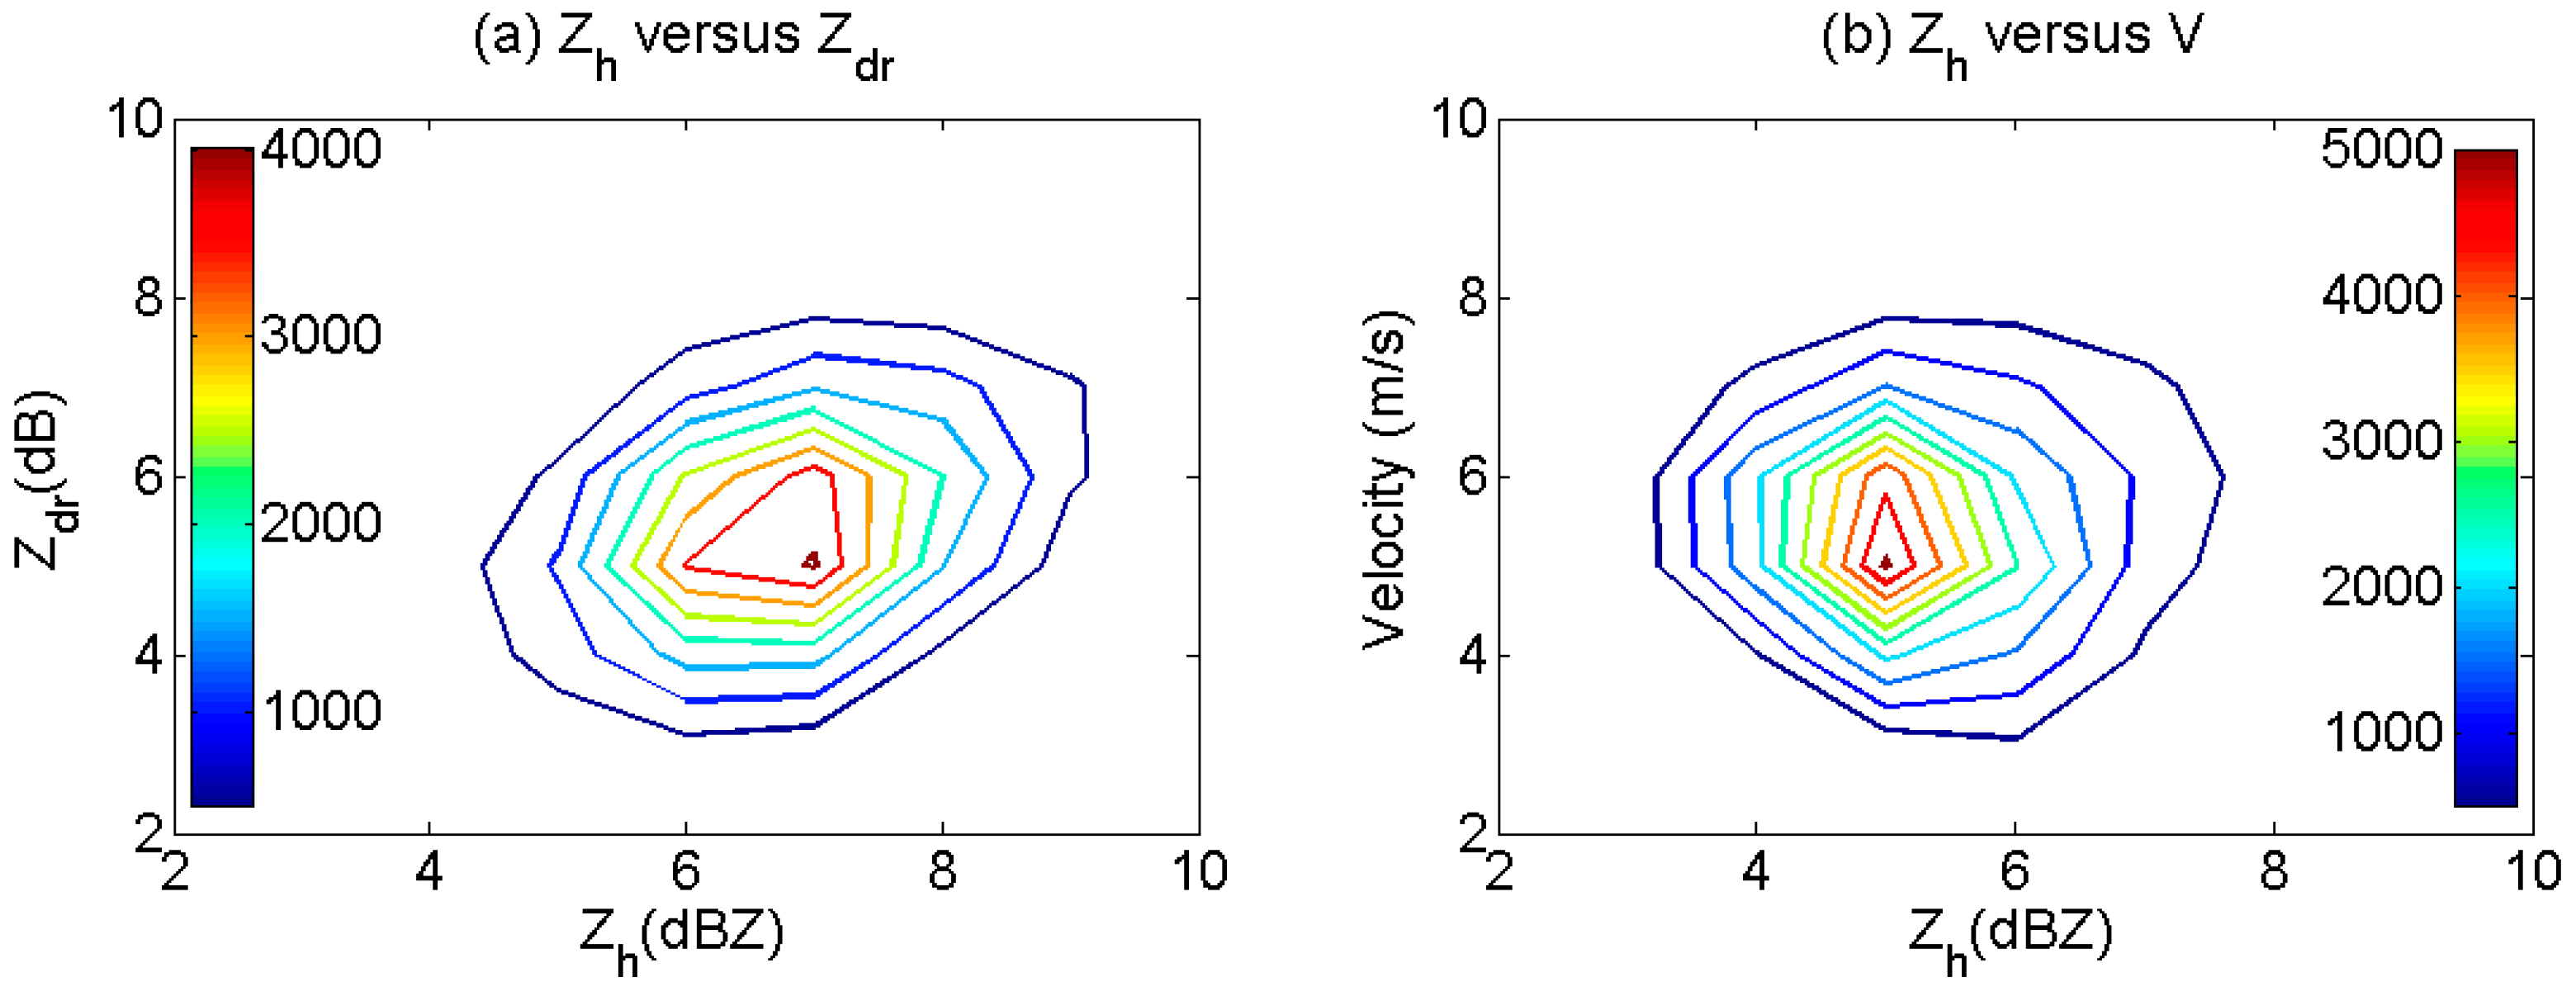
Figure 7.
Same as Figure 3. Data were collected at a 0.4° elevation angle on 1800 UTC 21 November 2008.
Figure 7.
Same as Figure 3. Data were collected at a 0.4° elevation angle on 1800 UTC 21 November 2008.

Table 1.
Training dataset used in the prototype-based method.
| Date (dd/mm/year) | Time (UTC) | Description |
|---|---|---|
| 6/11/2008 | 1242–1330 | Sea clutter |
| 8/11/2008 | 0612–1622 | Storms |
| 14/11/2008 | 1600–1900 | Sea clutter |
| 17/11/2008 | 0630–2024 | Storms |
| 18/11/2008 | 0636–1500 | Storms |
| 19/11/2008 | 0718–1800 | Storms |
| 2012–2218 | Sea clutter | |
| 21/11/2008 | 1330–1500 | Sea clutter |
| 28/11/2008 | 0900–1400 | Insects & light rain |
| 6/12/2008 | 0724–1048 | Convective storms |
| 7/12/2008 | 0554–0706 | Convective storms |
| 2000–0342 | Storms | |
| 15/12/2008 | 0354–0712 | Insects & storms |
| 18/12/2008 | 0912–1130 | Insects & convective storms |
| 2000–2218 | Sea clutter | |
| 19/12/2008 | 0912–1712 | Insects |
| 7/01/2009 | 0912–1600 | Insects & light rain |
| 15/01/2009 | 0918–1800 | Insects |
| 16/01/2009 | 0912–2348 | Insects, light rain, & sea clutter |
| 17/01/2009 | 0912–1700 | Insects & light rain |
| 22/01/2009 | 0912–1330 | Insects & storms |
| 23/01/2009 | 0918–1836 | Insects, sea clutter, & storms |
Table 2.
Test dataset used in the prototype-based algorithm.
| Date (dd/mm/year) | Time (UTC) | Description |
|---|---|---|
| 6/11/2008 | 0900–1212 | Insects |
| 1436–1554 | Sea clutter | |
| 8/11/2008 | 1828–1922 | Sea clutter & light rain |
| 20/11/2008 | 0200–0230 | Insects |
| 0630–1042 | Convective storms | |
| 21/11/2008 | 1800–1830 | Sea clutter |
| 24/01/2009 | 0912–1200 | Convective storms & insects |
| 1912–0230 | Convective storms & insects | |
| 25/01/2009 | 0912–1730 | Storms & insects |
| 31/01/2009 | 1500–1900 | Light rain, insects, & sea clutter |
| 2/02/2009 | 0912–1042 | Storms & insects |
| 8/02/2009 | 0912–1912 | Insects |
| 10/02/2009 | 0900–1500 | Storms & insects |
| 11/02/2009 | 0906–1824 | Storms & insects |
| 12/02/2009 | 0912–1454 | Storms & insects |
| 13/02/2009 | 0118–0224 | Storms |
| 0912–1112 | Storms & insects | |
| 14/02/2009 | 0912–1500 | Storms & insects |
Table 3.
Boundaries of radar measurements and textures for clutter types.
| Echo Types | Zh (dBZ) | Zdr (dB) | (dBZ) | (dB) | (deg) | |
|---|---|---|---|---|---|---|
| GC | variable | −3~5 | <0.9 | >2 | >3 | >30 |
| SC | variable | −3~5 | <0.7 | >2 | >3 | >30 |
| IN | <30 | 3~8 | 0.3~0.8 | 1~5 | 2~5 | 10~30 |
| WE | >5 | variable | >0.8 | <4 | <3 | <20 |
Table 4.
Confusion matrix for the test dataset.
| NCAR | MPLC | ||||||||||
| MPLC | GC | SC | IN | WE | NCAR | GC | SC | IN | WE | ||
| GC | 93% | 0 | 3% | 4% | GC | 79% | 0 | 20% | 1% | ||
| SC | 0 | 64% | 1% | 35% | SC | 0 | 64% | 34% | 2% | ||
| IN | 46% | 1% | 47% | 6% | IN | 9% | 0 | 90% | 1% | ||
| WE | 1% | 0 | 0 | 99% | WE | 7% | 1% | 5% | 87% | ||
| NCAR | BC | ||||||||||
| BC | GC | SC | IN | WE | NCAR | GC | SC | IN | WE | ||
| GC | 92% | 0 | 3% | 5% | GC | 86% | 0 | 14% | 0 | ||
| SC | 0 | 63% | 2% | 35% | SC | 0 | 72% | 27% | 1% | ||
| IN | 37% | 1% | 54% | 8% | IN | 13% | 0 | 86% | 0 | ||
| WE | 1% | 0 | 0 | 99% | WE | 8% | 1% | 5% | 86% | ||
| BC | MPLC | ||||||||||
| MPLC | GC | SC | IN | WE | BC | GC | SC | IN | WE | ||
| GC | 100% | 0 | 0 | 0 | GC | 90% | 0 | 9% | 1% | ||
| SC | 0 | 99% | 1% | 0 | SC | 0 | 88% | 11% | 1% | ||
| IN | 20% | 0 | 80% | 0 | IN | 1% | 0 | 97% | 2% | ||
| WE | 0 | 0 | 1% | 99% | WE | 0 | 0 | 0 | 100% | ||
Table 5.
Scaler attributes for each 2 × 2 decomposition of the 4 × 4 confusion matrix in Table 4.
Table 5.
Scaler attributes for each 2 × 2 decomposition of the 4 × 4 confusion matrix in Table 4.
| MPLC Versus NCAR | NCAR Versus MPLC | ||||||||||||
| TS | B | FAR | H | F | TS | B | FAR | H | F | ||||
| GC | 0.74 | 43 | 0.84 | 0.07 | 0.78 | 0.08 | GC | 0.74 | 43 | 1.19 | 0.22 | 0.93 | 0.23 |
| SC | 0.46 | 491 | 0.99 | 0.37 | 0.62 | 0.00 | SC | 0.46 | 491 | 1.01 | 0.38 | 0.63 | 0.00 |
| IN | 0.45 | 48 | 1.91 | 0.53 | 0.90 | 0.15 | IN | 0.45 | 48 | 0.53 | 0.11 | 0.47 | 0.02 |
| WE | 0.85 | 1025 | 0.88 | 0.02 | 0.87 | 0.01 | WE | 0.85 | 1025 | 1.14 | 0.14 | 0.98 | 0.05 |
| BC Versus NCAR | NCAR Versus BC | ||||||||||||
| TS | B | FAR | H | F | TS | B | FAR | H | F | ||||
| GC | 0.80 | 56 | 0.93 | 0.08 | 0.86 | 0.10 | GC | 0.80 | 56 | 1.07 | 0.14 | 0.92 | 0.17 |
| SC | 0.50 | 642 | 1.14 | 0.37 | 0.72 | 0.00 | SC | 0.50 | 642 | 0.88 | 0.28 | 0.63 | 0.00 |
| IN | 0.50 | 50 | 1.59 | 0.46 | 0.86 | 0.11 | IN | 0.50 | 50 | 0.63 | 0.14 | 0.54 | 0.02 |
| WE | 0.84 | 1241 | 0.86 | 0.01 | 0.85 | 0.01 | WE | 0.84 | 1240 | 1.16 | 0.15 | 0.99 | 0.06 |
| MPLC Versus BC | MPLC Versus BC | ||||||||||||
| TS | B | FAR | H | F | TS | B | FAR | H | F | ||||
| GC | 0.89 | 2528 | 0.90 | 0.00 | 0.90 | 0.00 | GC | 0.89 | 2528 | 1.11 | 0.10 | 1.00 | 0.10 |
| SC | 0.86 | 51192 | 0.88 | 0.01 | 0.87 | 0.00 | SC | 0.86 | 51191 | 1.14 | 0.13 | 0.99 | 0.00 |
| IN | 0.77 | 344 | 1.20 | 0.20 | 0.96 | 0.06 | IN | 0.77 | 345 | 0.83 | 0.04 | 0.80 | 0.01 |
| WE | 0.98 | 124165 | 1.02 | 0.02 | 1.00 | 0.01 | WE | 0.98 | 124165 | 0.98 | 0.00 | 0.98 | 0.00 |
© 2017 by the authors. Licensee MDPI, Basel, Switzerland. This article is an open access article distributed under the terms and conditions of the Creative Commons Attribution (CC BY) license (http://creativecommons.org/licenses/by/4.0/).
Share and Cite
MDPI and ACS Style
Wen, G.; Protat, A.; Xiao, H. An Objective Prototype-Based Method for Dual-Polarization Radar Clutter Identification. Atmosphere 2017, 8, 72. https://doi.org/10.3390/atmos8040072
AMA Style
Wen G, Protat A, Xiao H. An Objective Prototype-Based Method for Dual-Polarization Radar Clutter Identification. Atmosphere. 2017; 8(4):72. https://doi.org/10.3390/atmos8040072
Chicago/Turabian StyleWen, Guang, Alain Protat, and Hui Xiao. 2017. "An Objective Prototype-Based Method for Dual-Polarization Radar Clutter Identification" Atmosphere 8, no. 4: 72. https://doi.org/10.3390/atmos8040072
Note that from the first issue of 2016, this journal uses article numbers instead of page numbers. See further details here.