Article

Characteristics and Source Analysis of Water-Soluble Inorganic Ions in PM10 in a Typical Mining City, Central China

1
Hubei Key Laboratory of Mine Environmental Pollution Control & Remediation, School of Environmental Science and Engineering, Hubei Polytechnic University, Huangshi 435003, China
2
State Key Laboratory of Biogeology and Environmental Geology, School of Environmental Studies, China University of Geosciences, Wuhan 430074, China
3
Key Laboratory of Aerosol Chemistry and Physics (KLACP), Institute of Earth Environment, Chinese Academy of Sciences, Xi’an 710075, China
*
Author to whom correspondence should be addressed.
Atmosphere 2017, 8(4), 74; https://doi.org/10.3390/atmos8040074
Submission received: 17 February 2017 / Revised: 29 March 2017 / Accepted: 5 April 2017 / Published: 8 April 2017
(This article belongs to the Section Air Quality)

Abstract

:
A total of 61 PM10 samples in Huangshi (HS), Central China, were collected every sixth day from April 2012 to March 2013 and were analyzed for water-soluble inorganic ions (WSIIs) by ion chromatography. The sum of three major ions (SO42−, NO3, and NH4+) accounted for 75.8% of the total WSIIs on average. The results of a non-parametric test (Kruskal-Wallis) show that, except for Na+ (p > 0.05), the other ions present a distinctly seasonal variation with a statistically significant difference (p < 0.05). The minimum concentrations of all ions were found in summer, while the maximum values presented in autumn (for Ca2+) and winter (for Cl, NO3, SO42−, K+, NH4+, Mg2+). Based on the highest ratio of Cl/Na+ (3.02) and the highest concentration of K (4.37 μg·m−3), Ba (0.37 μg·m−3), and Sr (0.07 μg·m−3) in February 2013, it can be concluded that firework powders have aggravated the haze weather during the Spring Festival of 2013. The micro-equivalent concentrations of cations and anions were calculated and the comparisons between the calculated and measured NH4+ concentrations were conducted. The results illustrate that aerosol particles in HS are acidic and there may exist some other cationic ions not detected in this study. An obvious positive correlation and good linear regression among WSIIs suggest that the chemical forms in HS aerosols show a great variety of combinations, such as NH4NO3, NH4HSO4, (NH4)2SO4, NH4Cl, KCl, KNO3, NaCl, NaNO3, Ca(NO3)2, CaSO4, MgCl2, Mg(NO3)2, and MgSO4. The WSIIs have large positive correlation and linear regression with the elements, suggesting that WSIIs in mining cities are strongly influenced by element constituents. Principal component analysis implies that WSIIs in PM10 are probably from three sources. NH4+, Mg2+, NO3, K and K+, Cl and Cl, SO42−, and S accounted for 46.9% of the total variances, suggesting likely anthropogenic sources, especially coal combustion, vehicular exhaust, and biomass burning. Mg accounted for 23.3% of the total variances and Ca2+ and Ca explained 18.1% of the total variances, demonstrating that another important source is mineral dust from both natural and anthropogenic sources.

1. Introduction

Water-soluble inorganic ions (WSIIs) are major components of atmospheric aerosols, which have a direct effect on the acidity of atmospheric precipitation [1] and enhancing the harmfulness of pollutants [2,3]. Prior studies have shown that different regions presented different characteristics of WSIIs relating to the kinds of pollution sources and meteorological conditions [4,5]. Therefore, observations on WSIIs can not only reflect the quality of the atmospheric environment, but also provide a scientific basis for understanding the source, formation mechanism, and transmission processing of aerosols [6,7]. Aerosol WSIIs have been studied extensively in China, especially in large cities, such as Beijing and Tianjin [8], Shanghai [9], Guangzhou [10], Xi’an [11], and Xining [2]. The results illustrate that WSIIs can account for one-third, or more, of aerosol mass in urban regions and act as an important factor in the increase of particulate mass concentrations [4]. However, little is known about aerosol WSIIs in small and medium-sized cities, especially in Central China.
Located in the southeast of Hubei province and the middle and lower reaches of the Yangtze Rivers, Huangshi (HS, 30.12° N, 115.06° E) is a representative mining and industrial city known as the “Hometown of Chinese Bronze” and the “Cradle of the Nation’s Iron and Steel industry”. Using coal as its main energy, HS is also an important industrial base of raw materials in central China. The rapid development of HS’s heavy industry has caused high energy consumption and severe environmental pollution. In recent years, with the expansion of industrial scale (at an average annual growth rate of 12%) and increase of urban vehicles (at an average annual growth rate of 20%) (http://www.huangshi.gov.cn), atmospheric particulates have become the major pollutants that affect air quality and endanger human health [12,13]. HS is more than 4500 square km (1700 square miles) in area and has a population of more than 2 million. It belongs to a subtropical humid monsoon climate with abundant rainfall and sufficient sunshine. Moreover, it has four distinct seasons with high temperature and abundant precipitation in the summer, and is moist and slightly cold in winter. In this study, PM10 samples were successively collected in HS for a whole year. Chemical characteristics, temporal variation, and the source of WSIIs are reported for the first time. The results could provide a more accurate understanding of urban aerosols in Central China, and provide a theoretical foundation for the control and treatment of air pollution in HS.

2. Methods

2.1. Sample Collection

The sampling site (30°12′35.34″ N, 115°01′30.17″ E) is located on the rooftop of the School of Environmental Science and Engineering building (about 20 m above the ground level) at the Hubei Polytechnic University campus. The site is surrounded by residential areas and is about 1.5 km away from a major road with busy traffic, including a variety of vehicles, such as natural-gas-fueled city buses, gasoline-fueled cars and motorcycles, and diesel-fueled trucks, passenger cars, and agricultural vehicles.
The 24 h PM10 sampling was performed once every sixth day from April 2012 to March 2013. Additionally, eight parallel samples were collected in the four seasons. A total of 61 samples were gained without any operational error. Detailed sampling information is illustrated in Table 1. To account for any artifacts introduced during the sample collection and handling, field blank filters were also collected in each season. Sampling equipment used included an Airmetrics Tactical Air Sampler using quartz microfiber filters (47 mm, British Whatman Company, Maidstone, UK). Before sampling, quartz membranes were baked at 800 °C for 3 h to remove organic artifacts or impurities. After sampling, samples were frozen at −20 °C until further analysis. Simultaneously, Teflon filters for analyzing elements were sampled in order to better understand the source of mining aerosol in HS. Detailed sampling processing was exactly the same as quartz filters.
In Table 1, the study period was classified into the four seasons, such as spring (April, May, June), summer (July, August, September), autumn (October, November, December), and winter (January, February, March). During the sampling period, the temperature in summer was high (31.0–37.2 °C) and precipitation was concentrated (with the average monthly rainfall of 301 mm) while, in winter, the weather was moist (with the relative humidity of 87.1–94.0%) and slightly cold (3.1–7.2 °C). Specifically, the monthly average highest temperature (37.2 °C) appeared in July 2012 (summer), whereas the lowest (3.1 °C) appeared in February 2013 (winter). May 2012 (spring) was recognized as the driest month (relative humidity of 66.7%) and February 2013 (winter) was the most humid (relative humidity of 94.0%). The monthly highest wind speed (m/s) was observed as 3.0 m/s in May, June, and July of 2012, and no sustained wind was observed in January, February, and March of 2013.

2.2. Chemical Analysis

WSIIs were analyzed by an ion chromatograph (Dionex Inc., Sunnyvale, CA, USA). A quarter of the quartz filter after sampling was extracted with Milli Q water under ultrasonication for 1 h, filtered using a 0.45 μm microporous filter to remove insoluble material, and injected into the ion chromatograph. Cations were analyzed with 20 mmol·L−1 methane sulfonic acid, whereas anions were analyzed with 25 mmol·L−1 KOH. We used standard reference materials which were produced by the National Research Center for Certified Reference Materials (Beijing, China). The quality control standard of the Desert Research Institute was used to control ion concentrations. One sample was rechecked among every 10 samples. The allowable variation for ion concentrations should be in the range of 10–15%.
Teflon filters were analyzed for the presence of 51 elements (from Na to U) by energy-dispersive X-ray fluorescence spectrometry (the PANalytical Epsilon 5 ED-XRF analyzer, PANalytical, Almelo, The Netherlands) at the Institute of Earth Environment, Chinese Academy of Science. Detailed measurements, characteristics, and temporal variation of elements in these samples will be published elsewhere.

3. Results and Discussion

3.1. Chemical Characterization

The average mass concentration of WSIIs in HS aerosols are shown in Table 2. The sequence of the mean concentrations of WSIIs in descending order was SO42− > NO3 > NH4+ > Cl > Ca2+ > Na+ > K+ > Mg2+ > F. The three ions SO42−, NO3, and NH4+ were the main species, which were secondarily converted from gas precursors SO2, NOx, and NH3, respectively [4,14]. Among cations, NH4+ had the highest mean concentration (7.77 μg·m−3) followed by Ca2+ (5.29 μg·m−3) and Na+ (5.25 μg·m−3) while, among anions, SO42− had the highest mean concentration (30.9 μg·m−3), followed by NO3 (21.1 μg·m−3) and Cl (5.32 μg·m−3).
It can be seen from Table 2 that, apart from Tianjin and Shijiazhuang, China, the mean concentration of SO42− was higher than other sites. The mean concentrations of NO3, Cl, NH4+, and K+ were higher than other areas, except Beijing, Tianjin, and Shijiazhuang, China, respectively. Aside from Shijiazhuang, China, the mean concentration of Ca2+, Na+, Mg2+ and F was greater than other areas, respectively. Thus, we can find that the pollution of WSIIs in HS aerosols is much more serious with increasing industrial development and urbanization [12,13].

3.2. Temporal Variation

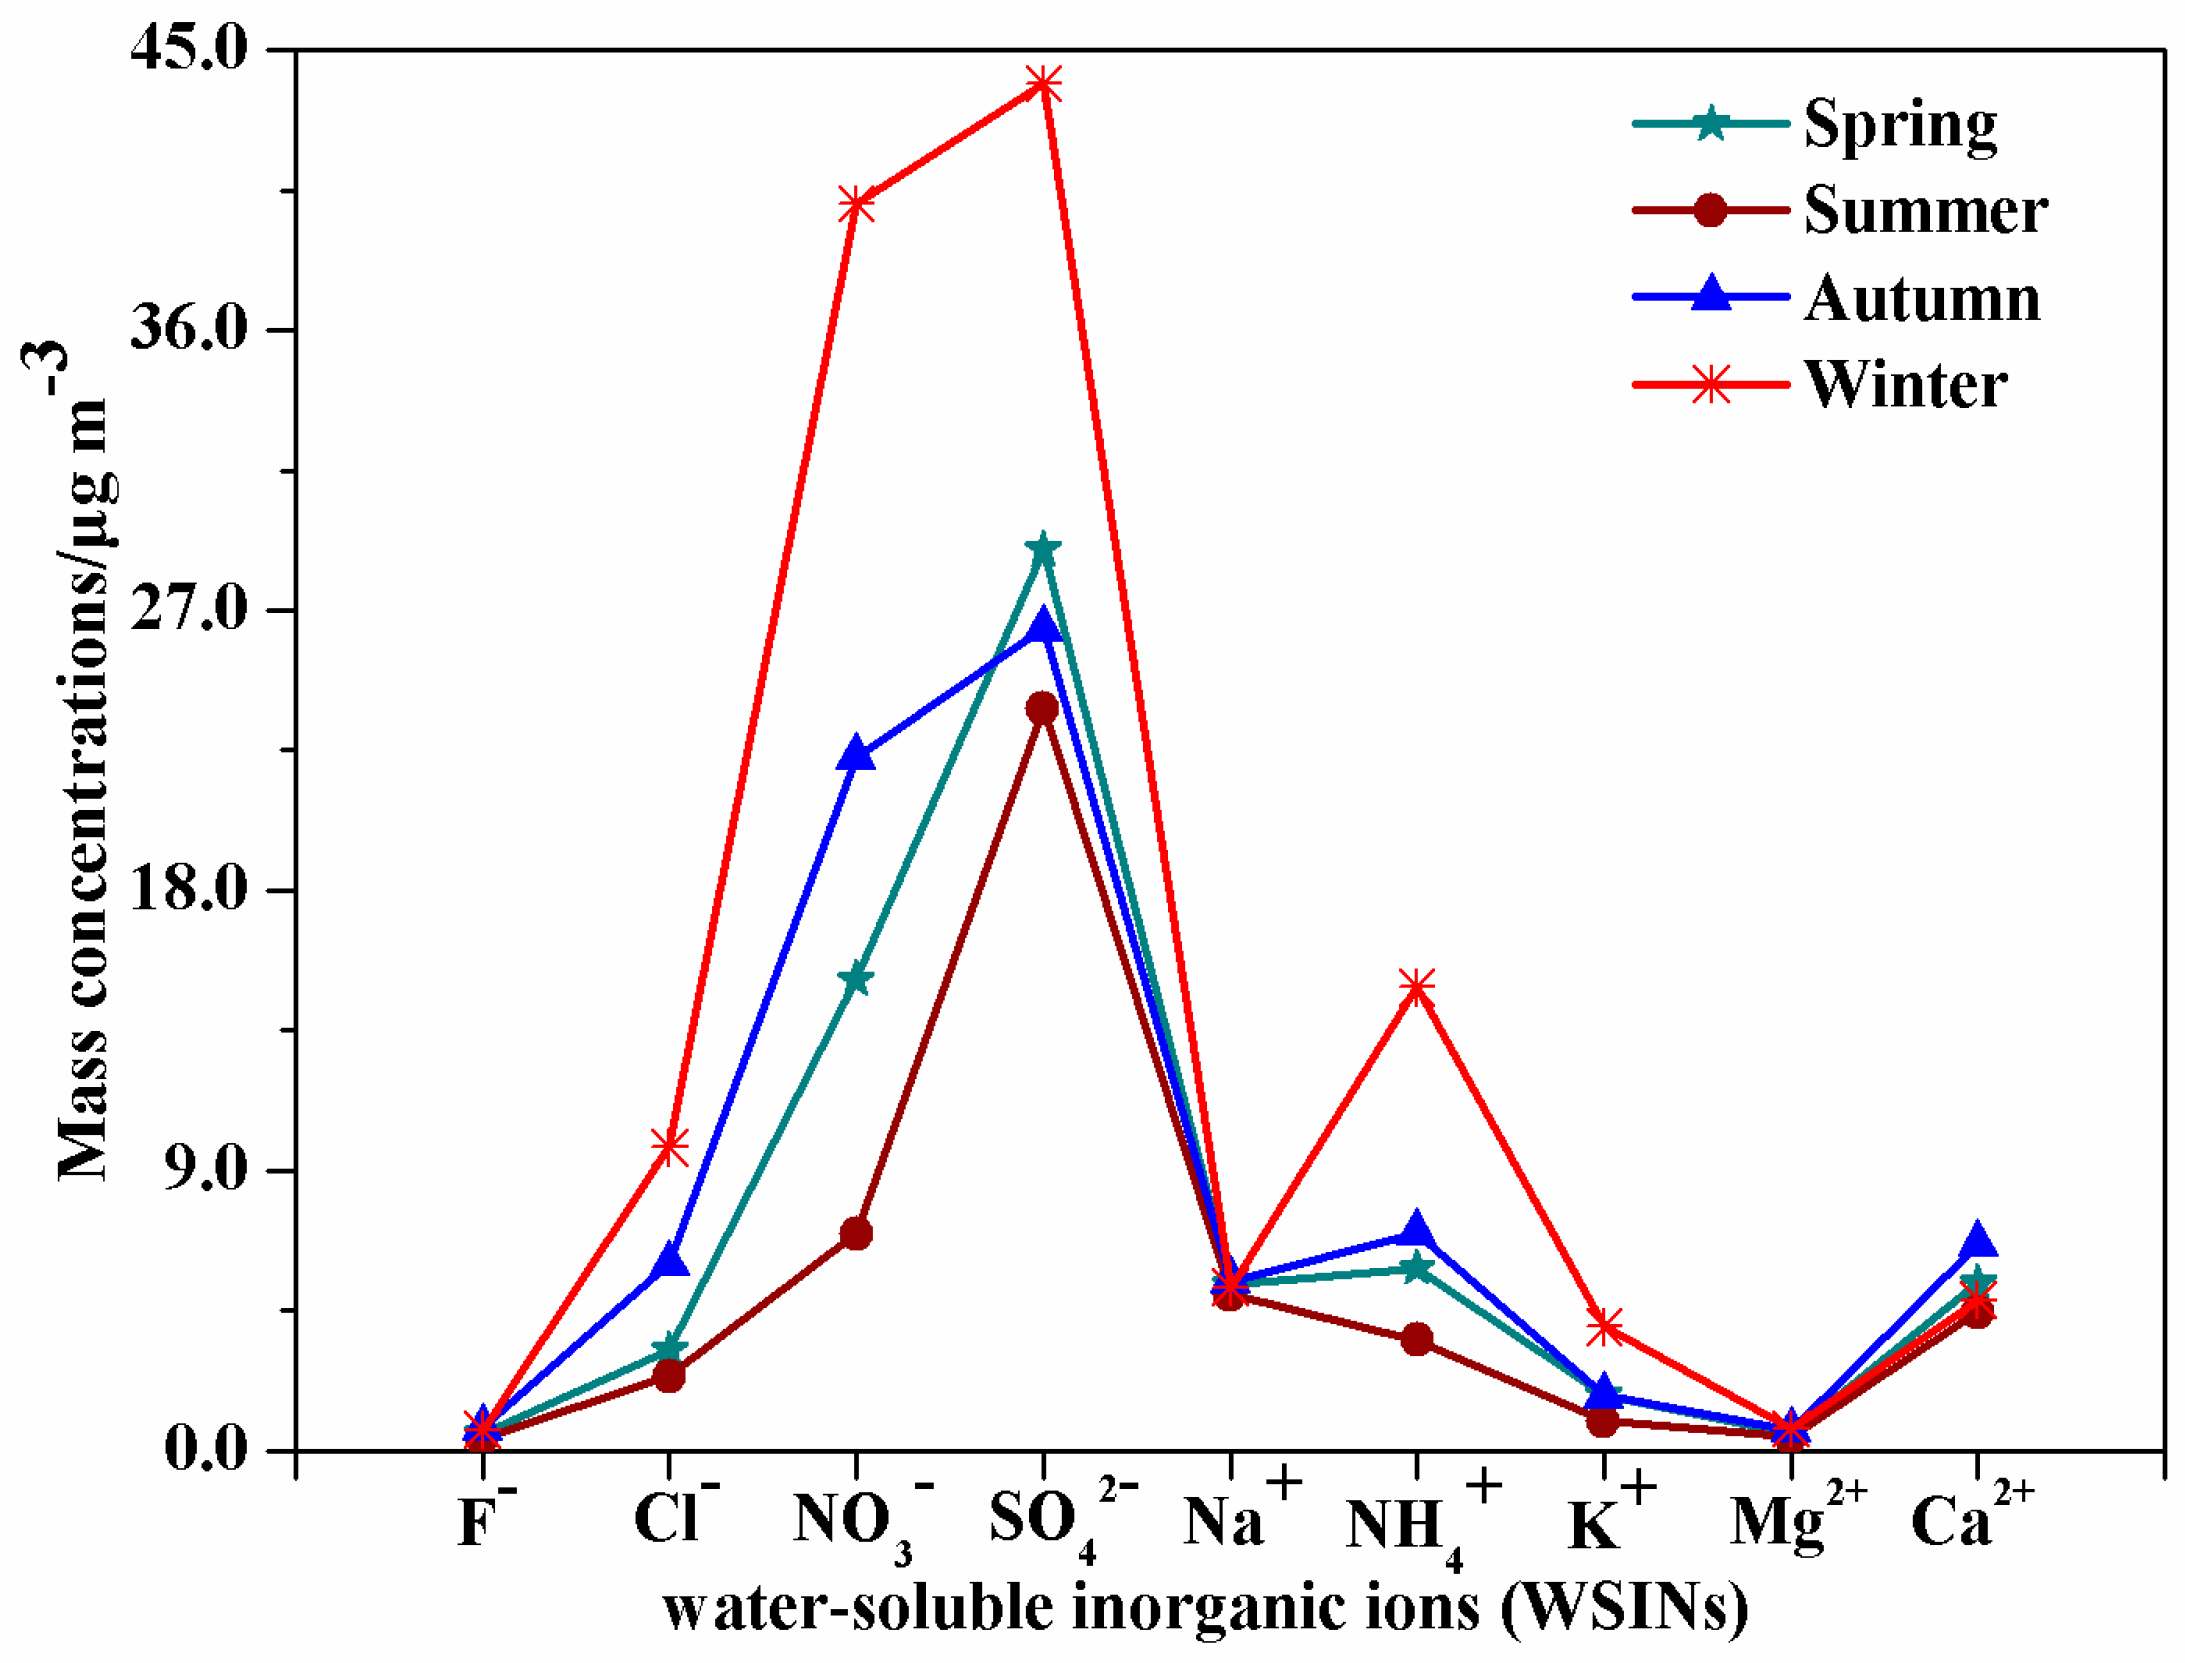
3.2.1. Seasonal Variation

The sequence of the total mass concentration of WSIIs in the four seasons was winter (375.2 μg·m−3) > autumn (229.7 μg·m−3) > spring (200.6 μg·m−3) > summer (144.9 μg·m−3), presenting distinctly seasonal variation. The result states that less rainfall, low temperature, higher relative humidity, and no sustained wind in HS winter (Table 1) can easily strand atmospheric pollutants. In addition, increasing coal use for resident’s daily life and industrial production in winter in HS may cause high concentrations of total WSIIs.
A non-parametric test (Kruskal-Wallis) was applied to verify that if the seasonal difference for the ions was statistically significant. The specific significance level (p) is 0.84 for Na+, 0.01 for Ca2+, and 0.00 for SO42−, NO3, Cl, F, NH4+, K+, and Mg2+. The results show that, except for Na+ (p > 0.05), the other eight ions present distinctly seasonal variation with statistically significant differences (p < 0.05). As shown in Figure 1, there was no obvious seasonal trend for Na+. The seasonal cycle of SO42−, NO3, Cl, F, NH4+, K+, and Mg2+ appeared to trend high in winter, moderate in autumn and spring, and low in summer, which is similar to the seasonal variation of the total WSIIs. Interestingly, the ratio of winter concentration to summer concentration was 5.74 (for NO3), 4.20 (for NH4+ and K+), and 4.10 (for Cl), respectively, greater than the ratio for total WSIIs (2.59). The result implies that, in addition to environmental meteorological factors, some other factors may increase the concentrations of these ions. It will be discussed in a later section. It is noteworthy that, as a typical ion of flowing dust [13,20], Ca2+ decreased in the order of autumn > spring > winter > summer. The result illustrates that Ca2+ concentration is immensely influenced by anthropogenic activities, especially in periods of moderate weather, such as autumn and spring [4,21]. It can be confirmed that, with accelerating urbanization processes in recent years in HS, a large number of surfaces from construction operations are emerging every year, thus increasing dust sources and resulting in the rise of Ca2+ concentrations due to a lack of necessary enclosed structures and watering measures.

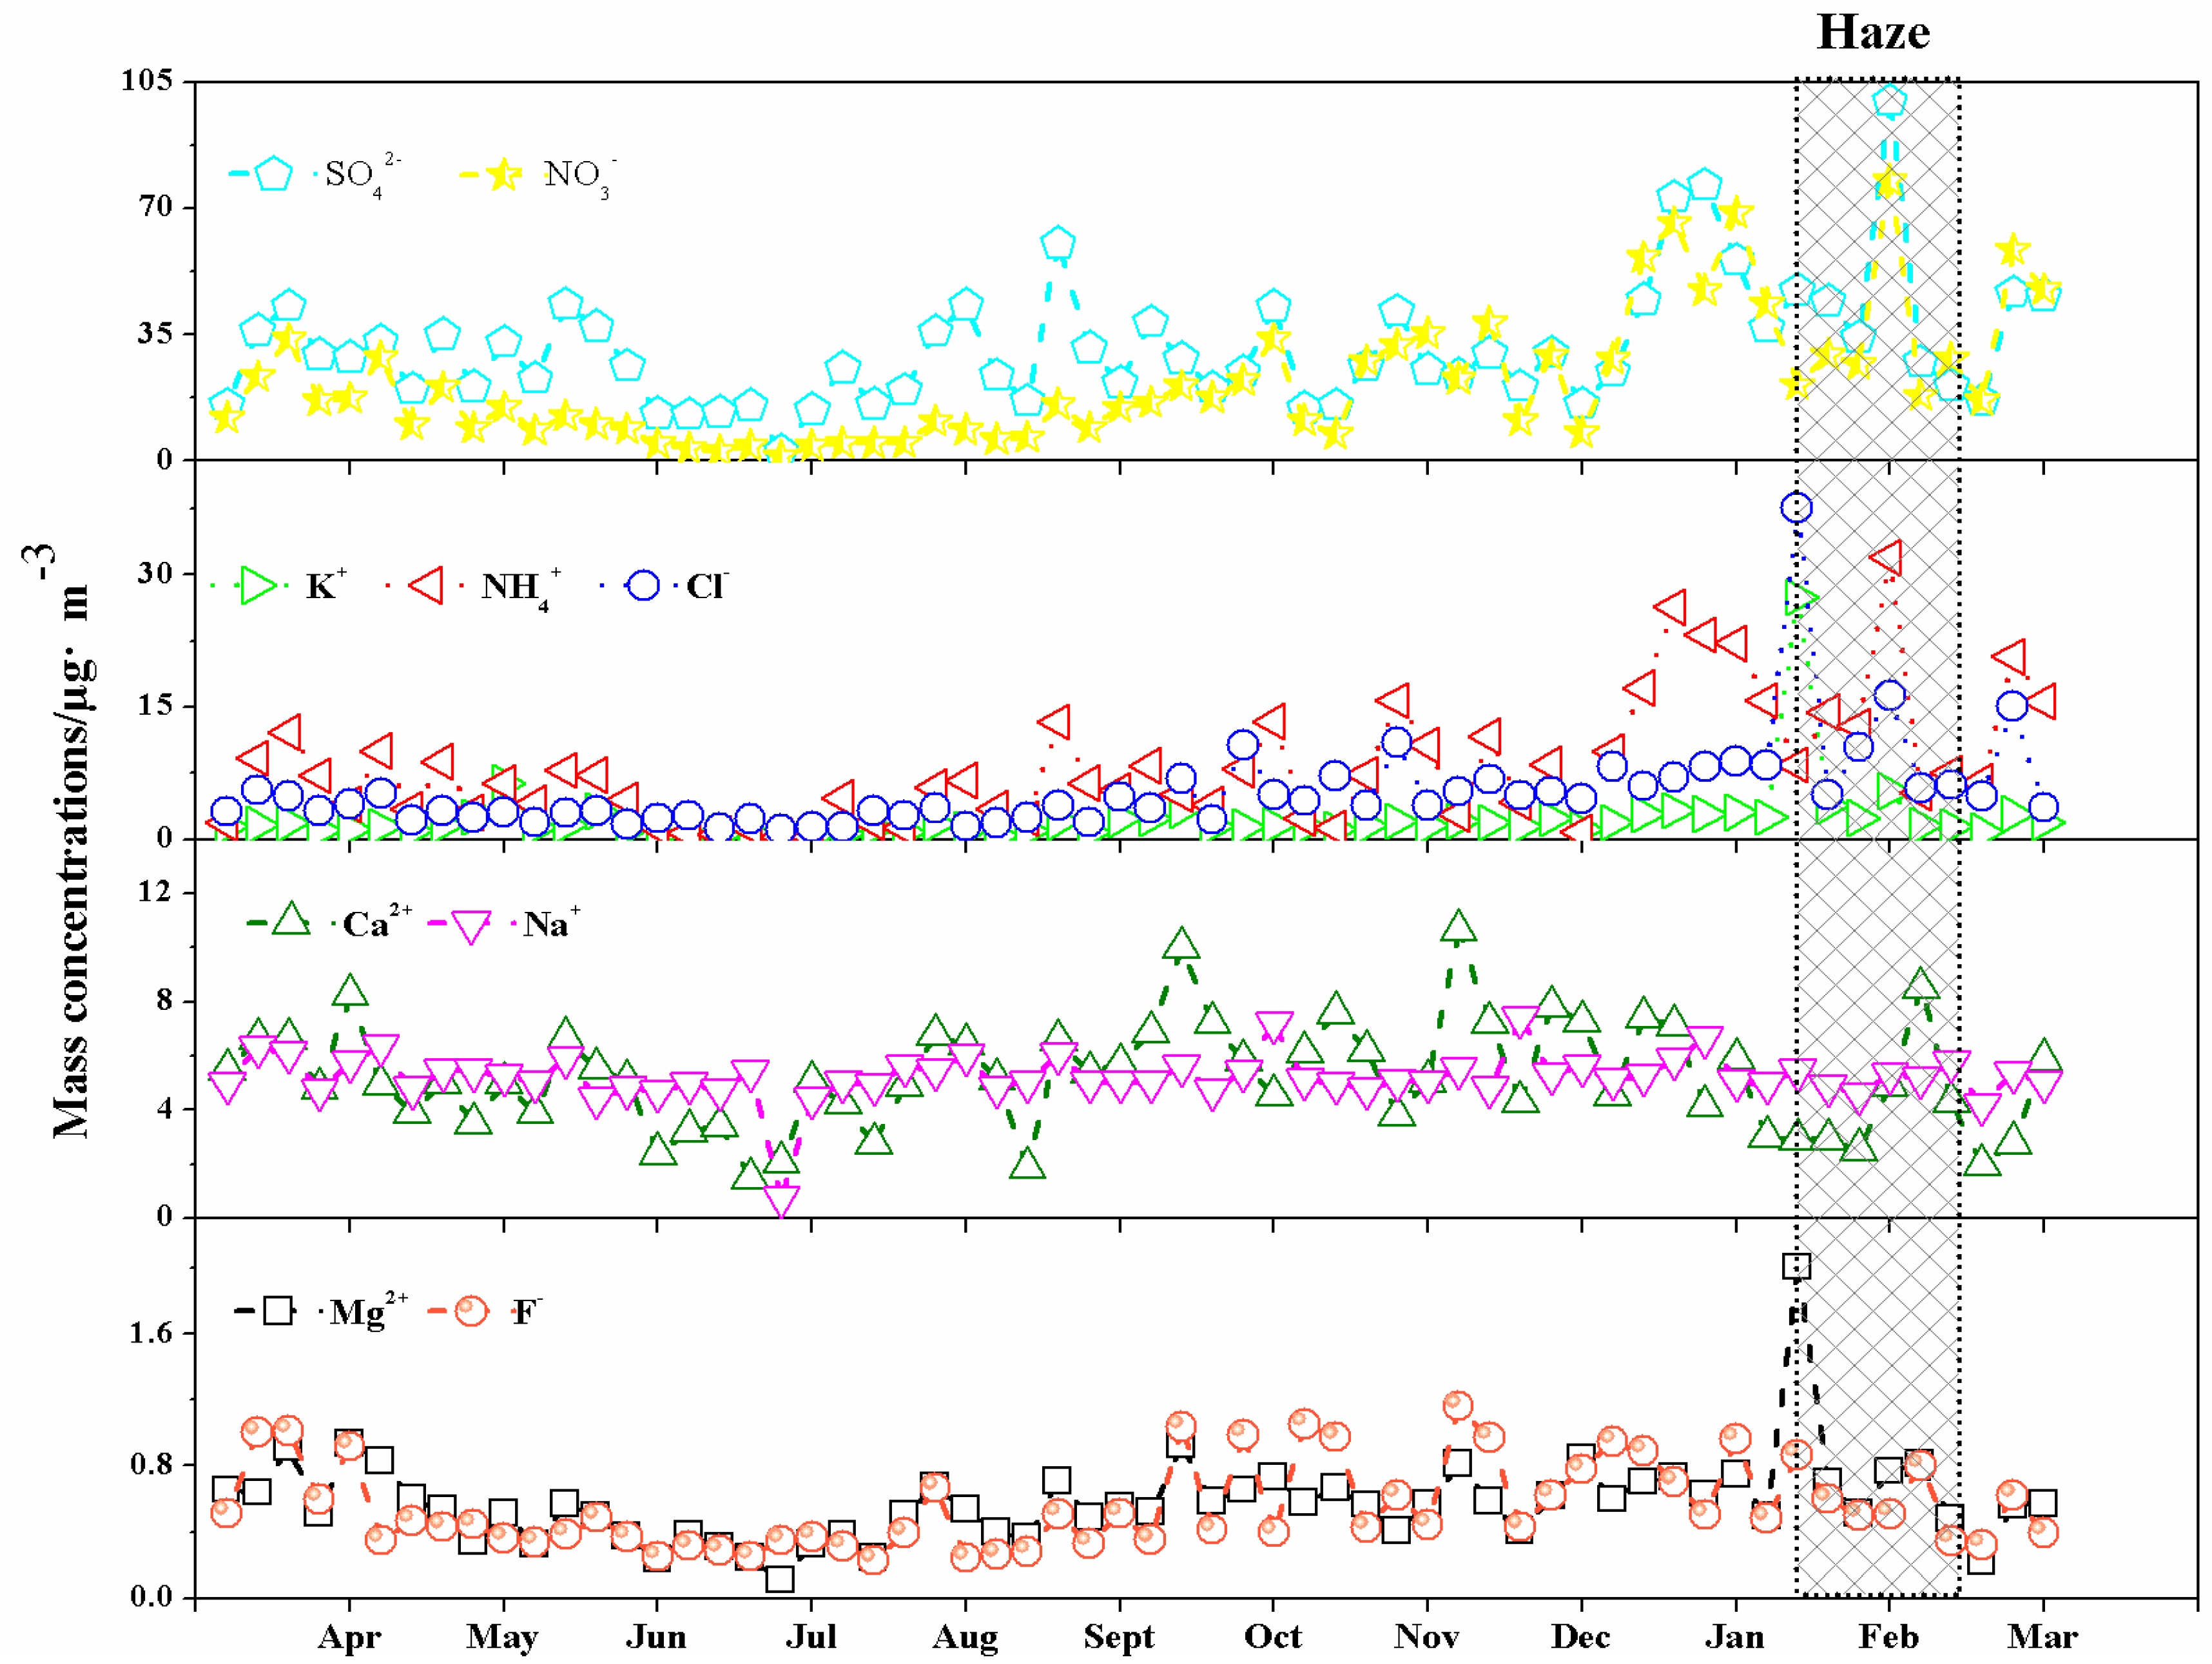
3.2.2. Monthly Variation

The monthly variation of the concentration of nine water-soluble ions in PM10 in HS city is shown in Table 3 and Figure 2. All of the ions appeared at the lowest concentrations in July 2012, suggesting that high temperature (average 37.2 °C), frequent rainfall, and more wind with an average speed 3.0 (m/s) (Table 1) have promoted diffusion and dilution of particulates in HS.
The highest concentration of Na+ and Ca2+ presented in December 2012. The ratio of the highest concentration to the lowest value in July 2012 was 1.41 for Na+ and 2.45 for Ca2+, respectively, showing the comparatively modest monthly change. The highest concentrations of all of the other six ions were found in February 2013. The ratio of the highest concentration to the lowest value in July 2012 was 4.48 for SO42−, 9.05 for Cl, 15.44 for NO3, 3.27 for Mg2+, 19.06 for K+, and 28.09 for NH4+, respectively. The above results illustrate strong monthly change, suggesting that a pollution episode is to be certain during the Spring Festival of 2013 in HS.

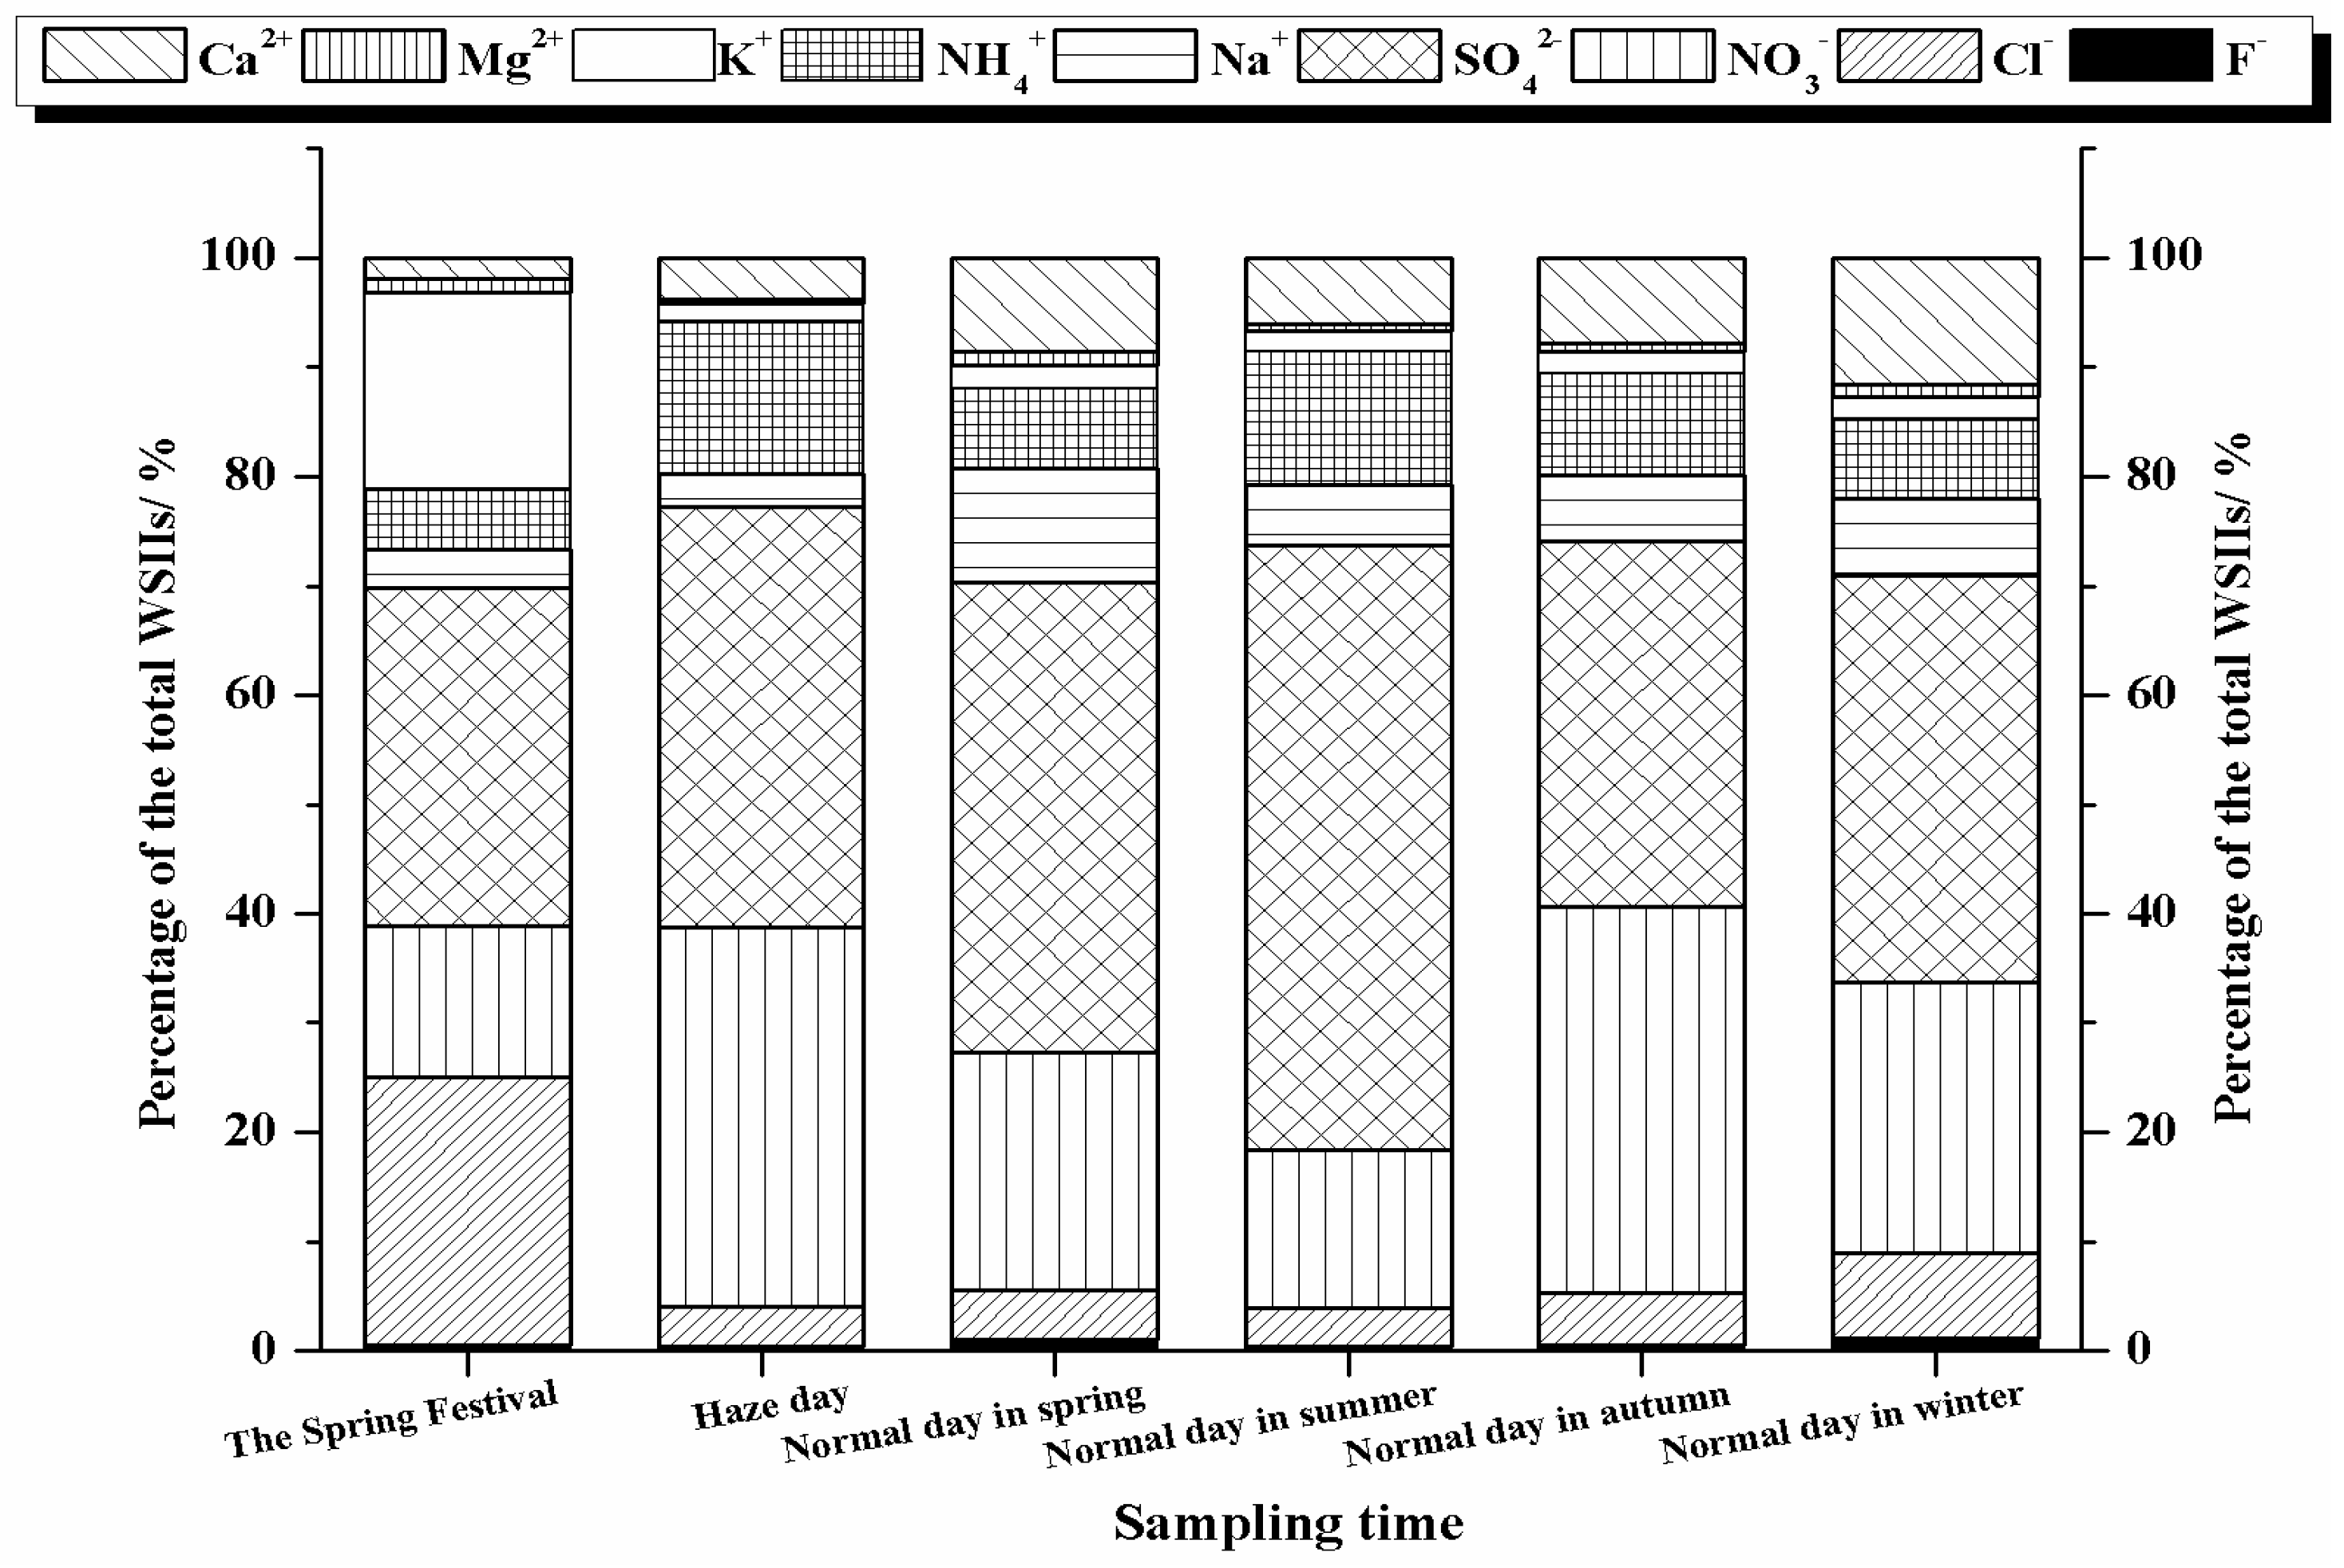
3.3. The Pollution Episode in February 2013

In China, frequent haze events have attracted much attention because of poor air quality across the country [11,22]. According to the China Weather Website (www.weather.com.cn) reports, Hubei province suffered haze weather during the Spring Festival of 2013. HS, located in southeast of Hubei province, had issued a yellow warning in February because of the haze weather continuing for ten days. It can be concluded that low temperature (average 3.1 °C), high relative humidity (average 94.0%), and no sustained wind in February 2013 (Table 1) could be the crucial meteorological factors which prevented the diffusion and dilution of particulates, making it easy to form haze.
Concentrations of total WSIIs and respective ions (SO42−, Cl, NO3, Mg2+, K+, and NH4+) in February 2013 were generally higher than those in other months (Table 3), indicating that firework displays could influence atmospheric particle levels during the Spring Festival in HS [23]. Tsai et al. [24] demonstrated that the ratio of Cl/Na+ can be used as the indicator of firework burning. As shown in Table 3, the Cl/Na+ ratio (average 0.85) was slightly lower during the sampling periods, but it significantly rose up to 3.07 in February 2013, which was similar to that in Taiwan (3.20) during Taiwan’s Lantern Festival [24], verifying that Cl comes from the chlorine contents of firework powders.
Interestingly, it can be seen from Table 3 that the total concentration of elements in February 2013 showed the highest value (7.12 μg·m−3). This may be due to the setting off of fireworks that caused the elevated levels of metallic elements [23,25]. The highest concentrations of K (4.37 μg·m−3), Ba (0.37 μg·m−3) and Sr (0.07μg·m−3) occurred in February 2013 (Table 3), which were related to the raw materials in firework powders (e.g., KNO3, Ba(NO3)2, Sr(NO3)2, etc.) [23,25]. Thus, the results can be concluded that firework powders had emitted a significant amount of aerosol particles containing metals and ions into the atmosphere, and then aggravated the haze in February 2013.
In addition, we investigated the difference among WSIIs characteristic in different days. The specific days were the Spring Festival day (9 February 2013), haze day (15 February 2013), and a normal day in spring (9 May 2012), summer (18 September 2012), autumn (17 November 2012) and winter (5 March 2013). As shown in Figure 3, the percentages of K+ (24.5%) and Cl (17.9%) in the Spring Festival day were clearly higher than other days, verifying that firework displays could influence atmospheric particle levels. And the total percentages of the major species K+, Cl, SO42− and NO3 in the Spring Festival day reached 84.1%. In haze day, the main ions were SO42− (38.5%), NO3 (34.7%) and NH4+ (13.8%), accounting for the percentage of 87.0% of the total WSIIs. However, apart from SO42− and NO3, there were other major ions in normal day in spring (Na+ and Ca2+), summer (NH4+), autumn (NH4+ and Ca2+) and winter (Ca2+, Cl, NH4+ and Na+).

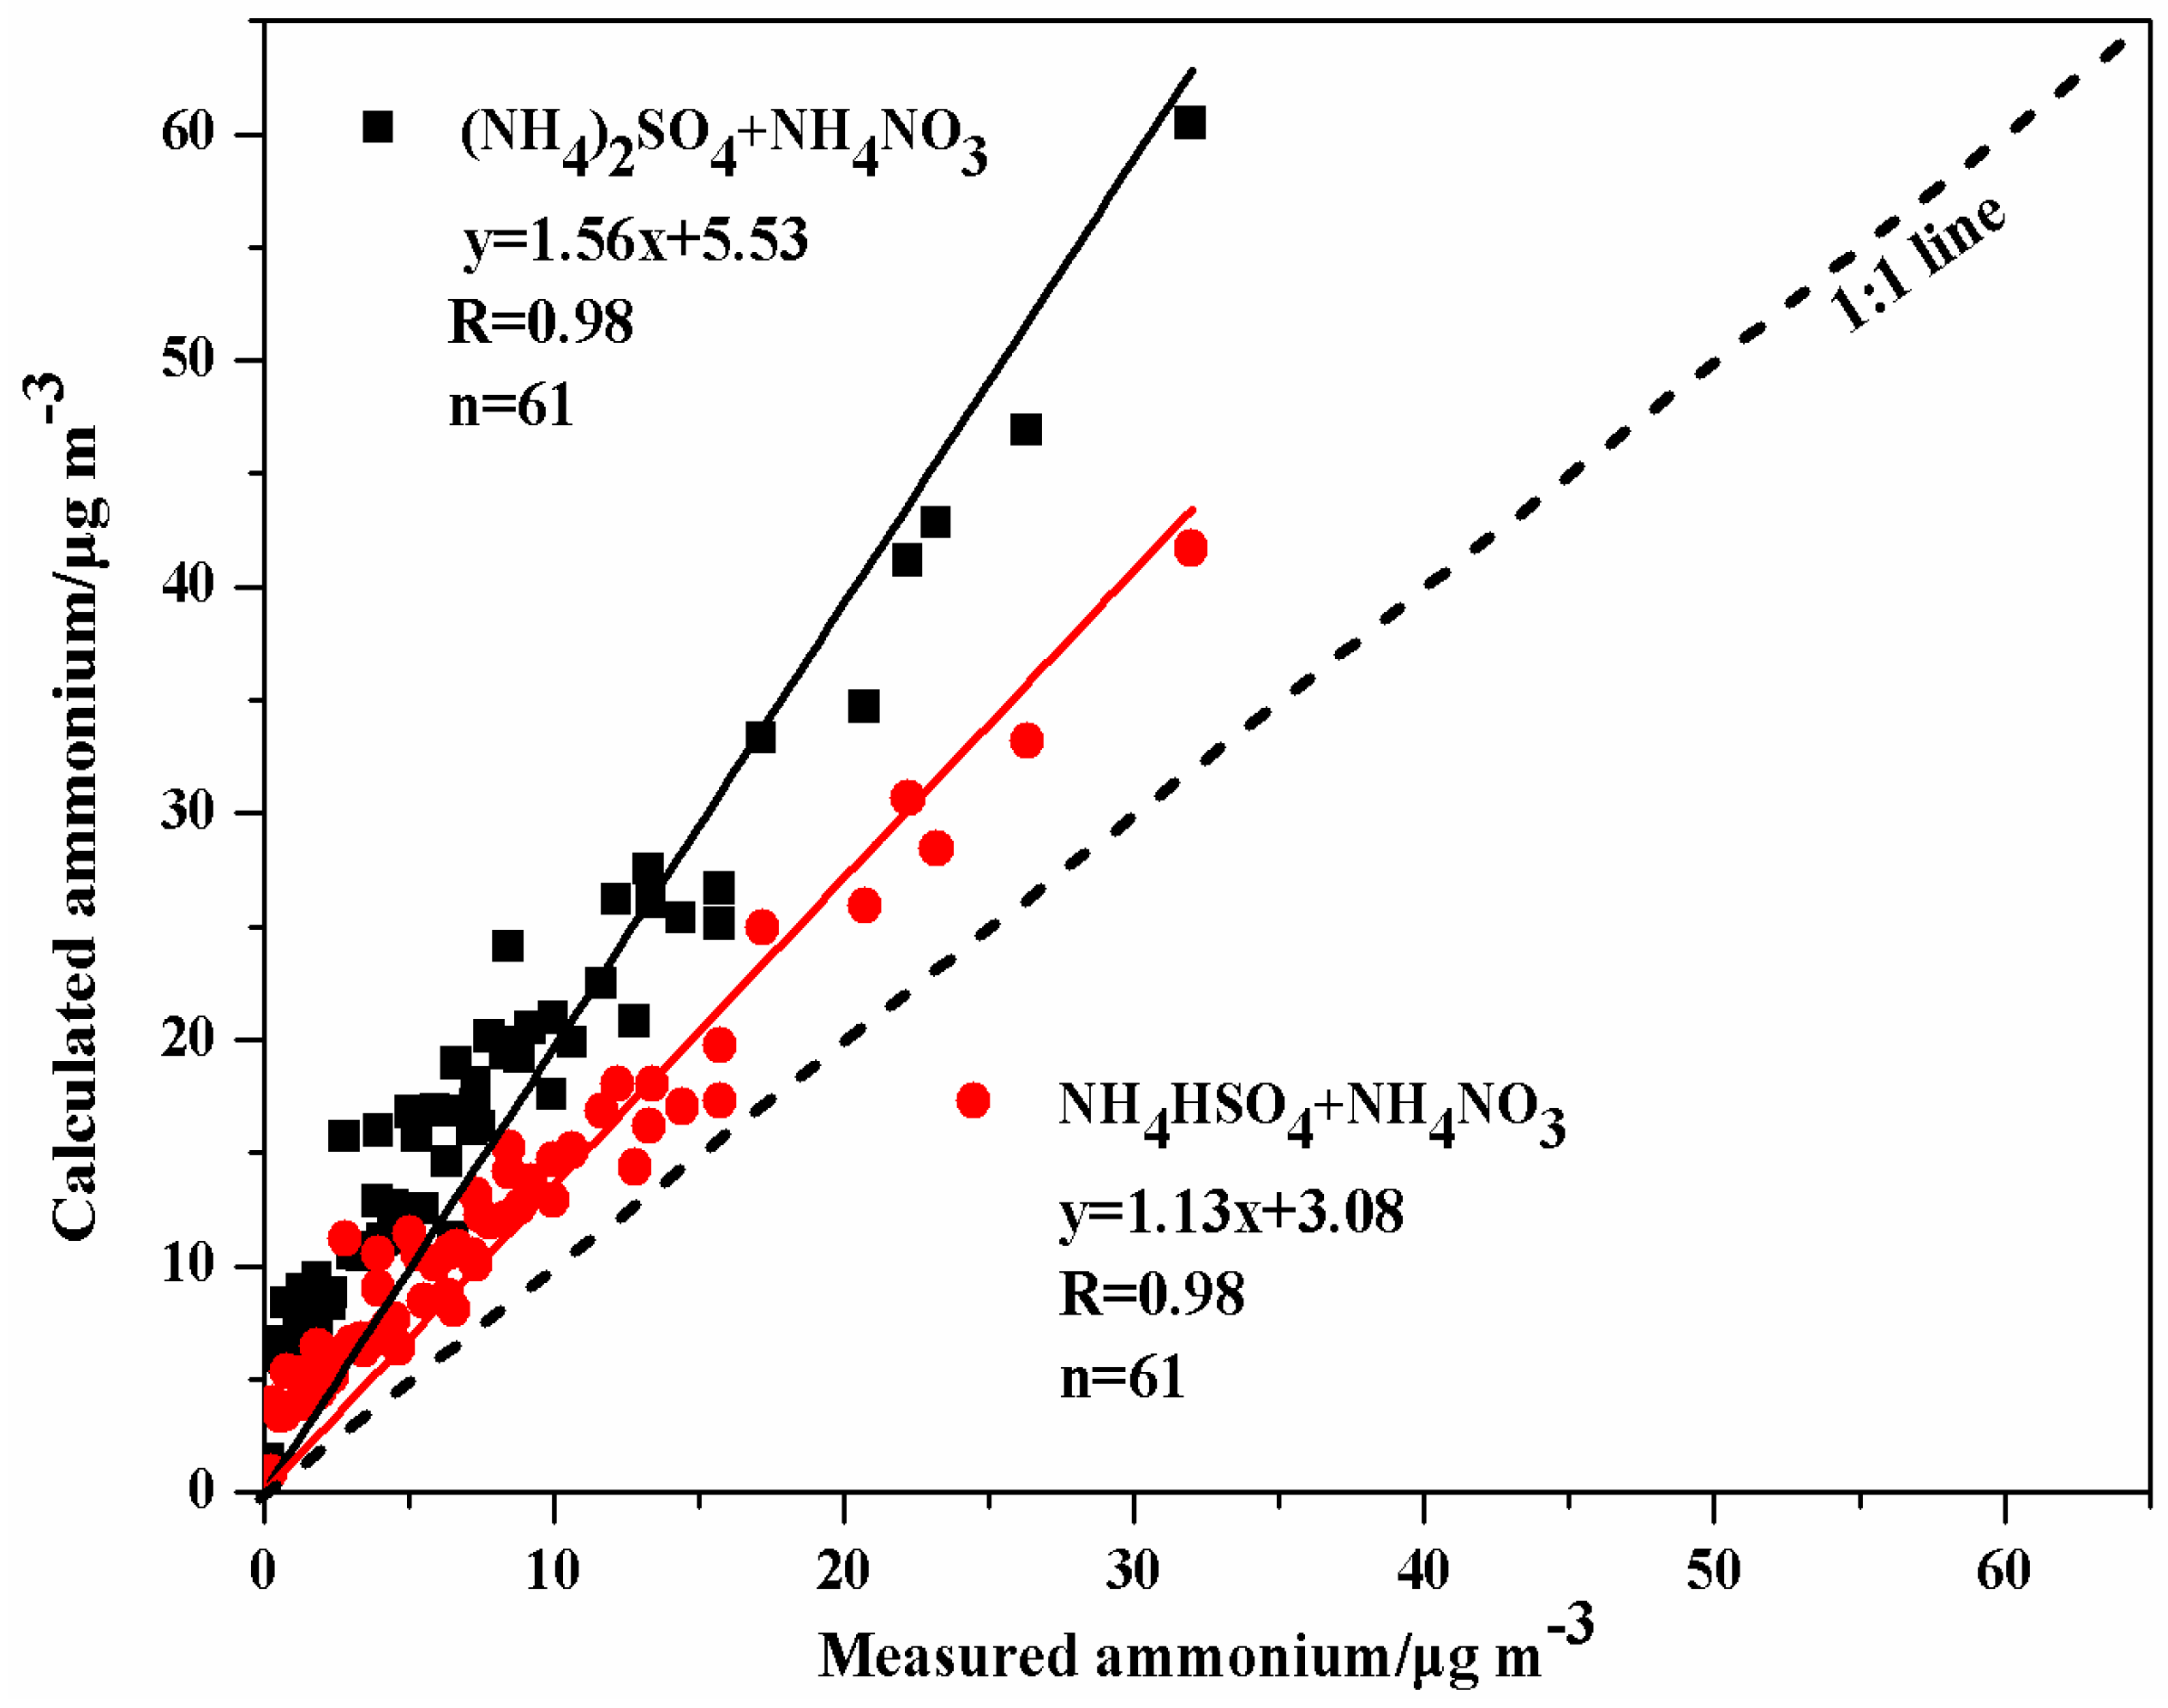
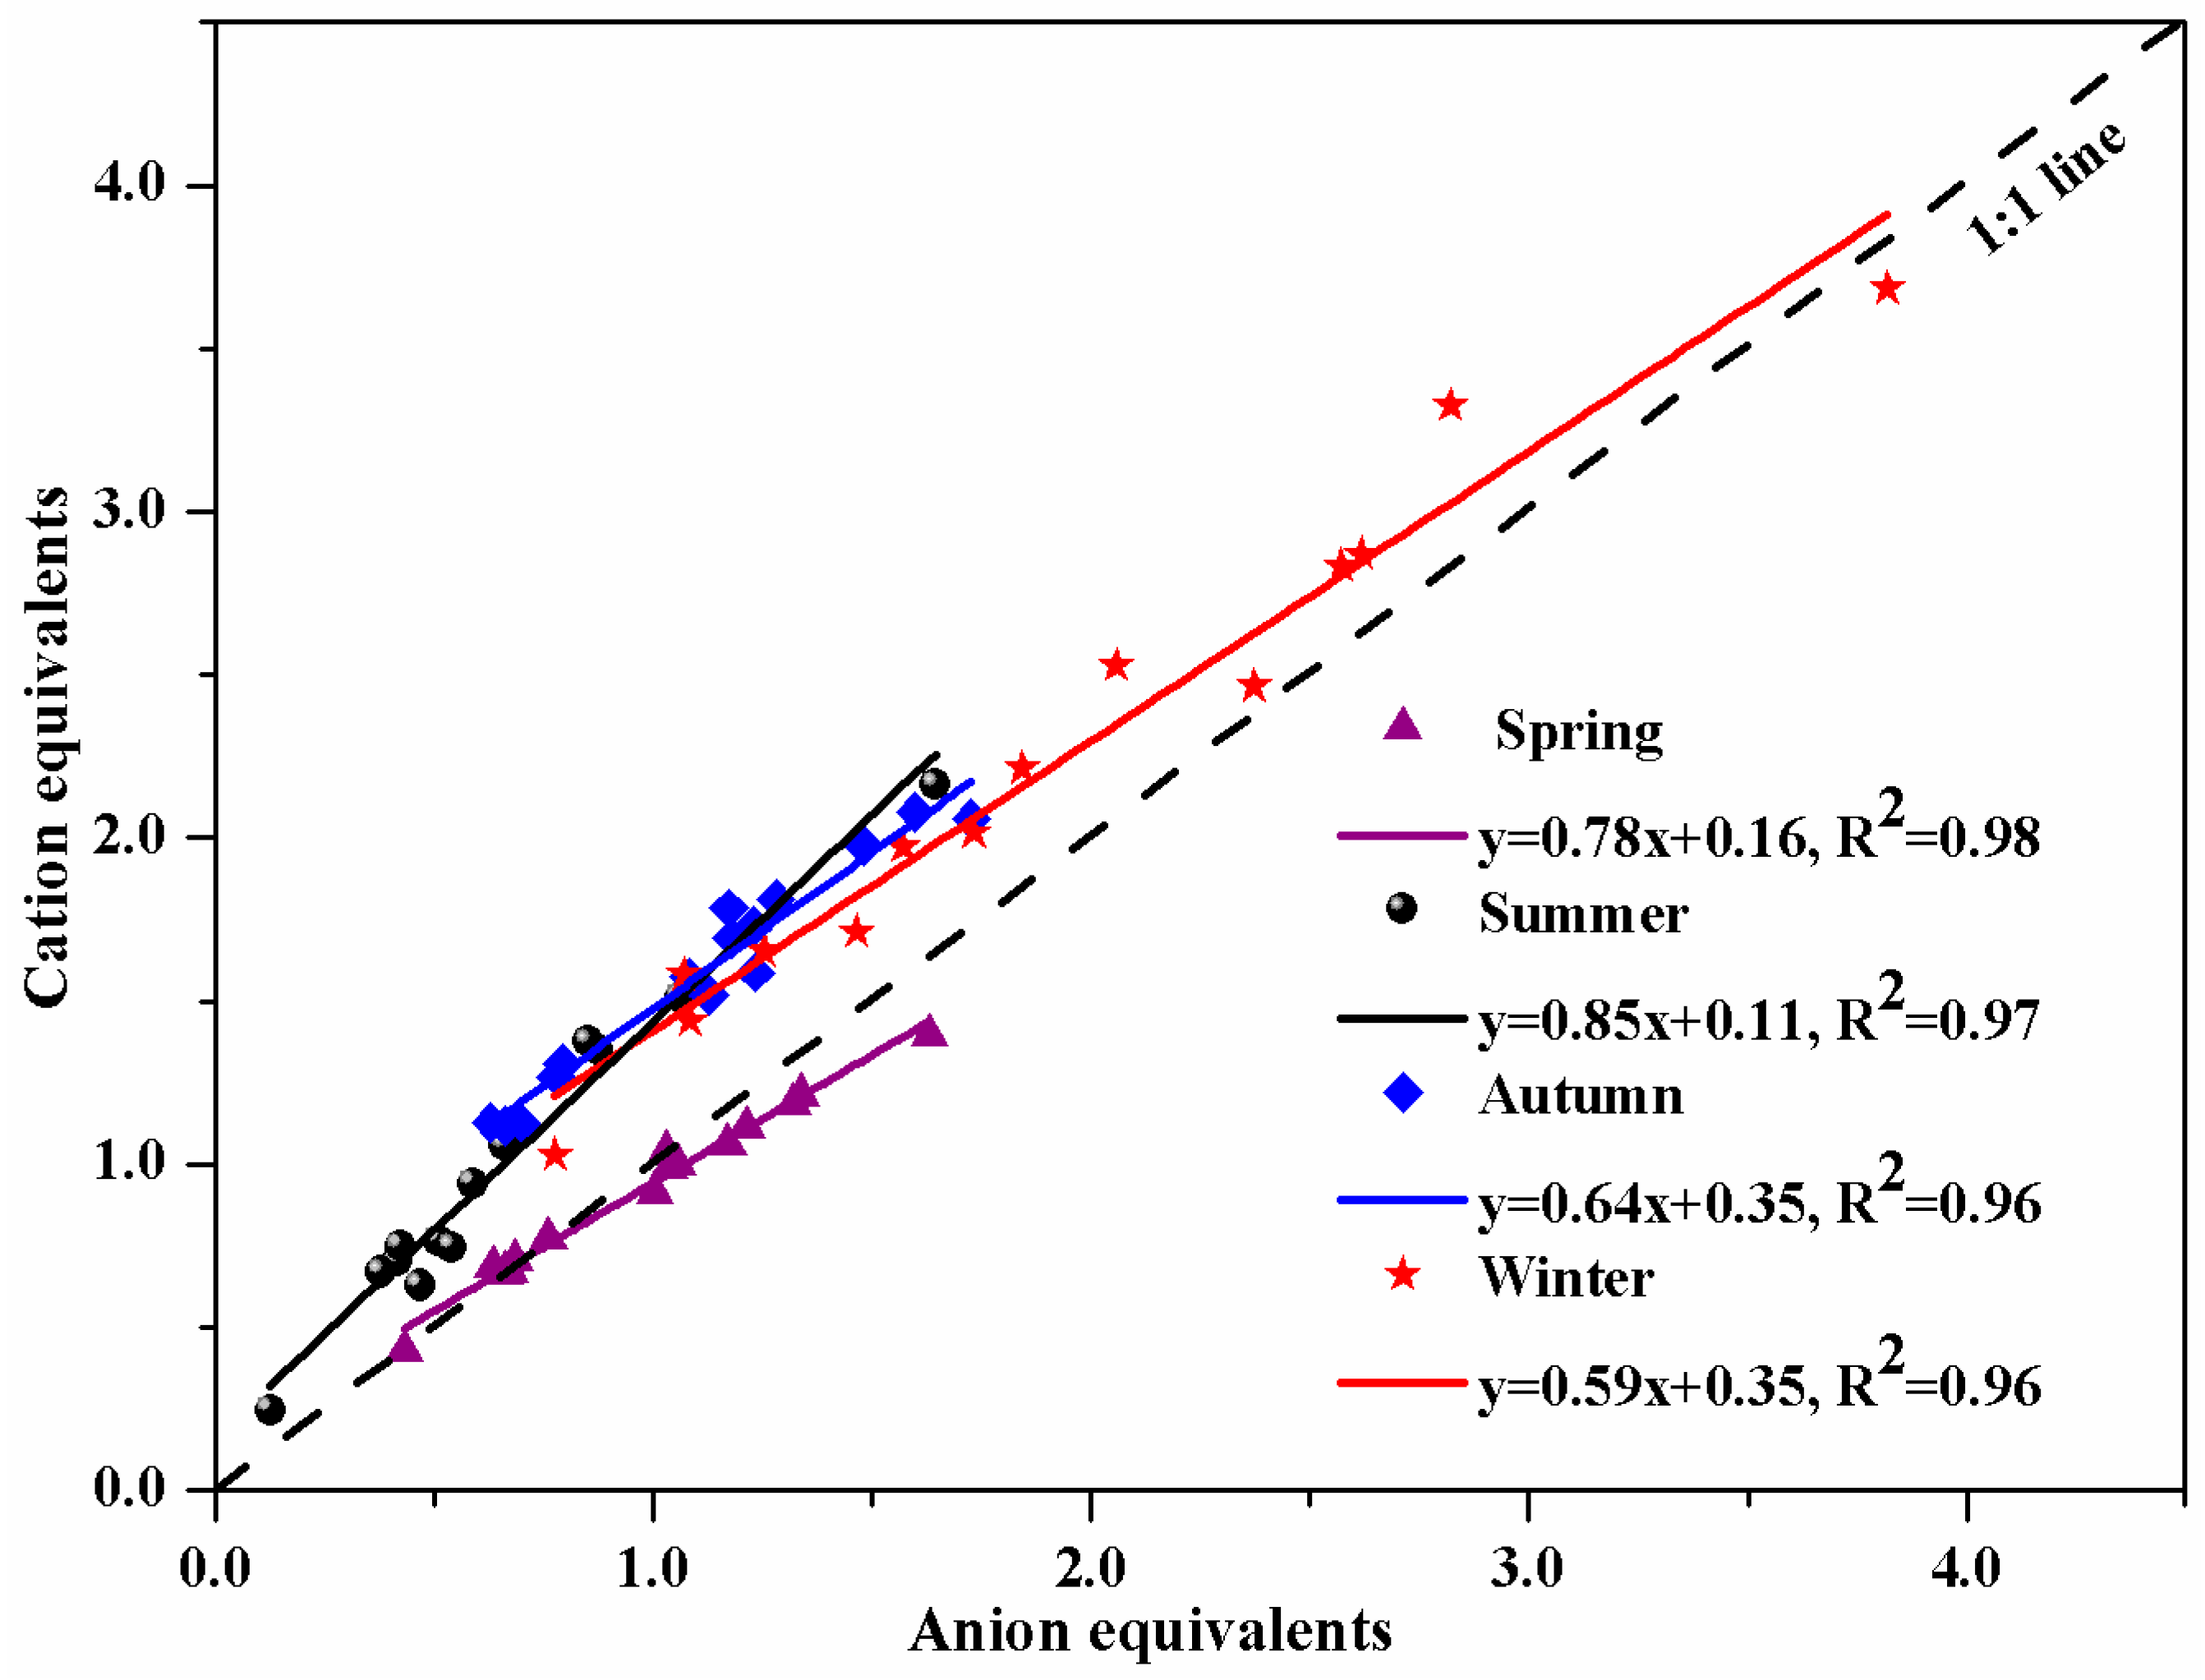
3.4. Charge Balance Analysis of WSIIs

The micro-equivalent concentrations of cations and anions in PM10 were calculated by the corresponding equations [21,26,27]. The linear relationship between cation and anion equivalents in the four seasons in HS is drawn in Figure 4. The correlation coefficients (R2) reached 0.98, 0.97, 0.96, and 0.96 in spring, summer, autumn, and winter, respectively. The results suggest that the cation and anion equivalents were strongly correlated in the four seasons. The slope (cation/anion) of the linear regression was 0.78, 0.85, 0.64, and 0.59 in spring, summer, autumn, and winter, respectively. All of the slopes are significantly lower than 1, which could be best explained by the presence of hydrogen ions (H+) [20,28], implying that the aerosol particles in HS are acidic. Moreover, all of the slopes have a relatively large gap with 1, indicating that there are some other cationic ions not detected except those had been measured in this study (Na+, K+, NH4+, Mg2+, and Ca2+), such as H+ [28], organic cations, or heavy metal ions (Zn2+, Cu2+, etc.) [4]. Especially, compared with other seasons, the lowest slope appeared in HS in winter, which carries a certain probability that PM10 in HS contains organic cations or heavy metal ions in winter. This is one of the reasons that the days of heavy pollution weather in winter were more than the days in the other three seasons, such as the pollution episode in February 2013 in HS.
Comparisons between the calculated and measured NH4+ concentrations were conducted to evaluate the formation of ions. NH4+ concentrations can be calculated based on the stoichiometric ratios of the major compounds (i.e., (NH4)2SO4, NH4HSO4, and NH4NO3), which assumed that NO3 is in the form of NH4NO3 and that SO42− is in the form of either (NH4)2SO4 or NH4HSO4. Figure 5 shows good correlation (R = 0.98) between calculated and measured NH4+ concentrations. The slope was 1.56 when (NH4)2SO4 was assumed and 1.13 when NH4HSO4 was assumed. This suggests that the aerosol particles in HS are acidic because of the existing available NH4+ is not fully neutralized. The similar conclusion can be found in many studies [20,26,27].

3.5. Source Identification

3.5.1. The Ratio of NO3/SO42−

The mass concentration ratio of NO3/SO42− can be used as a significant index to measure the relative contribution of mobile sources and stationary sources for nitrogen pollution and sulfur pollution in the atmosphere [4,29]. We found that the ratio in HS aerosols was 0.26–1.01 with an average of 0.65 (Table 3), implying that ion pollution largely comes from stationary sources. The ratio in HS aerosols was lower than those from Beijing (1.34), Tianjin (1.03) and Shijiazhuang (1.05) [8], Shanghai (1.15) [9], China, and Southern Spain (0.86) [17], but higher than those from Yichang, China (0.40) [7], Taipei, Taiwan (0.21) [15], Ishikawa, Japan (0.39) [16], and Mohal, India (0.48) [18].

3.5.2. Correlation Analysis

Table 4 shows the Pearson correlation coefficients among these WSIIs in the PM10 samples. NH4+ was strongly correlated with SO42− in spring (R = 0.90), summer (R = 0.95), autumn (R = 0.87), and winter (R = 0.92). Additionally, good linear regression was performed for NH4+ and SO42− in spring (R2 = 0.81), summer (R2 = 0.90), autumn (R2 = 0.75), and winter (R2 = 0.90). The result suggests that (NH4)2SO4 and NH4HSO4 are the major chemical fractions. The linear (micro-equivalent vs. micro-equivalent) fits of the data were described as [NH4+] = 0.82 [SO42−] − 0.16 in spring, [NH4+] = 0.63[SO42−] − 0.11 in summer, [NH4+] = 1.18[SO42−] − 0.27 in autumn, and [NH4+] = 0.85[SO42−] + 0.07 in winter. Since the equivalent ratio of NH4+ to SO42− in NH4HSO4 and (NH4)2SO4 is 0.50 and 1.00, respectively, both NH4HSO4 and (NH4)2SO4 were the major chemical forms of WSIIs in spring, summer, and winter, while (NH4)2SO4 was completely formed in autumn.
The strong correlation was found between NH4+ and NO3 in spring (R = 0.85), summer (R = 0.88), autumn (R = 0.86), and winter (R = 0.95), and good linear regression was obtained for NH4+ and NO3 in spring (R2 = 0.73), summer (R2 = 0.77), autumn (R2 = 0.74), and winter (R2 = 0.87). Thus, it can be implied that NH4NO3 was another major compound in HS.
According to the significant correlation and good linear regression, other chemical species in the aerosol particles were also found. Among them, Na+ mainly constituted NaCl (R = 0.78) and NaNO3 (R = 0.77) in spring. K+ formed KCl (R = 0.90) and KNO3 (R = 0.91) in summer, and KCl (R = 0.94) in winter. Mg2+ comprised MgF2 (R = 0.74) and Mg(NO3)2 (R = 0.79) in spring, MgSO4 (R = 0.85) in summer, and MgCl2 (R = 0.87) in winter. Ca2+ composited CaF2 (R = 0.72) in spring, Ca(NO3)2 (R = 0.71) and CaSO4 (R = 0.76) in summer. Additionally, NH4Cl came into being in spring as a compound of NH4+ with correlation coefficient (R) reached 0.72.
Pavuluri et al. [30] had verified that mineral dust can add aerosol complexity because of its important role in radiative forcing. Considering that HS is a typical mining and industrial city, the relative correlations between elements and inorganic ions were analyzed (Table 4). We found that inorganic ions had good positive correlation with corresponding elements. Strong correlations were observed for SO42− and S in spring (R = 0.84), summer (R = 0.88), autumn (R = 0.87), and winter (R = 0.85). And good linear regression was conducted for SO42− and S in spring (R2 = 0.70), summer (R2 = 0.78), autumn (R2 = 0.76), and winter (R2 = 0.73). Ca2+ and Ca had strong correlation in spring (R = 0.88), autumn (R = 0.85), and winter (R = 0.95). Additionally, good linear regression was performed for Ca2+ and Ca in spring (R2 = 0.77), autumn (R2 = 0.72), and winter (R2 = 0.91). Moreover, strong correlations were often observed for Mg2+ and Mg in spring (R = 0.74), autumn (R = 0.80), and winter (R = 0.83) with great linear regression in spring (R2 = 0.55), autumn (R2 = 0.64), and winter (R2 = 0.69), for Cl and Cl in spring (R = 0.81), summer (R = 0.74), and winter (R = 0.97) with great linear regression in spring (R2 = 0.66), summer (R2 = 0.55), and winter (R2 = 0.93), and for K+ and K in spring (R = 0.95), summer (R = 0.88), and winter (R = 0.99) with great linear regression in spring (R2 = 0.91), summer (R2 = 0.77), and winter (R2 = 0.98). These results further illustrate the characterization of aerosol WSIIs in mining cities are strongly influenced by elemental constituents.

3.5.3. Principal Component Analysis

A preliminary source identification study of WSIIs was carried out by principal component analysis (PCA, SPSS version 17.0, SPSS Inc. 2008, Chicago, IL USA). We chose these species because of their higher concentrations or strong influence on other species. The three major factors (F1–F3) in the PM10 samples accounted for 88.3% of the total variance in the concentration data (Table 5). F1 accounted for 46.9% of the total variances, which was strongly loaded with NH4+, Mg2+, NO3, K and K+, Cl and Cl, and SO42− and S, suggesting likely origins from anthropogenic sources, especially coal combustion, vehicular exhaust, and biomass burning. Mg was dominant as F2 accounted for 23.3% of the total variances, and Ca2+ and Ca were identified as F3, which explained 18.1% of the variances, demonstrating that another important source is mineral dust from both natural and anthropogenic sources.

4. Conclusions

Water-soluble inorganic ions (WSIIs) were reported, for the first time, in Huangshi (HS) which is a representative mining and medium-sized city in Central China. The three ions (SO42−, NO3−, and NH4+) were the main components according to the descending mean concentration order of SO42− > NO3 > NH4+ > Cl > Ca2+ > Na+ > K+ > Mg2+ > F. The inorganic ions had obvious positive correlation and good linear regression with relevant elements, showing that WSIIs in mining cities are strongly influenced by elemental constituents.
The sequence of the total mass concentration of WSIIs in four seasons was winter > autumn > spring > summer, illustrating that winter can easily strand atmospheric pollutants. The results of a non-parametric test (Kruskal-Wallis) show that, except Na+ (p > 0.05), the other ions present distinctly seasonal variation with statistically significant differences (p < 0.05). The minimum concentrations of all ions were found in summer, while the maximum values presented in autumn (for Ca2+) and winter (for Cl, NO3, SO42−, K+, NH4+, Mg2+). Based on the highest ratio of Cl/Na+ (3.02) and the highest concentration of K (4.37 μg·m−3), Ba (0.37 μg·m−3), and Sr (0.07 μg·m−3) in February 2013, it can concluded that firework powders have aggravated the haze during the Spring Festival of 2013.
The micro-equivalent concentrations of cations and anions were calculated and the comparisons between the calculated and measured NH4+ concentrations were conducted. The results suggest that aerosol particles in HS are acidic, and there may be some other cationic ions not detected in this study. An obvious positive correlation and good linear regression among WSIIs suggest that chemical forms in HS are a great variety of combinations, such as NH4NO3, NH4HSO4, (NH4)2SO4, NH4Cl, KCl, KNO3, NaCl, NaNO3, Ca(NO3)2, CaSO4, MgCl2, Mg(NO3)2, and MgSO4.
The mass concentration ratio of NO3/SO42− in HS aerosols implies that ion pollution largely comes from stationary sources. Compared with other studies, the results show that, except for the major contribution from stationary sources, caution should be applied to mobile sources, along with economic development and urbanization in HS. Principal component analysis implies that WSIIs in PM10 are probably from three sources. NH4+, Mg2+, NO3, K and K+, Cl and Cl, SO42−, and S accounted for 46.9% of the total variances, suggesting likely anthropogenic sources, especially coal combustion, vehicular exhaust, and biomass burning. Mg accounted for 23.3% of the total variances and Ca2+ and Ca explained 18.1% of the total variances, demonstrating that another important source is mineral dust from both natural and anthropogenic sources.

Acknowledgments

This work was financially supported by National Natural Science Foundations of China (41303090, 41603117), Science and Technology Research Projects of Hubei Provincial Department of Education, China (Q20134404) and the Open Foundation of Mine Environmental Pollution Control and Remediation of Hubei Key Laboratory (2014105). The authors are thankful to the editor and the four anonymous reviewers for their help in improving the quality of manuscript. We gratefully thank Zhang Wei and Zhang Yuan for polishing the language.

Author Contributions

Hongxia Liu and Junji Cao designed the study and wrote the manuscript; Jingru Zheng, Ruizhen Yao and Changlin Zhan analyzed the data; Chengkai Qu, Jiaquan Zhang and Yongkui Wang collected the data, coordinated the data-analysis and revised the paper.

Conflicts of Interest

The authors declare no conflict of interest.

References

  1. Kunwar, B.; Torii, K.; Zhu, C.M.; Fu, P.Q.; Kawamura, K. Springtime variations of organic and inorganic constituents in submicron aerosols (PM1.0) from Cape Hedo, Okinawa. Atmos. Environ. 2016, 130, 84–94. [Google Scholar] [CrossRef]
  2. Han, J.B.; Han, B.; Li, P.H.; Kong, S.F.; Bai, Z.P.; Han, D.H.; Dou, X.Y.; Zhao, X.D. Chemical characterizations of PM10 profiles for major emission sources in Xining, northwestern China. Aerosol Air Qual. Res. 2014, 14, 1017–1027. [Google Scholar] [CrossRef]
  3. Mkoma, S.L.; da Rocha, G.O.; Regis, A.C.D.; Domingos, J.S.S.; Santos, J.V.S.; de Andrade, S.J.; Carvalho, L.S.; de Andrade, J.B. Major ions in PM2.5 and PM10 released from buses: The use of diesel/biodiesel fuels under real conditions. Fuel 2014, 115, 109–117. [Google Scholar] [CrossRef]
  4. Huang, T.; Chen, J.; Zhao, W.T.; Cheng, J.X.; Cheng, S.G. Seasonal variations and correlation analysis of water-soluble inorganic ions in PM2.5 in Wuhan, 2013. Atmosphere 2016, 7, 49. [Google Scholar] [CrossRef]
  5. Kawamura, K.; Kasukabe, H.; Barrie, L.A. Secondary formation of water-soluble organic acids and α-dicarbonyls and their contributions to total carbon and water-soluble organic carbon: Photochemical aging of organic aerosols in the Arctic spring. J. Geophys. Res. Atmos. 2010, 115, 6–7. [Google Scholar] [CrossRef]
  6. Cao, J.J.; Wang, Q.Y.; Chow, J.C.; Watson, J.G.; Tie, X.X.; Shen, Z.X.; Wang, P.; An, Z.S. Impacts of aerosol compositions on visibility impairment in Xi’an, China. Atmos. Environ. 2012, 59, 559–566. [Google Scholar] [CrossRef]
  7. Zhou, Y.; Li, X.D.; Deng, J.; Wang, H.Y. Stable sulfur isotope ratios and water-soluble inorganic compositions of PM10 in Yichang City, central China. Environ. Sci. Pollut. Res. 2015, 22, 13564–13572. [Google Scholar]
  8. Dao, X.; Wang, Z.; Lv, Y.B.; Teng, E.J.; Zhang, L.L.; Wang, C. Chemical characteristics of water-soluble ions in particulate matter in three metropolitan areas in the North China Plain. PLoS ONE 2014, 9, e113831. [Google Scholar] [CrossRef] [PubMed]
  9. Du, H.H.; Kong, L.D.; Cheng, T.T.; Chen, J.M.; Du, J.F.; Li, L.; Xia, X.G.; Leng, C.P.; Huang, G.H. Insights into summertime haze pollution events over Shanghai based on online water-soluble ionic composition of aerosols. Atmos. Environ. 2011, 45, 5131–5137. [Google Scholar] [CrossRef]
  10. Tan, J.H.; Duan, J.C.; Chen, D.H.; Wang, X.H.; Guo, S.J.; Bi, X.H.; Sheng, G.Y.; He, K.B.; Fu, J.M. Chemical characteristics of haze during summer and winter in Guangzhou. Atmos. Res. 2009, 94, 238–245. [Google Scholar] [CrossRef]
  11. Cao, J.J.; Zhu, C.S.; Tie, X.X.; Geng, F.H.; Xu, H.M.; Ho, S.; Wang, G.H.; Han, Y.M.; Ho, K.F. Characteristics and sources of carbonaceous aerosols from Shanghai, China. Atmos. Chem. Phys. 2013, 13, 803–817. [Google Scholar] [CrossRef]
  12. Zhan, C.L.; Zhang, J.Q.; Cao, J.J.; Han, Y.M.; Wang, P.; Zheng, J.R.; Yao, R.Z.; Liu, H.X.; Xiao, W.S. Characteristics and sources of black carbon in atmospheric dustfall particles from HS, China. Aerosol Air Qual. Res. 2016, 16, 2096–2016. [Google Scholar] [CrossRef]
  13. Zhang, J.Q.; Qu, C.K.; Qi, S.H.; Cao, J.J.; Zhan, C.L.; Xing, X.L.; Xiao, Y.L.; Zheng, J.R.; Xiao, W.S. Polycyclic aromatic hydrocarbons (PAHs) in atmospheric dustfall from the industrial corridor in Hubei Province, Central China. Environ. Geochem. Health 2015, 37, 891–903. [Google Scholar] [CrossRef] [PubMed]
  14. Deshmukh, D.K.; Kawamura, K.; Lazaar, M.; Kunwar, B.; Boreddy, S.K.R. Dicarboxylic acids, oxoacids, benzoic acid, α-dicarbonyls, WSOC, OC, and ions in spring aerosols from Okinawa Island in the western North Pacific Rim: Size distributions and formation processes. Atmos. Chem. Phys. Discuss. 2016, 16, 5263–5282. [Google Scholar] [CrossRef]
  15. Gugamsetty, B.; Wei, H.; Liu, C.N.; Awasthi, A.; Hsu, S.C.; Tsai, C.J.; Roam, G.D.; Wu, Y.C.; Chen, C.F. Source characterization and apportionment of PM10, PM2.5 and PM0.1 by using positive matrix factorization in Shinjung station Taiwan. Aerosol Air Qual. Res. 2012, 12, 476–491. [Google Scholar]
  16. Guo, Y.T.; Zhang, J.; Wang, S.G.; She, F.; Li, X. Long-tern characterization of major water-soluble inorganic ions in PM10 in coastal site on the Japan Sea. J. Atmos. Chem. 2012, 68, 299–316. [Google Scholar] [CrossRef]
  17. Nicolas, J.F.; Galindo, N.; Yubero, E.; Pastor, C.; Esclapez, R.; Crespo, J. Aerosol inorganic ions in a semiarid region on the southeastern Mediterranean coast. Water Air Soil Pollut. 2009, 201, 149–159. [Google Scholar] [CrossRef]
  18. Kuniyal, J.C.; Sharma, M.; Chand, K.; Mathela, C.S. Water soluble ionic components in particulate matter (PM10) during high pollution episode days at Mohal and Kothi in the north-western Himalaya, India. Aerosol Air Qual. Res. 2015, 15, 529–543. [Google Scholar] [CrossRef]
  19. Twigg, M.M.; Di Marco, C.F.; Leeson, S.; van Dijk, N.; Jones, M.R.; Leith, I.D.; Morrison, E.; Coyle, M.; Proost, R.; Peeters, A.N.M.; et al. Water soluble aerosols and gases at a UK background site-Part 1, Controls of PM2.5 and PM10 aerosol composition. Atmos. Chem. Phys. 2015, 15, 8131–8145. [Google Scholar] [CrossRef]
  20. Cheng, Y.; Zou, S.C.; Lee, S.C.; Chow, J.C.; Ho, K.F.; Watson, J.G.; Han, Y.M.; Zhang, R.J.; Zhang, F.; Yau, P.S.; et al. Characteristics and source apportionment of PM1 emissions at a roadside station. J. Hazard. Mater. 2011, 195, 82–91. [Google Scholar] [CrossRef] [PubMed]
  21. He, Q.S.; Yan, Y.L.; Guo, L.L.; Zhang, Y.L.; Zhang, G.X.; Wang, X.M. Characterization and source analysis of water-soluble inorganic ionic species in PM2.5 in Taiyuan city, China. Atmos. Res. 2017, 184, 48–55. [Google Scholar] [CrossRef]
  22. Ho, K.F.; Ho, S.S.H.; Lee, S.C.; Kawamura, K.; Zou, S.C.; Cao, J.J.; Xu, H.M. Summer and winter variations of dicarboxylic acids, fatty acids and benzoic acid in PM2.5 in Pearl Delta River Region, China. Atmos. Chem. Phys. 2011, 11, 2197–2208. [Google Scholar] [CrossRef]
  23. Lin, C.C. A review of the impact of fireworks on particulate matter in ambient air. J. Air Waste Manag. Assoc. 2016, 66, 1171–1182. [Google Scholar] [CrossRef] [PubMed]
  24. Tsai, H.H.; Chien, L.H.; Yuan, C.S.; Jen, Y.H.; Ie, I.R. Influences of fireworks on chemical characteristics of atmospheric fine and coarse particles during Taiwan’s Lantern Festival. Atmos. Environ. 2012, 62, 256–264. [Google Scholar] [CrossRef]
  25. Steinhauser, G.; Sterba, J.H.; Foster, M.; Grass, F.; Bichler, M. Heavy metals from pyrotechnics in New Years Eve snow. Atmos. Environ. 2008, 42, 8616–8622. [Google Scholar] [CrossRef]
  26. Kumar, S.; Raman, R.S. Inorganic ions in ambient fine particles over a National Park in central India: Seasonality, dependencies between SO42−, NO3, and NH4+, and neutralization of aerosol acidity. Atmos. Environ. 2016, 143, 152–163. [Google Scholar] [CrossRef]
  27. Kumar, P.; Yadav, S. Seasonal variations in water soluble inorganic ions, OC and EC in PM10 and PM>10 aerosols over Delhi: Influence of sources and meteorological factors. Aerosol Air Qual. Res. 2016, 16, 1165–1178. [Google Scholar] [CrossRef]
  28. Zhang, T.; Cao, J.J.; Tie, X.X.; Shen, Z.X.; Liu, S.X.; Ding, H.; Han, Y.M.; Wang, G.H.; Ho, K.F.; Qiang, J.; et al. Water-soluble ions in atmospheric aerosols measured in Xi’an, China, Seasonal variations and sources. Atmos. Res. 2011, 102, 110–119. [Google Scholar] [CrossRef]
  29. Xu, H.M.; Cao, J.J.; Chow, C.J.; Huang, R.J.; Shen, Z.X.; Chen, L.W.A.; Ho, K.F.; Watson, J.G. Inter-annual variability of wintertime PM2.5 chemical composition in Xi’an, China, Evidences of changing source emissions. Sci. Total Environ. 2016, 545–546, 546–555. [Google Scholar] [CrossRef] [PubMed]
  30. Pavuluri, C.M.; Kawamura, K.; Mihalopoulos, N.; Fu, P.Q. Characteristics, seasonality and sources of inorganic ions and trace metals in North-east Asian aerosols. Environ. Chem. 2015, 12, 338–349. [Google Scholar] [CrossRef]
Figure 1. Seasonal variation of nine water-soluble ions in Huangshi aerosols during the observation period.
Atmosphere 08 00074 g001
Figure 2. Monthly variation of water-soluble inorganic ions in Huangshi aerosols during the observation period. The shadowed areas show the pollution episode.
Atmosphere 08 00074 g002
Figure 3. The mass percentage of water-soluble inorganic ions in Huangshi aerosols in the Spring Festival day, haze day, and a normal day in spring, summer, autumn, and winter.
Atmosphere 08 00074 g003
Figure 4. The charge balance of anion and cation water-soluble ions in Huangshi in the four seasons.
Atmosphere 08 00074 g004
Figure 5. Comparison between calculated and measured ammonium in PM10 samples in Huangshi (calculated NH4+ = 0.38 [SO42−] + 0.29 [NO3] in the form of (NH4)2SO4 and NH4NO3) and NH4+ = 0.19 [SO42−] + 0.29 [NO3] in the form of NH4HSO4 and NH4NO3).
Atmosphere 08 00074 g005
Table 1. Summary of the sampling information and meteorological conditions from April 2012 to March 2013 in Huangshi.
SeasonSampling TimeSampling NumberTemperature (°C)Relative Humidity (%)Remarks
Spring2012/4/3–2012/6/2615 *23.5 ± 1.978.4 ± 11.1sunny with gentle breeze
Summer2012/7/2–2012/9/3016 **33.0 ± 2.587.0 ± 15.0moderate rain to showers with light breeze
Autumn2012/10/6–2012/12/2915 *19.1 ± 3.085.4 ± 6.3clear to cloudy with level 4 of the north wind
Winter2013/1/4–2013/3/2915 *4.2 ± 2.088.3 ± 5.1Overcast with rain and snow, no sustained winds
* Two samples were destroyed because of operational error. ** One sample was destroyed because of operational error.
Table 2. Average mass concentration (μg·m−3) of water-soluble ions in Huangshi and other sites around the world.
LocationPeriodFClNO3SO42−Na+NH4+K+Mg2+Ca2+Reference
Huangshi, China2012/4–2013/30.575.3221.130.95.257.772.100.585.29This study
Yichang, China2012/12n.a.1.759.9124.64.603.85n.a.n.a.6.25[7]
Beijing, China2013/1–2013/120.356.4431.123.21.9213.52.270.524.38[8]
Tianjin, China2013/1–2013/120.3810.637.836.71.9218.52.630.575.07[8]
Shijiazhuang, China2013/1–2013/121.6617.342.340.24.0123.24.011.0313.0[8]
Shanghai, China2009/5–2009/6n.a.3.5332.928.70.6019.33.000.232.97[9]
Taipei, Taiwan2011/5–2011/11n.a.0.541.326.300.651.490.220.200.37[15]
Ishikawa, Japan2001/1–2003/12n.a.2.771.774.491.861.310.120.230.25[16]
Southern Spain2004/12–2005/11n.a.0.603.764.360.991.100.280.162.29[17]
Mohal, India2009/9–2011/120.343.162.675.561.140.840.500.091.51[18]
Auchencorth Moss, UK2013/1–2013/12n.a.1.111.861.430.840.980.070.060.06[19]
n.a.: not available.
Table 3. The average monthly concentrations of water-soluble ions and selected elements in PM10 from Huangshi (μg·m−3).
CompositionApr.MayJun.Jul.Aug.Sep.Oct.Nov.Dec.Jan.Feb.Mar.
Inorganic ions
F0.840.410.360.310.410.380.700.700.790.840.590.55
Cl4.103.232.311.712.622.966.476.015.427.7915.56.88
NO320.116.68.973.197.6110.522.222.821.949.239.731.3
SO42−30.228.328.211.729.430.829.924.624.149.952.530.8
Na+5.615.474.954.075.435.205.575.015.755.515.055.12
NH4+6.416.334.920.654.406.207.767.465.5918.116.710.2
K+1.382.561.510.441.231.301.931.541.782.658.301.69
Mg2+0.760.560.400.270.500.500.670.560.650.670.890.58
Ca2+6.664.484.833.055.294.936.665.767.475.593.265.37
Total76.168.056.525.456.862.781.874.573.4140.3142.592.4
Cl/Na+0.730.590.470.420.480.571.161.200.941.413.071.34
NO3/SO42−0.660.590.320.270.260.340.740.920.910.990.761.01
Selected elements
K1.552.091.340.521.051.221.981.641.922.114.371.39
Al0.710.390.370.340.420.340.640.550.720.450.570.49
Mg1.900.720.720.500.630.771.181.451.871.101.341.30
Pb0.310.220.250.130.440.190.400.190.280.420.410.23
Ba0.110.080.090.080.130.090.130.110.100.110.370.09
Sr0.030.020.020.020.020.020.030.020.030.030.070.02
Total4.613.502.791.582.682.634.363.954.924.227.123.53
Table 4. The Pearson correlation coefficients (R) of water-soluble ions in PM10 in Huangshi City during the observation period (n = 61).
SpringNa+NH4+K+Mg2+Ca2+FClNO3SO42−
element #0.36 (Na)n.a.0.95 ** (K)0.74 ** (Mg)0.86 ** (Ca)n.a.0.81 ** (Cl)n.a.0.84 ** (S)
Na+1.00
NH4+0.62 *1.00
K+0.040.181.00
Mg2+0.65 *0.53 *−0.041.00
Ca2+0.54 *0.470.060.77 **1.00
F0.490.43−0.100.68 *0.72 **1.00
Cl0.78 **0.72 **0.040.74 **0.58 *0.68 *1.00
NO30.77 **0.85 **0.030.79 **0.53 *0.62 *0.87 **1.00
SO42−0.55 *0.90 **0.300.480.65 *0.400.57 *0.65 *1.00
AutumnNa+NH4+K+Mg2+Ca2+FClNO3SO42−
element #−0.27 (Na)n.a.0.45 (K)0.80 ** (Mg)0.85 ** (Ca)n.a.0.20 (Cl)n.a.0.87 ** (S)
Na+1.00
NH4+0.041.00
K+−0.040.261.00
Mg2+0.06−0.400.261.00
Ca2+−0.30−0.530.440.73 **1.00
F−0.21−0.420.160.530.65 *1.00
Cl0.030.390.27−0.07−0.100.381.00
NO3−0.090.86 **0.30−0.14−0.20−0.200.231.00
SO42−0.160.87 **0.48−0.19−0.30−0.410.340.67 *1.00
SummerNa+NH4+K+Mg2+Ca2+FClNO3SO42−
element #0.25 (Na)n.a.0.88 ** (K)0.24 (Mg)0.68 * (Ca)n.a.0.74 ** (Cl)n.a.0.88 ** (S)
Na+1.00
NH4+0.451.00
K+0.440.71 **1.00
Mg2+0.66 *0.81 **0.74 **1.00
Ca2+0.460.69 *0.54 *0.86 **1.00
F0.090.470.68 *0.68 *0.60 *1.00
Cl0.360.470.90 **0.59 *0.300.61 *1.00
NO30.490.88 **0.91 **0.86 **0.71 **0.64 *0.75 **1.00
SO42−0.60 *0.95 **0.62 *0.85 **0.76 **0.410.360.80 **1.00
WinterNa+NH4+K+Mg2+Ca2+FClNO3SO42−
element #0.16 (Na)n.a.0.99 ** (K)0.83 ** (Mg)0.95 ** (Ca)n.a.0.97 ** (Cl)n.a.0.85 ** (S)
Na+1.00
NH4+0.401.00
K+0.12−0.121.00
Mg2+0.23−0.060.95 **1.00
Ca2+0.310.17−0.200.071.00
F0.050.020.300.500.54 *1.00
Cl0.120.070.94 **0.87 **−0.280.241.00
NO30.340.95 **−0.16−0.080.320.16−0.031.00
SO42−0.52 *0.92 **0.150.230.210.050.230.79 **1.00
# represents the Pearson correlation coefficients between element and its corresponding ion; ** represents the significant correlation (p ≤ 0.01); * represents significant correlation (p ≤ 0.05); and “n.a” represents data that is not available.
Table 5. Principal component factor analysis of water-soluble ions in PM10 in Huangshi city.
FactorsF1F2F3Communalities
Cl0.860.04−0.420.92
NO30.66−0.560.270.82
SO42−0.72−0.580.260.91
NH4+0.66−0.700.210.97
K+0.790.24−0.500.93
Mg2+0.870.380.030.90
Ca2+0.250.400.820.89
K0.790.39−0.330.89
Mg0.480.760.200.85
Cl0.850.12−0.240.80
Ca0.230.570.750.93
S0.65−0.480.370.78
Characteristic value5.622.802.18
Contribution rate/%46.923.318.1
Cumulative contribution rate/%46.970.288.3

