
Air Quality and Control Measures Evaluation during the 2014 Youth Olympic Games in Nanjing and its Surrounding Cities


1
Key Laboratory for Aerosol-Cloud-Precipitation of China Meteorological Administration, Nanjing University of Information Science and Technology, Nanjing 210044, China
2
Key Laboratory of Atmospheric Environment Monitoring and Pollution Control, Collaborative Innovation Center of Atmospheric Environment and Equipment Technology, Nanjing University of Information Science and Technology, Nanjing 210044, China
*
Author to whom correspondence should be addressed.
Atmosphere 2017, 8(6), 100; https://doi.org/10.3390/atmos8060100
Submission received: 28 April 2017
/
Revised: 2 June 2017
/
Accepted: 3 June 2017
/
Published: 4 June 2017
(This article belongs to the Special Issue Air Quality Monitoring and Forecasting)
Abstract
:Air pollution had become a vital concern for the 2014 Youth Olympic Games in Nanjing. In order to control air pollutant emissions and ensure better air quality during the Games, the Nanjing municipal government took a series of aggressive control measures to reduce pollutant emissions in Nanjing and its surrounding cities during the Youth Olympic Games. The Air Quality Index (AQI) is an index of air quality which is used to inform the public about levels of air pollution and associated health risks. In this study, we use the AQI and air pollutant concentrations data to evaluate the effectiveness of the implementation of control measures. The results suggest that the emission reduction measures significantly improved air quality in Nanjing. In August 2014, the mean concentrations of PM2.5, PM10, SO2, NO2, CO and O3 were 42.44 μg·m−3, 59.01 μg·m−3, 11.12 μg·m−3, 31.09 μg·m−3, 0.76 mg·m−3 and 38.39 μg·m−3, respectively, and fell by 35.92%, 36.75%, 20.40%, 15.05%, 8.54% and 47.15%, respectively, compared to the prophase mean before the emission reduction. After the emission reduction, the mean concentrations of PM2.5, PM10, SO2, NO2, and O3 increased by 20.81%, 41.84%, 22.84%, 21.16% and 60.93%, respectively, which is due to the cancellation of temporary atmospheric pollution control measures. The air pollutants diurnal variation curve during the emission reduction was lower than the other two periods, except for CO. In addition, the AQI of Nanjing and its surrounding cities showed a downward trend, compared with July 2014. The most of effective method to control air pollution is to implement the measures of regional cooperation and joint defense and control, and reduce local emissions during the polluted period, such as airborne dust, coal-burning, vehicle emissions, mobile sources and industrial production.
1. Introduction
As the largest developing country in the world, China has suffered from serious air pollution due to the rapid economic development and industrial reconstruction in the past three decades. It has become one of the major environmental concerns in some Chinese cities, including Beijing, Shanghai, Guangzhou and Nanjing [1]. Some major air pollutants in the atmosphere, including particulate matter (PM), sulfur dioxide (SO2), carbon monoxide (CO), nitrogen dioxide (NO2) and ozone (O3), have attracted increasing attention due to their impacts on air quality, visibility reduction, human health and global climate [2,3,4,5,6]. From June 2000, the China National Environmental Monitoring Center started reporting the status of ambient air quality by using an air pollution index (API), which is calculated based on the highest index of 24-h average concentrations of PM10, SO2 and NO2. From March 2012, the Ministry of Environmental Protection (MEP) started using the air quality index (AQI), which is calculated based on the concentrations of the six major pollutants including PM2.5, PM10, SO2, NO2, CO and O3. The AQI ranges from 0 to 500. The greater the value of the AQI, the higher the level of air pollution. Currently, the AQI is widely used to describe the quality of the air.
Nanjing, the capital city of Jiangsu Province, is located in the western Yangtze River Delta and has a population of over 8.2 million. As a highly industrialized and urbanized city, Nanjing suffers from severe air pollution. It hosted the 2nd Summer Youth Olympic Games (YOG) from 17 to 28 August 2014. In view of the significant air pollution in Nanjing, to ensure good air quality during the YOG, the Nanjing municipal government actively took temporary control measures to reduce pollutant emissions. These measures mainly included dust control, coal-burning control, vehicle emission control, industrial production halts, construction site shutdowns and regional joint prevention and control. In addition, other cities in the surrounding area cooperated with Nanjing to guarantee good air quality during the same period.
In recent years, China has hosted many major international events. The local government has implemented numerous stringent local emission standards, which significantly reduced the emissions and concentrations of air pollutants in the city. During the 2008 Beijing Olympics Games, the mean concentration of SO2, PM2.5 and NO2 were reduced by 51.0%, 43.7% and 13% compared to the period before Olympic Games in Beijing and its surrounding area [7]. Wang et al. [8] demonstrated that the concentration of O3, SO2, CO and NOx decreased 23%, 61%, 25% and 21%, respectively, compared to previous years. Wang et al. [9] found that the average concentrations of PM2.5, PM10, SO2 and NO2 during the Asia-Pacific Economic Cooperation period decreased by 47%, 36%, 62% and 41% respectively, whereas concentrations of O3 increased by 102%. Meanwhile, emission control measures which were implemented in Shanghai and Guangzhou also successfully improved air quality for the World Expo and the Asian Games [10,11].
In this study, we used air quality and air pollutants measurement data at nine sites in Nanjing City from July to September 2014 to quantify the efficiency of the emission control measures in YOG. The objectives of this study were (i) to show the temporal and spatial characteristics of air quality and air pollutants during the YOG, and (ii) to give some suggestions for controlling air pollution in large cities.
2. Data and Methods
In this paper, the AQI and hourly concentrations data for six air pollutants (PM2.5, PM10, SO2, NO2, CO and O3) were provided by the China National Environmental Monitoring Center (CNEMC). The AQI approach is based on the National Ambient Air Quality Standards of China (NAAQS-2012) [12]. There are nine sites located in Nanjing, including Maigao Bridge (MG), Caochangmen (CC), Shanxi Road (SX), Zhonghuamen (ZH), Ruijin Road (RJ), Xuanwu Lake (XW), Pukou (PK), Olympic Stadium (OS) and Xianlin University Town (XL). To show the effectiveness of the implementation of control measures, we acquired hourly monitoring data from July to September 2014. We divided the data into three time periods, before the period of the emission reduction (1 to 31 July 2014), during the period of the emission reduction (1 to 31 August 2014) and after the period of the emission reduction (1 to 30 September 2014), to assess the impacts of emission reduction measures on air quality. In addition, we also recorded the data of the AQI in the surrounding cities, including Shanghai (SH), Hangzhou (HZ1), Huzhou (HZ2), Jiaxing (JX), Hefei (HF), Maanshan (MAS), Wuhu (WH), Xuancheng (XC), Chuzhou (CZ1), Bengbu (BB), Suzhou (SZ), Wuxi (WX), Changzhou (CZ2), Zhenjiang (ZJ), Yangzhou (YZ), Huaian (HA), Taizhou (TZ), Nantong (NT), Xuzhou (XZ), Yancheng (YC), Suqian (SQ) and Lianyungang (LYG), which are shown in Figure 1.
Meteorological data, including air temperature (T), relative humidity (RH), wind speed (WS) and atmospheric pressure (AP), were obtained from the China Meteorological Data Sharing Service System Administration (http://data.cma.cn/site/index.html), and solar radiation (SR) was recorded by Watchdog weather station (Watchdog 2900ET, Spectrum Technologies, Inc., USA) on the campus of Nanjing University of Information Science & Technology (NUIST) (32°14′ N, 118°42′ E).
This study analyzed temporal variation and characteristics of air quality and air pollutants in different periods using the measured time-series. All graphs were created using origin 9.0 software (Origin Lab, Northampton, MA, USA).
3. Results and Discussion
3.1. Variation in Meteorological Conditions
Air temperature, relative humidity, wind speed, solar radiation and atmospheric pressure were important external factors affecting the concentration of pollutants. In order to evaluate the effectiveness of the implementation of control measures, we need to eliminate the interference of meteorological conditions, so we compare meteorological parameters at different periods. Table 1 shows the mean of meteorological parameters before the emission reduction (July, 2014), during the emission reduction (August, 2014) and during the same period in 2013 (August, 2013). The mean air temperature during the period of the emission reduction was 25.6 °C, which was slightly lower than the average level in July 2014. Relative humidity in August 2013 was far lower than the average level in August 2014, while relative humidity in July 2014 was close to the average level in August 2014. The average wind speed during the emission reduction period was 2.19 m/s, which was also very close to the period before the emission reduction. Solar radiation during the emission reduction was very much lower than that in 2013 for the same time, while solar radiation in July 2014 was higher than the average level in August 2014. Atmospheric pressure was not much different across the three periods. Overall, compared with the period during the emission reduction, solar radiation in July 2014 was higher, and other meteorological parameters were close to the average level during the emission reduction. By comparison, we found that the meteorological parameters in July 2014 were close to the average level during the emission reduction, but were very different from that in August 2013. Thus, the meteorological conditions in July 2014 were more appropriate than those in August 2013 to evaluate the effect of air quality improvement during the period of the emission reduction.
3.2. Comparison of Air Quality and Air Pollutants in Different Periods
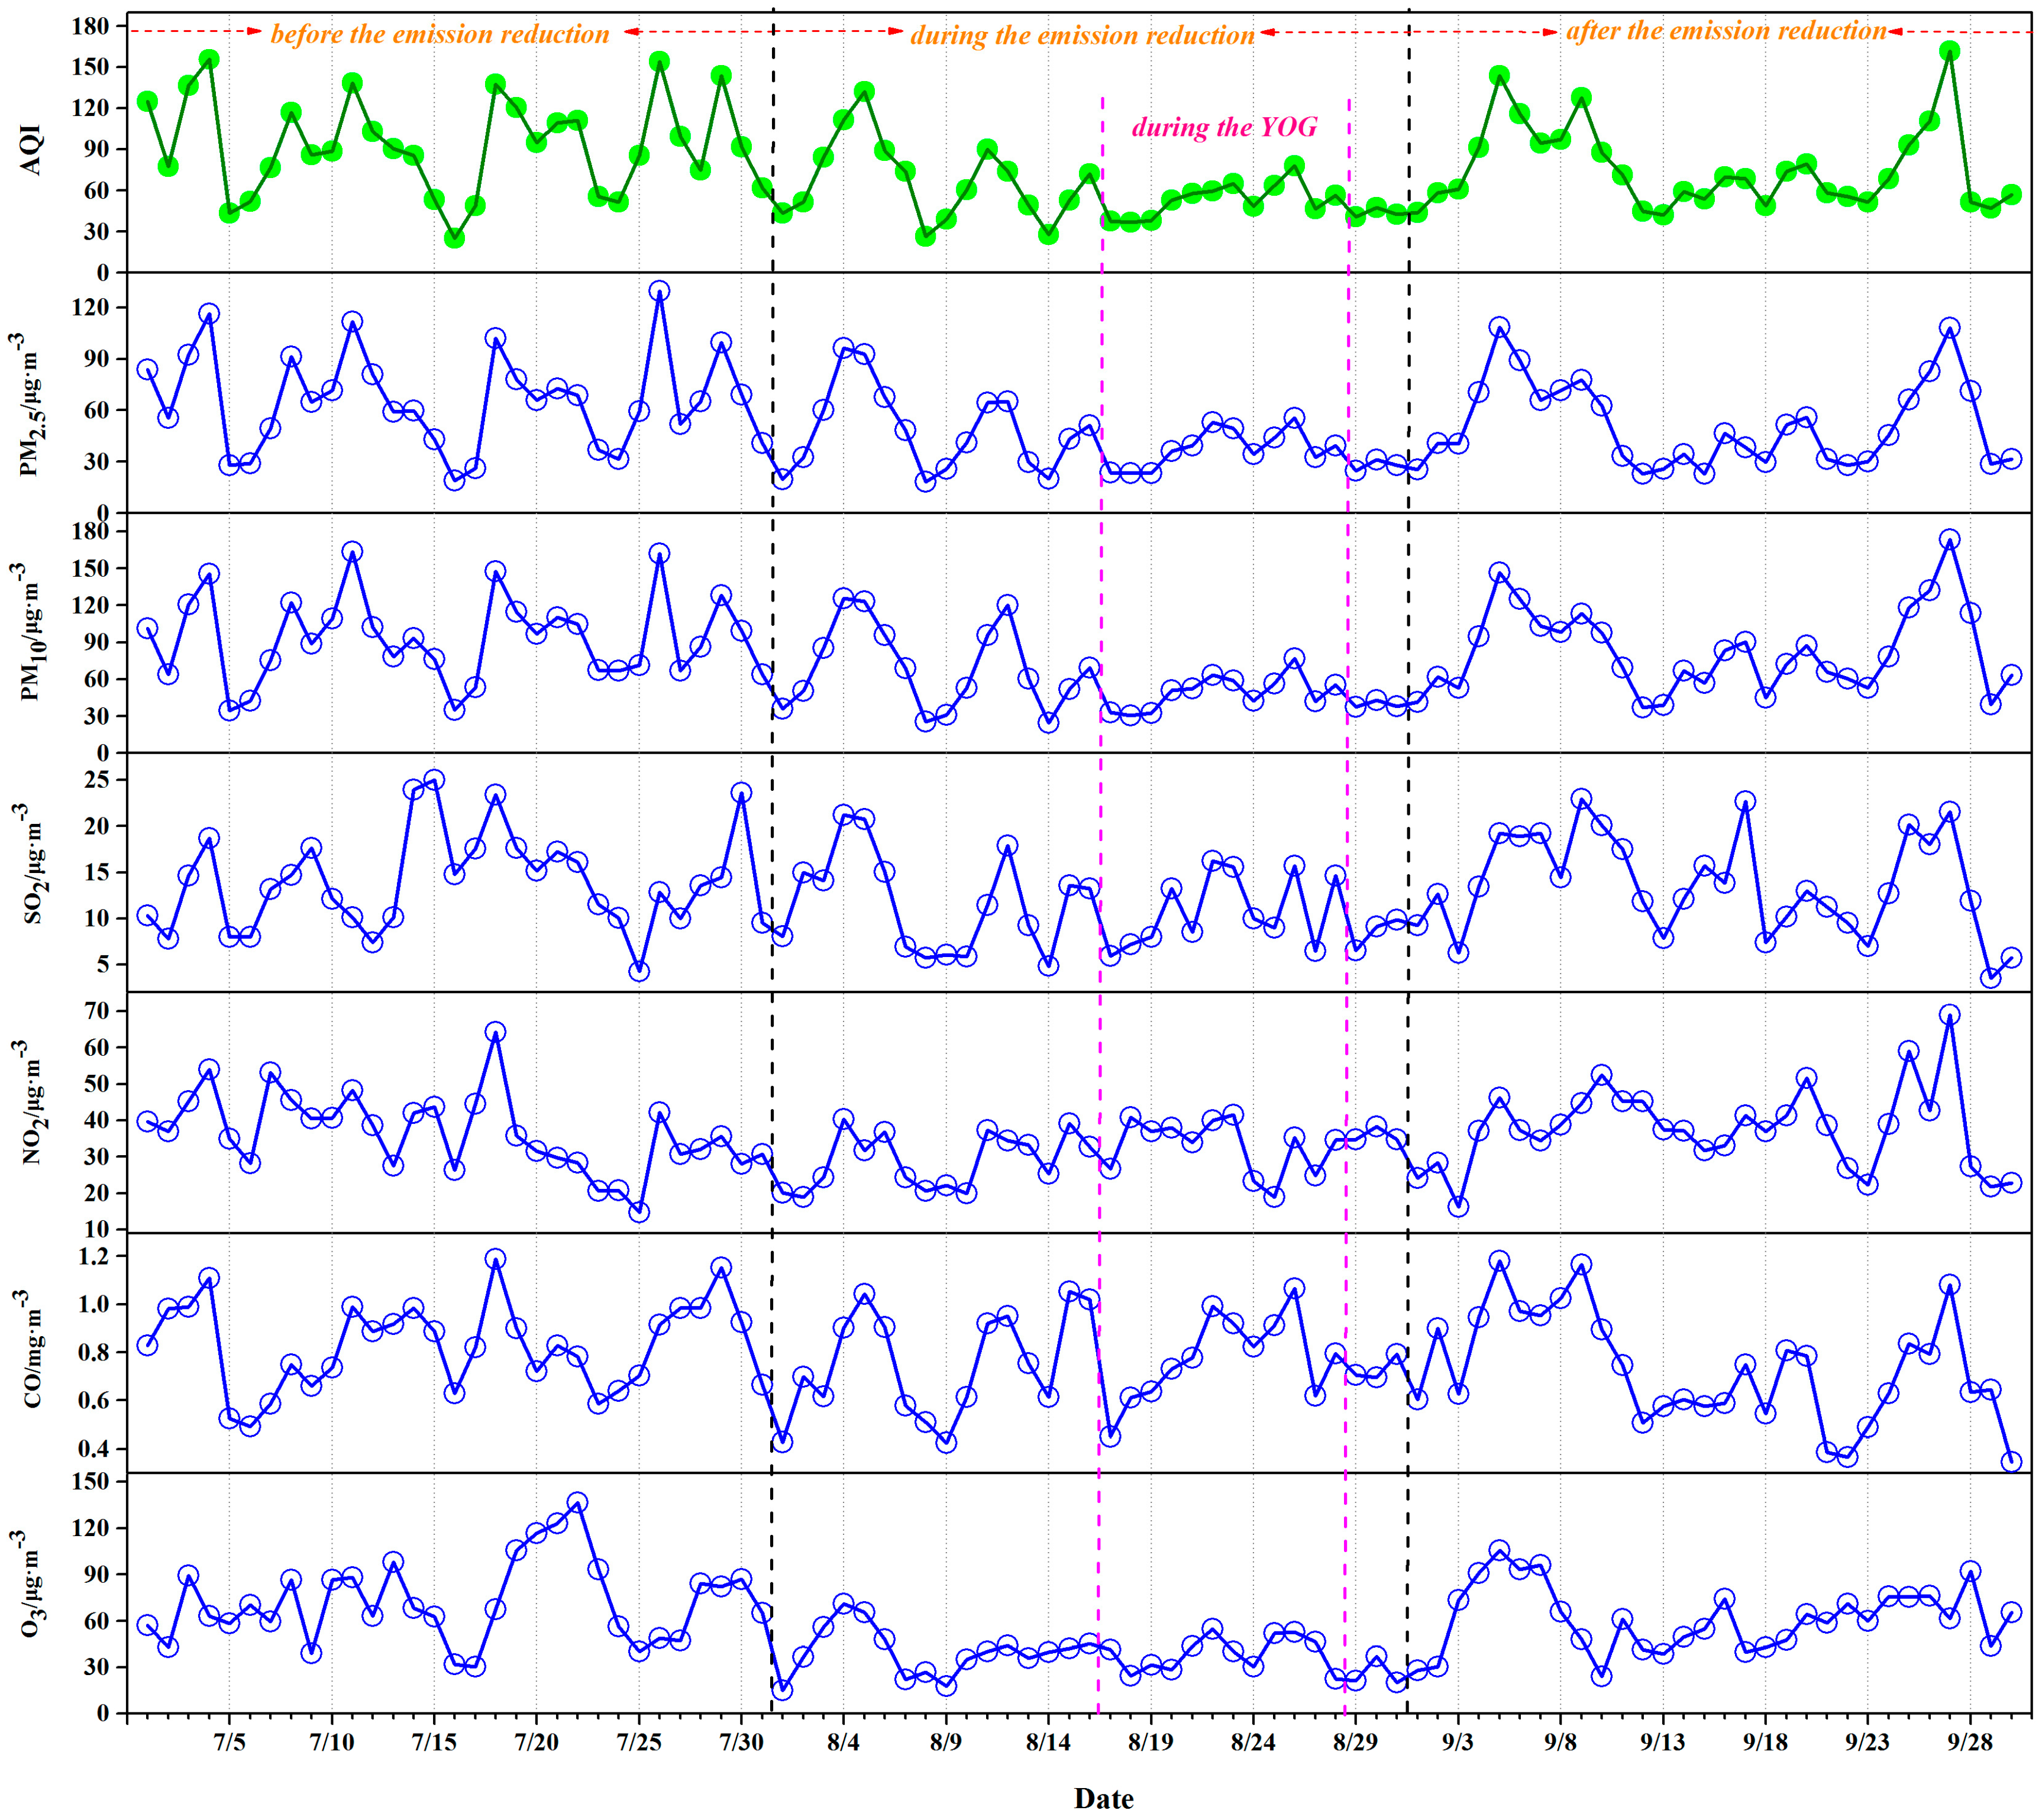
During the emission reduction, a number of control measures were adopted to guarantee good air quality in Nanjing. To understand the air quality and air pollutants variation characteristics during this period, the AQI and air pollutant concentrations were plotted against time using the average daily concentration of pollutants data in different periods (Figure 2). Table 2 shows the mean value of the AQI and the mean concentration of air pollutants during the different time periods in Nanjing.
The AQI is an indicator of air quality, which is used to describe the air quality level of a place and ranges from 0 to 500, where higher values represent worse air quality. The air quality was the best in August 2014 with the AQI of 59.65, an average decrease of 36.10% compared with July 2014, reflecting a significant improvement in the air quality during the emission reduction.
During the emission reduction period, the average PM2.5 mass concentration was 42.44 μg·m−3. Compared with the period before the emission reduction, it exhibited a decrease of 35.92%. The PM2.5 levels were much lower than the mean PM2.5 concentration of 106 μg·m−3 in August 2012 in Nanjing [13].
From Figure 2, we can see that the trend and variability of PM10 showed a similar trend to PM2.5. PM10 concentration declined from 93.29 μg·m−3 in July 2014 to 59.01 μg·m−3 during the emission reduction period, a 36.75% reduction. It is suggested that the pollution control measures of halting work at construction sites and shutting down heavy-industry factories during the emission reduction yielded a significant effect on the concentration of PM10. In addition, we calculated the ratios between PM2.5 and PM10 and found that the higher ratios occurred in August 2014 (0.73) and the lower ratios occurred in August 2013 (0.50), indicating that PM2.5 was a main source for PM10 during the emission reduction period.
SO2 concentration was reduced from 13.97 μg·m−3 in July 2014 to 11.12 μg·m−3 during the emission reduction period, a decrease of 20.40%. When the control measures were terminated, some factories and enterprises returned to normal production in Nanjing and the surrounding cities after the Youth Olympic Games, thus the SO2 level began to rise to 13.66 μg·m−3. The variation of SO2 concentration was affected mainly by the emission sources and weather conditions. Due to low emission sources, high temperature and strong convection in the summer, the concentration of SO2 was much lower than in other seasons due to the influence of gas-to-particle conversion and wet scavenging.
NO2 and CO concentrations were reduced by 15.1% and 8.54%, respectively, in comparison to the levels recorded for July 2014. However, they showed a tendency to increase during the YOG, thus the concentrations of NO2 and CO were 32.89 μg·m−3 and 0.778 mg·m−3, respectively, compared with August 2014, which was closely related to meteorological conditions. NO2 and CO are important precursors for O3 formation, and they were affected by the photochemical reaction which enhanced with the increase of solar radiation. According to the comparison of meteorological parameters, we found that solar radiation during the emission reduction (127.7 w·m−2) was higher than that that during the YOG (120.31 w·m−2). This indicated that NO2 and CO levels in August 2014 were more likely to convert to O3 than those of 17–28 August 2014.
Ground-level O3 is a greenhouse gas, a strong oxidant and a secondary pollutant mainly produced via photochemical reactions of nitrogen oxides, carbon monoxide and volatile organic compounds [14]. Its concentration is affected by solar radiation, air temperature and mixing/transport [15]. O3 concentration in July 2014 was 72.64 μg·m−3, and was 38.39 μg·m−3 during the emission reduction period, showing a 47.15% decrease, which was significantly greater than the those other air pollutants. As a secondary pollutant, the decrease of O3 was due to the reduction of precursors and the weather conditions during the period of the emission reduction.
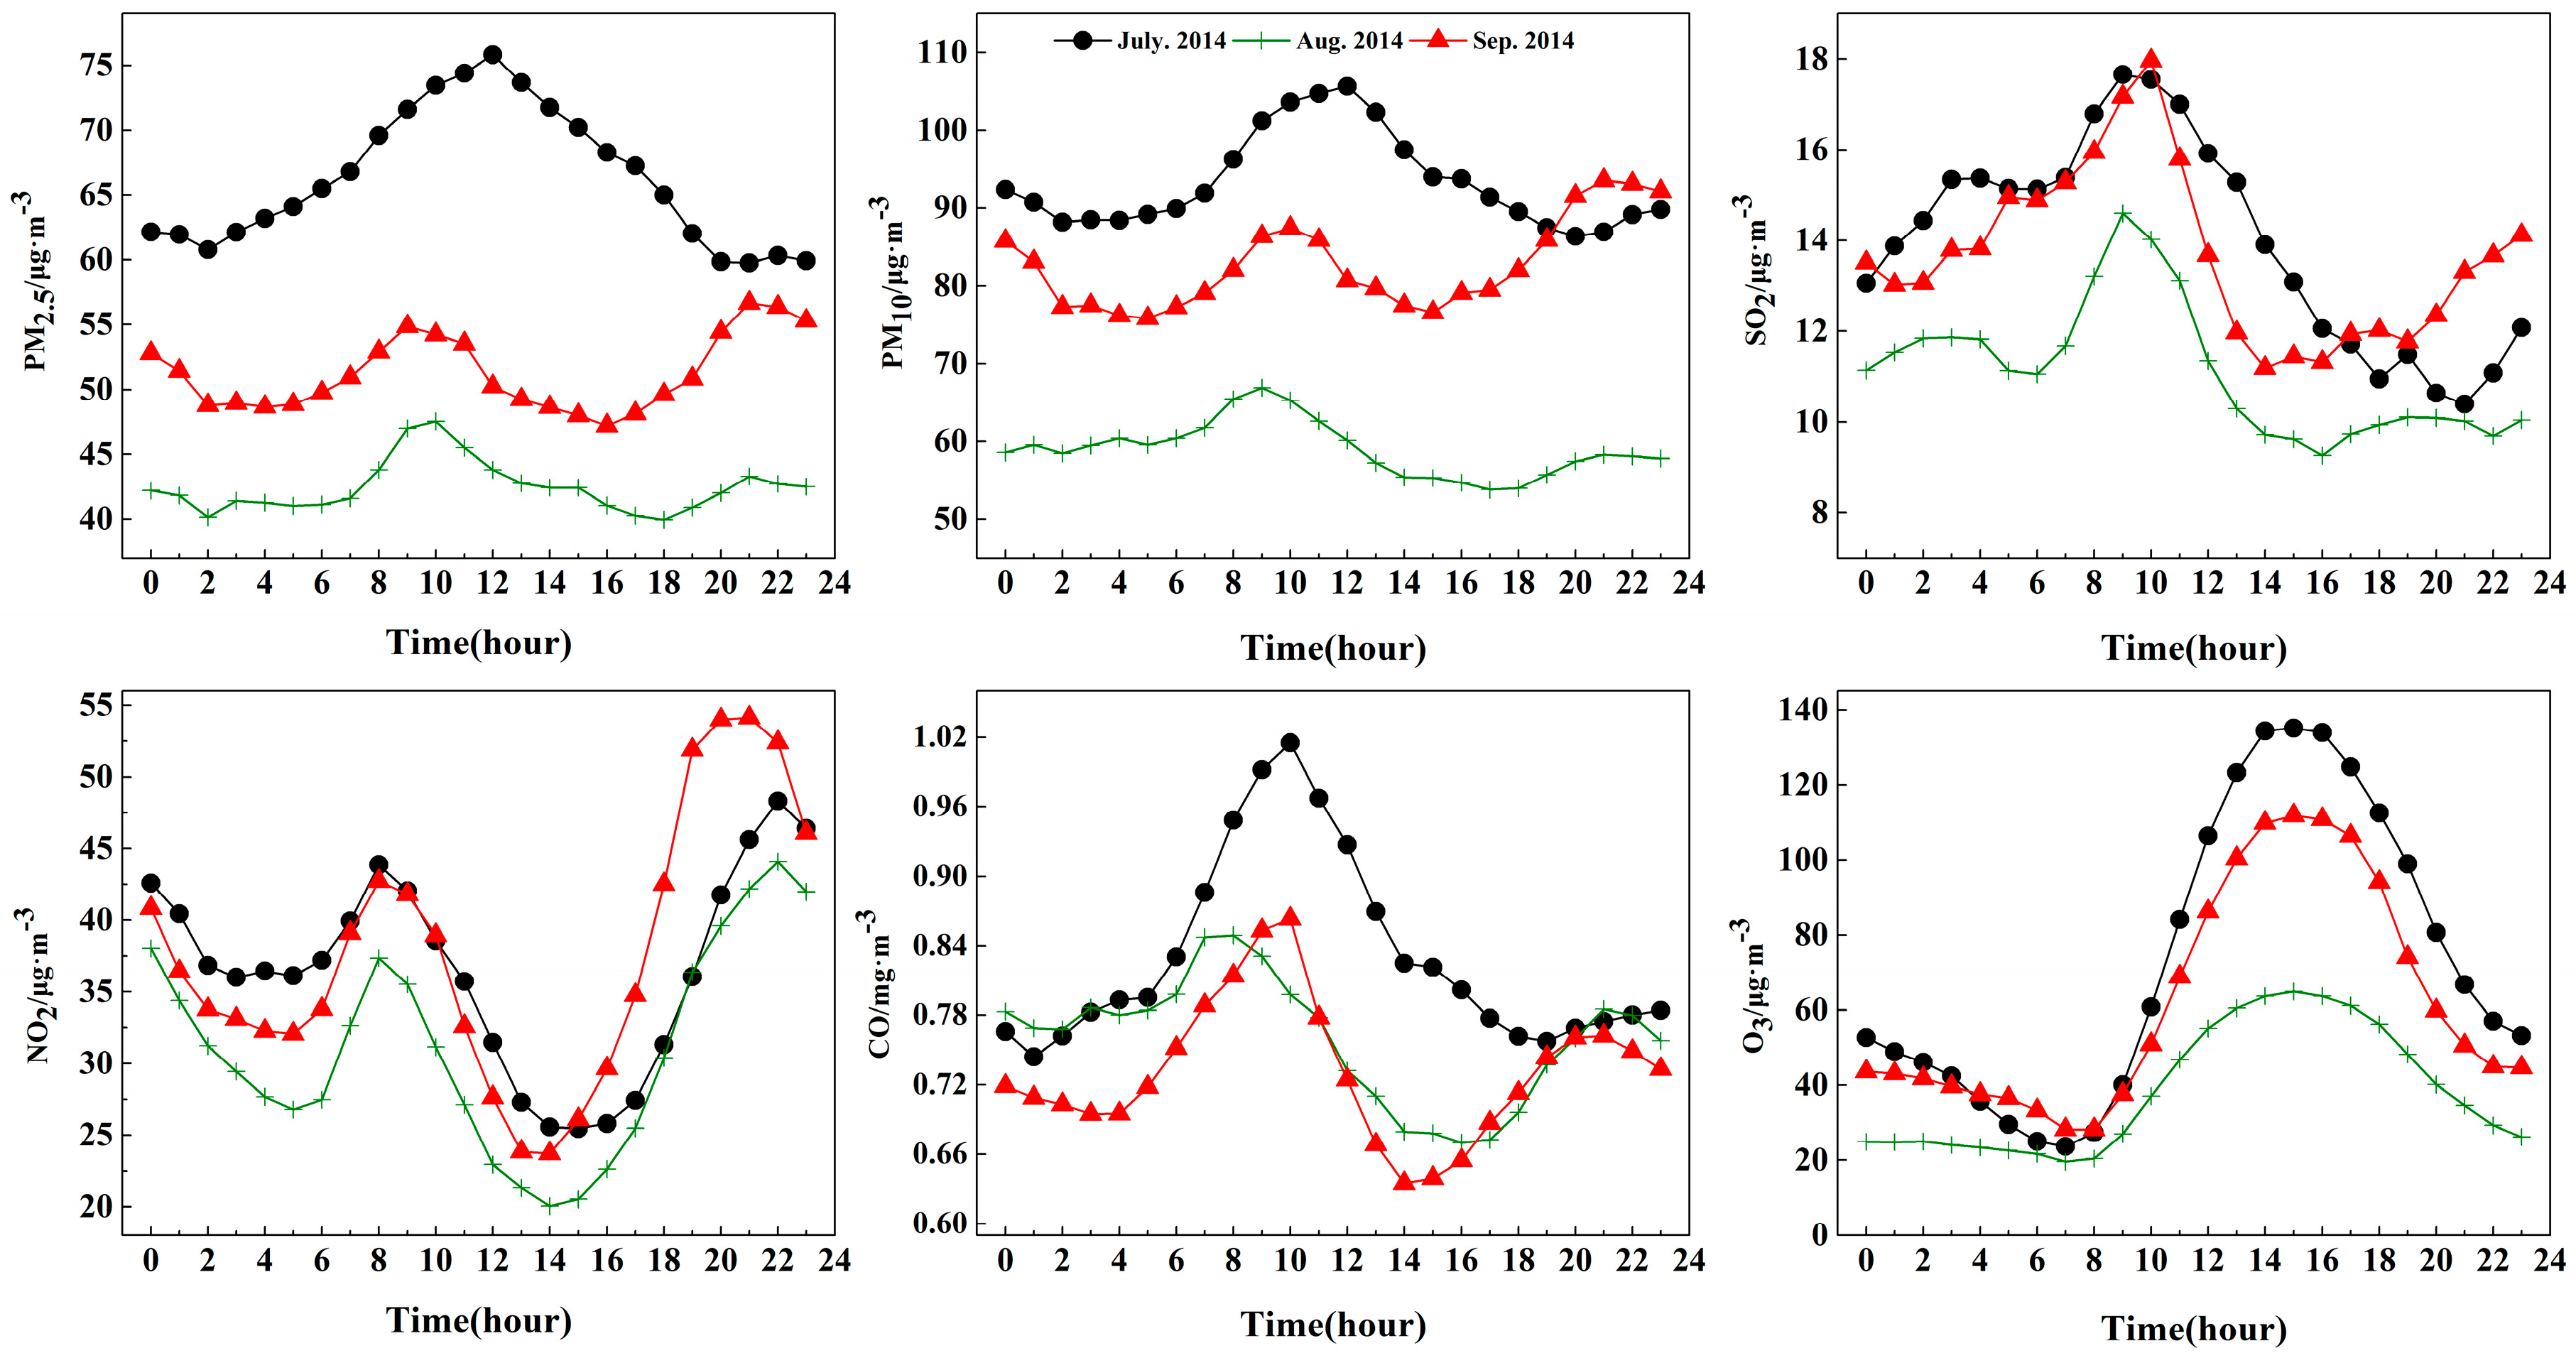
3.3. Diurnal Evolution of Air Pollutant Concentrations
Figure 3 shows the diurnal variation of air pollutant concentrations in different periods. Although the air pollutant concentrations of each period are different, the basic pattern shows that the air pollutants diurnal variation curve in August 2014 was lower than those of the other two periods, except for CO.
PM2.5 concentration was gradually reduced from midnight to 2:00–4:00, followed by a morning peak around 9:00–10:00, except for July 2014 (before the emission reduction). Concentrations then decreased until 16:00–18:00, after which they rose until 21:00–22:00. Therefore, two periods displayed a bimodal pattern with peaks between 9:00–10:00 and 21:00–22:00. The morning peak was attributed to enhanced anthropogenic activity during rush hour [16]. After sunrise, strong turbulence in the developing convective boundary layer led to lower PM2.5 concentration. During the night, lower mixed layer height led to higher PM2.5 concentration. The diurnal variation characteristic of PM10 was similar to that of PM2.5 concentration, which reflected the positive effects of the emission reduction measures.
SO2 concentration showed a unimodal pattern; the maximum SO2 concentrations tended to appear around 9:00–10:00 during the day, which was similar to that of PM2.5. The mixing layer was high and photochemical conversion was strong at this time, as SO2 in the upper air was transferred to the ground which led to the peak [9]. The main source of NO2 in Nanjing is automobile exhaust. Diurnal variation of NO2 presented a double-peak curve. The first peak appeared at 08:00 after the morning peak traffic, then the concentration of NO2 was reduced by photolysis due to the enhancement of solar radiation, and the minimum values of NO2 concentration occurred at 13:00–14:00. With the arrival of the evening peak traffic, NO2 concentration gradually increased from 13:00–14:00 to 21:00–22:00, and another significant peak appeared at 21:00–22:00, similar to that observed in Chengdu City [17].
The highest CO hourly concentration appeared at around 08:00–10:00 in the morning, followed by a sharply decreasing trend to the lowest value at around 14:00–15:00, except for July 2014 (before the emission reduction). A slight but continuous increase was observed from 14:00–15:00 to 21:00, and finally a second weaker peak was seen at night due to the decrease in boundary layer height, which resulted in the accumulation of pollutants. The diurnal variations of O3 concentrations in three periods showed similar characteristics; the lowest ozone concentrations for three periods appeared at around 07:00–08:00 with values around 20–30 μg·m−3. With increasing temperature and solar radiation in the daytime, O3 concentration increased from 07:00–08:00 until 15:00, when it reached its peak. The concentration then rapidly fell until midnight.
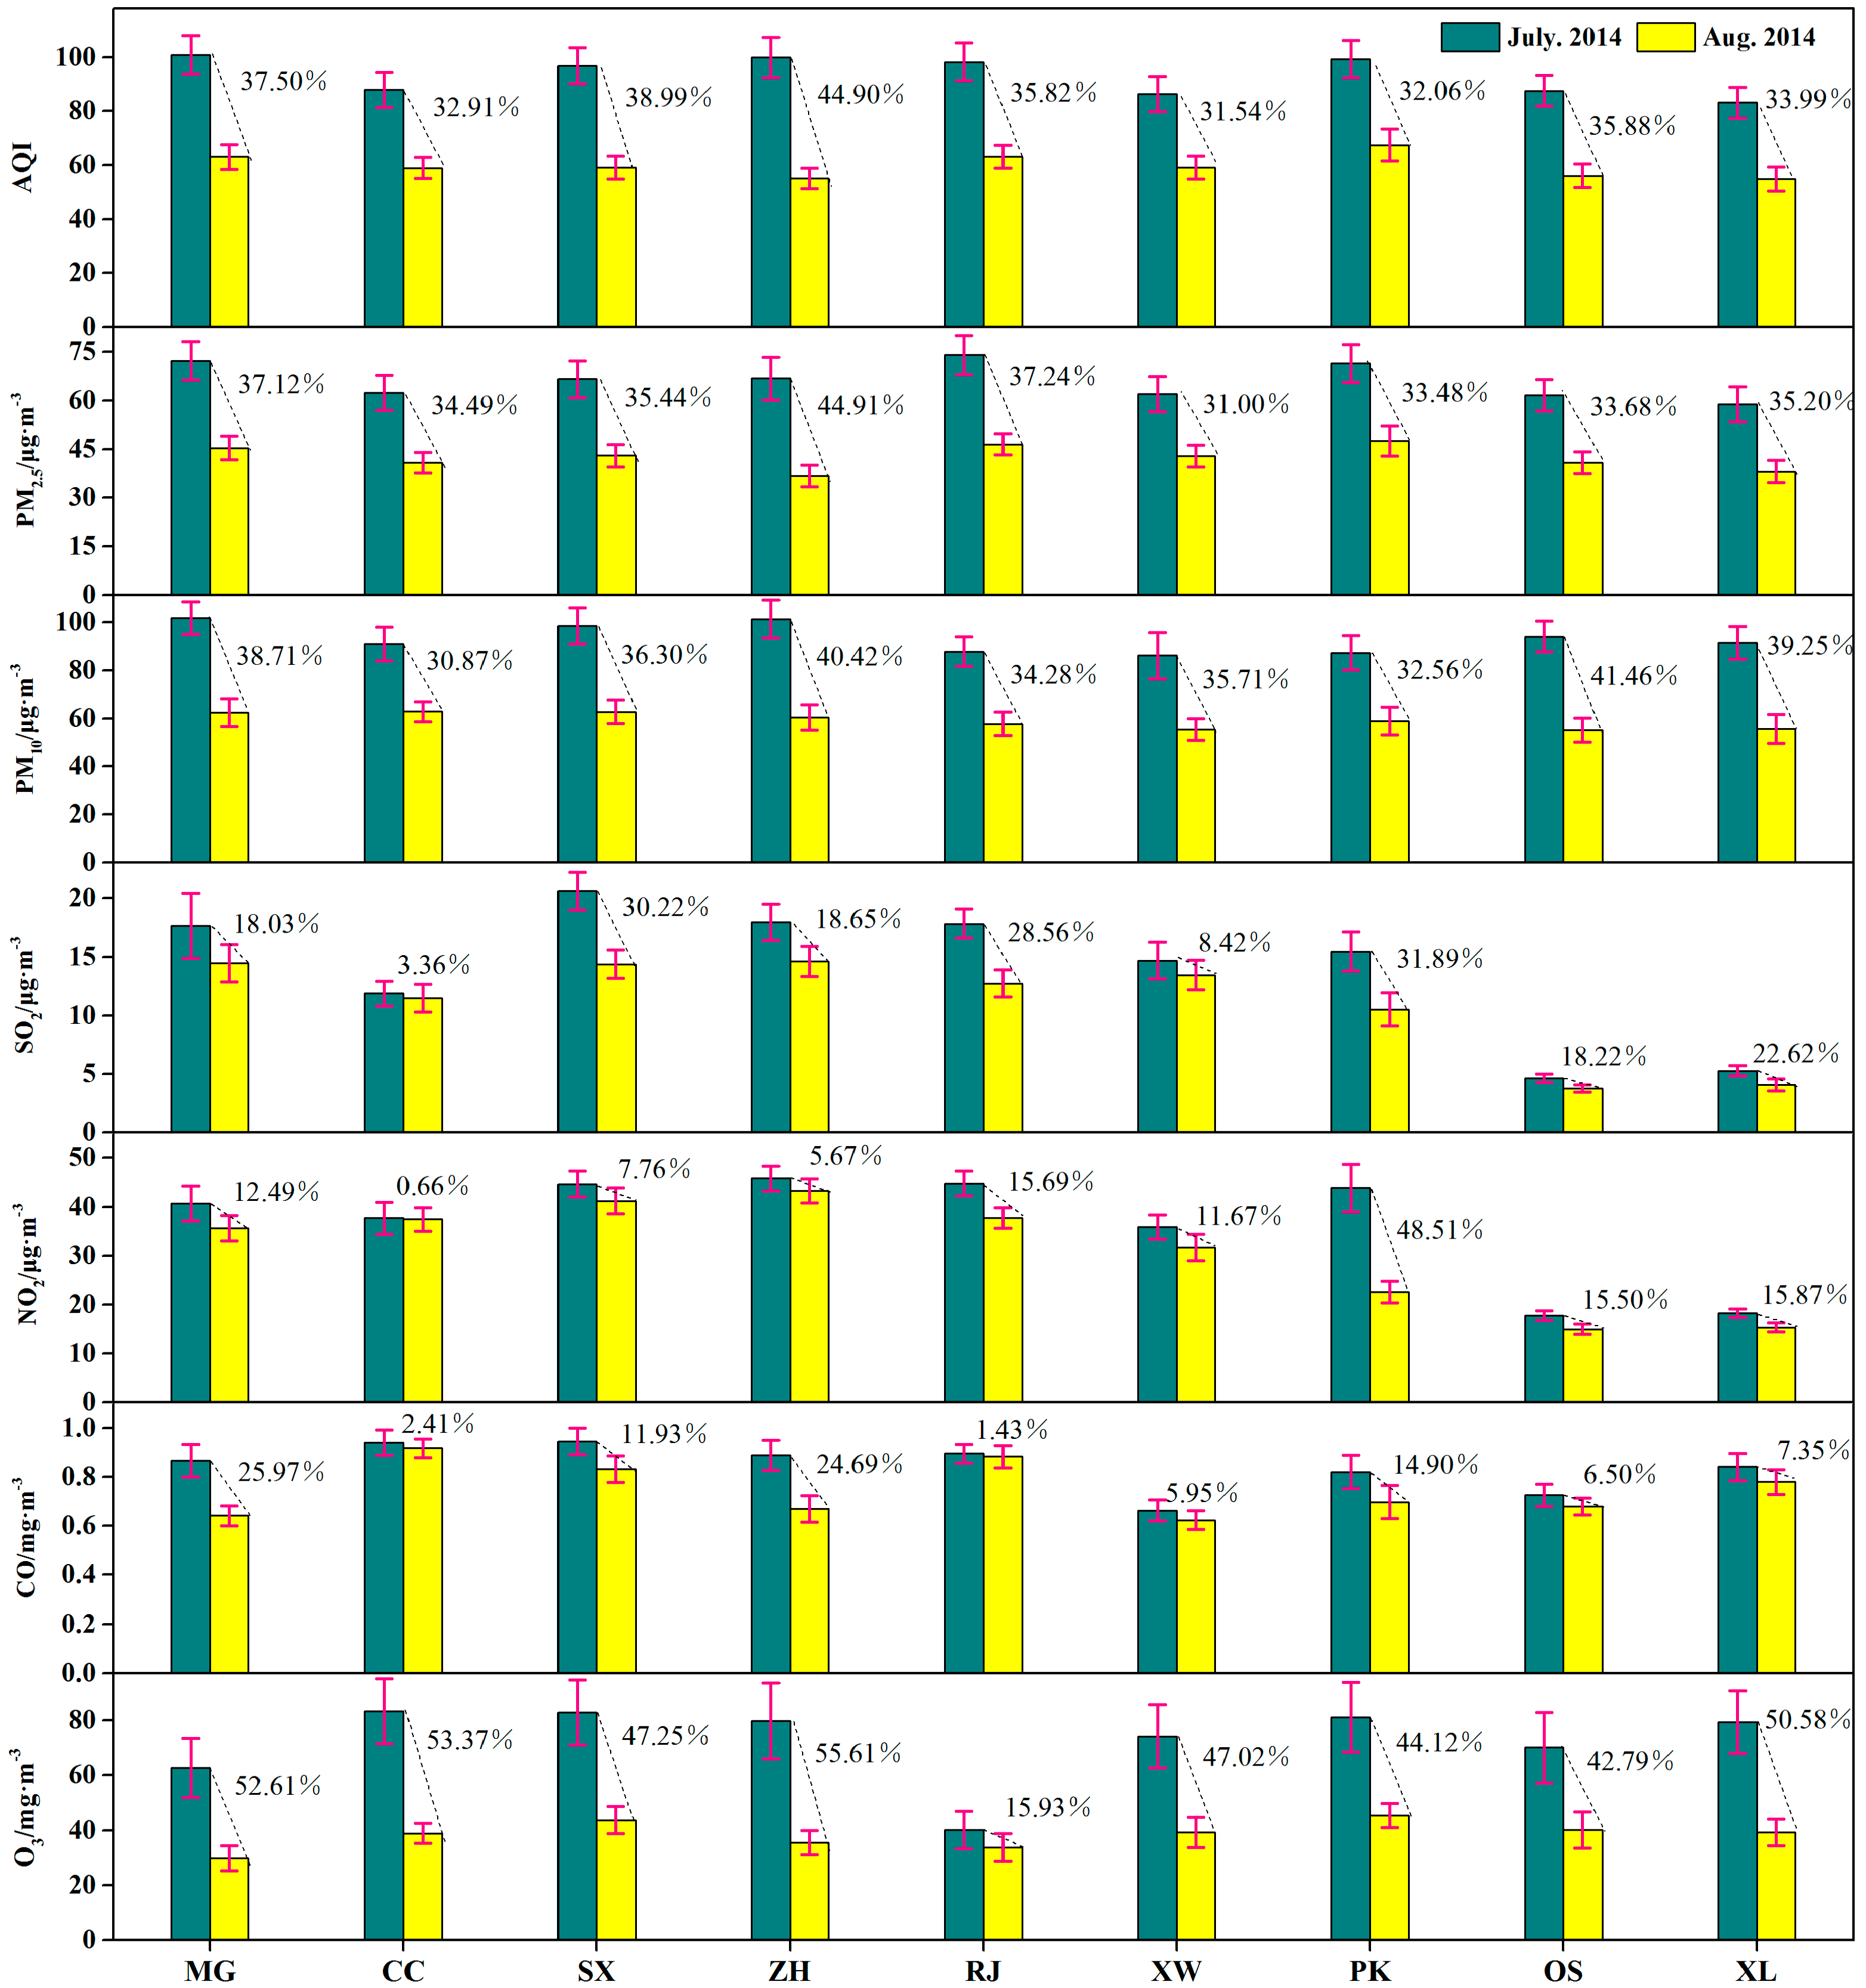
3.4. Spatial Variation of the AQI and Air Pollutant Concentrations
In order to analyze the spatial variation of air quality and air pollutants during the period of the emission reduction, the mean values and standard errors of the AQI and six air pollutant concentrations in nine different sites of Nanjing were compared with the period before the emission reduction, as shown in Figure 4. The AQI during the emission reduction was lower than that in July 2014 at all monitoring stations; the percentage of decrease of ranged from 31.54 to 44.90% on spatial variation, which indicated the effects on air quality of implementing the reduction measures.
Concentrations of PM2.5, PM10 and O3 during the emission reduction period decreased significantly at nine monitoring sites compared with those in July 2014. The percentage of decrease of PM2.5 ranged from 31.00 to 44.91%, showing that the strict pollution control measures carried out in Nanjing could reduce the concentration of PM2.5. The percentage of decrease of PM10 ranged from 30.87 to 41.46%, which was similar to PM2.5 in the spatial variation. The percentage of decrease of O3 ranged from 15.93 to 55.61%, which was the largest of the six air pollutants. The percentage of decrease of SO2 ranged from 3.36 to 31.89%, which was lower than that observed in Beijing during the APEC period [9]. Most of the coal-burning factories were shut down during the period of the emission reduction in Nanjing. Thus, the decrease of SO2 indicated the effects of the reduction of coal consumption [18]. The percentage of decrease of NO2 ranged from 0.66 to 48.51%, which reflected the good influence of reducing motor vehicle exhaust and industrial production. The percentage of decrease of CO ranged from 1.43 to 25.97%, which was the smallest of the six air pollutants; moreover, the daily average of CO has not exceeded the Chinese national assessment standard in Nanjing in recent years.
The decrease of the AQI at the ZH site was the highest of all the sites. The decrease of PM2.5 at the ZH site was the highest, while the decrease of PM2.5 at the XW site was lower than the others. The decrease of PM10 at the OS site was higher than those at other monitoring sites, reflecting the effectiveness of control measures for PM10 in the main stadium of the Nanjing Youth Olympic Games. The PK site was located in the suburbs of Nanjing, and the decrease of SO2 and NO2 at the PK site was the highest of all the monitoring sites, indicating the effectiveness of controlling motor vehicles and industrial production. The decrease of O3 exceeded 40% in the spatial variation, except for the RJ site, with a decrease of 55.61% at the ZH site, which was the largest of all the monitoring sites.
3.5. Variation of Air Quality in Nanjing and the Surrounding Cities
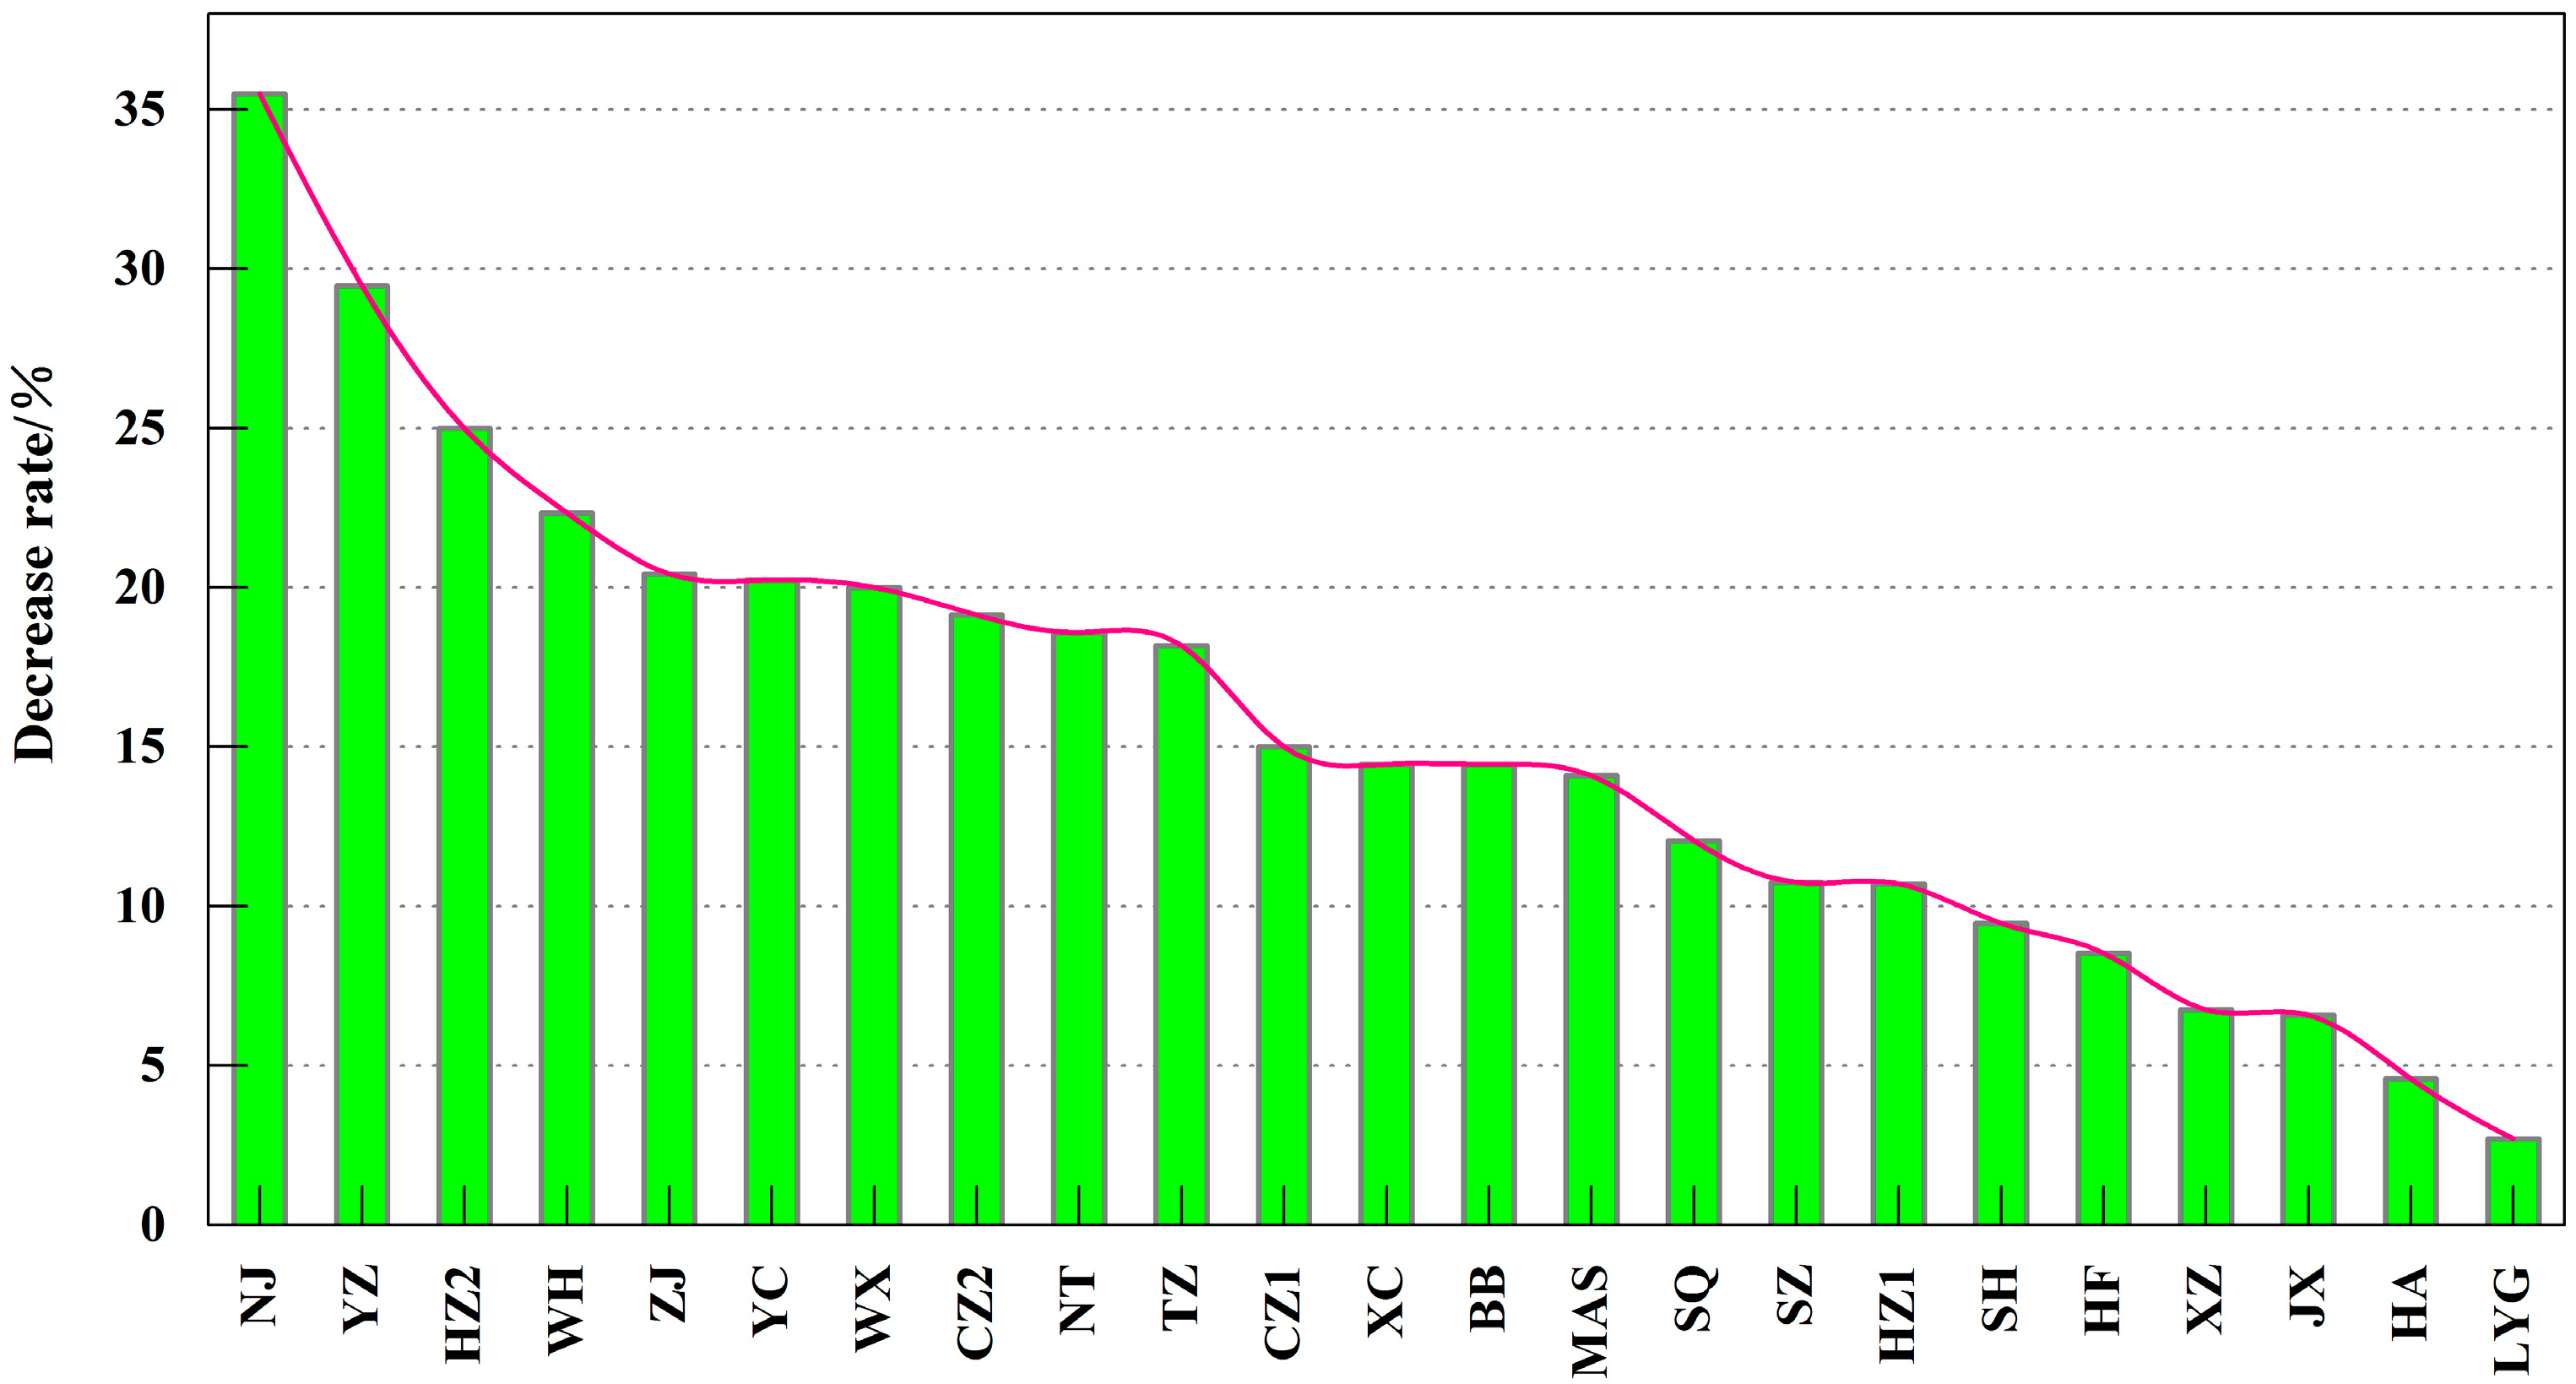
From 1 to 31 August 2014, Nanjing cooperated with 22 surrounding cities to establish an air pollution joint prevention group to guarantee the air quality in August in Nanjing. Figure 5 shows the AQI of Nanjing and 22 nearby cities in July and August 2014. In July 2014, the air quality was the worst in WX, compared with the other cities; the AQI for WX was the highest (105), followed by CZ2 and YZ. The air quality was the best in LYG, XZ and SH, where the AQI was the lowest (74). In August 2014, the maximum value of the AQI occurred in JX and the minimum value of the AQI appeared in Nanjing. We found that the difference between the AQI in July 2014 and August 2014 was very significant (p < 0.05). Figure 6 represents the percentage of decrease of the AQI during the emission reduction period compared with July 2014 in Nanjing and 22 nearby cities. The AQI of all cities showed a downward trend. The decrease in the AQI in Nanjing was 35.48%, which was the largest of the 23 cities, followed by YZ and HZ2, and was almost the same in ZJ, YC and WX. The decrease in the AQI in CZ2, NT and TZ were 19.15%, 18.60% and 18.18%, respectively. The decrease in the AQI in SH, HF, XZ, JX, HA and LYG were less than 10% and greater than 0%, and was the lowest in LYG with only a 2.70% reduction.
4. Discussion and Conclusions
Air pollutant concentrations are not only related to emissions from air pollution sources, but are also influenced by meteorological conditions. In order to eliminate the interference of meteorological conditions, we divided the meteorological data into three time periods: before, during the emission reduction and during the same period of the previous year (2013). According to the comparison of meteorological data in three periods, we found that most of the meteorological parameters in July 2014 were closer to the average level during the period of the emission reduction than that in August 2013. Therefore, we analyzed the concentrations of air pollutants before, during and after the emission reduction, which was more appropriate than the comparison with the year 2013 to evaluate the effectiveness of air pollution reduction actions.
According to our analysis and comparison, the concentrations of six air pollutants during the emission reduction period were significantly lower than those in the prophase mean before the emission reduction, especially O3. Compared with the average levels in July 2014, the mean concentrations of PM2.5, PM10, SO2, NO2, CO and O3 decreased by 35.92%, 36.75%, 20.40%, 15.05%, 8.54% and 47.15%, respectively. All these reductions in air pollutants indicated that the emission control measures were successful during the YOG, and little related to the local meteorological conditions. After the YOG, air pollutants increased significantly due to the cancellation of the emission control measures, except for CO. In addition, we also analyzed the diurnal variations of air pollutant concentrations in different periods. Overall, the diurnal variation curve of air pollutants during the period of the emission reduction was lower than that in July 2014, except for CO. In the spatial variation of pollutants, the AQI during the emission reduction was lower than that in July 2014 at all monitoring stations, the decrease of which ranged from 31.54 to 44.90% in spatial variation. Meanwhile, the decrease of PM2.5 ranged from 31.00% to 44.91% at different sites, the decrease of PM10 ranged from 30.87% to 41.46%, the decrease of SO2 ranged from 3.36% to 31.89%, the decrease of NO2 ranged from 0.66% to 48.51%, the decrease of CO ranged from 1.43% to 25.97%, and the decrease of O3 ranged from 15.93% to 55.61%. Our results suggested that the AQI of Nanjing and 22 nearby cities showed a downward trend when compared with July 2014, which reflected the effects on air quality of implementing the regional emission reduction measures.
In recent years, China has successfully hosted many international events. In order to improve air quality during the events, the local government has implemented some short-term periods with temporary emission control measures to reduce the emissions of pollutants. During the 2008 Olympic Games, the Beijing municipal government took many air pollution control measures, which included relocating some heavily polluting enterprises, encouraging natural gas instead of coal-fired boilers and domestic stoves, limiting the use of cars and so on [19]. During the 2010 Asian Games, the Guangzhou government made great efforts to improve the air quality, which mainly included controlling emissions from industries and transportation restrictions; vehicles could be driven only on alternate days depending on license plate numbers, and all construction activities were put on hold during the Games [20]. During the APEC period, the Chinese government took more stringent emission reduction measures in Beijing and the surrounding region, including banning heavily polluting vehicles, closing heavily polluting factories, slowing down construction activities and so on [21]. Some studies found that the mass concentration of air pollutants during the events decreased significantly, except for O3 [9,22]. The results of our studies showed that the emission control measures were the most effective on O3 out of the six air pollutants, indicating that the major O3 precursors (nitrogen oxides and volatile organic compounds) were well controlled, and that meteorological conditions also played a positive role during the YOG.
The Nanjing government carried out temporary strict environmental regulations to ensure good air quality during the YOG in 2014. Other surrounding cities cooperated with Nanjing to guarantee good air quality during the Games. Approximately 2630 construction sites were halted. Heavy-industry factories, including the petrochemical industry, iron and steel industry, building materials industry and so on were required to reduce manufacturing by 20%. High-emission or yellow-labeled vehicles were not allowed to drive on the road. Open space barbecue restaurants were closed. Over 900 electric buses and 500 electric taxis have been put into operation [23]. In addition, 22 surrounding cities in the Yangtze River Delta region were asked to cooperate with Nanjing to close industries with high pollution emissions during the emission reduction period [24].
According to the analysis of this study, several suggestions have been made to improve the air quality of Nanjing. On the one hand, as regional emission reduction measures were the main factor in improving the air quality in Nanjing, regional cooperation and joint defense and control are considered the future direction in air pollution control. On the other hand, greater efforts should be exerted to control dust, coal-burning, vehicle emissions and industrial production around Nanjing, which would play a significant role in improving the air quality of Nanjing.
In order to protect human health and improve air quality, we may consider taking the following several measures and recommendations for air pollution reduction over long-term period:
- To reduce emissions. Use more non-pollution energy, such as solar energy, wind energy and hydropower. Reform energy structure and use low-polluting energy, such as natural gas, biogas and alcohol. In addition, before the pollutants enter the atmosphere, use technology such as dust and smoke abatement to eliminate the partial pollutant in the waste gas, as it can reduce the quantity of pollutants entering the atmosphere.
- To curb emissions and make full use of the atmosphere’s self-purification ability. Due to different meteorological conditions, the efficiency of the removal of pollutants in the atmosphere is different. The pollutants concentration may be different in different regions, even when the same amount of pollutants has been released into the atmosphere. Therefore, respond to different regions at different times for the effective control of emissions.
- Factors such as the location of factory sites, chimney designs, city planning and the location of industrial districts must be given proper attention so as to not cause redundant iterations of pollution, which can in turn result in serious local pollution events.
- Afforestation enables more plants to absorb pollutants, thus reducing the degree of air pollution.
Acknowledgments
This work was financially supported by the National Natural Science Fund (41475108).
Author Contributions
Hui Zhao and Youfei Zheng conceived and designed the experiments as well as writing the paper; Hui Zhao analyzed the data; Ting Li helped perform the statistical analysis.
Conflicts of Interest
The authors declare no conflict of interest.
References
- Chan, C.K.; Yao, X.H. Air pollution in mega cities in China. Atmos. Environ. 2008, 42, 1–42. [Google Scholar] [CrossRef]
- Gao, J.J.; Tian, H.Z.; Cheng, K.; Lu, L.; Zheng, M.; Wang, S.X.; Hao, J.M.; Wang, K.; Hua, S.B.; Zhu, C.Y.; Wang, Y. The variation of chemical characteristics of PM2.5 and PM10 and formation causes during two haze pollution events in urban Beijing, China. Atmos. Environ. 2015, 107, 1–8. [Google Scholar] [CrossRef]
- Leiva, M.A.; Santibanez, D.A.; Ibarra, S.; Matus, P.; Seguel, R. A five-year study of particulate matter (PM2.5) and cerebrovascular diseases. Environ. Pollut. 2013, 181, 1–6. [Google Scholar] [CrossRef] [PubMed]
- Pascal, M.; Falq, G.; Wagner, V.; Chatignoux, E.; Corso, M.; Blanchard, M.; Host, S.; Pascal, L.; Larrieu, S. Short-term impacts of particulate matter (PM10, PM10–2.5, PM2.5) on mortality in nine French cities. Atmos. Environ. 2014, 95, 175–184. [Google Scholar] [CrossRef]
- Shankardass, K.; Jerrett, M.; Dell, S.D.; Foty, R.; Stieb, D. Spatial analysis of exposure to traffic-related air pollution at birth and childhood atopic asthma in Toronto, Ontario. Health Place 2015, 34, 287–295. [Google Scholar] [CrossRef] [PubMed]
- Yang, Y.R.; Liu, X.G.; Qu, Y.; Wang, J.L.; An, J.L.; Zhang, Y.H.; Zhang, F. Formation mechanism of continuous extreme haze episodes in the megacity Beijing, China, in January 2013. Atmos. Res. 2015, 155, 192–203. [Google Scholar] [CrossRef]
- Xin, J.Y.; Wang, Y.S.; Tang, G.Q.; Wang, L.L.; Sun, Y.; Wang, Y.H.; Hu, B.; Song, T.; Ji, D.S.; Wang, W.F.; et al. Variability and reduction of atmospheric pollutants in Beijing and its surrounding area during the Beijing 2008 Olympic Games. Chin. Sci. Bull. 2010, 55, 1937–1944. [Google Scholar] [CrossRef]
- Wang, W.T.; Primbs, T.; Tao, S.; Simonich, S.M. Atmospheric Particulate Matter Pollution during the 2008 Beijing Olympics. Environ. Sci. Technol. 2009, 15, 5314–5320. [Google Scholar] [CrossRef]
- Wang, Z.S.; Li, Y.T.; Chen, T.; Li, L.J.; Liu, B.X.; Zhang, D.W.; Sun, F.; Wei, Q.; Jiang, L.; Pan, L.B. Changes in atmospheric composition during the 2014 APEC conference in Beijing. J. Geophys. Res. Atmos. 2015, 120, 695–707. [Google Scholar] [CrossRef]
- Hao, N.; Valks, P.; Loyola, D.; Cheng, Y.F.; Zimmer, W. Space-based measurements of air quality during the World Expo 2010 in Shanghai. Environ. Res. Lett. 2011, 6, 67–81. [Google Scholar] [CrossRef]
- Wu, F.C.; Xie, P.H.; Li, A.; Chan, K.L.; Hartl, A.; Wang, Y.; Si, F.Q.; Zeng, Y.; Qin, M.; Xu, J.; et al. Observations of SO2 and NO2 by mobile DOAS in the Guangzhou eastern area during the Asian Games 2010. Atmos. Meas. Tech. 2013, 6, 2277–2292. [Google Scholar] [CrossRef]
- Hu, J.L.; Ying, Q.; Wang, Y.G.; Zhang, H.L. Characterizing multi-pollutant air pollution in China: Comparison of three air quality indices. Environ. Int. 2015, 84, 17–25. [Google Scholar] [CrossRef] [PubMed]
- Shen, G.F.; Yuan, S.Y.; Xie, Y.N.; Xia, S.J.; Li, L.; Yao, Y.K.; Qiao, Y.Z.; Zhang, J.; Zhao, Q.Y.; Ding, A.J.; et al. Ambient levels and temporal variations of PM2.5 and PM10 at a residential site in the mega-city, Nanjing, in the western Yangtze River Delta, China. J. Environ. Sci. Health. A. 2014, 49, 171–178. [Google Scholar]
- Stella, P.; Personne, E.; Loubet, B.; Lamaud, E.; Ceschia, E.; Beziat, P.; Bonnefond, J.M.; Irvine, M.; Keravee, P.; Mascher, N.; et al. Predicting and partitioning ozone fluxes to maize crops from sowing to harvest: The Surfatm-O3 model. Biogeosciences 2011, 8, 2869–2886. [Google Scholar] [CrossRef]
- Leung, L.R.; Gustafson, W.I. Potential regional climate change and implications to U.S. air quality. Geophys. Res. Lett. 2005, 32, 367–384. [Google Scholar] [CrossRef]
- Zhao, X.J.; Zhang, X.L.; Xu, X.F.; Xu, J.; Meng, W.; Pu, W.W. Seasonal and diurnal variations of ambient PM2.5 concentration in urban and rural environments in Beijing. Atmos. Environ. 2009, 43, 2893–2900. [Google Scholar] [CrossRef]
- Xie, Y.Z.; Pan, Y.P.; Ni, C.J.; Chen, Z.H.; Wei, X. Temporal and spatial variations of atmospheric pollutants in urban Chengdu during summer [in Chinese]. Acta. Sci. Circumst. 2015, 35, 975–983. [Google Scholar]
- Apergis, N.; Loomis, D.; Payne, J.E. Are fluctuations in coal consumption transitory or permanent? Evidence from a panel of US states. Atmos. Environ. 2010, 87, 2424–2426. [Google Scholar] [CrossRef]
- Wang, S.X.; Zhao, M.; Xing, J.; Wu, Y.; Zhou, Y.; Lei, Y.; He, K.B.; Fu, L.X.; Hao, J.M. Quantifying the air pollutants emission reduction during the 2008 Olympic Games in Beijing. Environ. Sci. Technol. 2010, 44, 2490–2496. [Google Scholar] [CrossRef] [PubMed]
- Liu, H.; Wang, X.M.; Zhang, J.P.; He, K.B.; Wu, Y.; Xu, J.Y. Emission controls and changes in air quality in Guangzhou during the Asian Games. Atmos. Environ. 2013, 76, 81–93. [Google Scholar] [CrossRef]
- Li, R.P.; Mao, H.J.; Wu, L.; He, J.J.; Ren, P.P.; Li, X.Y. The evaluation of emission control to PM concentration during Beijing APEC in 2014. Atmos. Pollut. Res. 2016, 7, 363–369. [Google Scholar] [CrossRef]
- Wang, Z.S.; Li, Y.T.; Zhang, D.W.; Chen, T.; Sun, F.; Li, L.J.; Li, J.X.; Sun, N.D.; Chen, C.; Wang, B.Y. Analysis on air quality in Beijing during the 2014 APEC conference [in Chinese]. J. Environ. Sci. 2016, 36, 675–683. [Google Scholar]
- Ding, J.; Vander, A.R.J.; Mijling, B.; Levelt, P.F.; Hao, N. NOx emission estimates during the 2014 Youth Olympic Games in Nanjing. Atmos. Chem. Phys. 2015, 15, 6337–6372. [Google Scholar] [CrossRef]
- Li, S.W.; Li, H.B.; Luo, J.; Li, H.M.; Qian, X.; Liu, M.M.; Bi, J.; Cui, X.Y.; Ma, L.Q. Influence of pollution control on lead inhalation bioaccessibility in PM2.5: A case study of 2014 Youth Olympic Games in Nanjing. Environ. Int. 2016, 94, 69–75. [Google Scholar] [CrossRef] [PubMed]
Figure 1.
Distribution of air quality monitoring stations in Nanjing and surrounding cities.
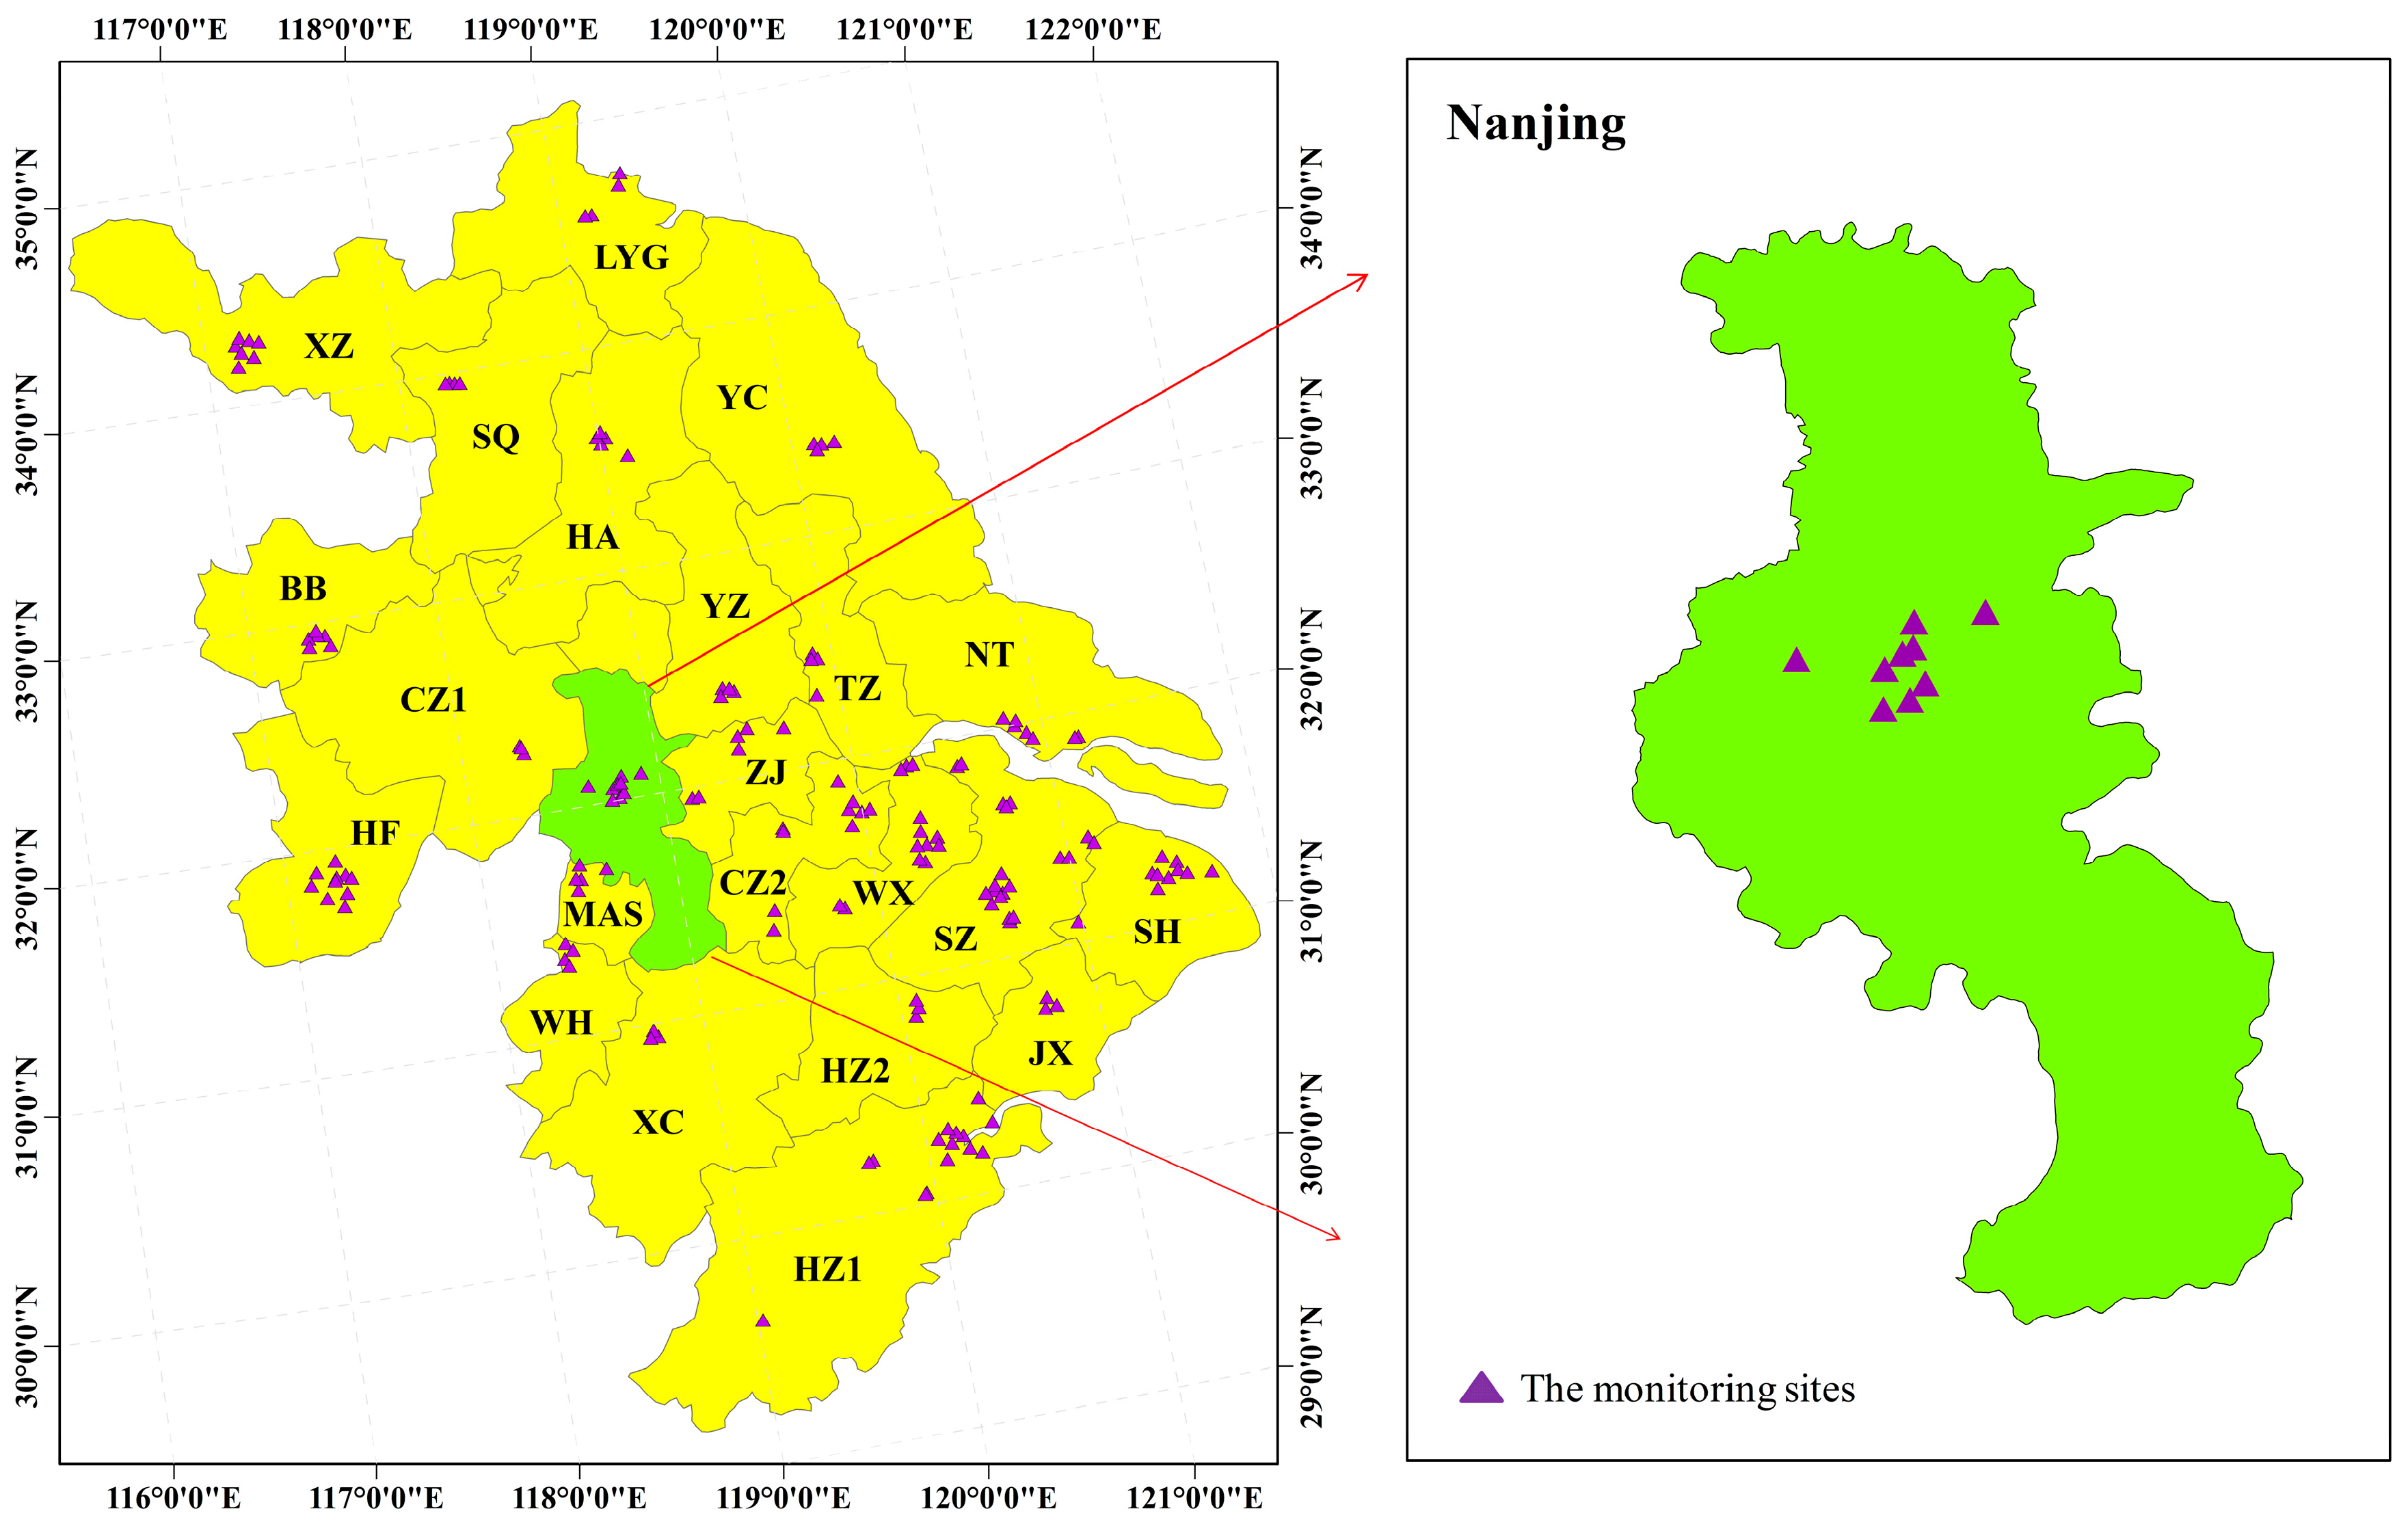
Figure 2.
Daily variation of the AQI and air pollutant concentrations in different periods.

Figure 3.
Diurnal variation of air pollutant concentrations in different periods.

Figure 4.
Spatial variation of the AQI and air pollutants at each site before and during the emission reduction.
Figure 4.
Spatial variation of the AQI and air pollutants at each site before and during the emission reduction.

Figure 5.
Variation of the AQI in Nanjing and its surrounding cities during the emission reduction period.
Figure 5.
Variation of the AQI in Nanjing and its surrounding cities during the emission reduction period.
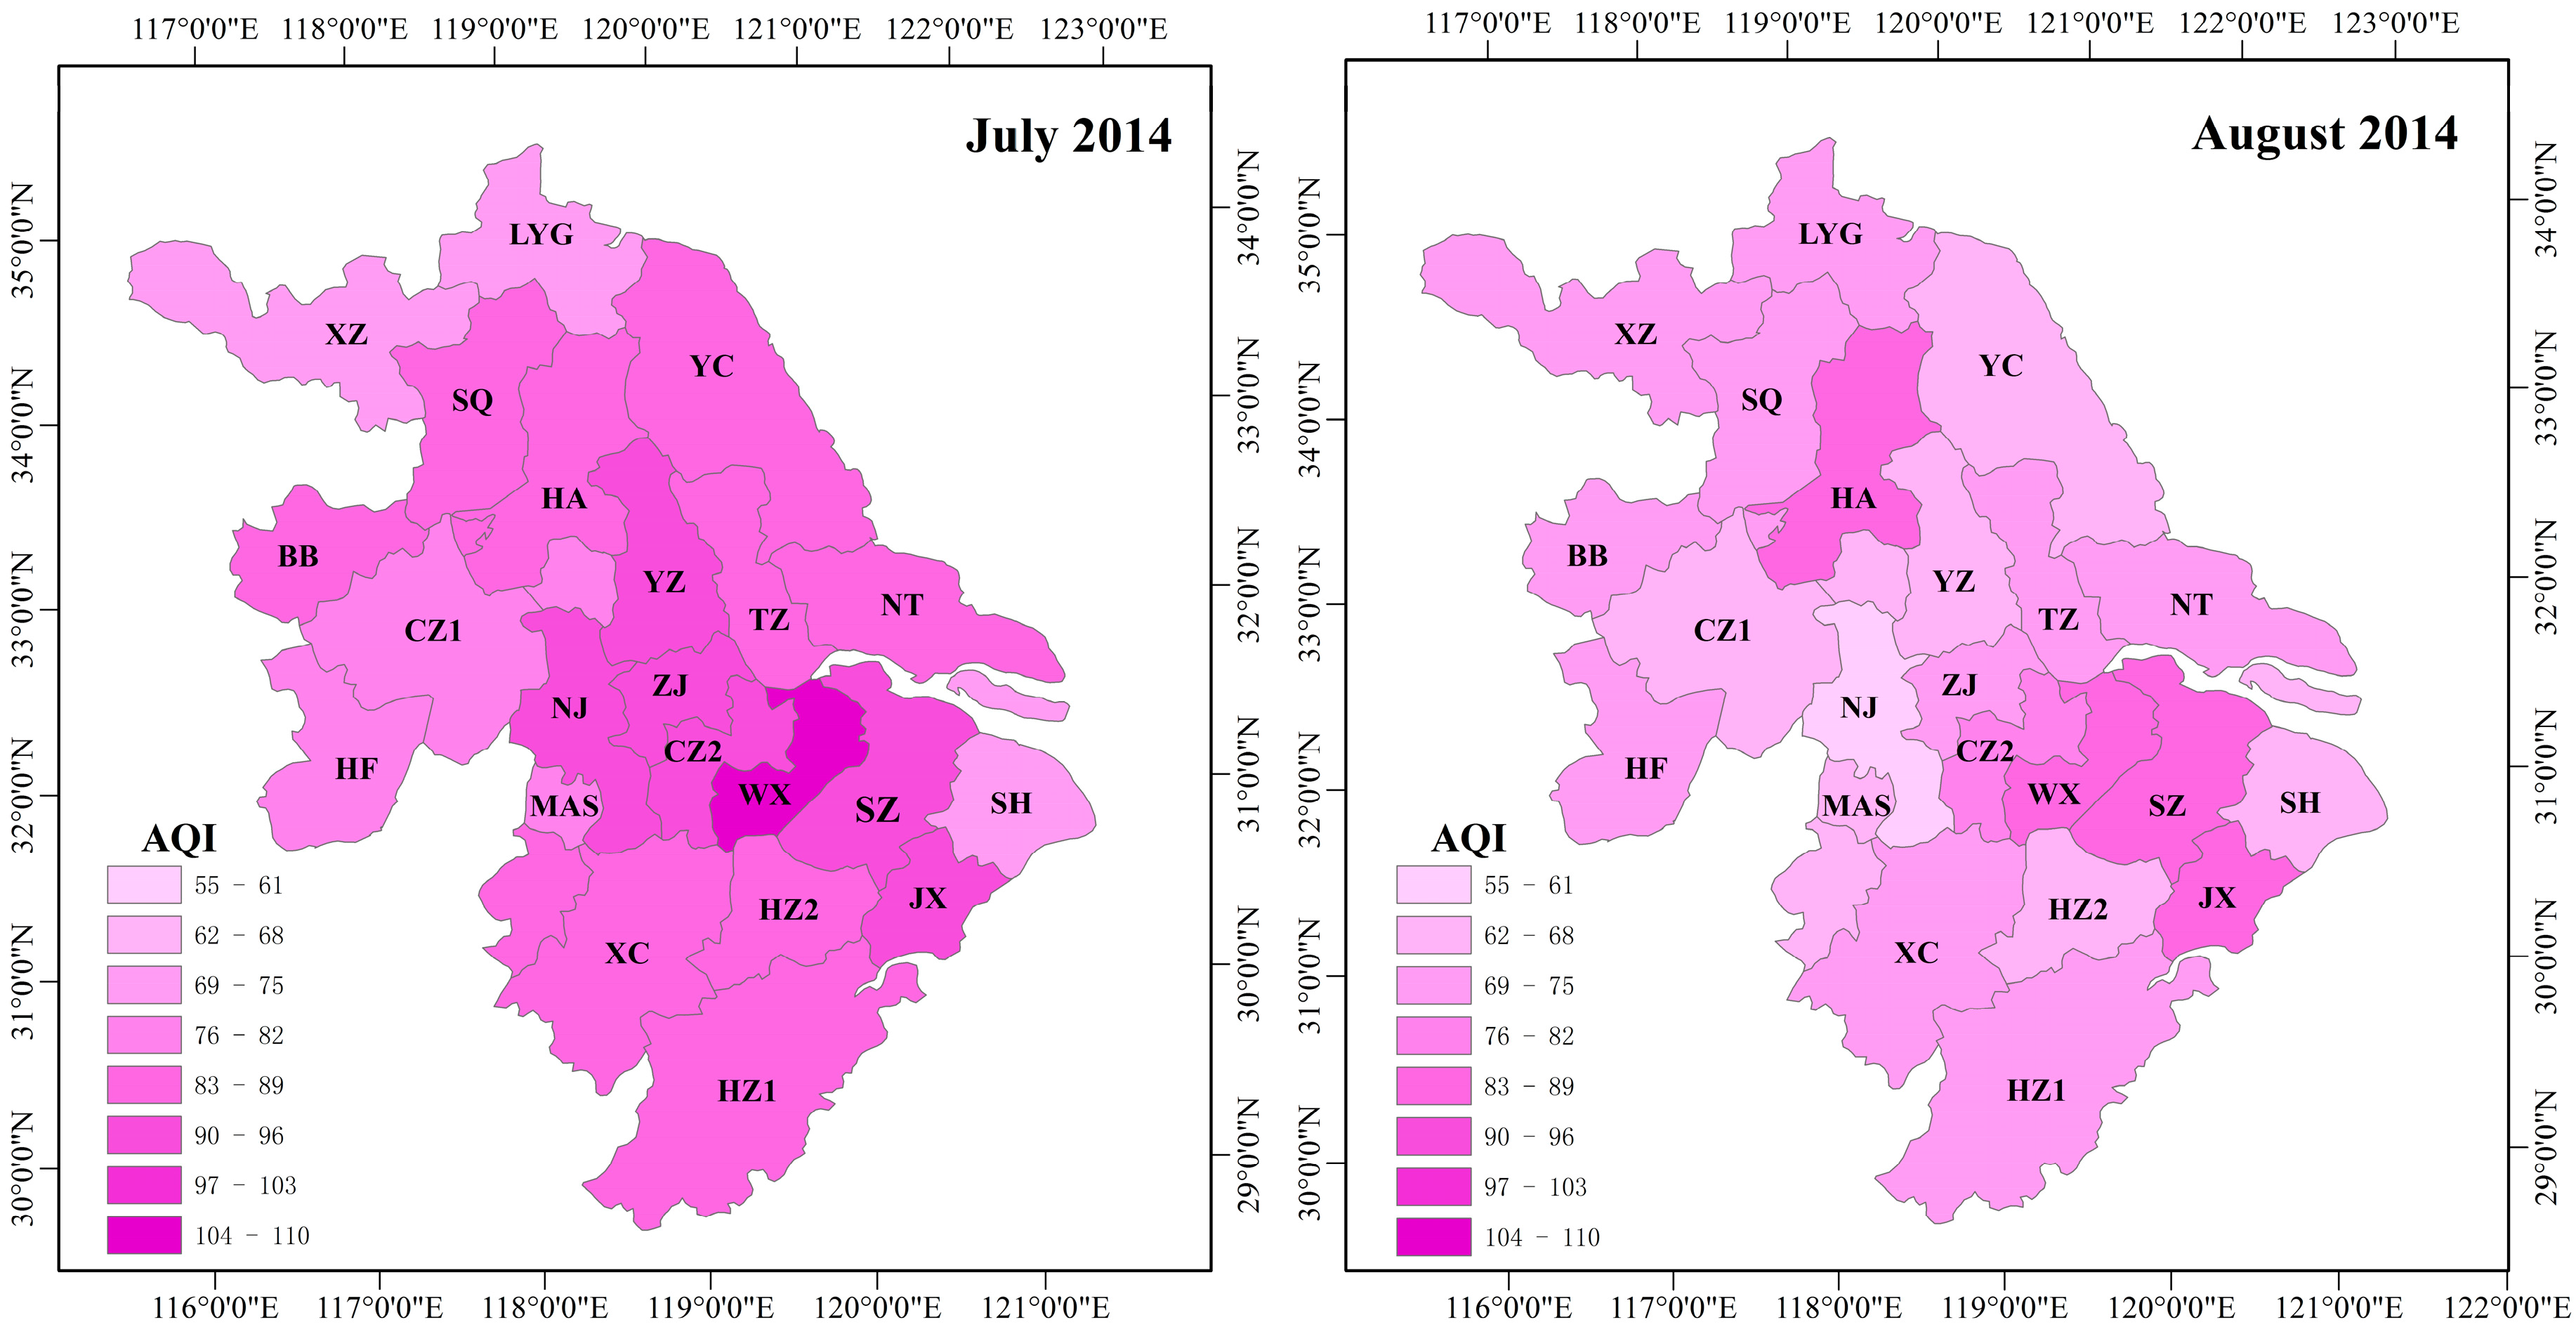
Figure 6.
Decrease percentage of the AQI during the emission reduction period compared with July 2014 in Nanjing and its surrounding cities.
Figure 6.
Decrease percentage of the AQI during the emission reduction period compared with July 2014 in Nanjing and its surrounding cities.

Table 1.
Comparison of meteorological conditions during the different periods.
| Air Temperature (°C) | Relative Humidity (%) | Wind Speed (m/s) | Solar Radiation (w/m2) | Atmospheric Pressure (hPa) | |
|---|---|---|---|---|---|
| August 2013 | 30.8 | 65.9 | 3.09 | 205.6 | 1000.9 |
| July 2014 | 27.1 | 83.4 | 2.26 | 161.6 | 1001.5 |
| August 2014 | 25.6 | 87.1 | 2.19 | 127.7 | 1003.5 |
Table 2.
Mean value of the AQI and mean air pollutant concentrations during the different periods.
| Period | Air Quality Index | PM2.5 (μg·m−3) | PM10 (μg·m−3) | SO2 (μg·m−3) | NO2 (μg·m−3) | CO (mg·m−3) | O3 (μg·m−3) | ||
|---|---|---|---|---|---|---|---|---|---|
| Before the emission reduction | 1–31 July 2014 | 93.35 | 66.23 | 93.29 | 13.97 | 36.60 | 0.831 | 72.64 | |
| During the emission reduction | 1–31 August 2014 | 59.65 | 42.44 | 59.01 | 11.12 | 31.09 | 0.760 | 38.39 | |
| During the Youth Olympic Games | 17–28 August 2014 | 53.40 | 37.84 | 49.60 | 10.86 | 32.89 | 0.778 | 39.12 | |
| After the emission reduction | 1–30 September 2014 | 76.20 | 51.27 | 83.70 | 13.66 | 37.67 | 0.732 | 61.78 | |
© 2017 by the authors. Licensee MDPI, Basel, Switzerland. This article is an open access article distributed under the terms and conditions of the Creative Commons Attribution (CC BY) license (http://creativecommons.org/licenses/by/4.0/).
Share and Cite
MDPI and ACS Style
Zhao, H.; Zheng, Y.; Li, T. Air Quality and Control Measures Evaluation during the 2014 Youth Olympic Games in Nanjing and its Surrounding Cities. Atmosphere 2017, 8, 100. https://doi.org/10.3390/atmos8060100
AMA Style
Zhao H, Zheng Y, Li T. Air Quality and Control Measures Evaluation during the 2014 Youth Olympic Games in Nanjing and its Surrounding Cities. Atmosphere. 2017; 8(6):100. https://doi.org/10.3390/atmos8060100
Chicago/Turabian StyleZhao, Hui, Youfei Zheng, and Ting Li. 2017. "Air Quality and Control Measures Evaluation during the 2014 Youth Olympic Games in Nanjing and its Surrounding Cities" Atmosphere 8, no. 6: 100. https://doi.org/10.3390/atmos8060100
Note that from the first issue of 2016, this journal uses article numbers instead of page numbers. See further details here.