Article

CCN Activity, Variability and Influence on Droplet Formation during the HygrA-Cd Campaign in Athens

by
Aikaterini Bougiatioti
1,2,*,
Athina Argyrouli
2,
Stavros Solomos
3,
Stergios Vratolis
2,4,
Konstantinos Eleftheriadis
4,
Alexandros Papayannis
2 and
Athanasios Nenes
1,5,6,7,*
1
School of Earth & Atmospheric Sciences, Georgia Institute of Technology, Atlanta, GA 30332, USA
2
Laser Remote Sensing Laboratory, National Technical University of Athens, Athens 15780, Greece
3
Institute for Astronomy, Astrophysics, Space Applications and Remote Sensing (IAASARS), National Observatory of Athens, Athens 15236, Greece
4
Environmental Radioactivity Laboratory, Institute of Nuclear & Radiological Sciences & Technology, Energy & Safety, National Centre For Scientific Research Demokritos, Ag. Paraskevi, Athens 15310, Greece
5
School of Chemical & Biomolecular Engineering, Georgia Institute of Technology, Atlanta, GA 30332, USA
6
Institute for Environmental Research and Sustainable Development, National Observatory of Athens, P. Penteli, Athens 15236, Greece
7
Institute for Chemical Engineering Sciences, Foundation of Research and Technology Hellas, Patras 26504, Greece
*
Authors to whom correspondence should be addressed.
Atmosphere 2017, 8(6), 108; https://doi.org/10.3390/atmos8060108
Submission received: 9 April 2017 / Revised: 23 May 2017 / Accepted: 14 June 2017 / Published: 19 June 2017
(This article belongs to the Special Issue Atmospheric Aerosol Composition and its Impact on Clouds)

Abstract

:
Measurements of cloud condensation nuclei (CCN) concentrations (cm−3) at five levels of supersaturation between 0.2–1%, together with remote sensing profiling and aerosol size distributions, were performed at an urban background site of Athens during the Hygroscopic Aerosols to Cloud Droplets (HygrA-CD) campaign. The site is affected by local emissions and long-range transport, as portrayed by the aerosol size, hygroscopicity and mixing state. Application of a state-of-the-art droplet parameterization is used to link the observed size distribution measurements, bulk composition, and modeled boundary layer dynamics with potential supersaturation, droplet number, and sensitivity of these parameters for clouds forming above the site. The sensitivity is then used to understand the source of potential droplet number variability. We find that the importance of aerosol particle concentration levels associated with the background increases as vertical velocities increase. The updraft velocity variability was found to contribute 58–90% (68.6% on average) to the variance of the cloud droplet number, followed by the variance in aerosol number (6–32%, average 23.2%). Therefore, although local sources may strongly modulate CCN concentrations, their impact on droplet number is limited by the atmospheric dynamics expressed by the updraft velocity regime.

1. Introduction

Aerosol indirect effects (AIE) on climate encompass the wide range of interaction of aerosols with clouds, radiation and the hydrological cycle. AIE constitutes the largest source of uncertainty in the assessment of climate sensitivity and anthropogenic climate change [1], and stems from the highly coupled and multiscale interactions of particles with clouds, dynamics and radiation. Limited understanding of these interactions further hinders their correct implementation in models, magnifying the uncertainty and envelope of equifinality in model assessments of AIE [2].
The ability of particles to act as cloud condensation nuclei (CCN) and form cloud droplets depends on their size, chemical composition and morphology. These properties, in turn, are affected by the combination of numerous aerosol sources and processing over their atmospheric lifetime. The activation of particles also requires a sufficient level of water vapor supersaturation. Köhler theory determines the conditions for activating a CCN into droplets through a set of thermodynamic requirements [3]. According to this theory, exposure of a particle to a water vapor supersaturation that exceeds a characteristic (“critical”) level forces the wet CCN to experience unconstrained growth and activate into a cloud droplet. The critical supersaturation, sc, depends on particle size and moles of solute in its aqueous phase.
Supersaturation in clouds is generated when atmospheric airmasses are cooled beyond saturation (usually through expansion cooling in an ascending updraft [4]). The maximum level of supersaturation generated, smax, eventually determines the number of CCN that activate into cloud droplets. It also depends on the airmass cooling rate and aerosol contained within a cloud parcel. State-of-the-art mechanistic cloud droplet parameterizations [5,6,7,8] can readily and accurately estimate the droplet number (Nd) and smax that would form in a cloudy air parcel, provided the aerosol size distribution, chemical composition and updraft velocity are known.
Published work to date suggests that mechanistic parameterizations provide realistic descriptions of cloud droplet formation [7,9,10,11,12] and improve the performance of atmospheric models [13,14,15,16]. However, the underlying physics reflect highly idealized cloud formation conditions; much work remains to evaluate their application in subgrid cloud schemes [17], and understanding the uncertainty associated with their usage in complex boundary layers and cloud types. Furthermore, it is important to understand the underlying drivers of Nd variability (aerosol parameters, dynamics) for a wide range of cloud-forming conditions. In situ data that link aerosols and clouds are critically important for addressing all these issues, with the ultimate goal of reducing the uncertainty behind aerosol-cloud-climate interactions [2].
This study investigates the aerosol-cloud droplet link in a polluted boundary layer, using data collected during the Hygroscopic Aerosols to Cloud Droplets (HygrA-CD) field campaign [18], which took place in Athens, Greece between 15 May and 22 June, 2014. The HygrA-CD is part of the Initial Training on Atmospheric Remote Sensing (ITARS; www.itars.net) project, and combined in situ sampling, remote sensing and modeling to enhance the understanding of aerosol impacts on warm clouds. Here, we analyze data collected during the campaign to understand the drivers of droplet number variability over the atmospheric states sampled.

2. Instrumentation and Methods

2.1. Sampling Site

Sampling and measurements were conducted at the National Center for Scientific Research “Demokritos” station (DEM) at a site 275 m height a.s.l. (37.99° N, 23.82° E), at the municipality of Agia Paraskevi, Attiki. The station is contributing to the Global Atmosphere Watch (GAW) and Aerosol Cloud & Trace gases InfraStructure programs (ACTRIS). The site is a suburban location 7 km from the city center and located at the foothills of Mount Hymettus, in an area surrounded by pine trees approximately 1.5 km away from a highway to the northwest. The closest residences are about 0.5 km away. The sampling location was influenced by aerosol particles (PM) emitted from the city, under southerly and northwesterly wind flow regimes. Details about the metropolitan Athens area can be found in Kanakidou et al. [19], while internal circulation patterns in the urban complex are provided by Melas et al. [20].

2.2. Instrumentation and Models

The instrumentation setup consisted of a Droplet Measurement Technologies (DMT) continuous-flow streamwise thermal-gradient CCN chamber (CFSTGC) [21] and a scanning mobility particle sizer (SMPS) comprised of a TSI Model 3080L electrostatic classifier (TSI Inc., Shoreview, MN, USA) and a condensation particle counter (CPC; TSI Model 3772, TSI Inc., Shoreview, MN, USA) used to measure the dry aerosol size distribution of particles with mobility diameters in the range of 10–550 nm and a time resolution of five minutes. Prior to introduction into the SMPS and CFSTGC, aerosol was dried using a Nafion dryer. During the campaign, the CFSTGC measured CCN of polydisperse aerosol at a flow rate of 0.5 L min−1 and a top-bottom column difference, ΔΤ from 4–15 K, which followed the methodology of Bougiatioti et al. [22]. Total CCN concentrations were measured at 0.2, 0.4, 0.6, 0.8 and 1% supersaturation for 10 min, yielding a CCN spectrum (i.e., CCN concentrations vs. supersaturation) every 50 min.
The AIAS mobile one-wavelength (532 nm) elastic backscatter depolarization lidar system [23] was deployed at DEM to provide information about the dynamic activity of the planetary boundary layer (PBL) (from ~300–1500 m a.s.l.) and to strengthen the link between CCN activity and cloud formation via the observation of the presence or not of PBL clouds [24]. Additionally, the EOLE lidar system [25] was running at the nearby site of the National Technical University of Athens (NTUA) [18] to provide, among other parameters, enhanced information of the PBL structure at 1064 nm, such as the vertical profiles of backscatter and extinction coefficients.
During the reported period of the CCN measurements, the vertical wind distributions over the site required for the droplet number calculations were not directly measured, but computed with the Weather Research and Forecasting-Advanced Research WRF (WRF-ARW) atmospheric modelling system [18,26,27]. Τhree two-way nested domains were used with a horizontal grid resolution of 12 × 12 km for the external grid that covered the European continent, 3 × 3 km for the intermediate domain over central Greece, and 1 × 1 km for the third grid over the greater Athens area (GAA) to resolve the vertical motions over the complex terrain of the GAA close to the cloud formation scale. Initial and boundary conditions were obtained from the National Center for Environmental Prediction final analysis database (NCEP) [28] at 1° × 1° horizontal resolution, and at six-hourly time intervals. The vertical model structure includes 31 terrain-following levels up to 50 hPa.

2.3. Analysis Methodology

Aerosols activate to form droplets in the CFSTGC when the water vapor supersaturation, s, that develops in the instrument growth chamber is above their characteristic “critical supersaturation”, sc. According to Kölher theory, the effects of soluble material on sc is given by a single-parameter description of aerosol hygroscopicity, κ [29],
κ = 4 Α 3 27 d p , c 3 S c 2
where dp,c is the dry particle critical diameter, A = (4Mwσw)/(RTρw), R is the universal gas constant and Mw, σw and ρw are the molar mass, surface tension and density, respectively, of water at the average mid-column temperature, T, in the CFSTGC. The dp,c is obtained by matching the concentration of the activated CCN at a given instrument supersaturation with the integrated SMPS number distribution, starting from the largest available size bin down to lower sizes [30]. This method of determining dp,c operates under the assumption that the aerosols are internally mixed, and is used as all particles with sc below the instrument supersaturation will most likely activate in the instrument’s column. Any fraction of externally mixed particles is expected to contribute only for a limited amount of time during the day (e.g., only during early morning rush hour), but furthermore, any externally mixed non-refractory material is not expected to affect the CCN-active aerosol population [31,32].
The Nd and smax that would potentially form in clouds over the sampling site was calculated with the parameterization framework of Morales and Nenes [8]. In the calculations, the size distribution was obtained directly from the SMPS every four minutes while the updraft velocity was calculated hourly by the WRF model, as described in Section 2.2. It is important to understand the relative contribution of aerosol chemical composition (κ), aerosol number concentration, and updraft velocity variations to the Nd droplet number variation. For this, we carried out a droplet number variance analysis following the approaches of Bougiatioti et al. [33] and Kalkavouras et al. [34], where the sensitivity of Nd to total aerosol number (Na), hygroscopicity (κ) and updraft velocity (w), being ∂Nd/∂Na, ∂Nd/∂κ and ∂Nd/∂w, respectively and the daily variance of each parameter, σΝa, σκ, σw are used to quantify the contribution of each parameter to the daily droplet number variance, σ2Νd:
σ 2 Ν d = ( N d N a ¯ σ Ν α ) 2 + ( N d κ ¯ σ κ ) 2 + ( N d w ¯ σ w ) 2
From Equation (2) and the calculated partial sensitivity of Nd to the total aerosol number, hygroscopicity parameter and updraft velocity, their relative contributions (εNa, εκ and εw, respectively) to the droplet number are estimated by:
ε Χ = ( Ν δ Χ ¯ σ X ) 2 σ 2 Ν d
where Χ is either Na, κ, or w.

3. Results

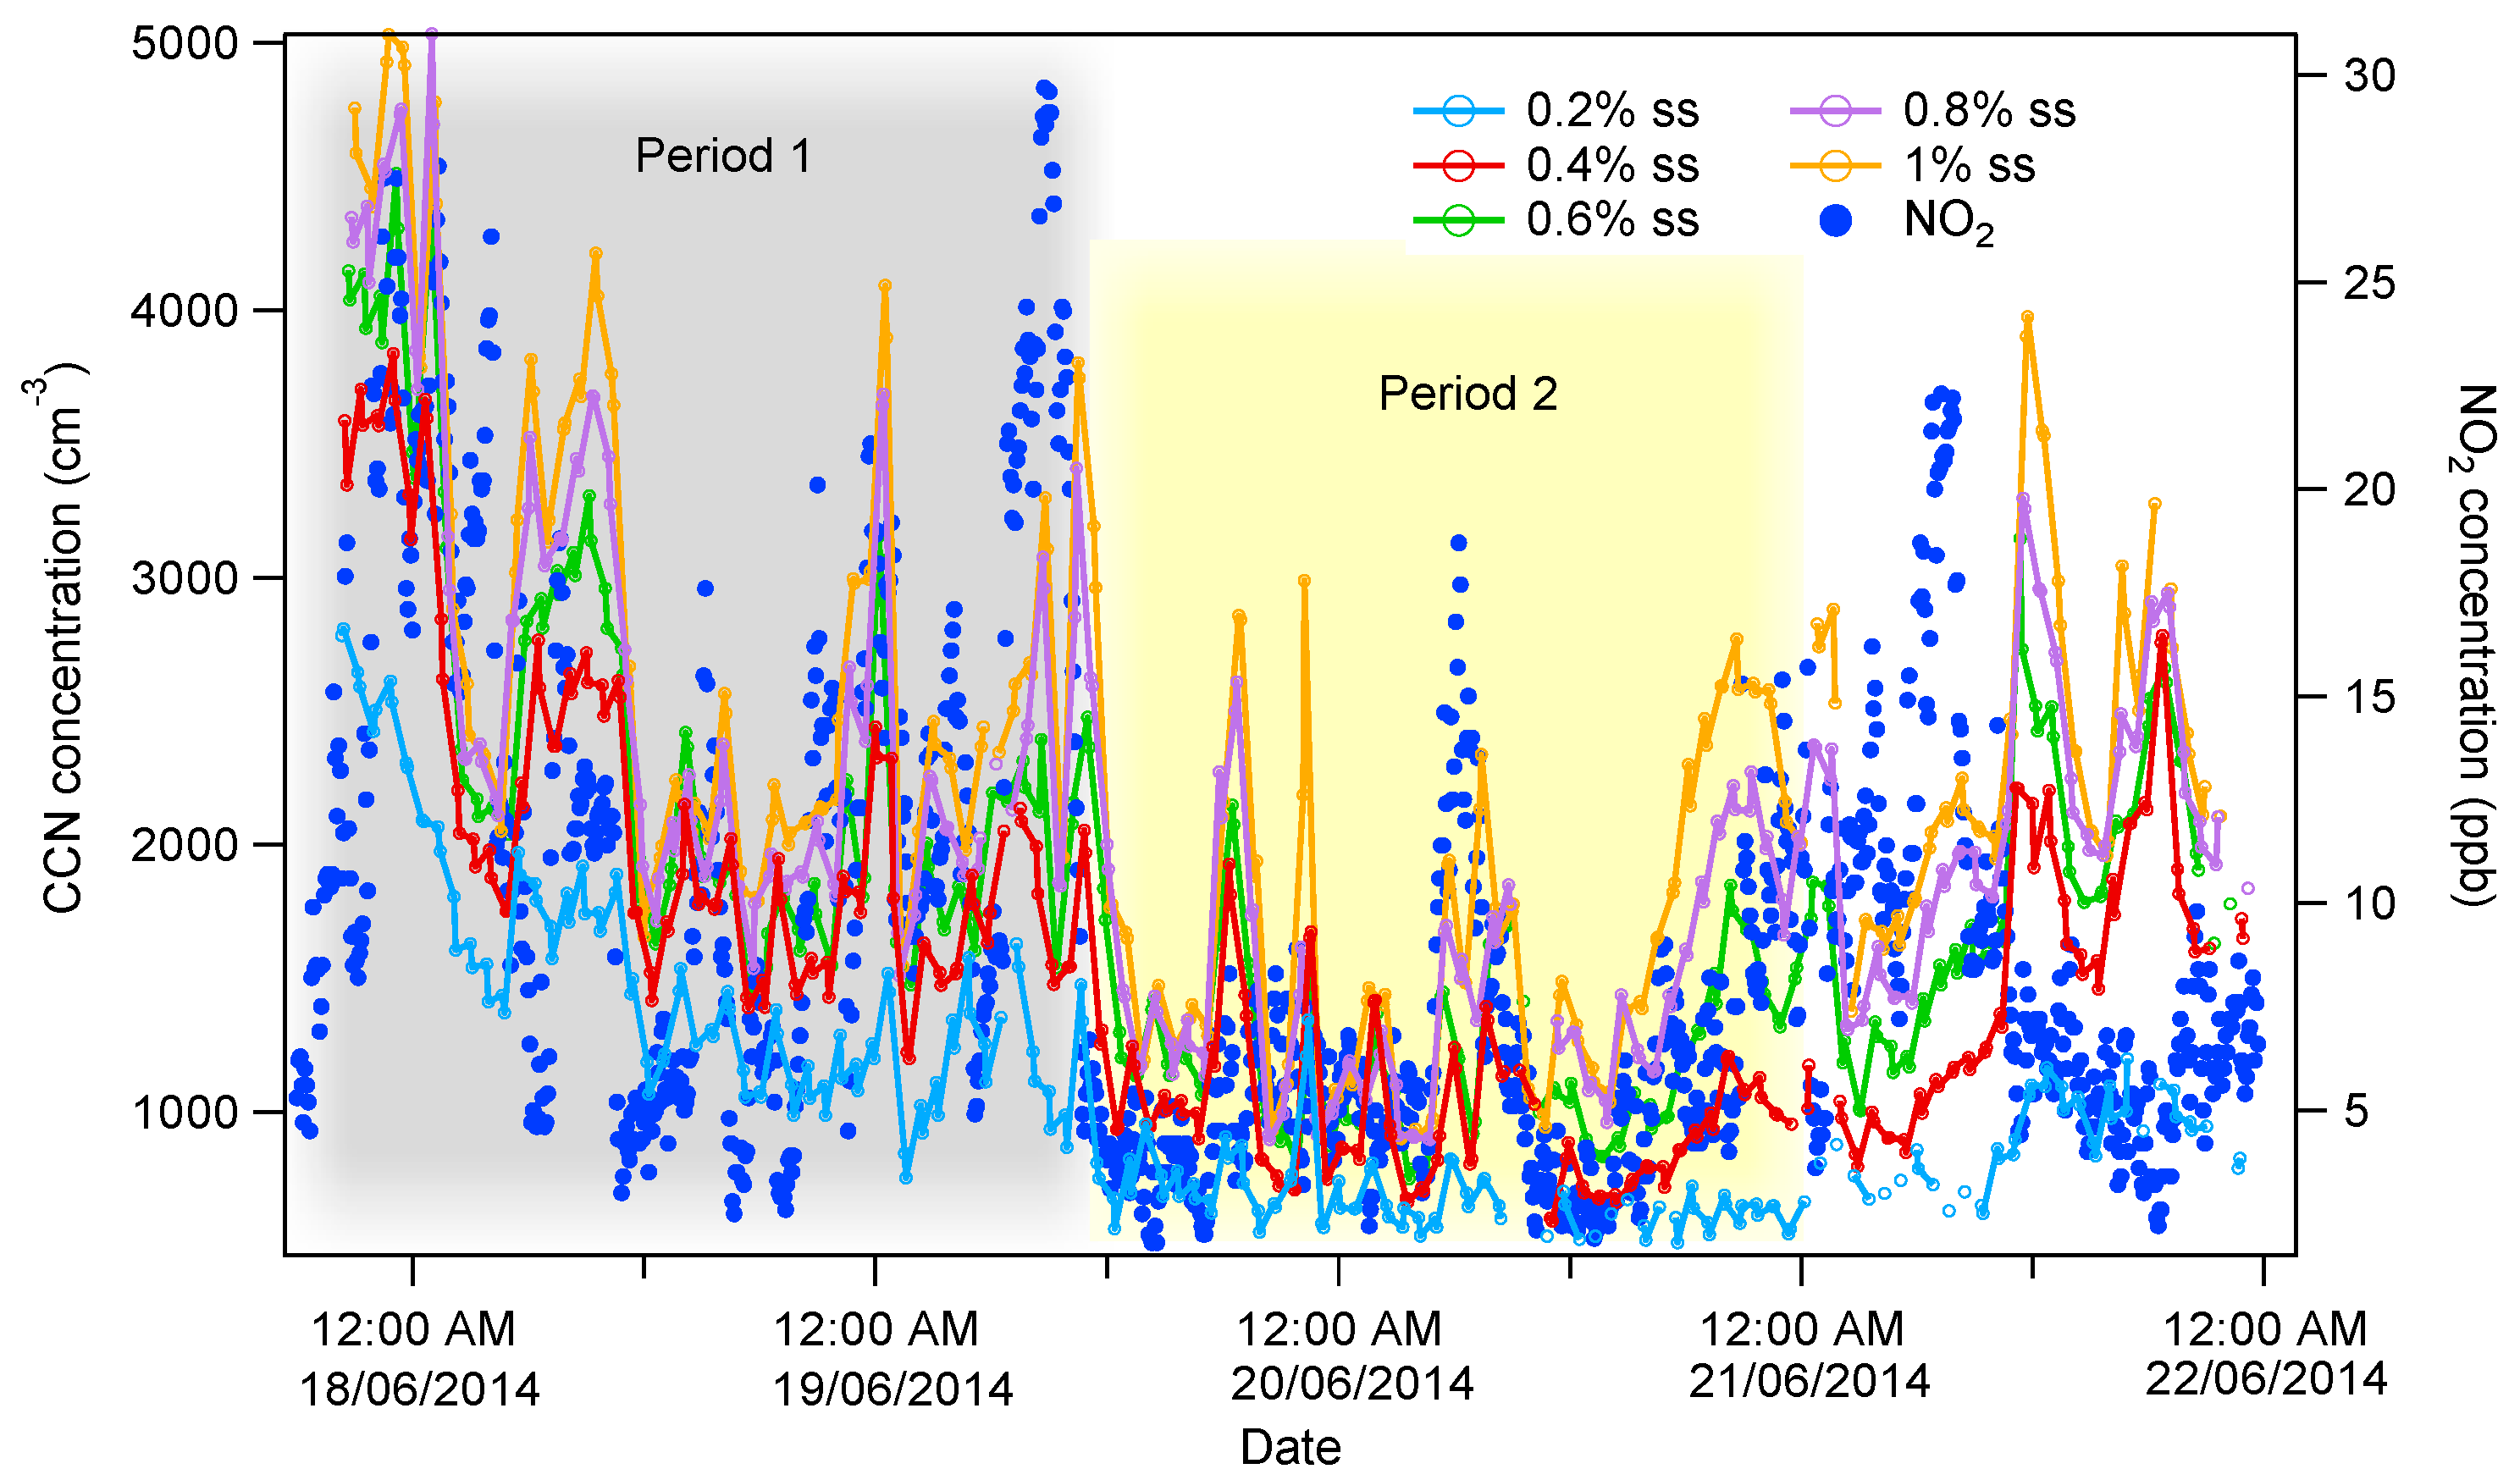
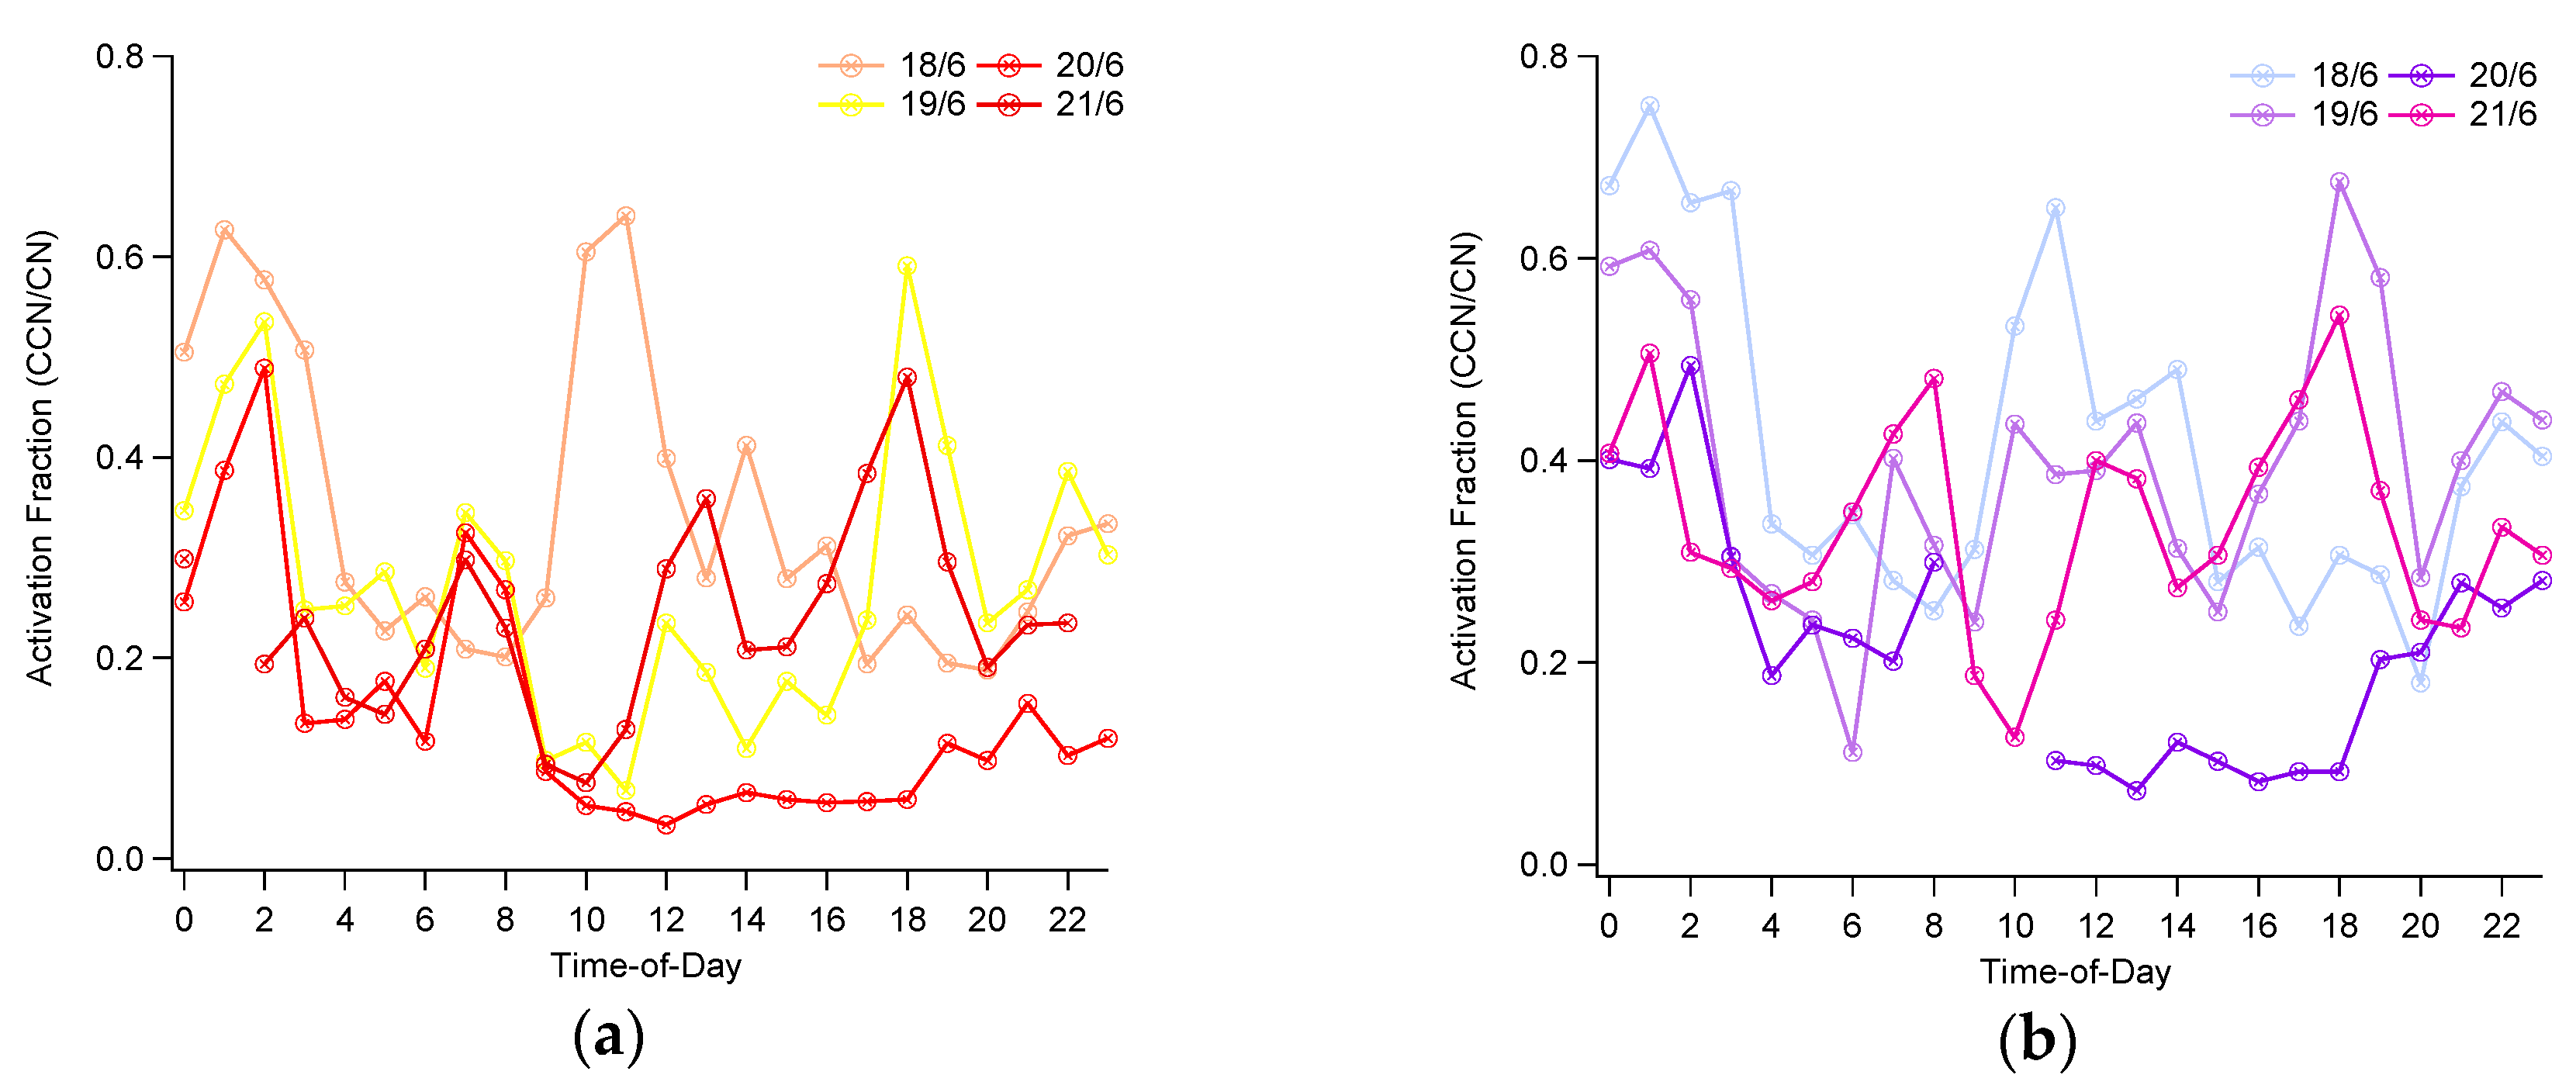
3.1. Aerosol and CCN Measurements

The time series of the observed CCN concentrations are shown in Figure 1, along with the NO2 concentrations. ΝΟ2 was chosen as a reference for local pollution because of its limited atmospheric lifetime from emission (versus other secondary pollutants, e.g., O3) and its high correlation with particulate matter [31]. As expected, CCN concentrations increased with increasing supersaturation. Throughout the measurement period, CCN concentrations at each supersaturation level varied up to a factor of three. The measured CCN at the three highest supersaturations were often very similar, indicating that most CCN are large (larger than 80 nm) and activate at relatively low cloud supersaturations, which is indicative of the high degree of aging for the CCN in the region [33]. The CCN concentration time series can be divided into two periods, based on CCN levels. Period 1 represents the highest concentrations (17, 18, and 19 June), which were concurrent with low wind speeds and a stagnant, capped shallow planetary boundary layer (PBL) [18]. Period 2 (second half of 19 and all of 20 June) was characterized by less stagnation, increased PBL ventilation and a concurrent decrease in PM and CCN concentrations.
During Period 1, the limited ventilation of the PBL “trapped” particles within the boundary layer; the high actinic fluxes (owing to the absence of clouds) tended to accelerate the photochemical aging of particles in a cloudy boundary layer. The aerosol was mostly regional dust that originated from the Sahara [18], and subsequently processed within the PBL (via condensation and coagulation). A detailed analysis on air masses origin and different types of sampled aerosol is provided in [17]. The extent of this processing, which is controlled by local emissions, gave rise to the correlation of NO2 and the presence of large, aged particles that were strongly CCN active. On the other hand, when the high CCN concentrations were associated mostly with local sources and pollution events (as in the second half of 20 June and 21 June), CCN were smaller, less oxidized and high CCN concentrations were observed with a time lag after high local NO2 concentrations, possibly because of direct processing and the atmospheric consumption of NO2.
CCN activity can be represented by the fraction of total aerosol (CN) that act as CCN with supersaturation s, R(s). Here, CN was calculated by the integration of the aerosol number size distribution from the SMPS. The average values of R(s) for the whole measurement period for 0.2, 0.4, 0.6, 0.8 and 1% supersaturation were 0.24 ± 0.13, 0.31 ± 0.14, 0.35 ± 0.15, 0.39 ± 0.16 and 0.43 ± 0.18, respectively. It can be seen that, on average, only ~40% of the aerosol acted as CCN at ~0.8% supersaturation. Accumulation mode particles can result from the condensation of gaseous components such as sulfate, nitrate and organics, and the coagulation of smaller particles, with particles often larger than 100 nm being more aged and processed. When a separate mode is seen above 80–100 nm, it is typically associated with a cloud-processed mode [33,35,36]. With an average maximum cloud supersaturation of ~0.09% during Period 1 (see Section 4), it is concluded that cloud processing could influence particles with sc below 0.09%, or with size dp,c above ~120 nm; indeed, during Period 1, where there was a separate mode in that size range (95–130 nm), peaking at 110 nm (Supplementary Material, Figure S1a,b), and particles originated from long-range transport, cloud processing was likely an important process of aerosol aging that shaped the CCN distributions. Large dust particles aloft also provided an extensive condensation sink, which reduced the chances of new particle formation [37,38] despite considerable local emissions, and was supported by the correlation of NO2 with PM but not necessarily the aerosol/CCN number.
During Period 2, where particles were significantly smaller (compared to Period 1), aerosol may have been a mixture of freshly emitted particles and secondary particles formed from primary emissions with condensation of gaseous components during atmospheric processing. Based on the study of [39] conducted at the same site and during a similar time period of the year, fine aerosol is mostly composed of organics and ammonium sulfate, with the organic aerosol being mostly oxygenated (65%), including one very oxygenated and a moderately oxygenated factor indicative of the different degrees of atmospheric processing, while primary sources contribute 35% [39]. The diurnal profile of R(s) supports this; especially during Period 2 it exhibited higher values during nighttime and lower values around local noon, with values being substantially lower than unity (Figure 2). The higher ratios during nighttime were likely reflective of the atmospheric aging (through condensation/coagulation and cloud processing) of small, less CCN-active aerosol directly emitted from new particle formation events. Mixing of free tropospheric air containing aerosol that is too small to act as an efficient CCN can also occur during daytime. This aerosol also aged and grew subsequently in the PBL; however, the lack of large particles aloft suggests that the condensation sink provided by the additional particles may not have been enough to mitigate new particle formation [31]. Studies carried out in other urban environments [31,38] support these conclusions.

3.2. Aerosol Hygroscopicity

Based on the methodology described in Section 2.3, the hygroscopicity parameter, κ, was calculated for all supersaturation levels. The derived median values obtained for 0.2, 0.4, 0.6, 0.8 and 1% supersaturation were 0.36, 0.19, 0.13, 0.1 and 0.09, respectively. Values of the hygroscopicity parameters for the different days are summarized in Table 1. Larger submicron particles tend to be the most processed (aged), and contain larger fractions of inorganic salts owing to cloud processing. The 0.36 value is very close to the proposed continental average of 0.3 [40,41], and reflects the highly aged nature of the particles. Smaller particles (κ at higher supersaturations) are increasingly less hygroscopic, likely from a larger organic mass fraction and externally mixed low-hygroscopicity (freshly formed) particles [40]. The combination of the analysis of the activation fraction distributions for a given level of supersaturation indicates that the hygroscopicity tends to increase with particle size, but particles exhibit a variable degree of external mixing when multiple sources of particles characteristic of urban environments are present [31,38].
As supersaturation increases, the activation diameter decreases and smaller particles containing larger amounts of less CCN-active material (e.g., organics, soot) and less inorganic salts start to activate. Smaller particles often consist mainly of organics [33], and the obtained κ values are close to the typical values found for oxidized organics [42,43,44]. As seen before, cloud processing can also impact on aerosol processing when particles are in the range of 130 nm. With critical diameters, dp,c, larger than 120 nm for the lowest supersaturation level being limited, and those found only during Period 1 where the aerosol had dust influence and was subject to long-range transport, it is most probable that most of the time, the aging of particles is due to oxidation and condensation [39]. Even though dust-laden air masses are expected to influence mostly coarse mode particles, it has been reported that in the area, even in ultrafine particles (0.041–0.225 μm aerodynamic diameter), mineral dust can account for up to 18% of the total mass of the mode [45,46]. Therefore the larger, more hygroscopic particles are most probably regional, as they contained large amounts of condensed material that was not locally produced (e.g., during cloud processing). For particles smaller than 80 nm, the condensation of oxidized organics and secondary organic aerosol (SOA) can explain the gradual change of the hygroscopicity from 0.1 to 0.36, with decreasing supersaturation (and increasing particle critical diameter).

4. Discussion

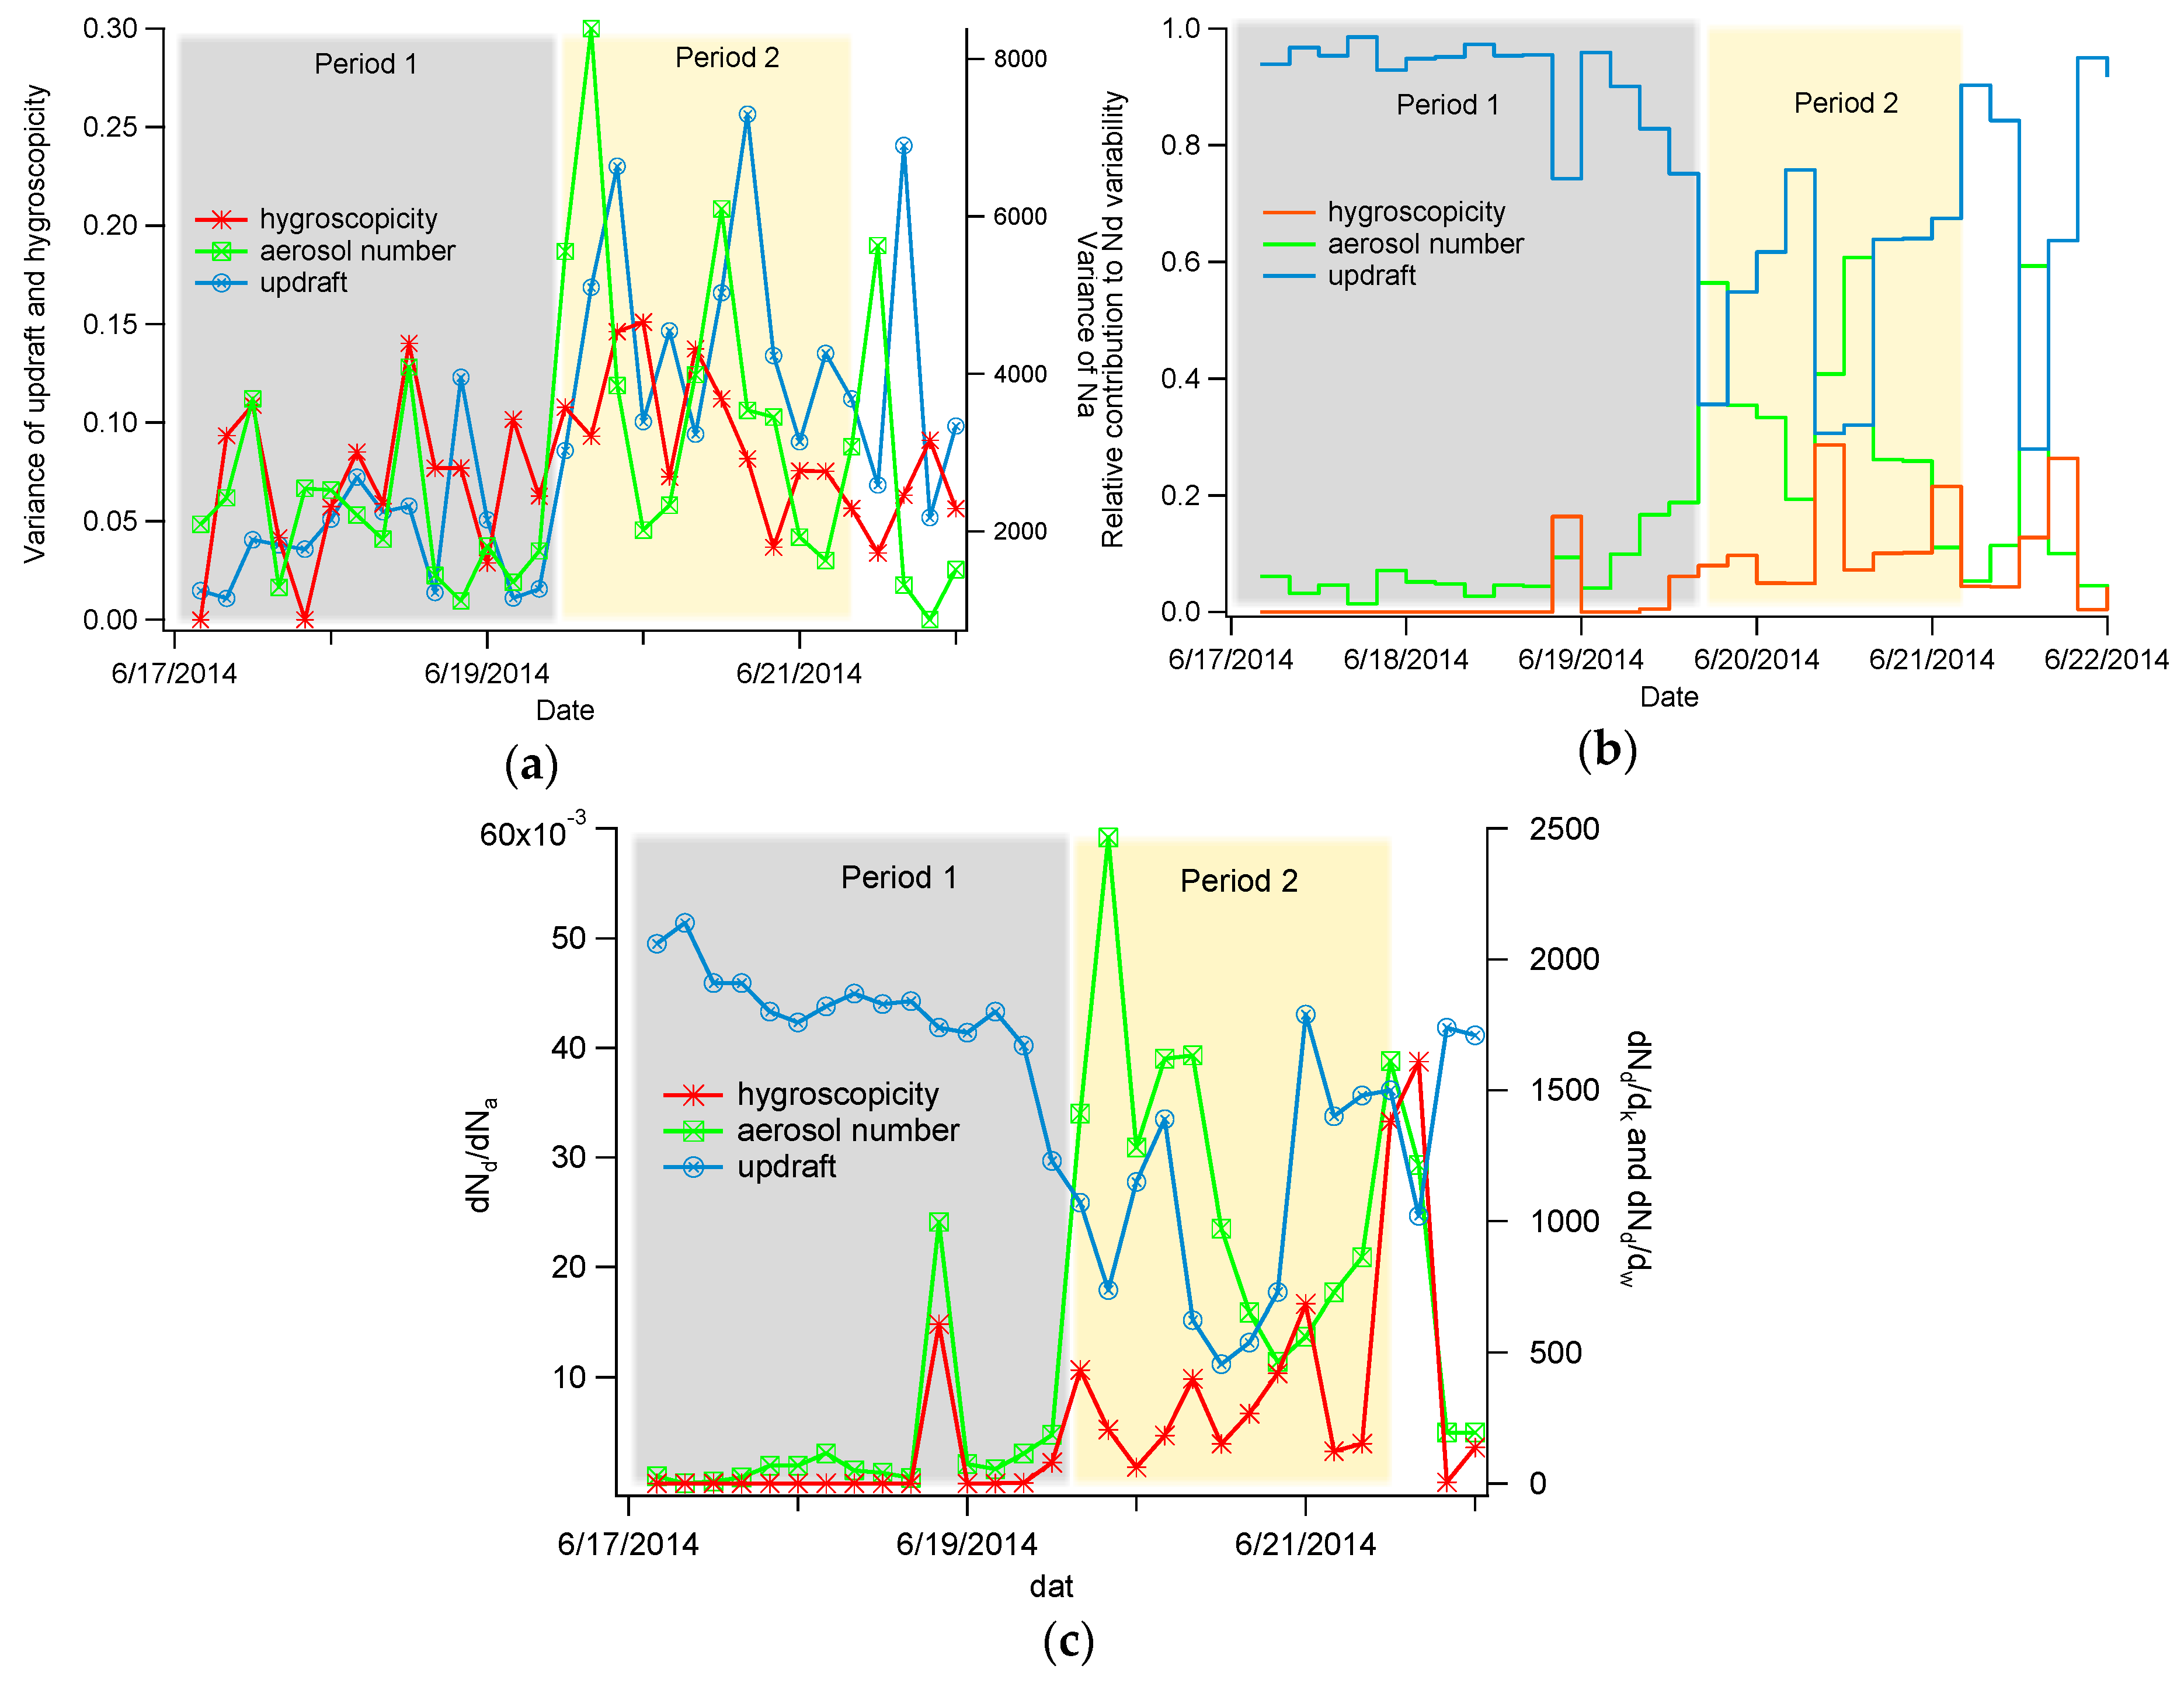
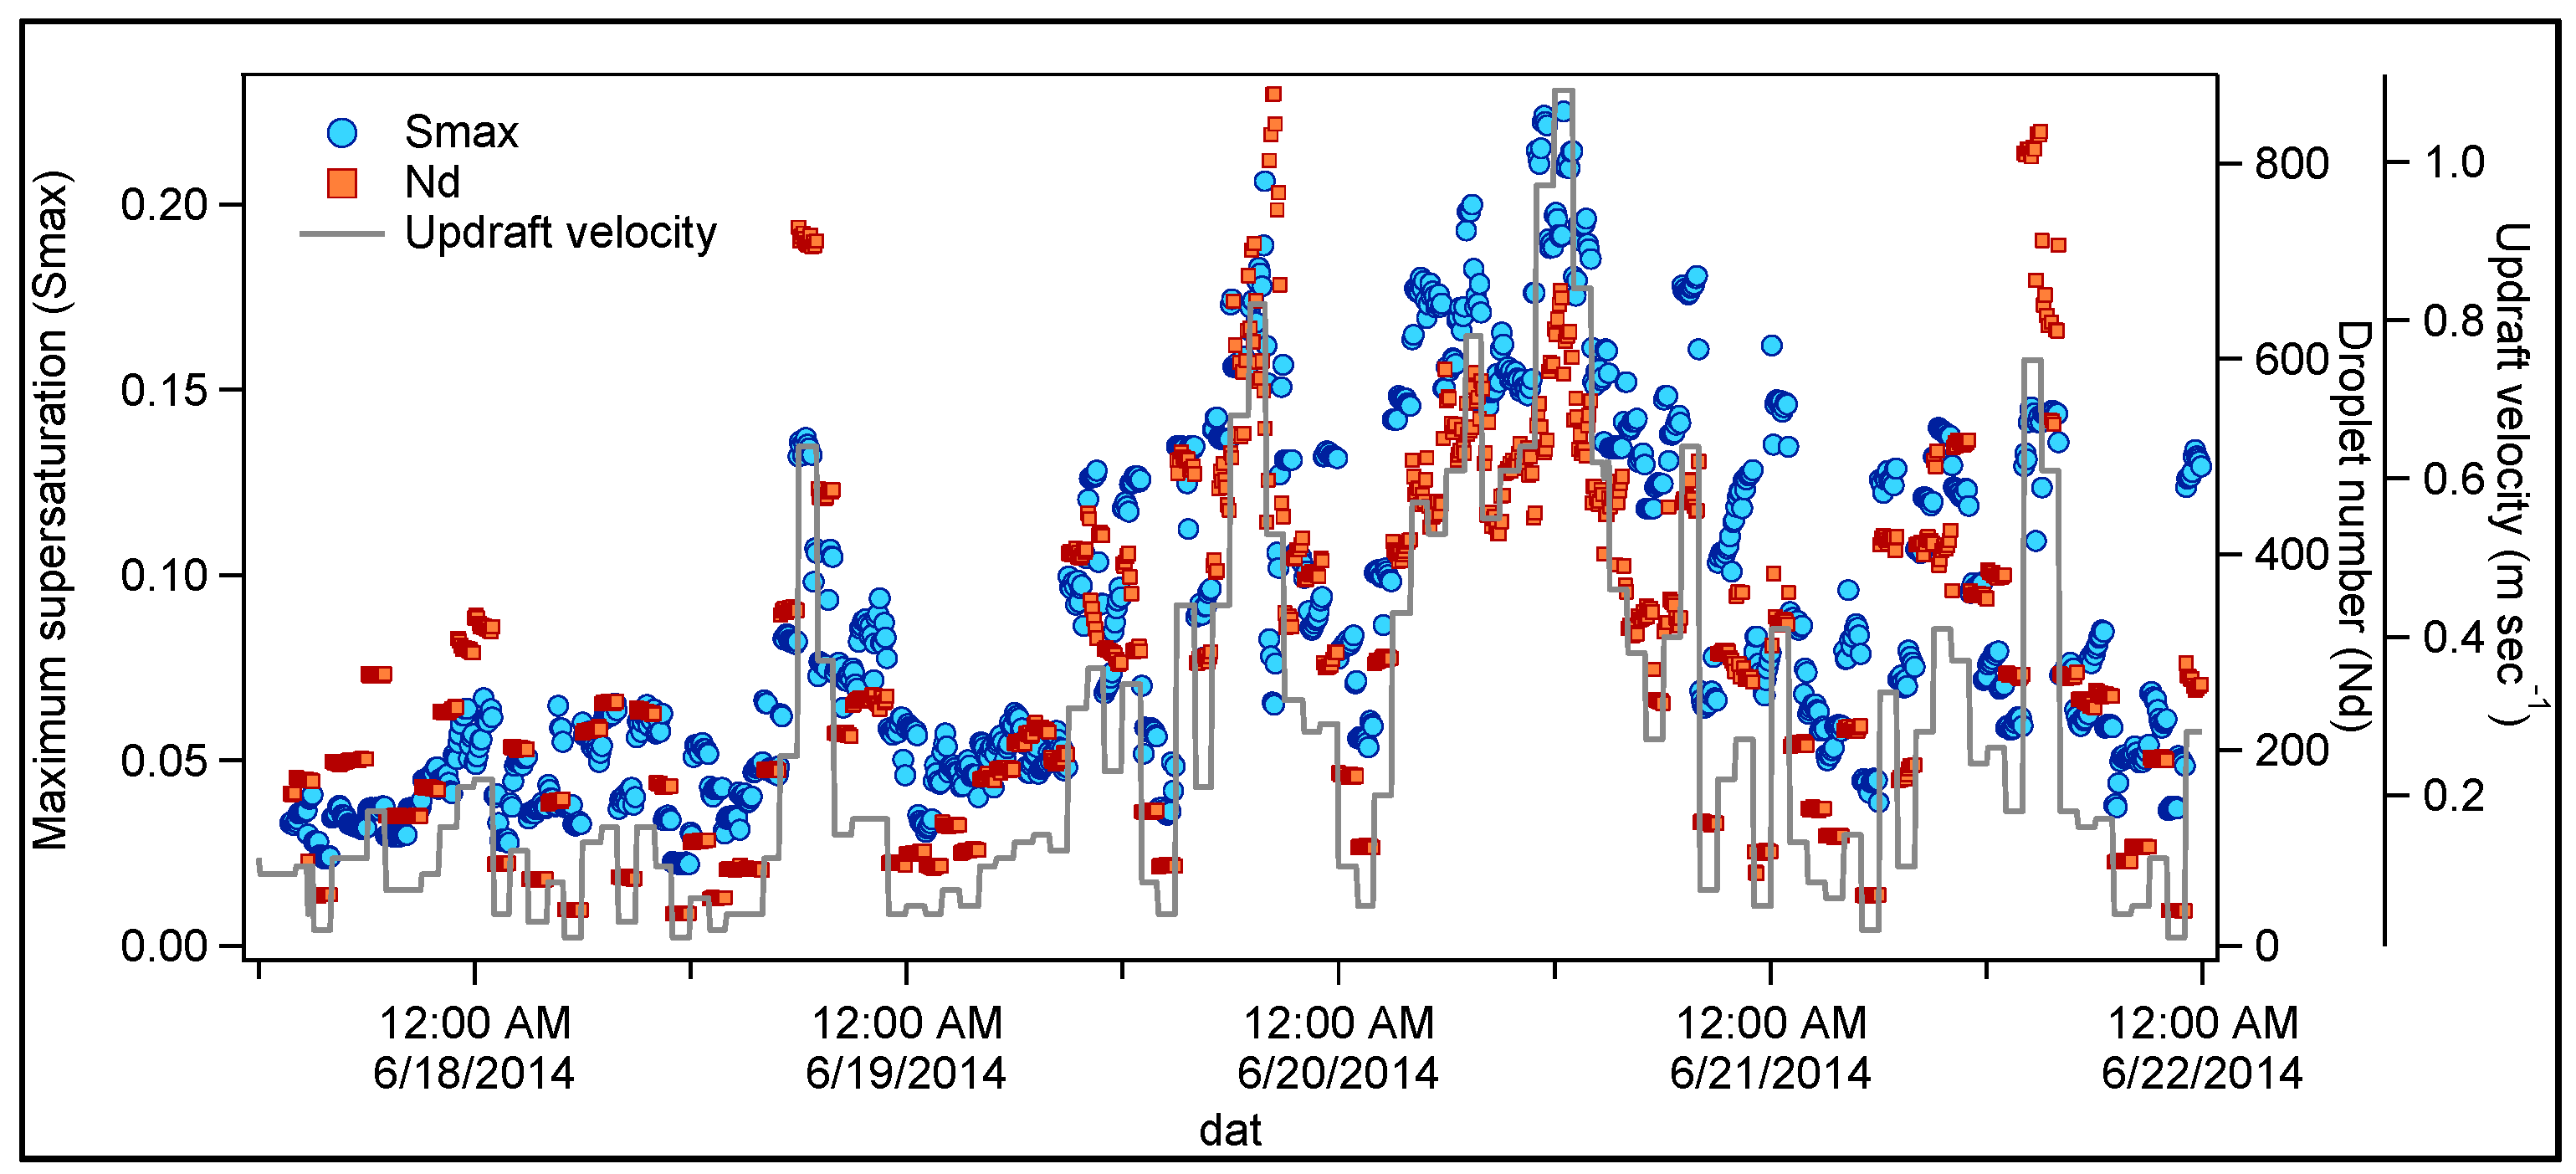
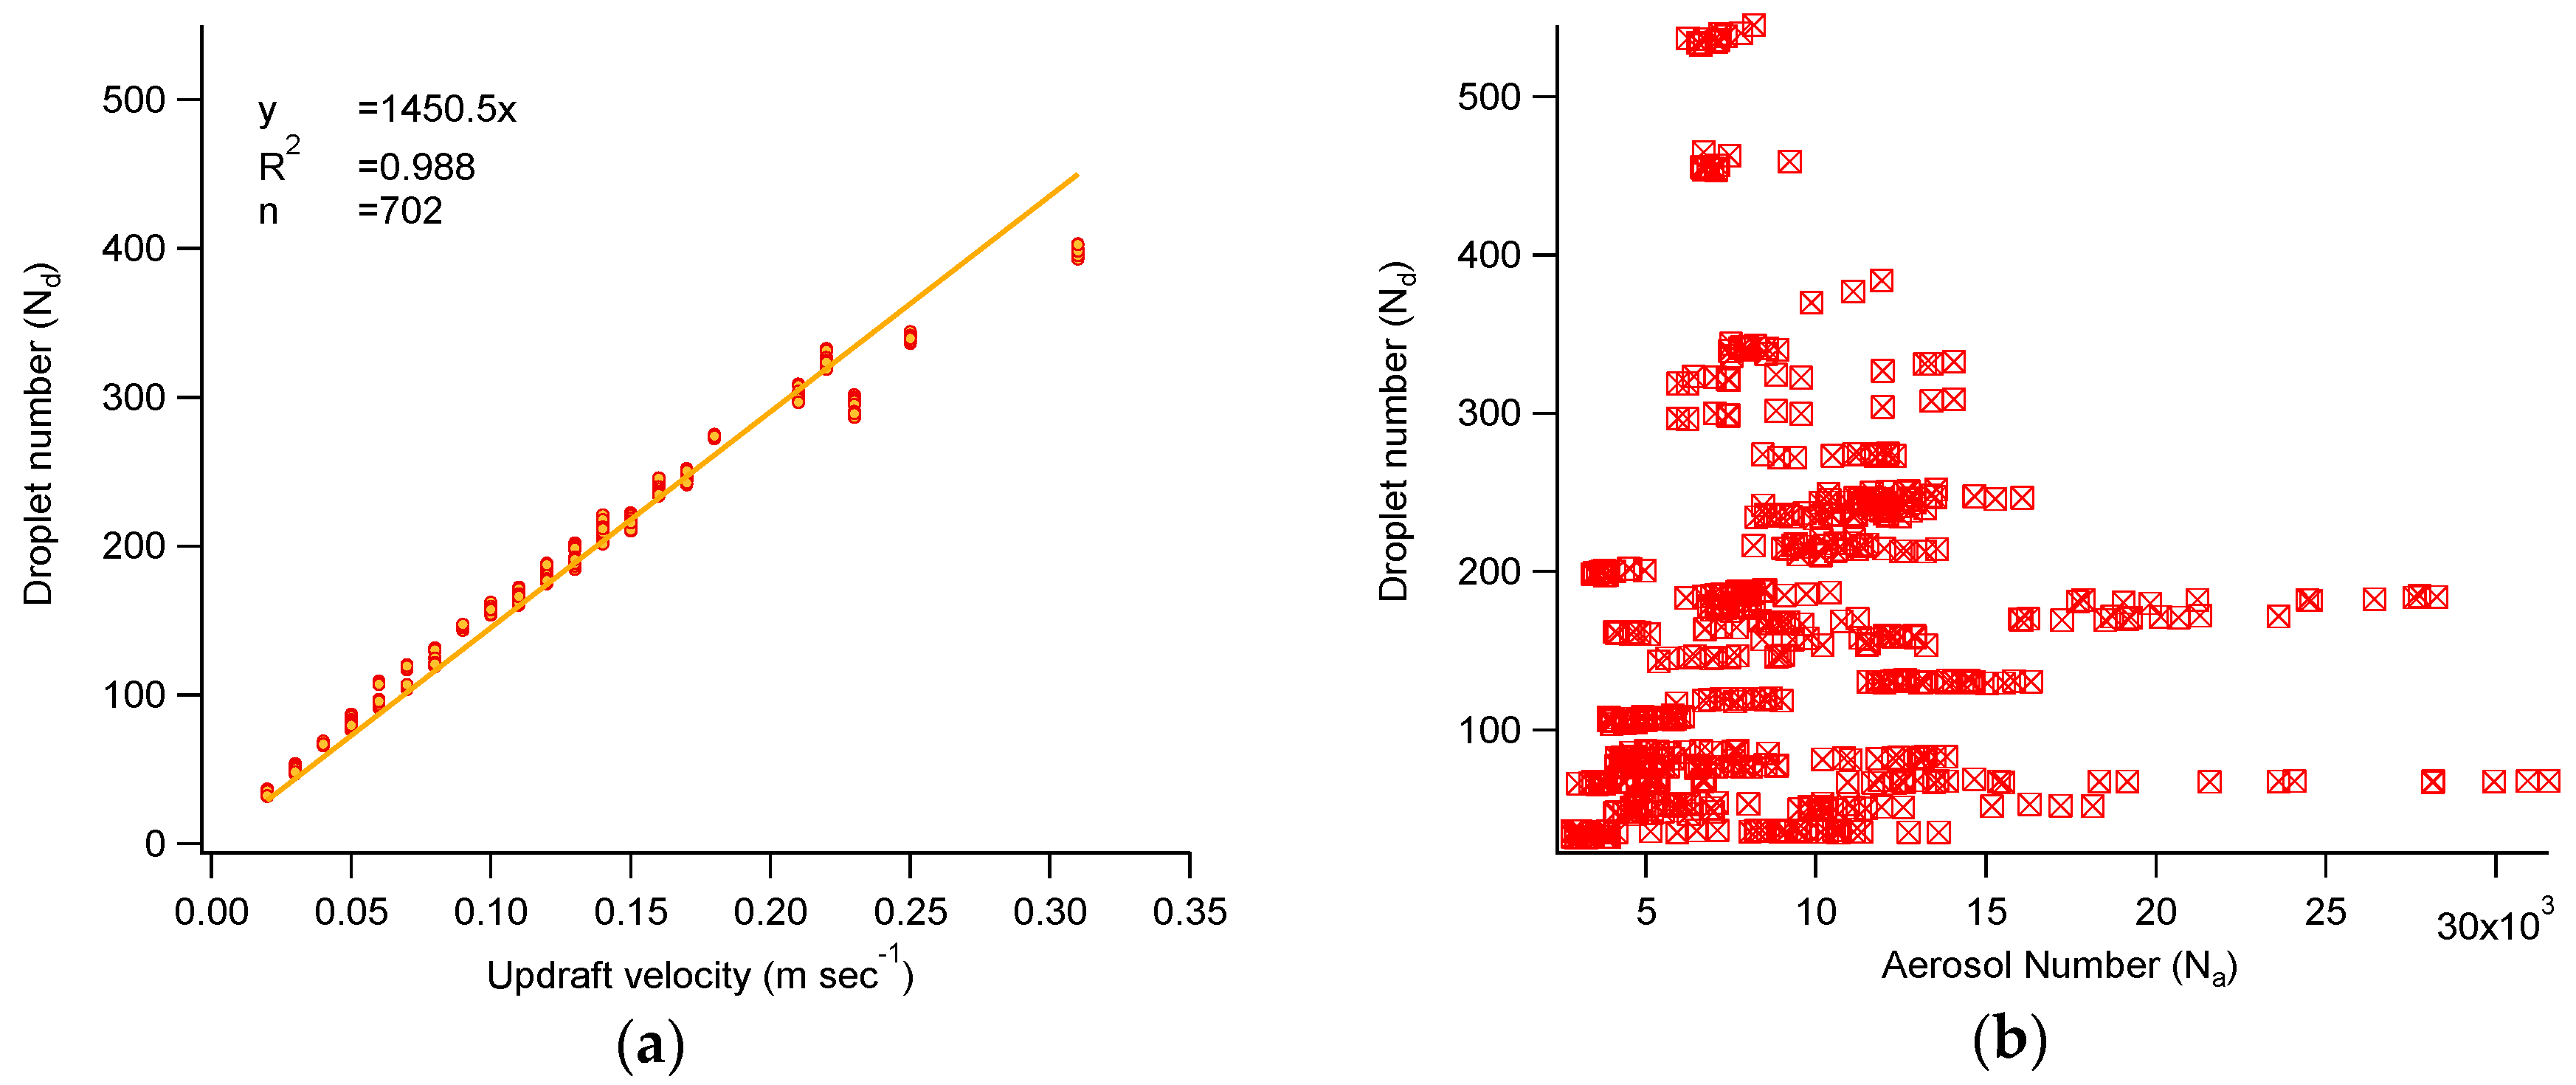
Impact on Droplet Number and Cloud Formation

Based on the methodology developed in Section 2.3, we calculated the maximum supersaturation (smax) that would form in a cloud, given the knowledge of the aerosol number size distribution, chemical composition and updraft velocity; the number of droplets (Nd) that are formed under these conditions is then given by the CCN concentration at smax. Figure 3 represents the calculated time series of smax and Nd with respect to the estimated updraft velocity. It can be seen that the droplet number correlates with the updraft velocity very well. When taking into account the CCN time series (Figure 1), smax is negatively correlated, owing to the increased competition for water vapor when CCN concentrations increase. During Period 1, when CCN concentrations were the highest, updraft velocities remained very low (owing to stagnant PBL conditions) and particles strongly competed for water vapor. Therefore, the potential smax was very low, below 0.05%, keeping the potential Nd at relatively low levels (100–200) and shifting the size of particles affected by cloud processing to large sizes (>155 nm). This level of supersaturation is extremely low, implying that the clouds forming may have been fogs, which can be indistinguishable from haze (as the growth rates of droplets at such supersaturation are very low) [47]. Therefore, even if aerosol concentrations may be high and vary substantially, this variability will not reflect on the Nd timeseries, as its sensitivity to aerosol is very low (see the estimated contribution of Na to Nd variance of 6–12% in Figure 4c). Fluctuations in aerosol and CCN concentrations may also be partially affected by boundary layer height variability; nevertheless, in an urban environment such as Athens, emissions from local sources and their atmospheric processing are mostly responsible for the observed concentrations [39]. These findings are in accordance with recent studies where new particle formation and biomass burning events were augmented by 87% or higher, but led to only a 12% (or less) increase in Nd [31,32]. During Period 2, total aerosol and CCN concentrations were lower, which as expected leads to higher maximum supersaturation levels (around 0.18%). Despite the lower CCN levels, cloud updraft velocities were elevated, eventually yielding higher levels of estimated Nd, compared to Period 1 (Figure 3). The respective sensitivity of Nd to aerosol is much higher (Figure 4c).
The smax levels computed for each period provide conclusions that are consistent with remote sensing observations. The EOLE Raman lidar (1064 nm) for Period 1 did not detect the formation of any clouds (Figure 5a), consistent with the extremely low values of smax and vertical velocity that would develop in any cloudy parcels. The absence of any clouds and the specific conditions during each period are also presented in detail by Papayannis et al. [18]. On Jun 20, EOLE detected a deep PBL, updraft velocities were considerably higher, especially during early morning hours, and RH levels were much higher than during Period 1. These meteorological conditions are more favorable for the formation of clouds, which was detected by the Raman lidar on the top of the PBL during early morning (Figure 4b), and even lead to a limited precipitation event after local noon. For that day, the higher maximum supersaturation led to estimated droplet numbers that were three-fold higher, compared to those on June 18.
The seemingly counterintuitive finding that less polluted clouds (Period 2) exhibit higher Nd than in more polluted conditions (Period 1) illustrates the need to understand the contributions of both dynamics and aerosol effects on droplet formation as they covary between atmospheric states. By calculating the relative contribution of the total aerosol number, hygroscopicity and updraft velocity to the droplet number (Figure 4b), it is shown that, on average, the highest contribution to the variance of Nd is attributed to the updraft velocity variability (εw~68.6% on average), followed by the variance in aerosol number (εNa~23.2% on average) and to a lesser extent the chemical composition (εκ~8% on average). Furthermore, during Period 1, where the relative dispersion of Nd was high (σ(Nd)/Nd = 0.71 ± 0.09) and the variability of the total aerosol number was low, the variance of the updraft velocity was almost entirely responsible for the variance in droplet number (εw~86.5% from w vs. 10.7% contribution of Na; Figure 4b). For Period 1, Nd and σw have an excellent correlation (Figure 6a; R2 = 0.99), which is not seen in the Nd vs. Na correlation (Figure 6b). This further supports the finding that droplet number variability mostly reflects vertical velocity variability in environments with very high aerosol numbers. Given this, the temporal variability in Nd (from in situ or remote-sensing data) can be used as a direct measure of average updraft velocity. Furthermore, for turbulent boundary layers, the hourly average vertical velocity is very close to the “characteristic” velocity, w*, for the average droplet number over a Gaussian distribution of vertical velocities, which in turn is directly related to the boundary layer turbulent kinetic energy (TKE) and subgrid velocity variance, σw, as w* ~0.8 σw [17]. This means that the droplet number variability directly reflects the turbulent structure of the PBL and is not modulated by aerosol variations when the latter are at high enough concentrations, such as during Period 1. Observations before Period 1 during HygrA-CD support this [24].
The contribution of parameters to Nd during Period 2 was very different from Period 1. The relative dispersion of the droplet number was about 50% (σ(Nd)/Nd = 0.43 ± 0.03); given the high variability of the total aerosol number (σ(Na)/ Na = 0.65 ± 0.02) and non-negligible sensitivity of Nd to Na, the contribution of the updraft velocity to the variance of Nd is still high (60%) but considerably affected by Na (28.4%) and hygroscopicity (11.5%). Furthermore, the correlation between updraft velocity and droplet number is considerably limited (R2 < 0.4) when compared to Period 1. This means that mapping Nd variability may not necessarily directly reflect the turbulent structure in the PBL, but could be significantly modulated by pollution plumes throughout the urban environment. However, if one does have vertical velocity variations (from remote sensing) available, then it would be possible to define regions within the Planetary Boundary Layher (PBL) where clouds are mostly affected by aerosol variations and vice versa.

5. Summary and Conclusions

The international measurement campaign HygrA-CD, which was conducted in the greater Athens area during early summer 2014, aimed to study the impact of aerosol physico-chemical properties on cloud formation. Overall, it demonstrated the importance of the covariation of aerosol and dynamics in the formation of clouds within the boundary layer. More specifically, the combination of CCN measurements with remote sensing retrievals of aerosol size distribution showed that CCN concentrations are higher when the PBL height is lower, as the latter leads to a limited ventilation and dispersion of the locally produced aerosol aloft. Inversely, when the PBL is higher, CCN concentrations tend to decrease.
During the measurement period, mineral dust-laden regional aerosol containing more and larger particles appeared to be more hygroscopic, while locally produced aerosol with smaller critical diameters was less hygroscopic. CCN activation fractions generally exhibited a diurnal cycle, with higher values during nighttime and lower during daytime, which can be attributed to the subsidence of air masses containing aged particles from aloft inside the mixing layer during night.
Based on the aerosol size distribution, the chemical composition and updraft velocity variations, the droplet number and maximum supersaturation for clouds forming over the site were calculated. Despite the large variability in aerosol number concentrations and CCN during the measurement period, the variability in cloud droplet number was mostly associated with variations in cloud-scale updraft velocities. Especially when updraft velocities are low, the excellent correlation between the estimated droplet number and the updraft velocity can potentially be used for the estimation of vertical wind profiles when such remote sensing data are not available. Aerosol number, chemical composition and atmospheric processing, which impact the particle size, also influence the cloud droplet number, but to a lesser extent, with this influence becoming more important when updraft velocities are higher. This leads to the conclusion that during early summer, for non-convective updraft regimes, the greater Athens area is a vertical-velocity limited environment for cloud droplet formation.

Supplementary Materials

Supplementary materials can be found at https://www.mdpi.com/2073-4433/8/6/108/s1.

Acknowledgments

Athanasios Nenes acknowledges support from a Cullen-Peck faculty Fellowship, a Georgia Power Faculty Chair, and Johnson Faculty Fellow funds. We also acknowledge support by the European Union Seventh Framework Programme (FP7/2007–2013): People, ITN Marie Curie Actions Programme (2012–2016) in the frame of ITARS under Grant Agreement n° 289923. The financial support for EARLINET in the ACTRIS Research Infrastructure Project by the European Union’s Horizon 2020 Research and Innovation Programme, under Grant Agreement n° 654169 is gratefully acknowledged.

Author Contributions

A.B. performed the CCN measurements and together with A.N. conceived the analysis, interpretation of the data and wrote this publication; A.A. performed the collocated lidar measurements and provided input for the comparison of the sensitivity of Nd to the different parameters; S.S. computed the updraft velocities used in the calculations with the WRF-ARW atmospheric modeling system; S.V. provided the aerosol size distribution measurements for the calculation of the critical diameter; K.E. and A.P conceived and designed the measurement campaign; A.N. provided the CCN instrument and the modeling tools.

Conflicts of Interest

The authors declare no conflict of interest.

References

  1. Intergovernmental Panel on Climate Change. Climate Change 2013: The Physical Science Basis, Contribution of Working Group i to The Fifth Assessment Report of the Intergovernmental Panel on Climate Change; Stocker, T.F., Qin, D., Plattner, G.K., Tignor, M., Allen, S.K., Boschung, J., Nauels, A., Xia, Y., Bex, V., Midgley, P.M., Eds.; Cambridge University Press: Cambridge, UK; New York, NY, USA, 2013; p. 1535. [Google Scholar]
  2. Seinfeld, J.H.; Bretherton, C.; Carslaw, K.S.; Coe, H.; DeMott, P.J.; Dunlea, E.J.; Feingold, G.; Ghan, S.; Guenther, A.B.; Kahn, R.; et al. Improving our fundamental understanding of the role of aerosol-cloud interactions in the climate system. PNAS 2016, 113, 5781–5790. [Google Scholar] [CrossRef] [PubMed]
  3. Köhler, H. The nucleus in the growth of hygroscopic droplets. T. Faraday Soc. 1936, 32, 1152. [Google Scholar] [CrossRef]
  4. Seinfeld, J.H.; Pandis, S.N. Atmospheric Chemistry and Physics: From Air Pollution to Climate Change; Wiley: Hoboken, NJ, USA, 1998. [Google Scholar]
  5. Nenes, A.; Seinfeld, J.H. Parameterization of cloud droplet formation in global climate models. J. Geophys. Res. 2003, 108. [Google Scholar] [CrossRef]
  6. Barahona, D.; West, R.E.L.; Stier, P.; Romakkaniemi, S.; Kokkola, H.; Nenes, A. Comprehensively Accounting for the Effect of Giant CCN in Cloud Activation Parameterizations. Atmos. Chem. Phys. 2010, 10, 2467–2473. [Google Scholar] [CrossRef]
  7. Ghan, S.J.; Abdul-Razzak, H.; Nenes, A.; Ming, Y.; Liu, X.; Ovchinnikov, M.; Shipway, B.; Meskhidze, N.; Xu, J.; Shi, X. Droplet Nucleation: Physically-based Parameterization and Comparative Evaluation. J. Adv. Model. Earth Syst. 2011, 3. [Google Scholar] [CrossRef]
  8. Morales Betancourt, R.; Nenes, A. Droplet Activation Parameterization: The population splitting concept revisited. Geosci. Mod. Dev. 2014, 7, 2345–2357. [Google Scholar] [CrossRef]
  9. Meskhidze, N.; Nenes, A.; Conant, W.C.; Seinfeld, J.H. Evaluation of a new cloud droplet activation parameterization with in situ data from CRYSTAL-FACE and CSTRIPE. J. Geophys. Res. 2005, 110, D16202. [Google Scholar] [CrossRef]
  10. Fountoukis, C.; Nenes, A.; Meskhidze, N.; Bahreini, R.; Brechtel, F.; Conant, W.C.; Jonsson, H.; Murphy, S.; Sorooshian, A.; Varutbangkul, V.; et al. Aerosol–cloud drop concentration closure for clouds sampled during ICARTT. J. Geophys. Res. 2007, 112, D10S30. [Google Scholar]
  11. Morales, R.; Nenes, A.; Jonsson, H.; Flagan, R.C.; Seinfeld, J.H. Evaluation of a diabatic droplet activation parameterization using in-situ cloud data. J. Geophys. Res. 2011, 116, D15205. [Google Scholar] [CrossRef]
  12. Hoyle, C.R.; Webster, C.S.; Rieder, H.E.; Nenes, A.; Hammer, E.; Herrmann, E.; Gysel, M.; Bukowiecki, N.; Weingartner, E.; Steinbacher, M.; et al. Chemical and physical influences on aerosol activation in liquid clouds: a study based on observations from the Jungfraujoch, Switzerland. Atmos. Chem. Phys. 2016, 16, 4043–4061. [Google Scholar] [CrossRef]
  13. Solomos, S.; Kallos, G.; Kushta, J.; Astitha, M.; Tremback, C.; Nenes, A.; Levin, Z. An integrated modeling study on the effects of mineral dust and sea salt particles on clouds and precipitation. Atmos. Chem. Phys. 2011, 11, 873–892. [Google Scholar] [CrossRef]
  14. Sud, Y.C.; Lee, D.; Oreopoulos, L.; Barahona, D.; Nenes, A.; Suarez, M.J. Performance of McRAS-AC in the GEOS-5 AGCM: Aerosol-cloud-microphysics, precipitation, cloud radiative effects, and circulation. Geosci. Mod. Dev. 2013, 6, 57–79. [Google Scholar] [CrossRef]
  15. Barahona, D.; Molod, A.; Bacmeister, J.; Nenes, A.; Gettelman, A.; Morrison, H.; Phillips, V.; Eichmann, A. Development of Two-Moment Cloud Microphysics for Liquid and Ice within the NASA Goddard Earth Observing System Model (GEOS-5). Geosci. Mod. Dev. 2014, 7, 1733–1766. [Google Scholar] [CrossRef]
  16. Zhang, Y.; Zhang, X.; Wang, K.; He, J.; Fan, J.; Leung, L.R.; Nenes, A. Incorporating an advanced aerosol activation parameterization into WRF-CAM5: Model evaluation and parameterization intercomparison. J. Geophys. Res. 2015, 120. [Google Scholar] [CrossRef]
  17. Morales, R.; Nenes, A. Characteristic updrafts for computing distribution-averaged cloud droplet number, autoconversion rate effective radius. J. Geophys. Res. 2010, 115, D18220. [Google Scholar] [CrossRef]
  18. Papayannis, A.; Argyrouli, A.; Bougiatioti, A.; Remoundaki, E.; Vratolis, S.; Nenes, A.; Solomos, S.; Komppula, M.; Giannakaki, E.; Kalogiros, J.; et al. An overview from hygroscopic aerosols to cloud droplets: The HygrA-CD campaign in the Athens basin. Sci. Total Environ. 2017, 574, 216–233. [Google Scholar] [CrossRef] [PubMed]
  19. Kanakidou, M.; Mihalopoulos, N.; Kindap, T.; Im, U.; Vrekoussis, M.; Gerasopoulos, E.; Dermitzaki, E.; Unal, A.; Kocak, M.; Markakis, K.; et al. Megacities as hot spots of air pollution in the East Mediterranean. Atmos. Environ. 2011, 45, 1223–1235. [Google Scholar] [CrossRef]
  20. Melas, D.; Ziomas, I.; Klemm, O.; Zerefos, C.S. Flow dynamics in Athens area under moderate large-scale winds. Atmos. Environ. 1998, 32, 2209–2222. [Google Scholar] [CrossRef]
  21. Roberts, G.C.; Nenes, A. A continuous-flow streamwise thermal-gradient CCN chamber for atmospheric measurements. Aerosol Sci. Technol. 2005, 39, 206–221. [Google Scholar] [CrossRef]
  22. Bougiatioti, A.; Fountoukis, C.; Kalivitis, N.; Pandis, S.N.; Nenes, A.; Mihalopoulos, N. Cloud condensation nuclei measurements in the marine boundary layer of the Eastern Mediterranean: CCN closure and droplet growth kinetics. Atmos. Chem. Phys. 2009, 9, 7053–7066. [Google Scholar] [CrossRef]
  23. Papayannis, A.; Balis, D.; Kokkalis, P.; Mamouri, R.; Tsaknakis, G.; Giannakaki, E.; Siomos, N.; Amiridis, V. ARIADNE: The Greek Lidar Network. Proceedings of 26th International Laser Radar Conference, Porto Heli, Greece, 25–29 September 2012; pp. 349–352. [Google Scholar]
  24. Argyrouli, A.; Bougiatioti, A.; Müller, D.; Kolgotin, A.; Bezantakos, S.; Papayannis, A.; Nenes, A. Cloud Condensation Nuclei spectra from a multi-wavelength Raman lidar and impacts on droplet number. Atmos. Chem. Phys. 2017. in preparation. [Google Scholar]
  25. Kokkalis, P.; Papayannis, P.; Mamouri, R.E.; Tsaknakis, G.; Amiridis, V. The EOLE Lidar system of the National Technical University of Athens. Proceedings of 26th International Laser Radar Conference, Porto Heli, Greece, 25–29 September 2012; pp. 629–632. [Google Scholar]
  26. Skamarock, W.C.; Klemp, J.B.; Dudhia, J.; Gill, D.O.; Barker, D.M.; Wang, W.; Powers, J.G. A Description of the Advanced Research WRF Version 2; NCAR Tech. Note NCAR/TN-468+STR: Boulder, CO, USA, 2005. [Google Scholar]
  27. Banks, R.F.; Baldasano, J.M. Impact of WRF model PBL schemes on air quality simulations over Catalonia, Spain. Sci. Total Environ. 2016, 572, 98–113. [Google Scholar] [CrossRef] [PubMed]
  28. National Centers for Environmental Prediction, National Weather Service. Available online: http://www.ncep.noaa.gov/ (accessed on 15 June 2017).
  29. Department of Commerce. NCEP FNL Operational Model Global Tropospheric Analyses, Continuing from July 1999; Research Data Archive at the National Center for Atmospheric Research; Computational and Information Systems Laboratory: Boulder, CO, USA, 2000. [CrossRef]
  30. Petters, M.D.; Kreidenweis, S.M. A single parameter representation of hygroscopic growth and cloud condensation nucleus activity. Atmos. Chem. Phys. 2007, 7, 1961–1971. [Google Scholar] [CrossRef]
  31. Moore, R.H.; Bahreini, R.; Brock, C.A.; Froyd, K.D.; Cozic, J.; Holloway, J.S.; Middlebrook, A.M.; Murphy, D.M.; Nenes, A. Hygroscopicity and composition of Alaskan Arctic CCN during April 2008. Atmos. Chem. Phys. 2011, 11, 11807–11825. [Google Scholar] [CrossRef]
  32. Lance, S.; Raatikainen, T.; Onasch, T.B.; Worsnop, D.R.; Yu, X.Y.; Alexander, M.L.; Stolzenburg, M.R.; McMurry, P.H.; Smith, J.N.; Nenes, A. Aerosol mixing state, hygroscopic growth and cloud activation efficiency during MIRAGE 2006. Atmos. Chem. Phys. 2013, 13, 5049–5062. [Google Scholar] [CrossRef]
  33. Wang, J.; Cubison, M.J.; Aiken, A.C.; Jimenez, J.L.; Collins, D.R. The importance of aerosol mixing state and size-resolved composition on CCN concentration and the variation of importance with atmospheric aging of aerosols. Atmos. Chem. Phys. 2010, 10, 7267–7283. [Google Scholar] [CrossRef]
  34. Bougiatioti, A.; Bezantakos, S.; Stavroulas, I.; Kalivitis, N.; Kokkalis, P.; Biskos, G.; Mihalopoulos, N.; Papayannis, A.; Nenes, A. Biomass-burning impact on CCN number, hygroscopicity and cloud formation during summertime in the eastern Mediterranean. Atmos. Chem. Phys. 2016, 16, 7389–7409. [Google Scholar] [CrossRef]
  35. Kalkavouras, P.; Bossioli, E.; Bezantakos, S.; Bougiatioti, A.; Kalivitis, N.; Stavroulas, I.; Kouvarakis, G.; Protonotariou, A.P.; Dandou, A.; Biskos, G.; et al. New particle formation in the southern Aegean Sea during the Etesians: Importance for CCN production and cloud droplet number. Atmos. Chem. Phys. 2017, 17, 175–192. [Google Scholar] [CrossRef]
  36. Seinfeld, J.H.; Pandis, S.N. Atmospheric Chemistry and Physics: From Air Pollution to Climate Change, 2nd ed.; Wiley: New York, NY, USA, 2006. [Google Scholar]
  37. Hudson, J.G.; Noble, S.; Tabor, S. Cloud supersaturations from CCN spectra Hoppel minima. J. Geophys. Res. Atmos. 2015, 120, 3436–3452. [Google Scholar] [CrossRef]
  38. Cerully, K.M.; Raatikainen, T.; Lance, S.; Tkacik, D.; Tiitta, P.; Petaja, T.; Ehn, M.; Kulmala, M.; Worsnop, D.R.; Laaksonen, A.; et al. Aerosol Hygroscopicity and CCN Activation Kinetics in a Boreal Forest Environment during the 2007 EUCAARI Campaign. Atmos. Chem. Phys. 2011, 11, 12369–12386. [Google Scholar] [CrossRef]
  39. Kostenidou, E.; Florou, K.; Kaltsonoudis, C.; Tsiflikiotou, M.; Vratolis, S.; Eleftheriadis, K.; Pandis, S.N. Sources and chemical characterization of organic aerosol during the summer in the eastern Mediterranean. Atmos. Chem. Phys. 2015, 15, 11355–11371. [Google Scholar] [CrossRef]
  40. Padro, L.T.; Moore, R.H.; Zhang, X.; Rastogi, N.; Weber, R.J.; Nenes, A. Mixing State and Compositional Effects on CCN Activity, and Droplet Activation Kinetics of Size-Resolved CCN in an Urban Environment. Atmos. Chem. Phys. 2012, 12, 10239–10255. [Google Scholar] [CrossRef]
  41. Andreae, M.; Rosenfeld, D. Aerosol-cloud interactions. Part 1. The nature and sources of cloud-active aerosols. Earth-Sci. Rev. 2008, 89, 13–41. [Google Scholar] [CrossRef]
  42. Pöschl, U.; Rose, D.; Andreae, M.O. Climatologies of cloudrelated aerosols—part 2: Particle hygroscopicity and cloud condensation nuclei activity. In Clouds in the Perturbed Climate System; Heintzenberg, J., Charlson, R.J., Eds.; MIT Press: Cambridge, UK, 2009. [Google Scholar]
  43. Engelhart, G.J.; Hennigan, C.J.; Miracolo, M.A.; Robinson, A.L.; Pandis, S.N. Cloud condensation nuclei activity of fresh primary and aged biomass burning aerosol. Atmos. Chem. Phys. 2012, 12, 7285–7293. [Google Scholar] [CrossRef]
  44. Asa-Awuku, A.; Nenes, A.; Sullivan, A.P.; Hennigan, C.J.; Weber, R.J. Investigation of molar volume and surfactant characteristics of water-soluble organic compounds in biomass burning aerosol. Atmos. Chem. Phys. 2008, 8, 799–812. [Google Scholar] [CrossRef]
  45. Asa-Awuku, A.; Engelhart, G.J.; Lee, B.H.; Pandis, S.N.; Nenes, A. Relating CCN activity, volatility, and droplet growth kinetics of beta-caryophyllene secondary organic aerosol. Atmos. Chem. Phys. 2009, 9, 795–812. [Google Scholar] [CrossRef]
  46. Koulouri, E.; Saarikosko, S.; Theodosi, C.; Markaki, Z.; Gerasopoulos, E.; Kouvarakis, G.; Mäkelä, T.; Hillamo, R.; Mihalopoulos, N. Chemical composition and sources of fine and coarse aerosol particles in the Eastern Mediterranean. Atmos. Environ. 2008, 42, 6542–6550. [Google Scholar] [CrossRef]
  47. Bougiatioti, A.; Zarmpas, P.; Koulouri, E.; Antoniou, M.; Theodosi, C.; Kouvarakis, G.; Saarikoski, S.; Mäkelä, T.; Hillamo, R.; Mihalopoulos, N. Organic, elemental and water-soluble organic carbon in size segregated aerosols, in the marine boundary layer of the Eastern Mediterranean. Atmos. Environ. 2013, 64, 251–262. [Google Scholar] [CrossRef]
Figure 1. Cloud condensation nuclei (CCN) concentration levels at the measured supersaturations during the measurement period. As a reference for the influence of local sources, the NO2 concentration levels are also shown. The two shaded areas represent the different periods of high and low CCN levels, respectively.
Atmosphere 08 00108 g001
Figure 2. Diurnal variability of the activation fractions (CCN/CN) during the measurement period for: (a) 0.4% supersaturation; (b) 0.8% supersaturation. Activation fractions between 0.6–1% supersaturation did not differ considerably.
Atmosphere 08 00108 g002
Figure 3. Calculated maximum supersaturation and droplet number with regard to the updraft velocity, during the measurement period.
Atmosphere 08 00108 g003
Figure 4. Timeseries of the different estimated parameters that contribute to the droplet formation: (a) variance of updraft, hygroscopicity and aerosol number, (b) attribution of Nd variability to Na, κ, and w, and (c) sensitivity of Nd to Na, κ and w from the droplet parameterization.
Atmosphere 08 00108 g004
Figure 5. Collocated EOLE Raman lidar measurements (1064 nm) for June 18 (a) and June 20 (b) denoting the PBL structure and the presence/absence of aerosols and clouds.
Atmosphere 08 00108 g005
Figure 6. Correlation of droplet number with updraft velocity (a) and total aerosol number (b) during Period 1, when updraft velocities were low and aerosol numbers were high.
Atmosphere 08 00108 g006
Table 1. Hygroscopicity parameter κ as derived from the CCN measurements for the five different levels of supersaturation.
Supersaturation (%)17 June18 June19 June20 June21 June
0.20.47 ± 0.150.36 ± 0.140.29 ± 0.140.25 ± 0.150.29 ± 0.13
0.40.16 ± 0.060.17 ± 0.130.25 ± 0.180.22 ± 0.190.21 ± 0.14
0.60.10 ± 0.080.10 ± 0.100.17 ± 0.140.15 ± 0.140.15 ± 0.10
0.80.09 ± 0.080.09 ± 0.120.14 ± 0.140.15 ± 0.140.11 ± 0.07
10.08 ± 0.070.08 ± 0.140.14 ± 0.190.14 ± 0.150.09 ± 0.07

