Estimation of Optical Properties for HULIS Aerosols at Anmyeon Island, Korea


1
Department of Environmental Engineering, Chosun University, 309 Pilmun-daero, Dong-gu, Gwangju 501-759, Korea
2
Department of Health Management, Kyungin Women’s University, 101 Gesan-gil, Gyeyang-gu, Incheon 407-740, Korea
3
Department of Chemical Engineering and Materials Science, Ewha Womans University, 11-1 Daehyun-dong, Seodaemun-gu, Seoul 120-750, Korea
*
Author to whom correspondence should be addressed.
Atmosphere 2017, 8(7), 120; https://doi.org/10.3390/atmos8070120
Submission received: 8 May 2017
/
Revised: 29 June 2017
/
Accepted: 4 July 2017
/
Published: 7 July 2017
(This article belongs to the Special Issue Carbonaceous Aerosols in Atmosphere)
Abstract
:In this study, the sensitivity of the optical properties of carbonaceous aerosols, especially humic-like substances (HULIS), are investigated based on a one-year measurement of ambient fine atmospheric particulate matter (PM2.5) at a Global Atmospheric Watch (GAW) station in South Korea. The extinction, absorption coefficient, and radiative forcing (RF) are calculated from the analysis data of water soluble (WSOC) and insoluble (WISOC) organic aerosols, elemental carbon (EC), and HULIS. The sensitivity of the optical properties on the variations of refractive index, hygroscopicity, and light absorption properties of HULIS as well as the polydispersity of organic aerosols are studied. The results showed that the seasonal absorption coefficient of HULIS varied from 0.09 to 11.64 Mm−1 and EC varied from 0.11 to 3.04 Mm−1 if the geometric mean diameter varied from 0.1 to 1.0 µm and the geometric standard deviation varied from 1.1 to 2.0, with the imaginary refractive index (IRI) of HULIS varying from 0.006 to 0.3. Subsequently, this study shows that the RF of HULIS was larger than other constituents, which suggested that HULIS contributed significantly to radiative forcing.
1. Introduction
Organic aerosols (OA) account for a large, sometimes even dominant, fraction of ambient particulate matter. They constitute more than 20–50% of the total fine aerosol mass at continental mid-latitudes [1,2]. Usually, OA are known to originate from direct emissions as primary aerosols and also form from the gas-to-particle conversion process in the atmosphere. OA influences the physical and chemical properties of aerosols and thus affects the atmosphere and climate through interactions with reactive trace gases, water vapor, clouds, precipitation, and radiation. They also influence human health by impacting respiratory and cardiovascular functions. However, our understanding of the physicochemical properties of OA is limited. There are thousands of different atmospheric organic compounds which have been identified (e.g., [3]), making it extremely difficult to estimate their direct and indirect effects.
A non-negligible portion of OA is known to be water soluble [4]. Characterization of water soluble organic carbon (WSOC) is important because it is believed to act as cloud condensation nuclei (CCN). A substantial fraction of WSOC is known to be of humic-like substances (HULIS) [5,6,7]. HULIS is a class of macromolecular compounds of the organic fraction in carbonaceous aerosols that is emitted primarily during biomass burning and formed in situ by atmospheric processes. HULIS accounts for over 50% of the organic carbon mass of urban aerosols [8], and in some cases it accounts for more than 70% of the total WSOC mass concentration [9].
Brown carbon (BrC), so named for its light brownish color, absorbs strongly in the ultraviolet wavelengths [10,11,12] in OA. It has has emerged in recent studies that estimate its impact on climate change relating to its direct effects on radiation, in addition to the indirect effect of the cooling effect of cloud droplet nucleation by OA. With respect to the BrC component, HULIS formed in the atmosphere via oxidation of both anthropogenic and biogenic precursor compounds has been recognized as an important component of BrC [6,13,14].
There are many experimental works on BrC from biomass burning. Costabile et al. (2017) [15] investigated the optical–microphysical–chemical properties of BrC in the ambient urban atmosphere through in situ ground ambient data of chemical, optical, and microphysical aerosol properties. They found that both BrC number and size distribution, as well as the dependence of Absorption Angstrom Exponent on the BC (Black Carbon)-to-OA ratio can be relevant to parameterize and investigate BrC in the ambient atmosphere. Gilardoni et al. (2016) [16] reported direct ambient observations of Secondary Organic Aerosol (SOA) mass formation from the processing of biomass-burning emissions in the aqueous phase and showed that aqueous SOA originating from biomass-burning emissions are strong absorbers of UV and visible light, thereby contributing to a positive direct forcing. Additionally, numerous theoretical and experimental studies have been conducted regarding HULIS aerosols, including the sources, characteristics, as well as their physical, chemical, and optical properties [17,18,19]. Studies on HULIS can help significantly in understanding the complexity of OA [20,21]. However, a common understanding of the HULIS constituents is still lacking and requires extensive experimental data from both field and laboratory studies [12].
From a climatic point of view, it is generally understood that the specific absorption cross-section of black carbon (BC) is the highest among the carbonaceous constituents of the aerosols because of its considerable contribution to atmospheric light-absorption [21,22]. Although HULIS is expected to be a weaker absorber, its contribution to the absorption may also be important because of its higher abundance [11].
Until now, impacts of HULIS on the environment and climate have not been as well-known as other components, such as inorganic aerosols. Considering its optical properties, HULIS is only believed to play an important role in atmospheric heating and cooling through direct light absorption in the ultraviolet and visible ranges [23].
Hygroscopicity is another important property of HULIS that determines its optical properties, as well as radiative forcing (RF). Despite past efforts, there exists no consistent picture regarding the connection between hygroscopic growth of HULIS particles [2,24]. Generally, the hygroscopic growth and activation behavior of atmospheric aerosol particles, including HULIS, is important for the quantification of the indirect effect [24]. Additionally, the hygroscopicity of HULIS can influence the direct radiative effect by varying the water content in aerosols, which would alter the composition and optical properties of the aerosol itself. Thus, it is important to understand and characterize the optical properties of HULIS aerosols based on regional measurement data.
One of the main stations for measuring and analyzing climate change and background air quality in Korea and the East Asian region is Anmyeon Island. Anmyeon Island is located on the mid-western coast of South Korea where a Global Atmospheric Watch (GAW, 36°32′ N; 126°19′ E, 45.7 m above sea level) regional station has been established by the Korean Meteorological Administration. One of the goals of the Anmyeon GAW station is to monitor the variations of the components that might affect climate change and air quality. Recently, a research program has been started at the Anmyeon station in which the concentrations of carbonaceous species in particulate matter that is less than, or equal to, 2.5 μm in aerodynamic diameter (PM2.5), are analyzed to estimate major sources of the observed carbonaceous species and to quantify the radiative forcing caused by them.
In this study, based on the one year long-term measurement data of carbonaceous species at the Anmyeon GAW station, the optical properties of OA are systematically studied, particularly for HULIS aerosols. The extinction, absorption coefficient, and RF are calculated from soluble and insoluble organic carbon, HULIS, and EC concentration data. The sensitivity of these properties, in addition to the hygroscopicity of the properties of HULIS and the polydispersity of OA, are also estimated, and the importance of HULIS to the optical properties of aerosols is discussed.
2. Measurement Data
The study site was Anmyeon Island (36.32° N, 126.19° E, altitude 45.7 m), which is located on the western coast of Korea. A total of 59 daily PM2.5 samples were collected from June 2015 to May 2016 every sixth day. A PM2.5 high volume air sampler (TE-5005BLX, Tisch Environmental, Inc., Cleves, OH, USA) were installed on the roof of the Korea Global Atmosphere Watch (KGAW) building about 4 m above ground and operated at a flow rate of 1.1 m3/min. Pre-baked quartz filters (TISSQUARTZ 2500QAT-UP, PALL life Science, Ann Arbor, MI, USA) were used for the sampling. After sampling, the filters were wrapped in aluminum foil and stored in a freezer until analysis. Field blank filters were also collected every month and stored and analyzed equally with the PM2.5 samples, and blank-correction was applied to all of the carbonaceous fraction concentrations. Among them, 35 HULIS samples were available from July 2015 to April 2016 and used in this study after undergoing a quality assurance/quality control (QA/QC) procedure.
For Organic Carbon (OC) and EC analysis, a thermal/optical carbon aerosol analyzer (OCEC Model 5L, Sunset Laboratory, Forest Grove, OR, USA) applying the NIOSH (National Institute of Occupational Safety and Health) method were applied. The analysis procedures included two stages. In the first stage, OC were volatilized from the sample in a non-oxidizing atmosphere (helium) as the temperature was stepped to 870 °C (310 °C for 80 s, 475 °C for 80 s, 615 °C for 80 s, and 870 °C for 110 s). In the second stage, after a helium cooling blow of 45 s, a 2% oxygen (by volume) in a balance of helium was introduced, and then the oven temperature was stepped to 870 °C (550 °C for 45 s, 625 °C for 45 s, 700 °C for 45 s, 775 °C for 45 s, 850 °C for 45 s, and 870 °C for 110 s). The split time between OC and EC was obtained by measuring the time required to return the filter to its initial transmittance value. At the end of every analysis, a fixed volume loop of methane was injected automatically as an internal standard to calculate the carbon results. WSOC were analyzed by extracting portions (15 cm2) of Quartz Fiber Filters (QFFs) samples. Extraction was carried out twice, with a 30-min interval with 20 mL of distilled deionized water (DDW, 18.2 MΩ) by ultra-sonification. Ice water was used in the sonication bath to minimize possible loss of volatile OC due to the temperature increase during extraction. Filter debris and suspending insoluble particles were removed from the extracts using a syringe filter (0.2 µm Polytetrafluoroethylene (PTFE) membrane, PALL life science, Ann Arbor, MI, USA). The extracts were divided into two fractions and one was applied for WSOC analysis and the other was used for HULIS-C extraction. The WSOC analyses were made using a TOC (total organic carbon) analyzer (Sievers M9, General Electric Power and Water Analytical Instruments, Boulder, CO, USA). For HULIS-C analysis, the extraction process was followed by the SPE (solid phase extraction) method described in Lin et al. (2010) [25]. The water extracts’ soluble fractions from PM2.5 samples were acidified to pH = 2 using HCl and loaded on an SPE cartridge (Oasis HLB, 30 mm, 60 mg/cartridge, Waters, Milford, MA, USA). Then, the cartridge was rinsed with two portions of 1 mL water before elution with 3 × 0.5 mL of methanol containing 2% ammonia (w/w). The resulting eluate was evaporated to dryness under a gentle stream of N2 and re-dissolved in 10 mL of water for analysis of the HULIS-C fraction. The HULIS-C were analyzed using a TOC (total organic carbon) analyzer (Sievers M9, General Electric power and Water Analytical Instruments, Boulder, CO, USA). WISOC was determined by subtracting WSOC from OC.
Figure 1 shows the seasonal variation of the concentrations and relative fractions of WSOC, WISOC, EC, and HULIS. The seasonal average mass concentration of HULIS was from 1.04 to 2.53 µg m−3 during the sampling period. WISOC and WSOC, excluding HULIS (residual WSOC = WSOC − HULIS), accounted for 1.2–2.3 µg m−3 and 0.51–1.22 µg m−3, respectively. As Figure 1 shows, the contribution of HULIS decreased to 34% and that of EC increased to 13% during summer. The fractions of WISOC and residual WSOC decreased to 29% in spring and 7% in fall. OA accounted for 87–92% of the Total Carbonaceous Aerosols (TCA) and the EC concentration accounted for only 8–13% of the TCA. This shows that OA was dominant in the carbonaceous aerosols.
3. Model Description
In this study, the carbonaceous aerosol optical properties were calculated considering hygroscopicity, light absorption, size distribution, and chemical composition. The mass concentration of EC, WSOC, WISOC, and HULIS of PM2.5 were given as input data. Figure 2 is a summary of the working diagram used in this study. Lognormal aerosol size distribution and the species densities and refractive indices of externally-mixed organic aerosols were assumed in this study [26]. The FORTRAN complier was employed to run our model.
Table 1 shows the refractive indices at a wavelength of 0.55 µm and the densities for the various aerosol components. Based on the previous studies [23,27,28,29,30], we assumed the imaginary refractive index (IRI) of WSOC, WISOC, and HULIS to be 0.006. Still, some studies insisted that the refractive index of more absorbing brown aerosol goes up to 0.27 [30]. Thus, in this study, to understand the sensitivity of the optical properties to the IRI of HULIS, we tested the two extreme values of IRI (from 0.006 to 0.3) in order to characterize a minimum–maximum range of the optical characteristics of HULIS. As explained in the introduction, carbonaceous aerosols can be divided into water soluble and insoluble components. The insoluble carbonaceous aerosol would comprise EC and WISOC. The soluble component (for example HULIS), is assumed to influence the water content. In this study, we divided the organic carbon as water soluble (WSOC) and water insoluble carbon (WISOC). The water soluble organic carbon is divided again as HULIS and others (WOSC-HULIS). The water soluble organic carbon absorbs water and increases the water content in the aerosol. We studied the sensitivity of the HULIS optical properties using Mie theory based on the variation of the hygroscopic growth factor (HGF) of HULIS.
3.1. Size Distributions
The aerosols in the atmosphere are polydispersed, i.e., they are distributed in a broad range of sizes. Different aerosol size distributions have different optical properties due to the variation of extinction coefficient with aerosol size. Further, during hygroscopic growth, water vapor condenses on existing particles, altering the particle diameter and the size distribution of the aerosol population and, thus, altering the optical properties. In this study, the size distribution of ambient polydispersed aerosols is presented using a lognormal distribution function [31]:
where is the diameter of the particle, is the geometric mean diameter, is the geometric standard deviation, and is the total number concentration.
3.2. Hygroscopicity of HULIS
Aerosol hygroscopicity can be defined as the amount of water absorbed by a particle with a given dry diameter and relative humidity (RH). Particles that readily absorb water have larger scattering cross-sectional areas than less hygroscopic particles, and are also more likely to act as CCN, thereby allowing them to indirectly affect the climate [32].
Generally, the particle growth behavior is specified by using the hygroscopic growth factor (HGF), which is defined as the ratio between the wet and dry particle radii. Although the hygroscopic behavior of inorganic aerosols is relatively well constructed, the characteristics of hygroscopicity in HULIS aerosols have not been well established yet. The reason for this uncertainty in estimating the hygroscopicity of HULIS aerosols is that the organic component of ambient aerosols consists of hundreds, or even thousands, of species that often contribute substantially to, or sometimes even dominate, fine aerosol mass compared to the inorganic component, which is usually limited to a few species [2,33]. In this study, the HGF of HULIS aerosols can be defined as the volume ratio of the wet (water uptake) and dry HULIS particles, as follows [31]:
Previous studies have shown that atmospheric OA consists of a wide range of organic species, ranging from non-hygroscopic OA, such as primary OA emitted from fossil fuel combustion, to highly hygroscopic OA from biomass burning [33,34]. There are only a few studies of hygroscopic growth of HULIS particles and the reported hygroscopicities differ significantly. For example, some studies reported that growth factors at an RH of 90% (GF90) range from 1.05 to 1.17 for HULIS in K-puszta [35,36]. Other studies showed that GF90 ranges from 1.05 to 1.47 for HULIS originating from polluted urban particulate matter [24,29], and from 1.05 to 1.24 from biomass burning particulate matter [30,37]. In this study, we simulated the variation of the optical properties of carbonaceous aerosol at the HULIS HGF range of 1.0–1.3 and two extreme values of IRI (0.006 and 0.3), which is useful to explore a range of properties based on these previous results.
3.3. Light Absorption
In addition to the hygroscopic properties of HULIS aerosols, another important characteristic of the optical properties of HULIS aerosols that needs to be considered is their light absorption. HULIS aerosols have light absorption properties and are known to be a major component of brown carbon. Observational evidence suggests that some organic aerosol compounds emitted from fossil fuel combustion weakly absorb a part of ultraviolet and visible wavelengths (e.g., [37,38]).
This study tries to estimate the degree of HULIS aerosol contribution to the light absorption ability of organic aerosol compounds. In order to quantify the absorption properties of HULIS as a function of an IRI, the IRI of HULIS in the range of 0.006–0.3 was considered in this simulation.
3.4. Aerosol Optical Properties and Radiative Forcing
The effect of aerosols on climate can be divided into direct and indirect aerosol effects. In this study, only the direct effects are considered. Direct effects [39] include the absorption and scattering of radiation by aerosol particles, while indirect effects [40] include the influences of cloud radiative properties (cloud albedo effect), as well as that of the cloud lifecycle (cloud lifetime effect) on aerosols. Non-absorbing aerosols cause cooling, whereas absorbing aerosols can produce either cooling or warming depending on the aerosol properties (refractive index, size, and shape), and on the properties of the underlying surface [39].
In this study, we evaluated the instantaneous forcing and sensitivities of HULIS, as well as other carbonaceous aerosols that were calculated using a simple analytical expression by Chylek and Wong (1995) [39]. The rate of aerosol optical depth decrease can be translated into the rate of the top-of-atmosphere (TOA) using an approximation valid for a thin aerosol layer [39]. RF due to the carbonaceous aerosol effect can be estimated using the aerosol optical depth, single scattering albedo, and an asymmetry parameter. Although a fully radiative transfer treatment is needed to obtain the exact results, it is possible to estimate the RF using a simple model. This expression, as presented by Charlson et al. (1992) [41], is for the carbonaceous aerosol RF at TOA, due to scattering by each carbonaceous aerosol component on a cloud-free sky. Aerosols are homogeneously mixed vertically, within 1 km, and the calculation results were assumed to be valid under these conditions. The detailed expression, with the variables used in this study for the RF of the ith carbonaceous aerosol, can be expressed as follows [31,39,42]:
where:
- S0: solar constant, 1370 (W m−2);
- S0/4: the globally averaged incident solar flux at the top of the atmosphere;
- Tatm: transmittance of the atmosphere above the aerosol layer, 0.76;
- N: fraction of sky covered by clouds (0.6);
- α: albedo of the underlying surface, 0.15;
- β: fraction of the radiation scattered into the upper hemisphere by aerosols, 0.125; and
- : optical depth due to scattering and absorption of the ith component.
4. Results
The major parameters that determine the optical properties of carbonaceous aerosols are the aerosol refractive index and size distribution. For a lognormal size distribution, the geometric mean diameter and geometric standard deviation are the main variables that characterize the size distribution in a given mass concentration. Other parameters, such as the aerosol shape and mixing state, are also important factors that affect the optical properties of aerosols, although they are not considered in this study.
In estimating the optical properties of HULIS aerosols, the IRI and size distribution are the most uncertain parameters. The IRI is especially important for characterizing the absorbing properties of HULIS aerosols. For example, the absorbing properties can be determined from the IRI of HULIS aerosols. Since HULIS is composed of a large number of different individual components, it is difficult to generalize their optical properties. They can have different origins, sources, locations, and have been formed under variable meteorological conditions. For these reasons, we calculate the range of the optical properties and their contribution using a sensitivity test with an IRI.
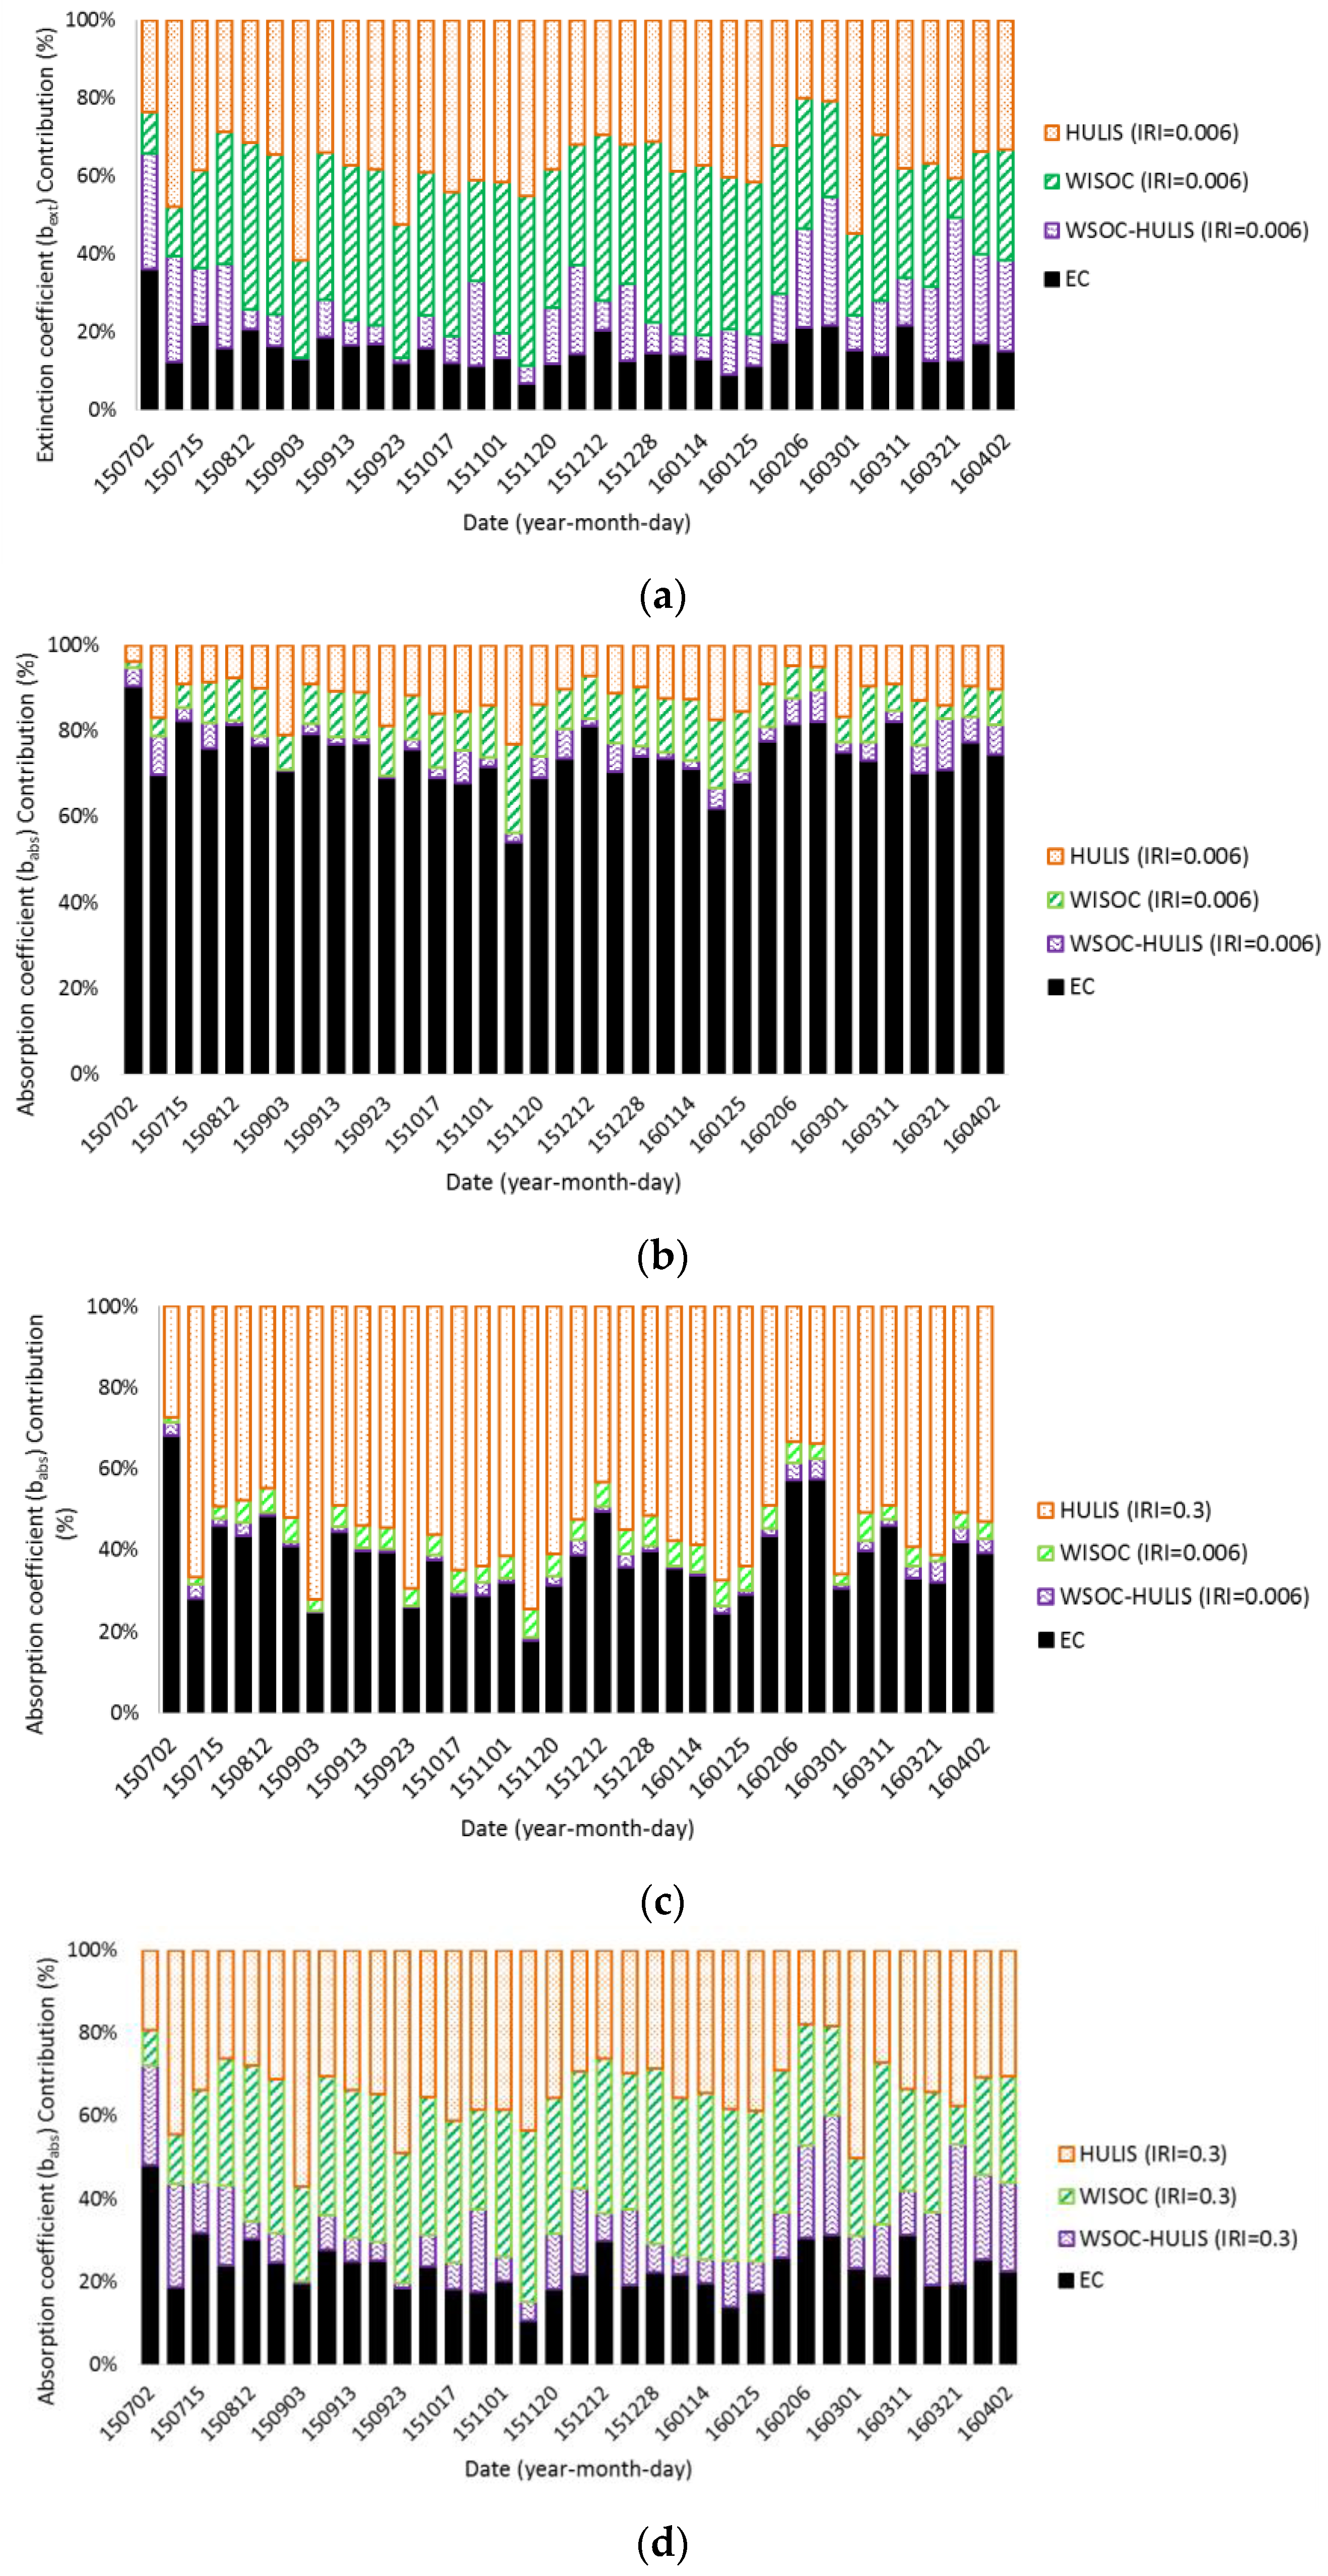
Figure 3 shows the daily extinction and absorption coefficients for each carbonaceous component. The imaginary refractive indices of 0.006 and 0.3 for HULIS, WSOC-HULIS, and WISOC are applied and the contribution of each component on the aerosol optical properties, such as the extinction coefficient and absorption coefficient, are compared. In the case shown in Figure 3, the lognormal aerosol size distribution was assumed to be fixed with a geometric mean diameter (dg) of 0.1 µm for EC and 0.5 µm for an organic aerosol and geometric standard deviation (αg) of 1.5. The results show that the IRI of HULIS plays an important role in estimating the aerosol optical properties, for both extinction and absorption coefficients. As shown in Figure 3a, the contributions of HULIS and WISOC to the extinction coefficient are dominant compared to the contribution of EC. In the case of the contribution of the absorption coefficient for the HULIS IRI value of 0.006, EC is dominant (Figure 3b). However, for the IRI of 0.3, the contribution of HULIS to the absorption coefficient is 65–81% of the TCA (Figure 3c). This means that the contribution and the absorbing characteristics of HULIS should be considered when evaluating the optical properties of carbonaceous aerosols. When the IRI is 0.3 for WISOC, HULIS, and WSOC-HULIS (Figure 3d), the contribution of HULIS and EC on the absorption coefficient decreases and the contribution of WISOC and WSOC-HULIS (to the absorption coefficient) increases. However, the results show that the contribution of HULIS is still important.
Figure 4 shows the seasonal variation of extinction and the absorption coefficients for each carbonaceous component. The maximum and minimum extinction and absorption coefficients are calculated in the range of the geometric mean diameter from 0.1 to 1 µm and the geometric standard deviation from 1.1 to 2.0. The IRI of 0.006–0.3 was considered for HULIS aerosols. The seasonal extinction coefficient of HULIS ranges from a minimum of 0.52 Mm−1 in summer to 20.86 Mm−1 in fall. EC and HULIS are dominant contributors to the absorption coefficient. The absorption coefficient of EC ranges from 0.11 (in summer) to 3.04 Mm−1 (in spring), but retains relatively stable variation through the different seasons. On the other hand, the absorption coefficient of HULIS ranges from 0.09 Mm−1 (in summer) to 11.64 Mm−1 (in fall), and shows larger variation than EC. EC contributes 18–40% of the TCA to the absorption coefficient. However, HULIS ranges from a minimum of 32% to a maximum of 81% of the TCA to the absorption coefficient, which shows a wider range of contribution. The comparison also shows that the contribution of HULIS dominates the absorption properties of aerosols over EC in this measurement period at Anmyeon Island. Previous studies have reported a higher concentration of HULIS during cold periods due to the enhancement of biomass burning [43,44,45]. We also observed the highest concentration of HULIS in fall, and this observation can be explained by the transport of biomass burning that occurred in Northern China. More detailed investigation is required to explore this, and thus it remains for further study.
Figure 5 and Table 2 show the seasonal variation of RF for each carbonaceous aerosol. The IRI, geometric mean diameter (dg), and the geometric standard deviation (σg) of HULIS range from 0.006 to 0.3, 0.1–1.0 µm, and 1.1 to 2.0, respectively. As Figure 5 and Table 2 show, the RF of HULIS ranges from −0.5023 to +0.4892 W m−2 in fall. For small imaginary refractive indices (IRI of 0.006, for example), the light scattering properties of the aerosol is dominant and RF becomes negative. Meanwhile, for a larger imaginary refractive index (IRI of 0.3), the light absorbing properties of the aerosol is dominant and RF becomes positive. This explains the results that HULIS contributes to an almost equal amount of both positive and negative radiative forcing. The RF of WISOC and residual WSOC (= WSOC − HULIS) ranges from −0.07 to −0.002 W m−2 and −0.215 to −0.002 W m−2, respectively. For the case of EC, the RF ranges from +0.0022 W m−2 in summer to +0.1325 W m−2 in spring, which shows that the contribution of HULIS in RF is larger than that of EC.
In the Intergovernmental Panel on Climate Change (IPCC, 2013) report [21], one of the key components of the development of climate credits is that the recent methodology accounts for the inclusion of short-lived climate pollutants, such as black carbon, brown carbon, and other organic aerosols. According to the assessment reports by the IPCC (Intergovernmental Panel on Climate Change), the global and annual mean radiative forcing value of BC was 0.40 (0.05–0.80) W m−2 between the years 1750 and 2011, and the radiative forcing (RF) of BC and OC from the biomass burning emissions can offset each other to give an estimated RF of +0.0 (−0.2 to +0.2) W m−2. Currently, many studies dedicated to light-absorbing aerosol are mainly focused on BC, and they are well documented in recent review literatures [22,46,47]. For example, Bond et al. (2013) [22] undertook a comprehensive assessment of all available forcing values and arrived at an estimate of 0.88 W m−2 (for all sources of BC) as of 2005. However, there are still substantial uncertainties [12,48]. These are mainly because of the limited information about their sources, atmospheric loading, and composition of organic aerosols, of which a significant fraction are also light absorbing organics, known as brown carbon (BrC) [21]. According to Heald et al. (2014) [49], the estimation of a direct radiative forcing of OA is −0.23 W m−2, while it is +0.06 W m−2 for BC. According to Jung et al. (2015) [31], the RF of Seoul, Korea from 2006 to 2007 due to WSOC, WISOC, and EC was estimated based on the PM10 mass composition measurement in the ranges from −0.09 to −0.47 W m−2, −0.33 to −0.22 W m−2, and 0.44 to 0.80 W m−2, respectively, for the homogeneous mixture. Jacobson (2001) [37] proposed that the global-average BC RF was 0.55 W m−2. Moffet and Prather (2009) [50] estimated the global-average BC RF to be 0.2–1.2 W m−2 based on global-scale modeling and observations. According to Kim et al. (2012) [51], the BC RF over the Korean Peninsula was estimated to be 0.1–1.8 W m−2 with the domain-average value of 0.39 W m−2. Kim et al. (2011) [52] estimated the net RF based on the chemical composition data of PM2.5 at Gosan, a background site in Korea between 1992 and 2008; the value varied from −4.48 to 0.53 W m−2 at Gosan and it was increasing. This means that Anmyeon Island has a smaller RF than the locations in the previous studies. This study seems to show that the RF of carbonaceous aerosol is smaller than it is in Seoul or the Korean Peninsula, although this result is based on PM2.5 measurements.
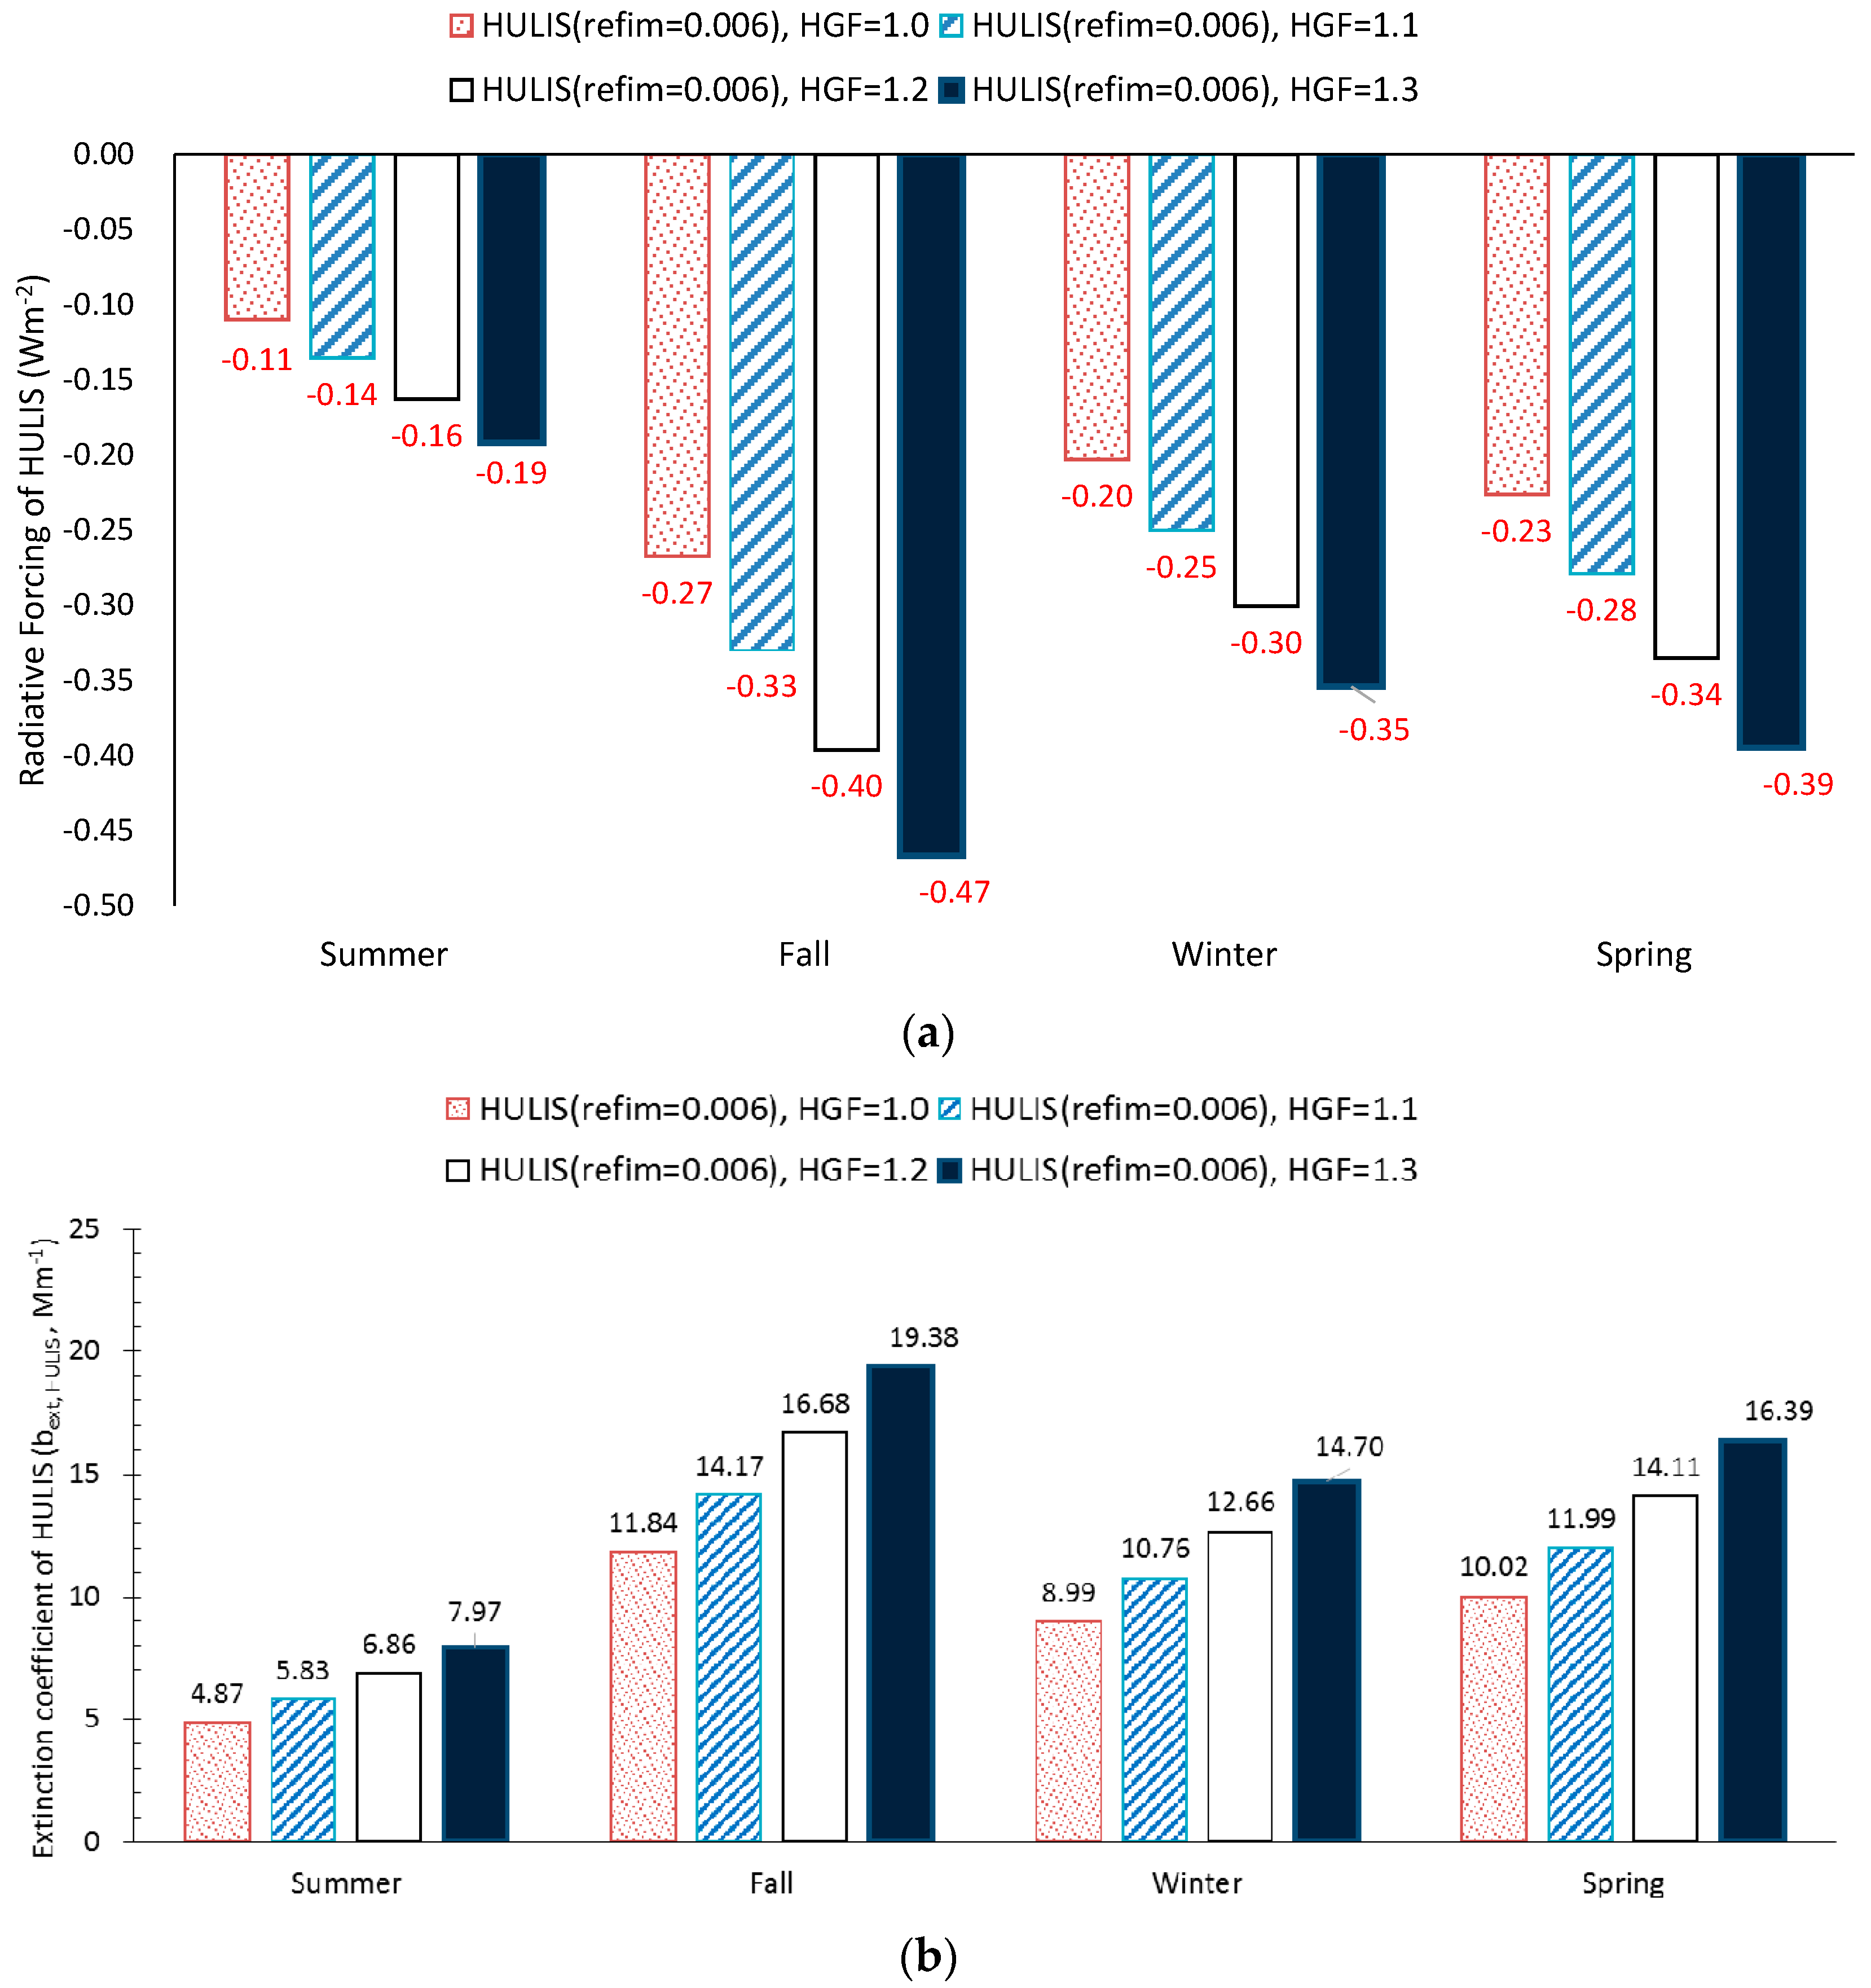
Figure 6 shows the seasonal RF and extinction coefficient of HULIS aerosol as a function of HGF, which has been defined in Equation (2). The IRI, geometric mean diameter, and geometric standard deviation of HULIS are assumed to be 0.006, 0.5 µm, and 1.5, respectively. An HGF of 1.0 to 1.3 was considered. As Figure 6 shows, the RF of HULIS decreases and the extinction coefficient of HULIS increases as HGF increases. For example, the RF of HULIS in summer negatively enhances from −0.11 W m−2 to −0.192 W m−2, and the extinction coefficient of HULIS increases from 4.87 to 7.965 Mm−1 as HGF increases from 1.0 to 1.3. As HGF increases, the water content increases. This enhances the scattering of HULIS due to the refractivity of water. The extinction coefficient of Figure 6 shows that the optical properties of HULIS are strongly dependent on the hygroscopicity.
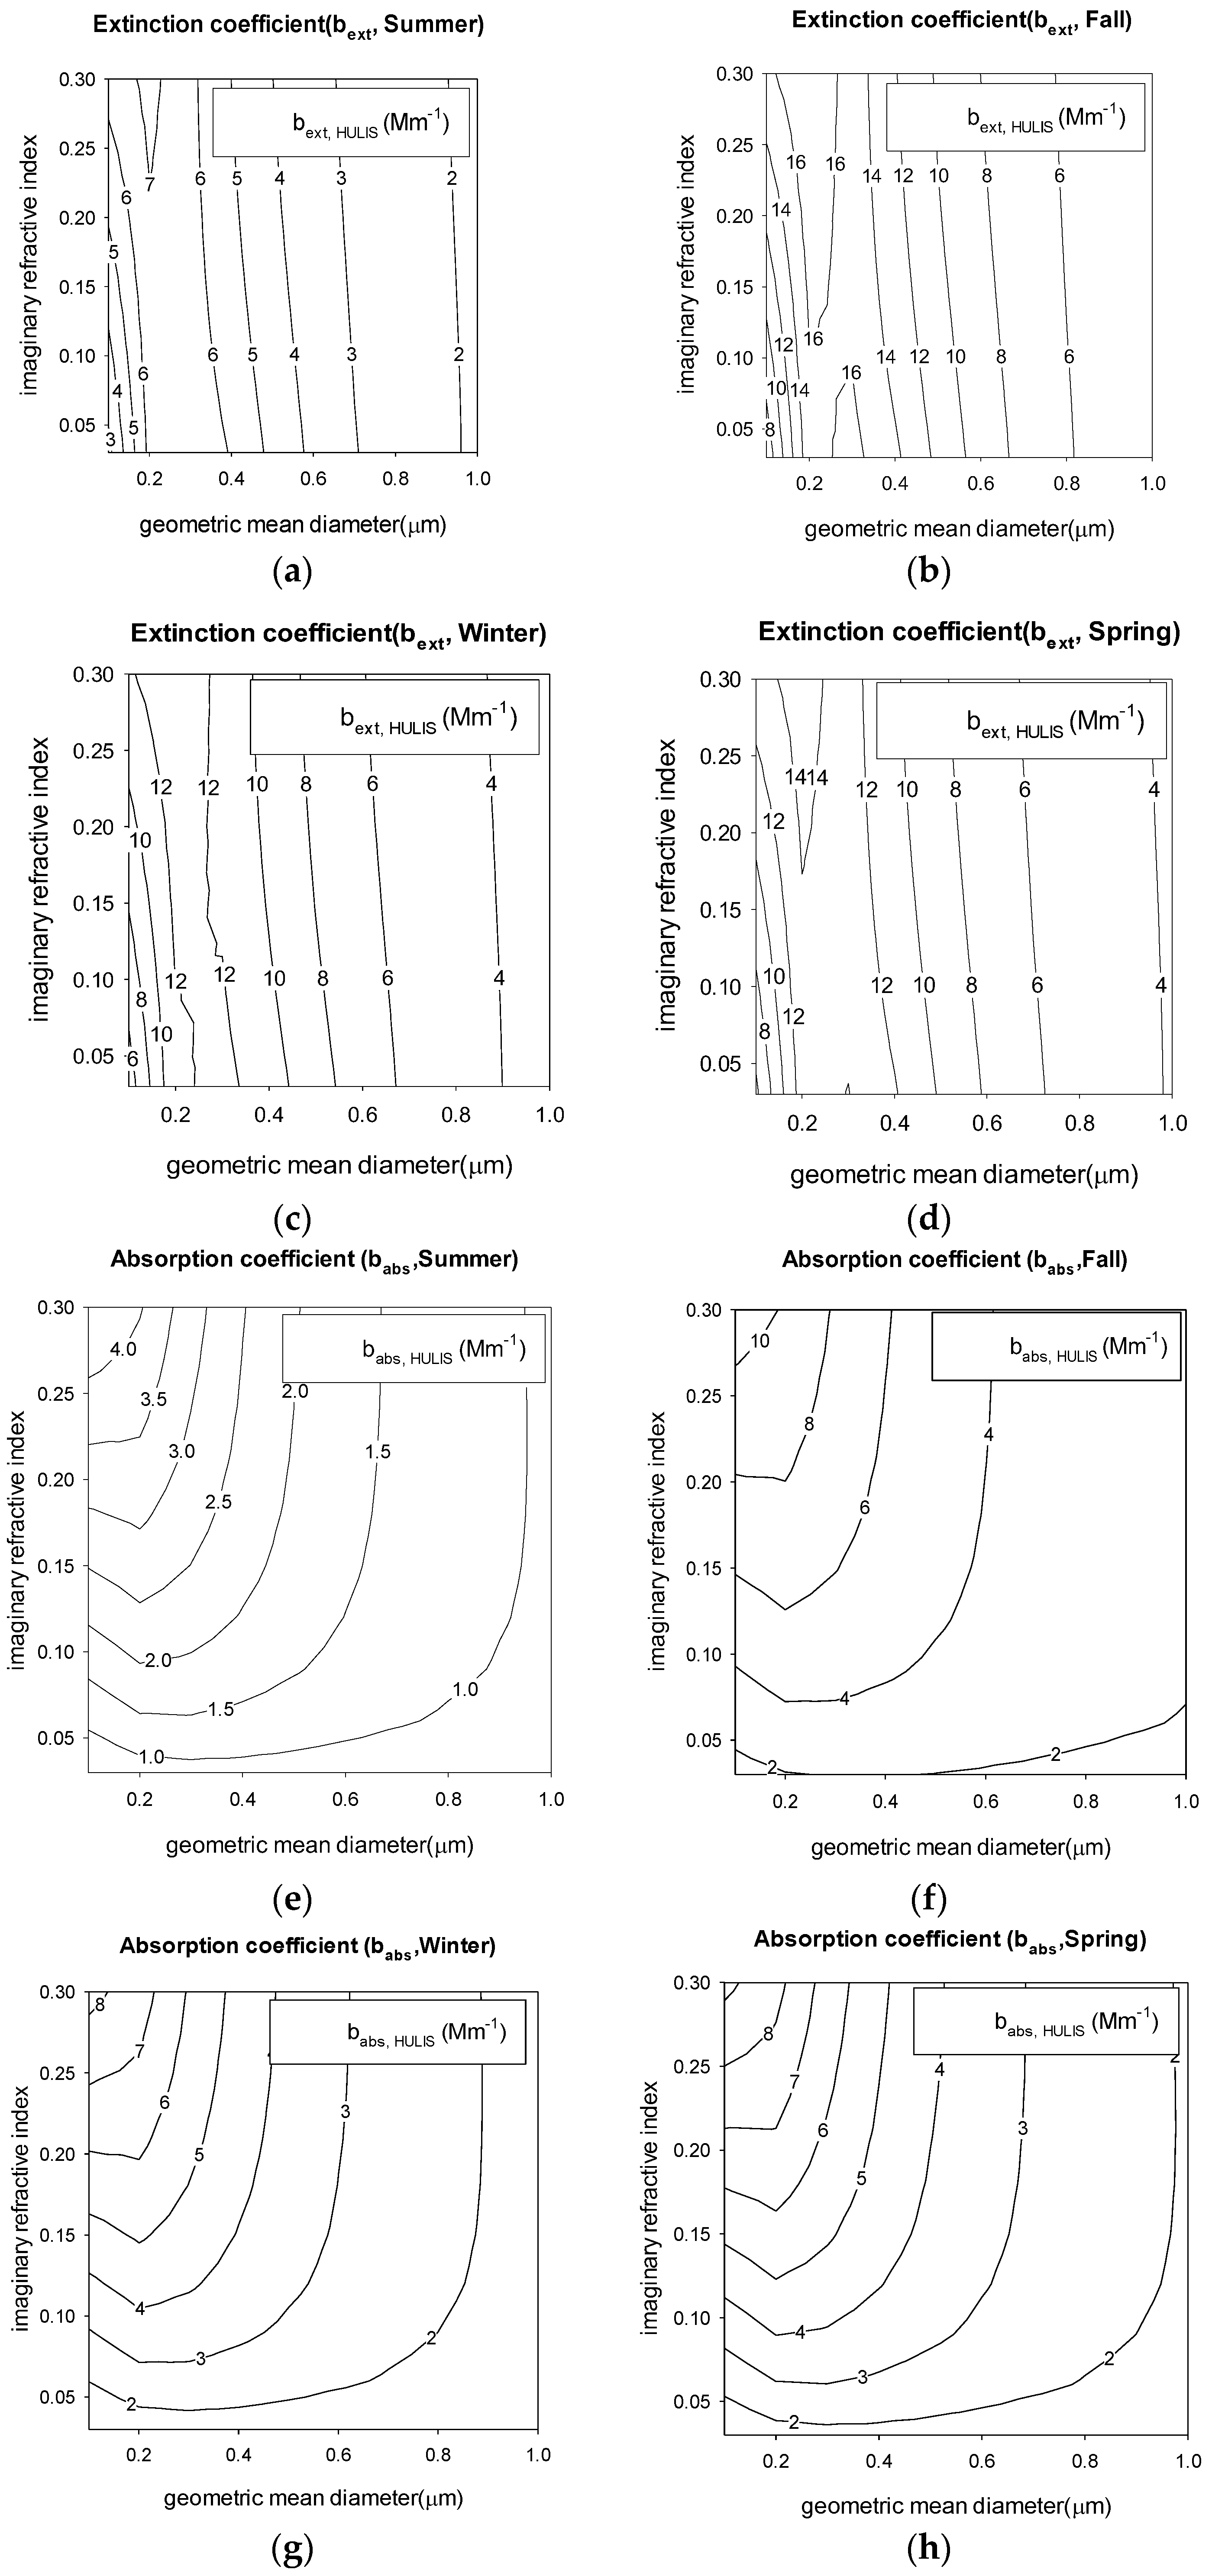
Figure 7 shows the contour plot of the extinction coefficient and absorption coefficient of HULIS aerosols as a function of the geometric mean diameters and IRI of HULIS aerosols. The sensitivity of the optical properties was simulated for four seasons under an imaginary HULIS refractive index range of 0.06–0.3 and the geometric mean diameter range of 0.1–1 µm. According to Figure 7, the extinction coefficient of HULIS shows a peak at a geometric mean diameter of around 0.2–0.3 µm, although the detailed extinction coefficient depends on the IRI of HULIS and the given composition-based mass concentration. It is interesting that the extinction coefficient is more sensitive to the geometric mean diameter than it is to the IRI of HULIS. This can be explained by the fact that the extinction coefficient is determined by scattering and absorption. In the extinction coefficient, the contribution of absorption is smaller than that of scattering; this makes the IRI of HULIS insensitive. Figure 7 also shows that the absorption coefficient of HULIS aerosol depends on seasonal mass concentration, geometric mean diameter, and IRI. Compared to the extinction coefficient, the absorption coefficient varies according to the IRI of HULIS, as well as to the geometric mean diameter.
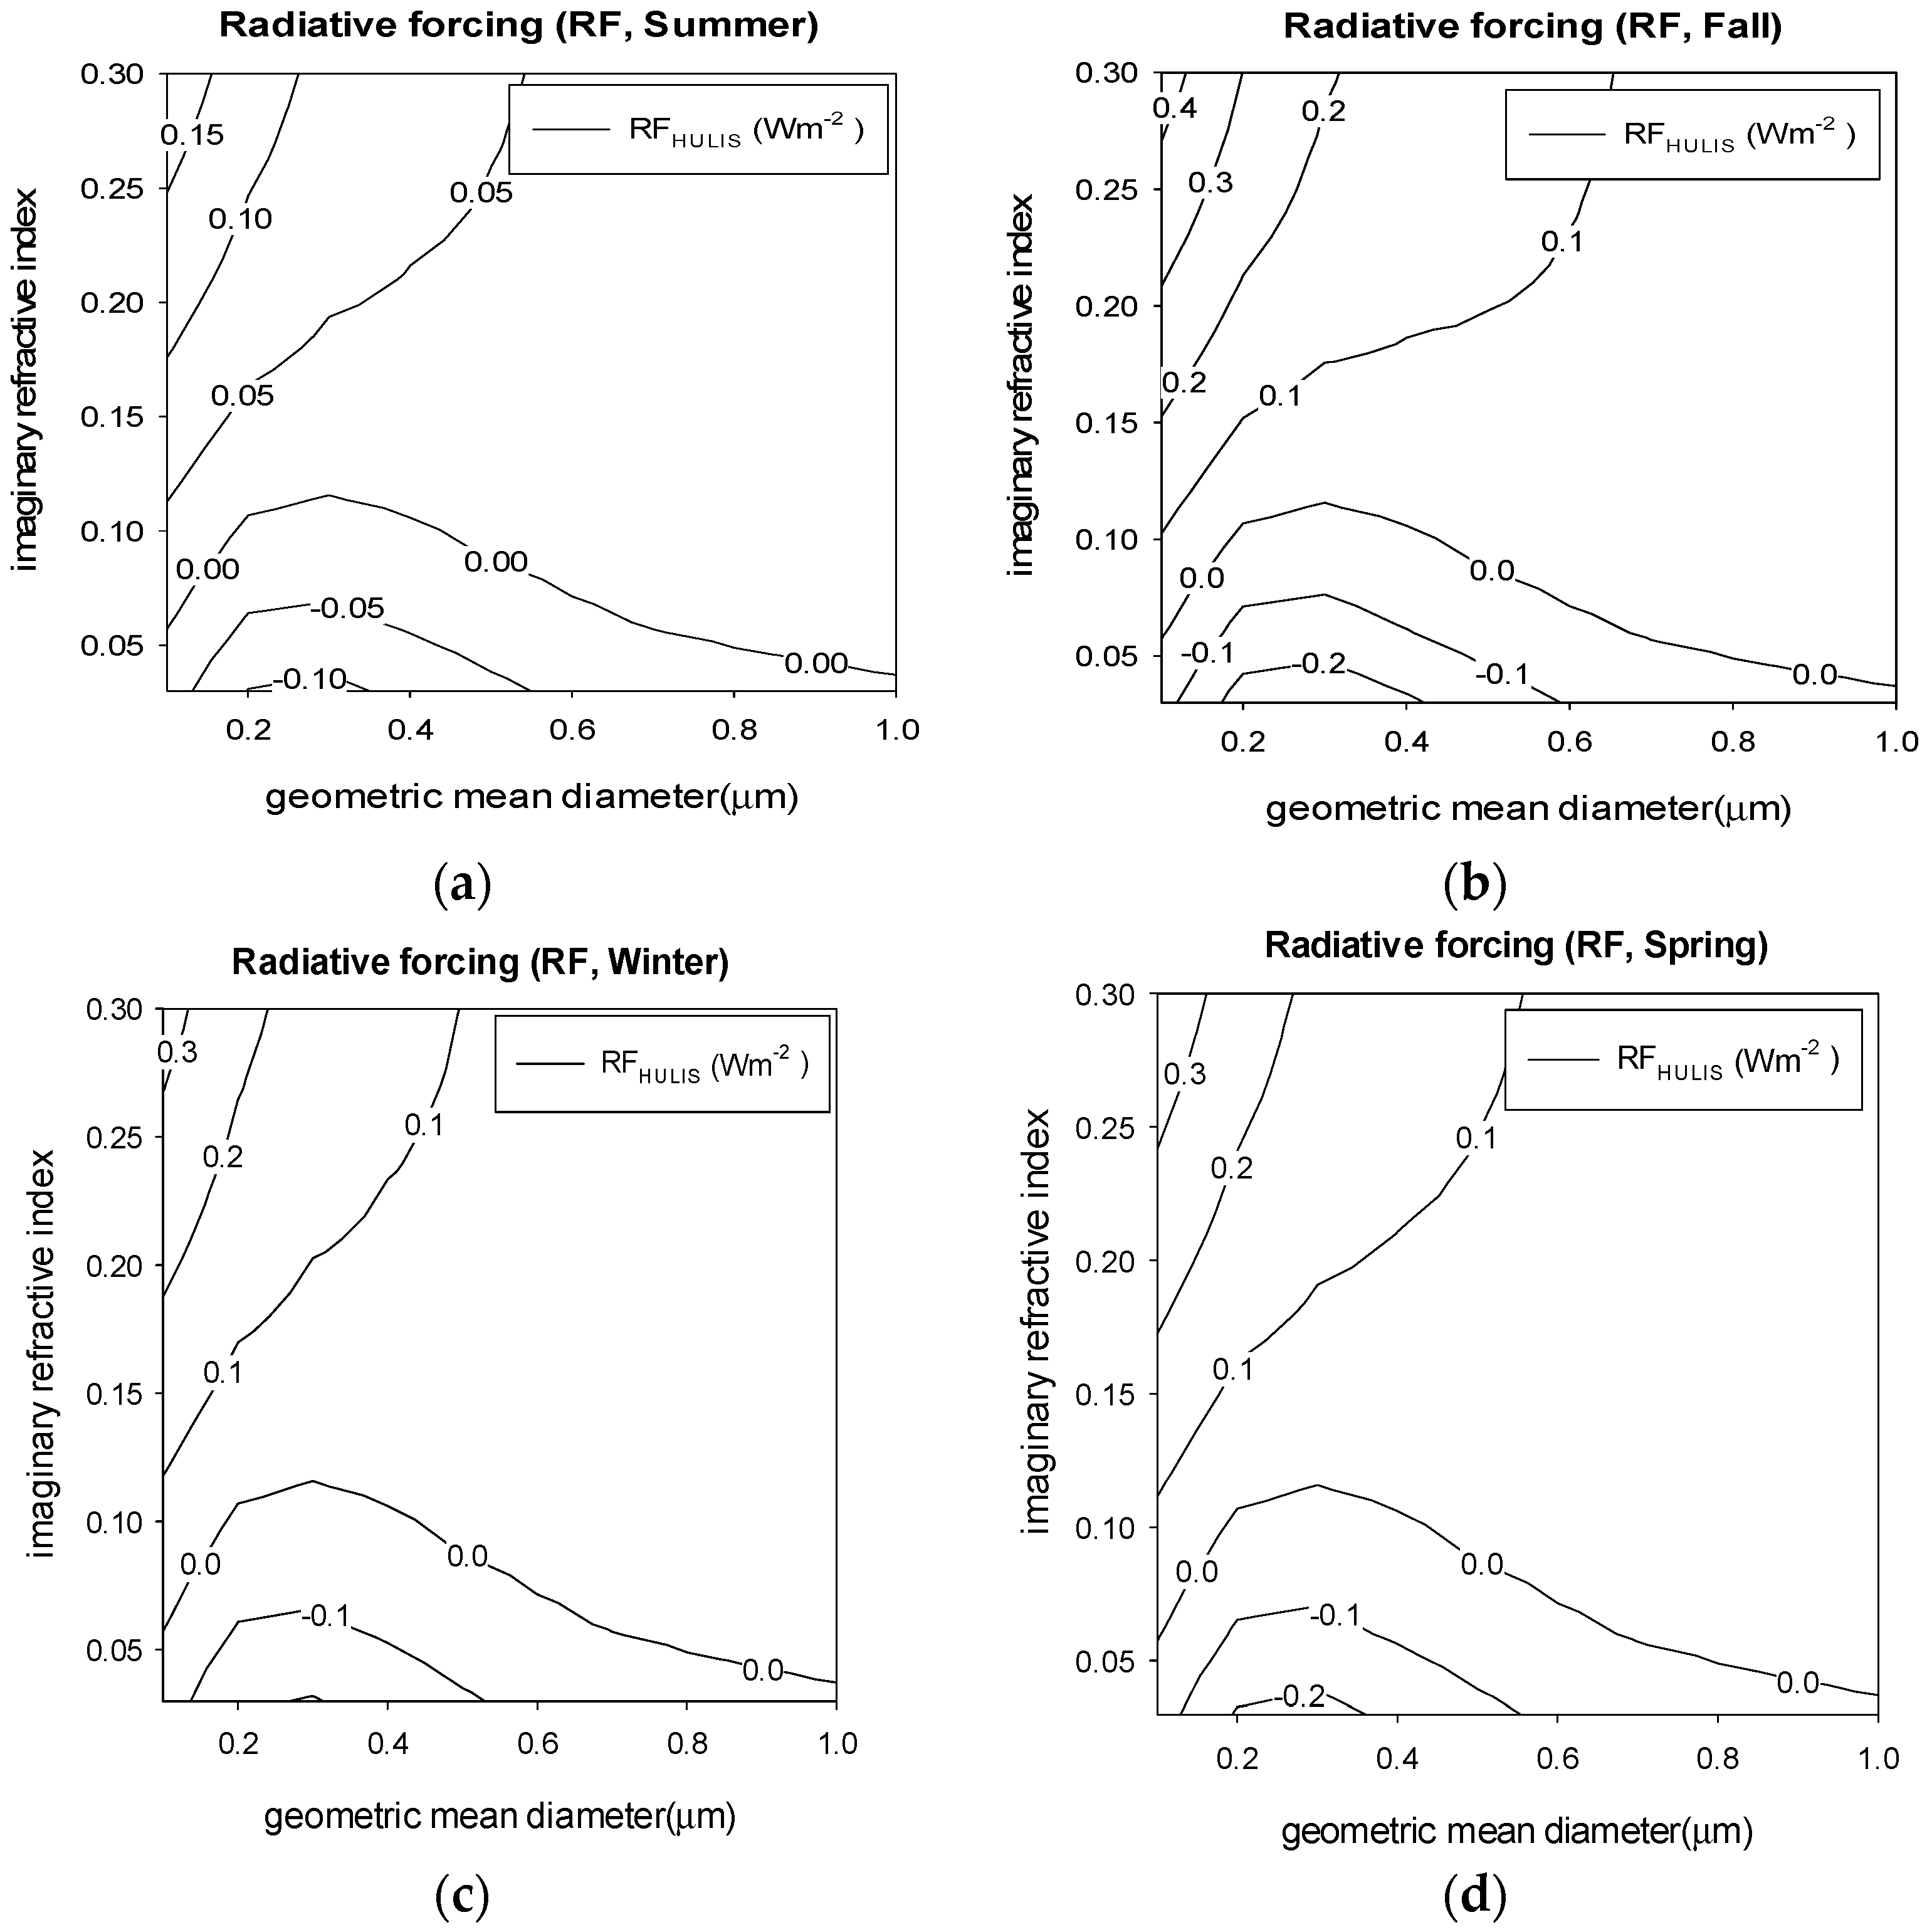
Figure 8 shows the seasonal contour plot of the RF of HULIS aerosols with a different geometric mean diameter (0.1–1 µm) and IRI (0.006–0.3) of HULIS. As shown in Figure 8, the RF becomes negative for low IRI and small geometric mean diameter. This means that HULIS can act as both a cooling and warming aerosol, depending on their imaginary refractive index and size distribution.
5. Conclusions
In this study, the optical properties of carbonaceous aerosol, especially HULIS, were investigated based on PM2.5 data measured over one year at Anmyeon Island, a GAW background site in Korea. The extinction, absorption coefficient, and RF were calculated, with particular focus on the hygroscopicity and light absorption properties of HULIS. The polydispersity effects on the optical properties were also considered by assuming a lognormal size distribution. The results showed that the IRI of HULIS plays an important role in estimating the aerosol optical properties, for extinction and absorption coefficients. For an absorption coefficient in a geometric mean diameter range from 0.1 to 1 µm and a geometric standard deviation from 1.1 to 2.0, EC ranges from 0.11 to 3.04 Mm−1 and HULIS varies from 0.09 to 11.64 Mm−1; this shows that EC and HULIS dominate the composition. The HULIS, in particular, comprises 32–81% of the carbonaceous absorption coefficient. This explains why the contribution of HULIS dominates the absorption properties of aerosols under any given set of simulation conditions.
This study also shows that the size distribution is an important parameter in estimating the aerosol optical properties. Considering the size distribution, for example, seasonal RF of EC ranges from +0.0022 in summer to +0.1325 W m−2 in spring. On the other hand, the RF of WISOC and residual WSOC ( = WSOC − HULIS) ranges from −0.0705 (in fall) to −0.0012 W m−2 (in spring), and −0.2151 (in spring) to −0.0022 W m−2 (in summer), respectively. In the case of HULIS, the RF ranges from −0.5023 to 0.4892 W m−2 in fall when the IRI varies from 0.006 to 0.3 under the given size range (a geometric mean diameter of 0.1–1.0 µm and a geometric standard deviation of 1.1–2.0). This means that HULIS plays a very important role in determining the RF.
Hygroscopicity and its influence on optical properties is also an important property of HULIS aerosols. The RF of HULIS negatively enhances from −0.11 to −0.192 W m−2 as the HGF increases from 1.0 to 1.3 because of the increase in water content. This means that the optical properties of HULIS are strongly dependent on the hygroscopicity. It is difficult to characterize the absorption properties of HULIS aerosols because of lot of uncertainty exists regarding their individual physicochemical and optical characteristics. Although this study estimates the range of HULIS optical properties by sensitivity calculation, there are still lots of parameters, such as size distribution and properties of individual particles, that need to be characterized more clearly. More detailed parameterizations based on each aerosol property remains to be investigated in further studies.
Acknowledgments
This research was supported by the Basic Science Research Program through the National Research Foundation of Korea (NRF), funded by the Ministry of Education (No. NRF-2015R1D1A1A09059906) and by the Korea Meteorological Administration Research and Development Program under grant CATER 2014-3190.
Author Contributions
Chang Hoon Jung and Ji Yi Lee designed the research and wrote the manuscript. Ji Yi Lee measured the data and Yong Pyo Kim performed the data analysis and interpreted the model results.
Conflicts of Interest
The authors declare no conflicts of interest.
References
- Putaud, J.P.; Raes, F.; van Dingenen, R.; Brüggemann, E.; Facchini, M.C.; Decesari, S.; Fuzzi, S.; Gehrig, R.; Hüglin, C.; Laj, P.; et al. A European aerosol phenomenology—2: Chemical characteristics of particulate matter at kerbside, urban, rural and background sites in Europe. Atmos. Environ. 2004, 38, 2579–2595. [Google Scholar] [CrossRef]
- Kanakidou, M.; Seinfeld, J.H.; Pandis, S.N.; Barnes, I.; Dentener, F.J.; Facchini, M.C.; Van Dingenen, R.; Ervens, B.; Nenes, A.; Nielsen, C.J.; et al. Organic aerosol and global climate modeling: A review. Atmos. Chem. Phys. 2005, 5, 1053–1123. [Google Scholar] [CrossRef]
- Murphy, D.M. Atmospheric science: Something in the air. Science 2005, 307, 1888–1890. [Google Scholar] [CrossRef] [PubMed]
- Duarte, R.M.; Santos, E.B.; Pio, C.A.; Duarte, A.C. Comparison of structural features of water-soluble organic matter from atmospheric aerosols with those of aquatic humic substances. Atmos. Environ. 2007, 41, 8100–8113. [Google Scholar] [CrossRef]
- Saxena, P.; Hildemann, L.M. Water-soluble organics in atmospheric particles: A critical review of the literature and application of thermodynamics to identify candidate compounds. J. Atmos. Chem. 1996, 24, 57–109. [Google Scholar] [CrossRef]
- Graber, E.R.; Rudich, Y. Atmospheric HULIS: How humic like are they? A comprehensive and critical review. Atmos. Chem. Phys. 2006, 6, 729–753. [Google Scholar] [CrossRef]
- Rastogi, N.; Patel, A.; Singh, A.; Singh, D. Diurnal variability in secondary organic aerosol formation over the Indo-Gangetic plain during winter using online measurement of water-soluble organic carbon. Aerosol Air Qual. Res. 2015, 15, 2225–2231. [Google Scholar] [CrossRef]
- Fermo, P.; Piazzalunga, A.; Tuccillo, F.; Brambilla, L.; Cazzuli, O.; Vecchi, R.; Valli, G. Analytical methods for quantification and characterization of HULIS (humic like substances) in atmospheric aerosol. In Proceedings of the European Aerosol Conference 2009, Karlsruhe, Germany, 6–11 September 2009. [Google Scholar]
- Feczko, T.; Puxbaum, H.; Kasper-Giebl, A.; Handler, M.; Limbeck, A.; Gelencser, A.; Pio, C.; Preunkert, S.; Legrand, M. Determination of water and alkaline extractable atmospheric humic-like substances with the TU Vienna HULIS analyzer in samples from six background sites in Europe. J. Geophys. Res. 2007, 112, D23S10. [Google Scholar] [CrossRef]
- Kirchstetter, T.W.; Novakov, T.; Hobbs, P.V. Evidence that the spectral dependence of light absorption by aerosols is affected by organic carbon. J. Geophys. Res. Atmos. 2004, 109, D21208. [Google Scholar] [CrossRef]
- Hoffer, A.; Gelencser, A.; Guyon, P.; Kiss, G.; Schmid, O.; Frank, G.P.; Artaxo, P.; Andreae, M.O. Optical properties of Humic-Like Substances (HULIS) in biomass burning aerosols. Atmos. Chem. Phys. 2006, 6, 3563–3570. [Google Scholar] [CrossRef]
- Laskin, A.; Laskin, J.; Nizkorodov, S.A. Chemistry of atmospheric brown carbon. Chem. Rev. 2015, 115, 4335–4382. [Google Scholar] [CrossRef] [PubMed]
- Limbeck, A.; Kulmala, M.; Puxbaum, H. Secondary organic aerosol formation in the atmosphere via heterogeneous reaction of gaseous isoprene on acidic particles. Geophys. Res. Lett. 1996, 30, 1996. [Google Scholar] [CrossRef]
- Andreae, M.O.; Gelencser, A. Black carbon or brown carbon? The nature of light-absorbing carbonaceous aerosols. Atmos. Chem. Phys. 2006, 6, 3131–3148. [Google Scholar] [CrossRef]
- Costabile, F.; Gilardoni, S.; Barnaba, F.; Ianni, A.D.; Liberto, L.D.; Dionisi, D.; Manigrasso, M.; Paglione, M.; Poluzzi, V.; Rinaldi, M.; et al. Characteristics of brown carbon in the urban Po Valley atmosphere. Atmos. Chem. Phys. 2017, 17, 313–326. [Google Scholar] [CrossRef]
- Gilardoni, S.; Massoli, P.; Paglione, M.; Giulianelli, L.; Carbone, C.; Rinaldi, M.; Decesari, S.; Sandrini, S.; Costabile, F.; Gobbi, G.P.; et al. Direct observation of aqueous secondary organic aerosol from biomass burning emissions. Proc. Natl. Acad. Sci. USA 2016, 113, 10013–10018. [Google Scholar] [CrossRef] [PubMed]
- Galloway, M.M.; Chhabra, P.S.; Chan, A.W.H.; Surratt, J.D.; Flagan, R.C.; Seinfeld, J.H.; Keutsch, F.N. Glyoxal uptake on ammonium sulphate seed aerosol: Reaction products and reversibility of uptake under dark and irradiated conditions. Atmos. Chem. Phys. 2009, 9, 3331–3345. [Google Scholar] [CrossRef]
- Utry, N.; Ajtai, T.; Filep, T.; Pinter, M.; Hoffer, A.; Bozoki, Z.; Szabo, G. Mass specific optical absorption coefficient of HULIS aerosol measured by a four-wavelength photoacoustic spectrometer at NIR, VIS and UV wavelengths. Atmos. Environ. 2013, 69, 321–324. [Google Scholar] [CrossRef]
- Chen, Q.; Ikemori, F.; Higo, H.; Asakawa, D.; Mochida, M. Chemical structural characteristics of HULIS and other fractionated organic matter in urban aerosols: Results from mass spectral and FT-IR analysis. Environ. Sci. Technol. 2016, 50, 1721–1730. [Google Scholar] [CrossRef] [PubMed]
- Tan, J.; Xiang, P.; Zhou, X.; Duan, J.; Ma, Y.; He, K.; Cheng, Y.; Yu, J.; Querol, X. Chemical characterization of humic-like substances (HULIS) in PM2.5 in Lanzhou, China. Sci. Total Environ. 2016, 573, 1481–1490. [Google Scholar] [CrossRef] [PubMed]
- Intergovernmental Panel on Climate Change. Climate Change 2013: The Physical Science Basis. Contribution of Working Group I to the Fifth Assessment Report of the Intergovernmental Panel on Climate Change, Chapter 7: Clouds and Aerosols; Stocker, T.F., Qin, D., Plattner, G.-K., Tignor, M., Allen, S.K., Boschung, J., Nauels, A., Xia, Y., Bex, V., Midgley, P.M., Eds.; Cambridge University Press: Cambridge, UK; New York, NY, USA, 2013. [Google Scholar]
- Bond, T.C.; Doherty, S.J.; Fahey, D.W.; Forster, P.M.; Berntsen, T.; DeAngelo, B.J.; Flanner, M.G.; Ghan, S.; Kärcher, B.; Koch, D.; et al. Bounding the role of black carbon in the climate system: A scientific assessment. J. Geophys. Res. 2013, 118, 5380–5552. [Google Scholar] [CrossRef]
- Dinar, E.; Mentel, T.F.; Rudich, Y. The density of humic acids and humic like substances (HULIS) from fresh and aged wood burning and pollution aerosol particles. Atmos. Chem. Phys. 2006, 6, 5213–5224. [Google Scholar] [CrossRef]
- Ziese, M.; Wex, H.; Nilsson, E.D.; Salma, I.; Ocskay, R.; Hennig, T.; Massling, A.; Stratmann, F. Hygroscopic growth and activation of HULIS particles: Experimental data and a new iterative parameterization scheme for complex aerosol particles. Atmos. Chem. Phys. 2008, 8, 1855–1866. [Google Scholar] [CrossRef]
- Lin, P.; Engling, G.; Yu, J.Z. Humic-like substances in fresh emissions of rice straw burning and in ambient aerosols in the Pearl River Delta Region, China. Atmos. Chem. Phys. 2010, 10, 6487–6500. [Google Scholar] [CrossRef]
- Mallet, M.; Roger, J.C.; Despiau, S.; Putaud, J.P.; Dubovik, O. A study of the mixing state of black carbon in urban zone. J. Geophys. Res. 2004, 109, D04202. [Google Scholar] [CrossRef]
- Hess, M.; Koepke, P.; Schult, I. Optical Properties of aerosols and clouds: The software package OPAC. Bull. Am. Meteorol. Soc. 1998, 79, 831–844. [Google Scholar] [CrossRef]
- Kinne, S.; Lohmann, U.; Feichter, J.; Schulz, M.; Timmreck, C.; Ghan, S.; Easter, R.; Chin, M.; Ginoux, P.; Takemura, T.; et al. Monthly averages of aerosol properties: A global comparison among models, satellite data, and AERONET ground data. J. Geophys. Res. Atmos. 2003, 108, D20. [Google Scholar] [CrossRef]
- Dinar, E.; Taraniuk, I.; Graber, E.R.; Anttila, T.; Mentel, T.F.; Rudich, Y. Hygroscopic growth of atmospheric and model humic-like substances. J. Geophys. Res. 2007, 112, D05211. [Google Scholar] [CrossRef]
- Alexander, D.T.L.; Crozier, P.A.; Anderson, J.R. Brown carbon spheres in East Asian outflow and their optical properties. Science 2008, 321, 833–836. [Google Scholar] [CrossRef] [PubMed]
- Jung, C.H.; Lee, J.Y.; Kim, Y.P. Estimation of aerosol optical properties considering hygroscopicity and light absorption. Atmos. Environ. 2015, 105, 191–201. [Google Scholar] [CrossRef]
- Ruehl, C.R.; Chuang, P.Y.; Nenes, A. Aerosol hygroscopicity at high (99 to 100%) relative humidities. Atmos. Chem. Phys. 2010, 10, 1329–1344. [Google Scholar] [CrossRef]
- Liu, X.; Wang, J. How important is organic aerosol hygroscopicity to aerosol indirect forcing? Environ. Res. Lett. 2010, 5, 044010. [Google Scholar] [CrossRef]
- Carrico, C.M.; Petters, M.D.; Kreidenweis, S.M.; Collett, J.L., Jr.; Engling, G.; Malm, W.C. Aerosol hygroscopicity and cloud droplet activation of extracts of filters from biomass burning experiments. J. Geophys. Res. 2008, 113, D08206. [Google Scholar] [CrossRef]
- Gysel, M.; Weingartner, E.; Nyeki, S.; Paulsen, D.; Baltensperger, U.; Galambos, I.; Kiss, G. Hygroscopic properties of water-soluble matter and humic-like organics in atmospheric fine aerosol. Atmos. Chem. Phys. 2004, 4, 35–50. [Google Scholar] [CrossRef]
- Fors, E.O.; Rissler, J.; Massling, A.; Svenningsson, B.; Andreae, M.O.; Dusek, U.; Frank, G.P.; Hoffer, A.; Bilde, M.; Kiss, G.; et al. Hygroscopic properties of Amazonian biomass burning and European background HULIS and investigation of their effects on surface tension with two models linking H-TDMA to CCNC data. Atmos. Chem. Phys. 2010, 10, 5625–5639. [Google Scholar] [CrossRef]
- Jacobson, M.Z. Strong radiative heating due to the mixing state of black carbon in atmospheric aerosols. Nature 2001, 409, 695–697. [Google Scholar] [CrossRef] [PubMed]
- Bond, T.C.; Bergstrom, R.W. Light absorption by carbonaceous particles: An investigative review. Aerosol Sci. Technol. 2006, 40, 27–67. [Google Scholar] [CrossRef]
- Chylek, P.; Wong, J. Effect of absorbing aerosol on global radiation budget. Geophys. Res. Lett. 1995, 22, 929–931. [Google Scholar] [CrossRef]
- Lohmann, U.; Feichter, J. Global indirect aerosol effects: A review. Atmos. Chem. Phys. 2005, 5, 715–737. [Google Scholar] [CrossRef]
- Charlson, R.J.; Schwartz, S.E.; Hales, J.M.; Cess, R.D.; Coakley, J.A.; Hansen, J.E.; Hofmann, D.J. Climate forcing by anthropogenic aerosols. Science 1992, 255, 423–430. [Google Scholar] [CrossRef] [PubMed]
- Haywood, J.M.; Shine, K.P. The effect of anthropogenic sulfate and soot aerosol on the clear sky planetary radiation budget. Geophys. Res. Lett. 1995, 22, 602–606. [Google Scholar] [CrossRef]
- Baduel, C.; Voisin, D.; Jaffrezo, J.-L. Seasonal variations of concentrations and optical properties of water soluble HULIS collected in urban environments. Atmos. Chem. Phys. 2010, 10, 4085–4095. [Google Scholar] [CrossRef]
- Lukács, H.; András Gelencsér, A.; Hammer, S.; Puxbaum, H.; Pio, C.; Legrand, M.; Kasper-Giebl, A.; Handler, M.; Limbeck, A.; Simpson, D.; et al. Seasonal trends and possible sources of brown carbon based on 2-year aerosol measurements at six sites in Europe. J. Geophy. Res. 2007, 112, D23S18. [Google Scholar] [CrossRef]
- Zhao, M.; Huang, Z.; Qiao, T.; Zhang, Y.; Xiu, G.; Yu, J. Chemical characterization, the transport pathways and potential sources of PM2.5 in Shanghai: Seasonal variations. Atmos. Res. 2015, 158, 66–78. [Google Scholar] [CrossRef]
- Gertler, C.G.; Puppala, S.P.; Panday, A.; Stumm, D.; Shea, J. Black carbon and the Himalayan cryosphere: A review. Atmos. Environ. 2016, 125, 404–417. [Google Scholar] [CrossRef]
- Wang, X.; Xu, B.; Ming, J. An overview of the studies on black carbon and mineral dust deposition in snow and ice cores in East Asia. J. Meteorol. Res. 2014, 28, 354–370. [Google Scholar] [CrossRef]
- Moise, T.; Flores, J.M.; Rudich, Y. Optical properties of secondary organic aerosols and their changes by chemical processes. Chem. Rev. 2015, 115, 4400–4439. [Google Scholar] [CrossRef] [PubMed]
- Heald, C.L.; Ridley, D.A.; Kroll, J.H.; Barrett, S.R.H.; Cady-Pereira, K.E.; Alvarado, M.J.; Holmes, C.D. Contrasting the direct radiative effect and direct radiative forcing of aerosols. Atmos. Chem. Phys. 2014, 14, 5513–5527. [Google Scholar] [CrossRef]
- Moffet, R.C.; Prather, K.A. In-situ measurements of the mixing state and optical properties of soot with implications for radiative forcing estimates. Proc. Natl. Acad. Sci. USA 2009, 106, 11872–11877. [Google Scholar] [CrossRef] [PubMed]
- Kim, M.Y.; Lee, S.B.; Bae, G.N.; Park, S.S.; Han, K.M.; Park, R.S.; Song, C.H.; Park, S.H. Distribution and direct radiative forcing of black carbon aerosols over Korean Peninsula. Atmos. Environ. 2012, 58, 42–55. [Google Scholar] [CrossRef]
- Kim, N.K.; Kim, Y.P.; Kang, C.H. Long-term trend of aerosol composition and direct radiative forcing due to aerosols over Gosan: TSP, PM10, and PM2.5 data between 1992 and 2008. Atmos. Environ. 2011, 45, 6107–6115. [Google Scholar] [CrossRef]
Figure 1.
Seasonal variation of the concentrations of carbonaceous species in PM2.5 measured at Anmyeon Station. (a) Seasonal average mass concentration; and (b) relative fractions of WSOC (Water Soluble Organic Carbon), WISOC (Water Insoluble Organic Carbon), EC (Elemental Carbon), and HULIS (HUmic LIke Substances).
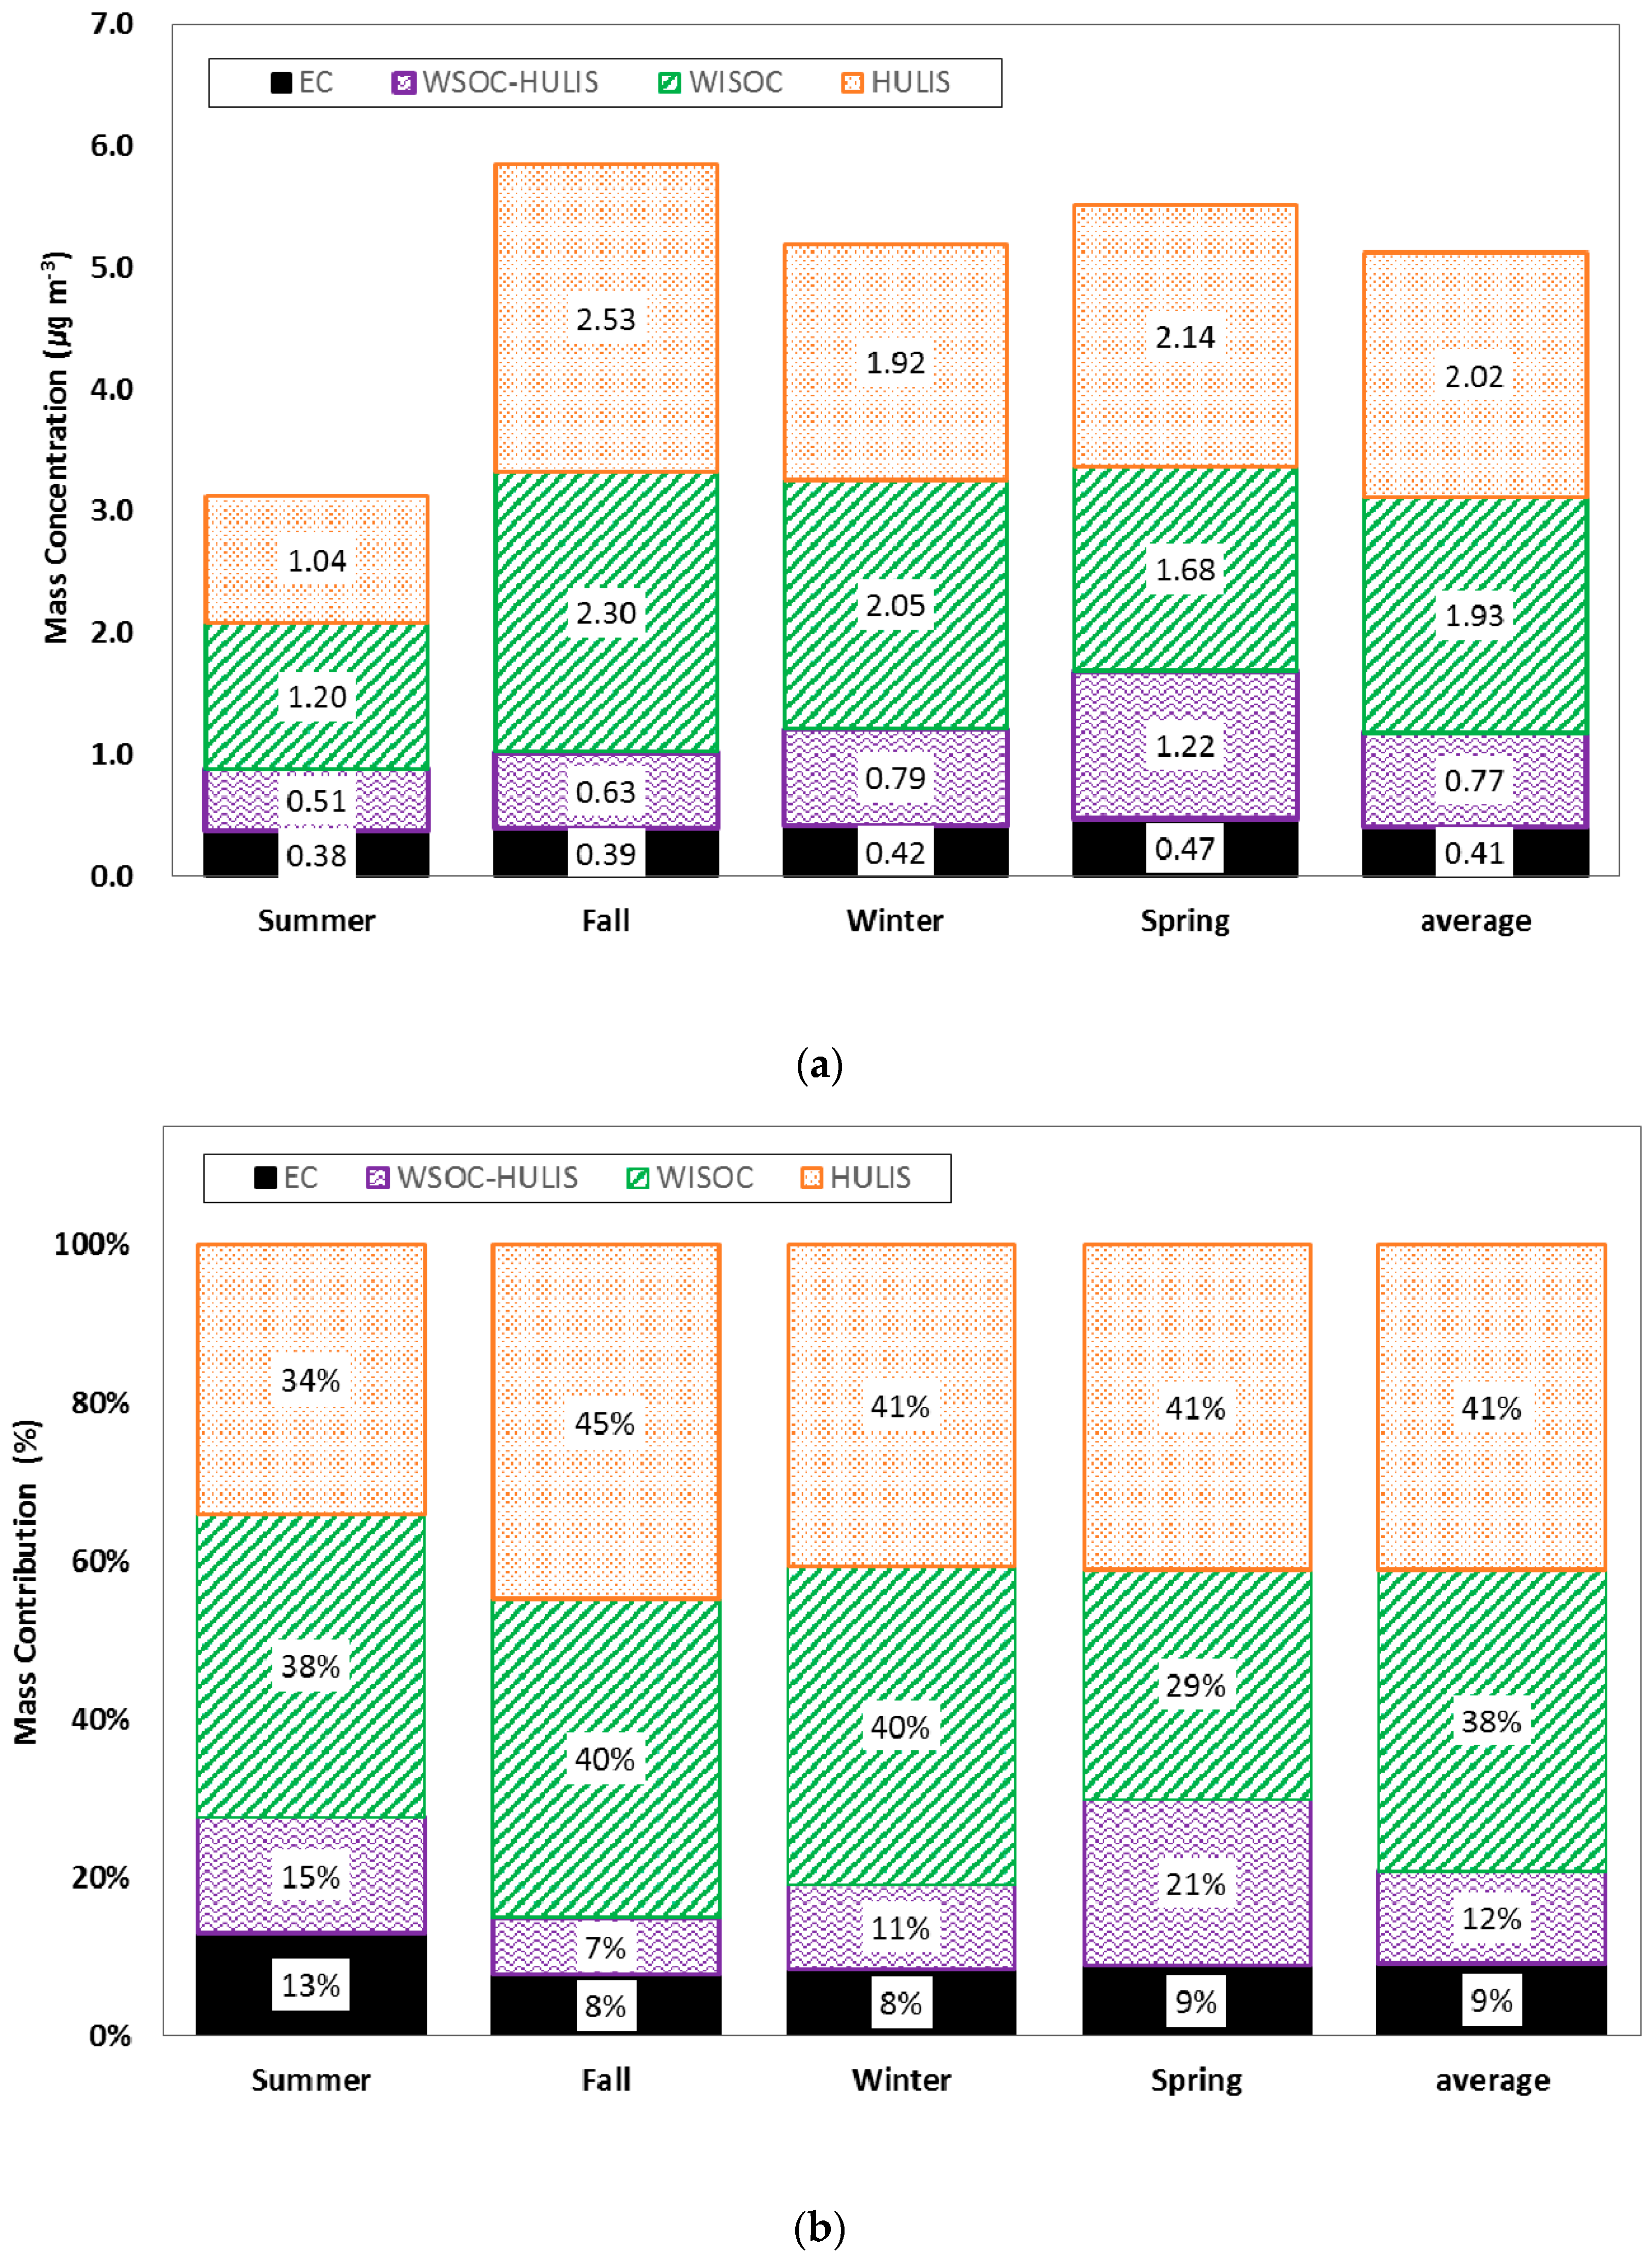
Figure 2.
Schematic diagram of the aerosol optical model for carbonaceous aerosols.
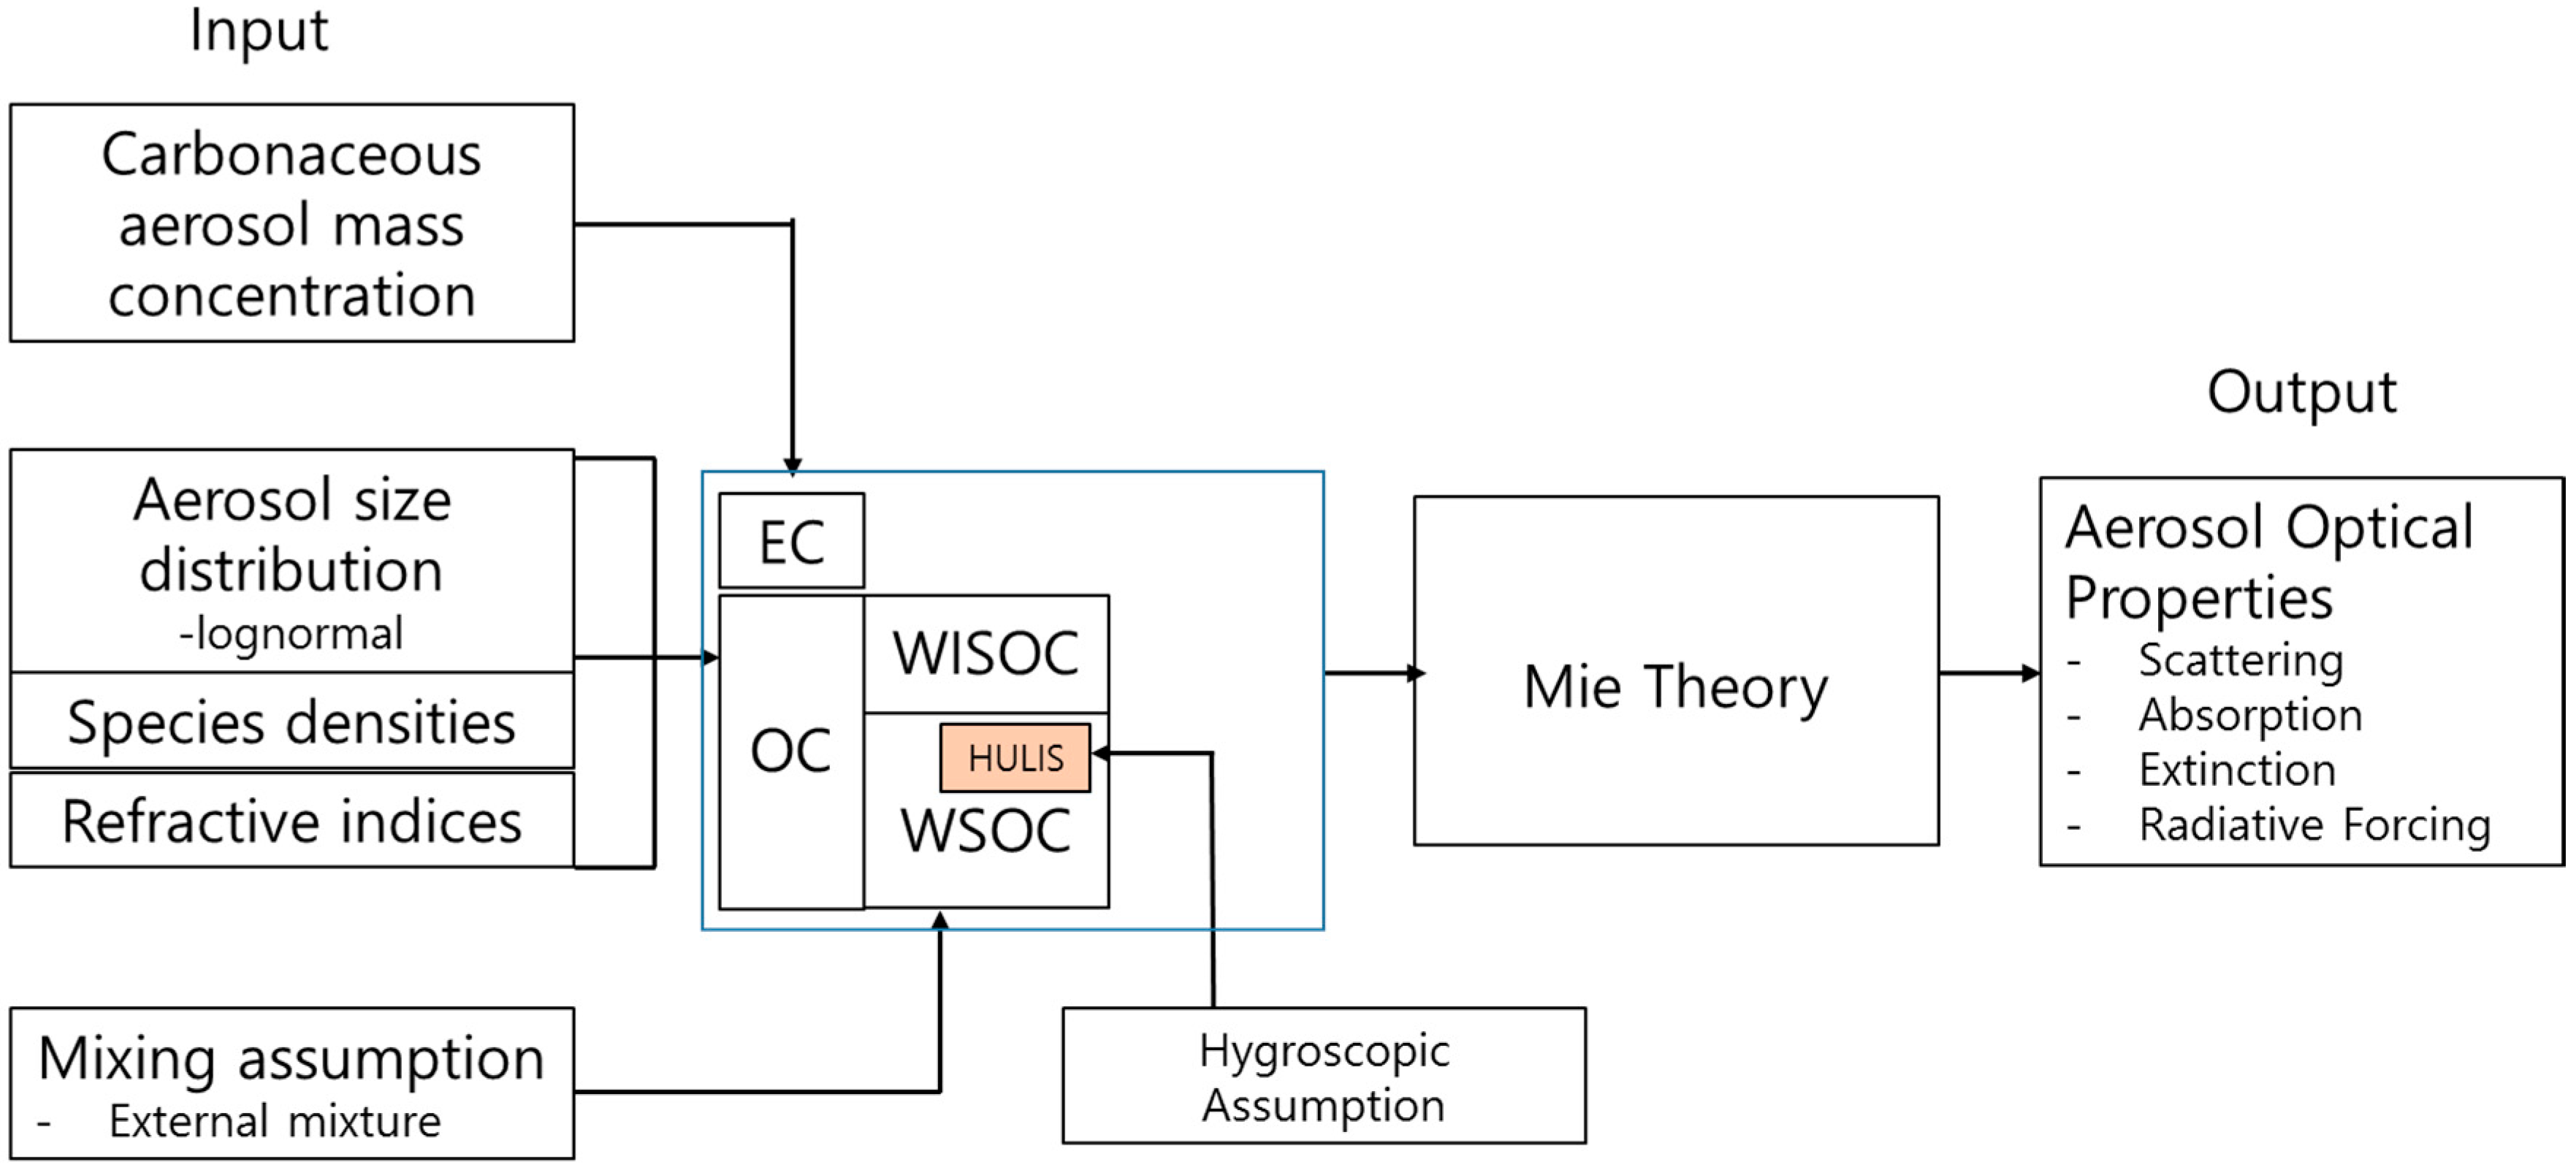
Figure 3.
Contribution of each carbonaceous component to the daily averaged optical properties. (a) Extinction coefficient when IRI = 0.006; (b) absorption coefficient when IRI = 0.006; (c) absorption coefficient when IRI = 0.3 for HULIS; and (d) absorption coefficient when IRI = 0.3. Size parameters are fixed, dg = 0.1 µm, for EC and 0.5 µm for organic aerosols, and σg = 1.5.

Figure 4.
Seasonal variation of the range of (a) extinction and (b) absorption coefficients for each carbonaceous component (0.1 µm < dg < 1.0 µm, 1.1 < σg < 2.0, 0.006 < HULIS IRI < 0.3).
Figure 4.
Seasonal variation of the range of (a) extinction and (b) absorption coefficients for each carbonaceous component (0.1 µm < dg < 1.0 µm, 1.1 < σg < 2.0, 0.006 < HULIS IRI < 0.3).
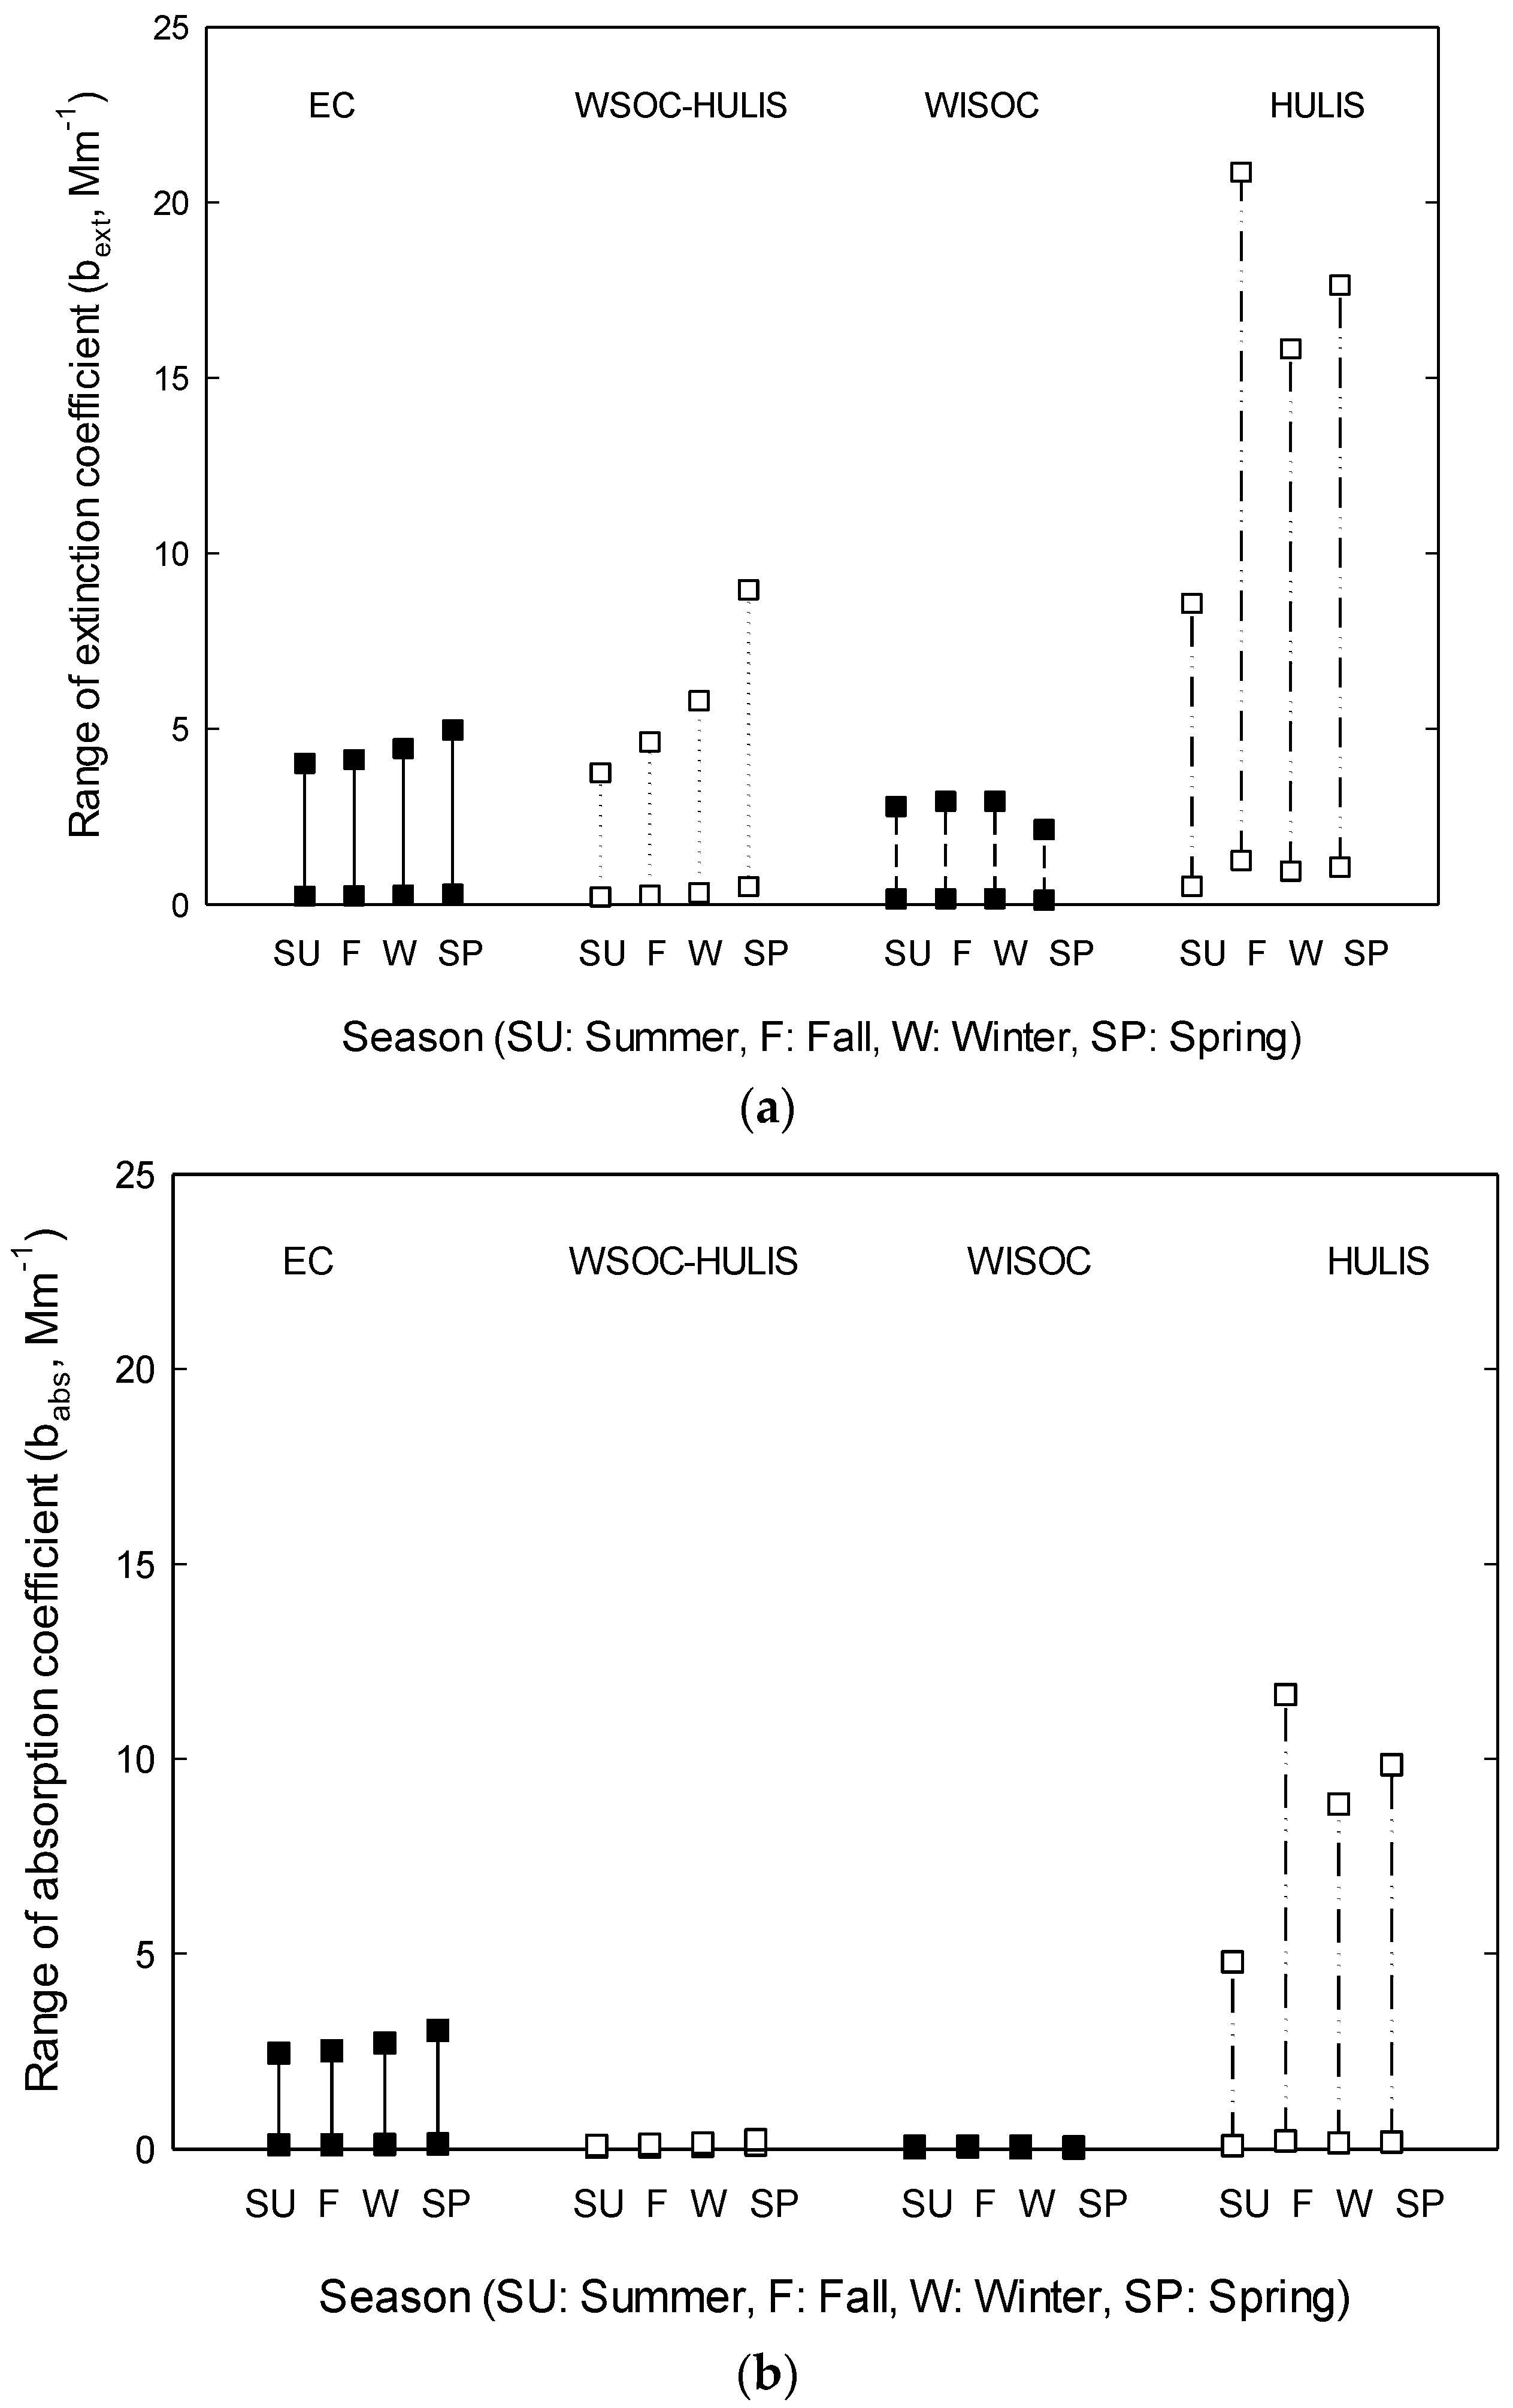
Figure 5.
Seasonal variation of RF (Radiative Forcing) for each carbonaceous aerosol (0.1 µm < dg < 1.0 µm, 1.1 < σg < 2.0, 0.006 < HULIS IRI < 0.3) in (a) summer; (b) fall; (c) winter; and (d) spring.
Figure 5.
Seasonal variation of RF (Radiative Forcing) for each carbonaceous aerosol (0.1 µm < dg < 1.0 µm, 1.1 < σg < 2.0, 0.006 < HULIS IRI < 0.3) in (a) summer; (b) fall; (c) winter; and (d) spring.
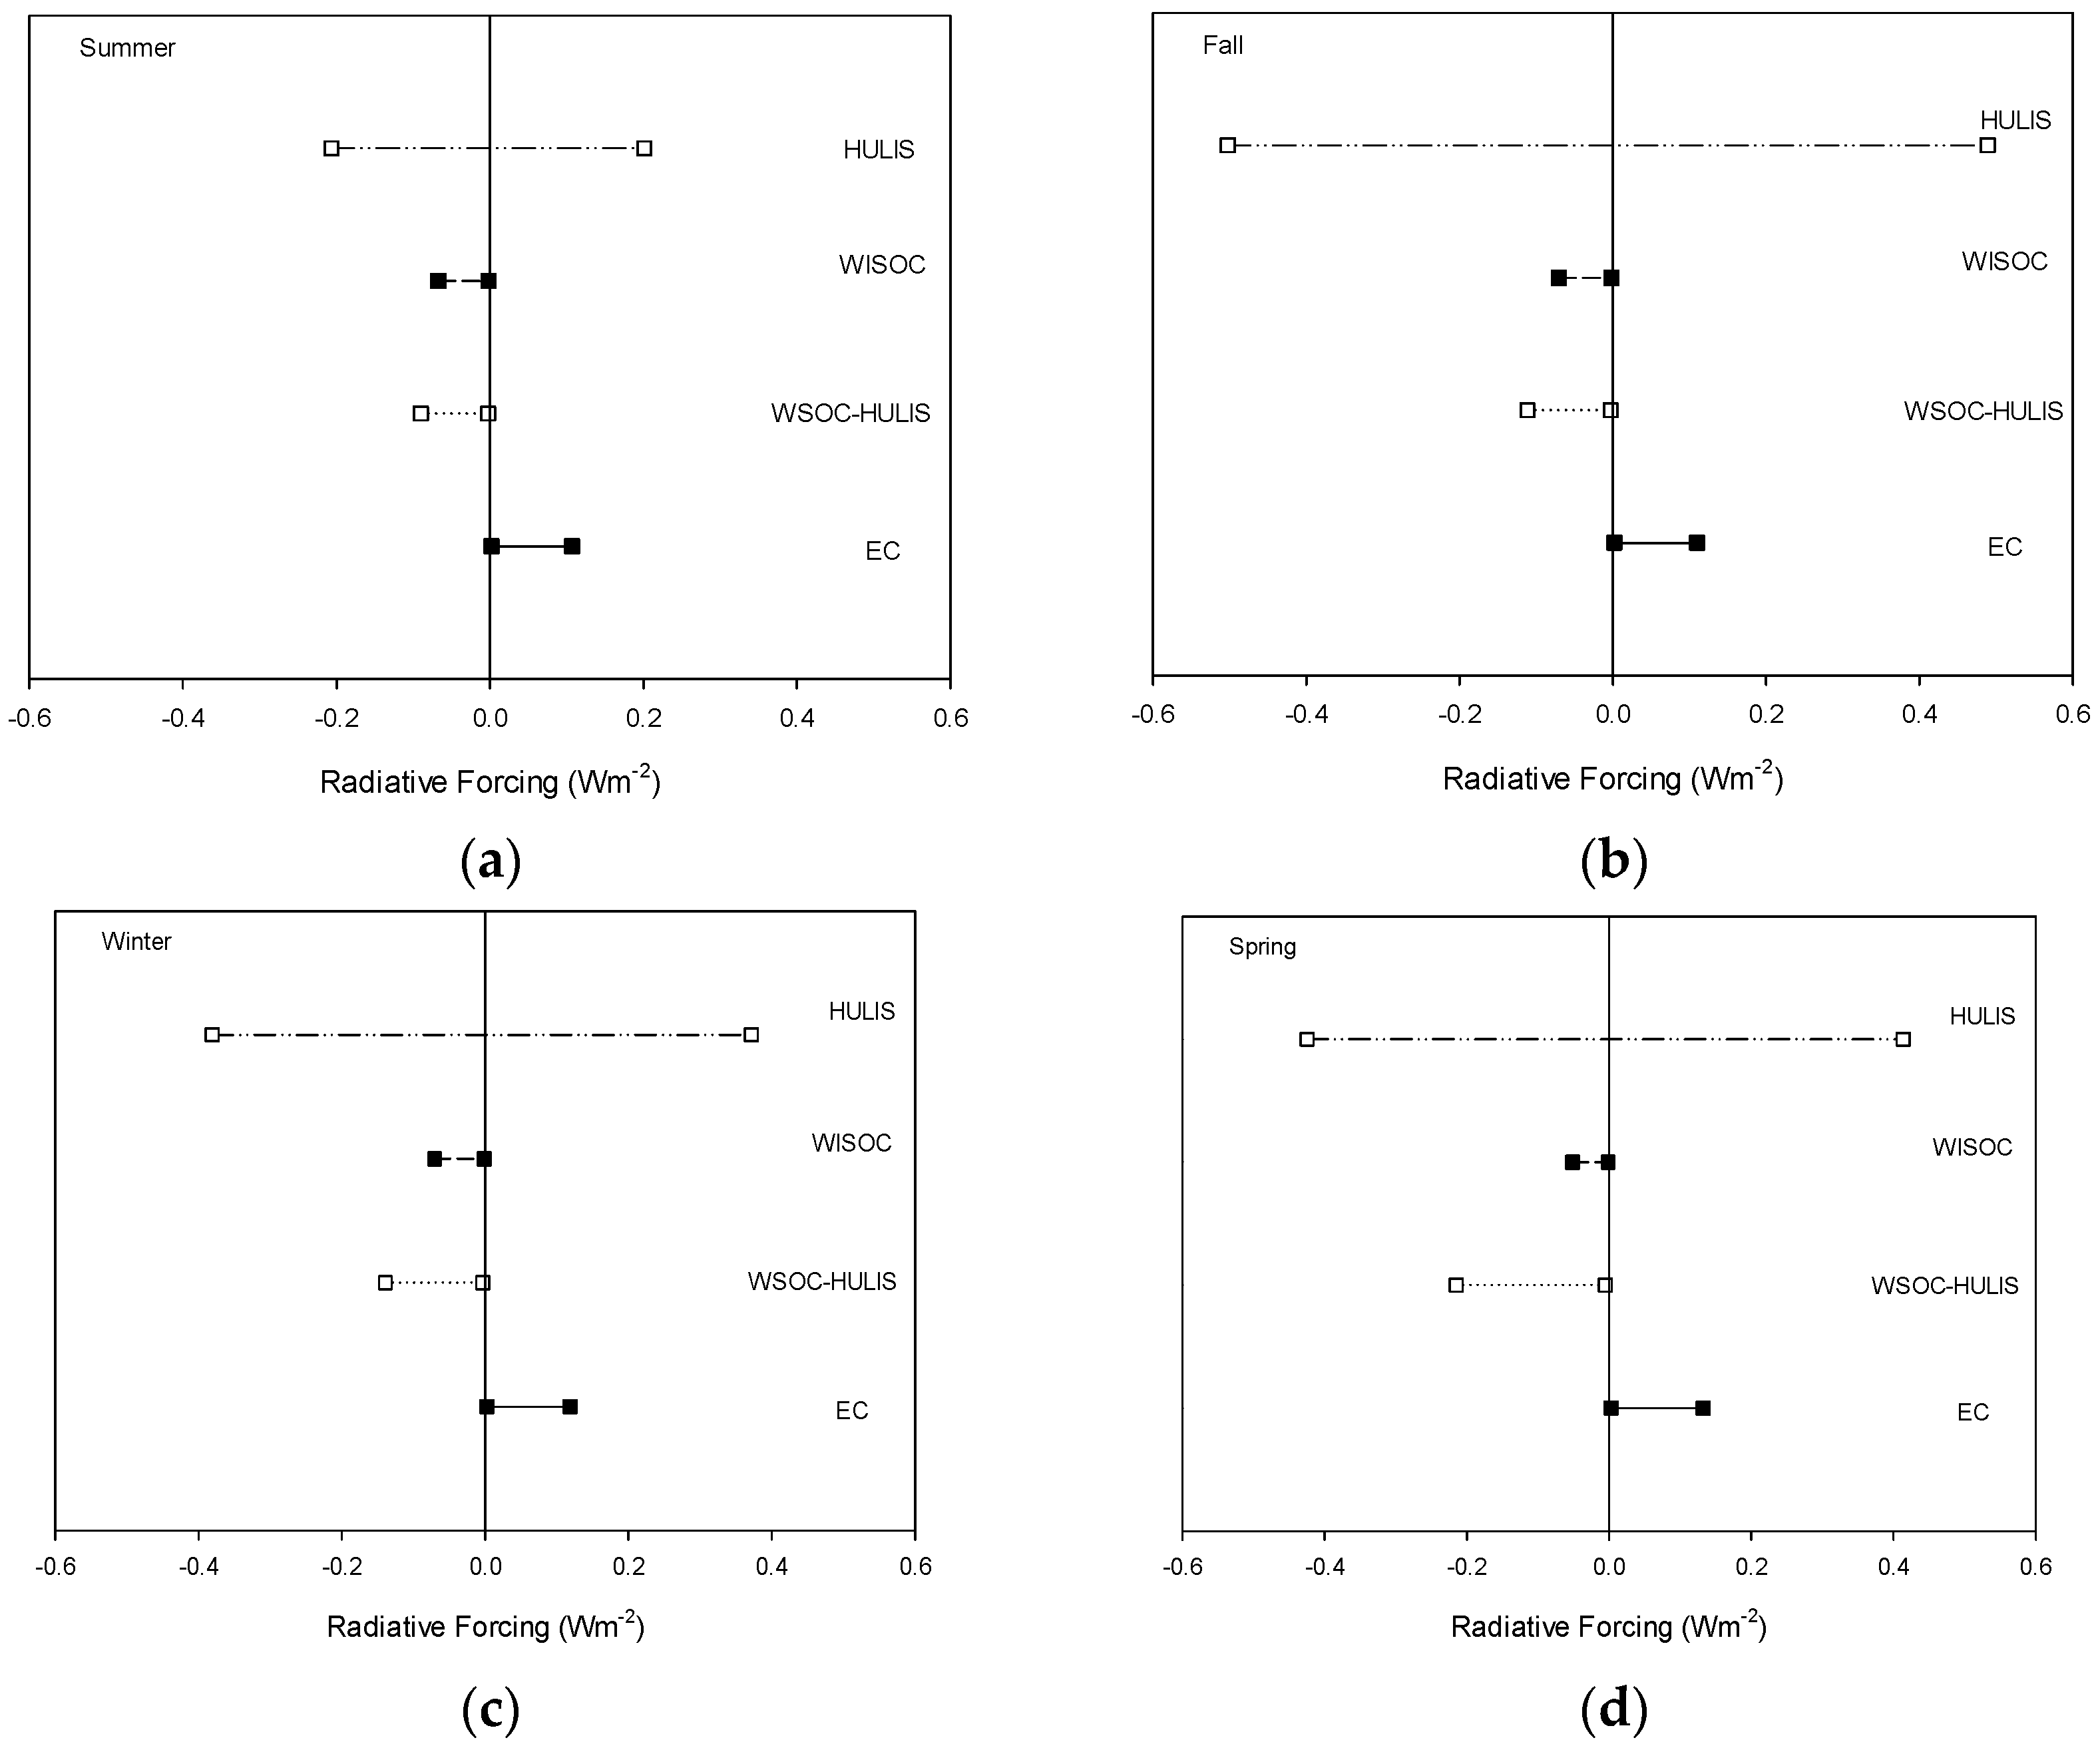
Figure 6.
Seasonal variations of (a) radiative forcing (RF) and (b) extinction coefficient of HULIS aerosol as a function of HGF (Hygroscopic factor) (IRI: 0.006, dg = 0.5 µm, σg = 1.5).
Figure 6.
Seasonal variations of (a) radiative forcing (RF) and (b) extinction coefficient of HULIS aerosol as a function of HGF (Hygroscopic factor) (IRI: 0.006, dg = 0.5 µm, σg = 1.5).

Figure 7.
Contour plot of HULIS aerosol extinction coefficient in (a) summer; (b) fall; (c) winter; and (d) spring, and the absorption coefficient in (e) summer; (f) fall; (g) winter; and (h) spring with the range of various geometric mean diameters and the IRI of HULIS aerosols (0.1 µm < dg < 1.0 µm, σg = 1.5, 0.006 < HULIS IRI < 0.3).

Figure 8.
Contour plot of HULIS aerosol RF in the range of various geometric mean diameters and the IRI of HULIS aerosols (0.1 µm < dg < 1.0 µm, σg = 1.5, 0.006 < HULIS IRI < 0.3) in (a) summer; (b) fall; (c) winter; and (d) spring.
Figure 8.
Contour plot of HULIS aerosol RF in the range of various geometric mean diameters and the IRI of HULIS aerosols (0.1 µm < dg < 1.0 µm, σg = 1.5, 0.006 < HULIS IRI < 0.3) in (a) summer; (b) fall; (c) winter; and (d) spring.

Table 1.
Refractive indices and densities of carbonaceous aerosols used in this study at a wavelength of 0.55 µm [27,28,30]. Note that a range is given for the imaginary refractive index values for HULIS.
| Composition | Refractive Index (550 nm) | Density (g/cm3) | |
|---|---|---|---|
| Real | Imaginary | ||
| Refractive Index | Refractive Index | ||
| EC | 1.9 | 0.66i | 1.7 |
| HULIS | 1.595 | 0.006i–0.3i | 1.4 |
| WSOC-HULIS | 1.53 | 0.006i * | 1.4 |
| WISOC | 1.53 | 0.006i * | 1.4 |
* The IRI (Imaginary Refractive Index) of 0.3 for Organic Carbon (WSOC, WISOC) was also considered and the result is shown in Figure 3d.
Table 2.
Seasonal variation of radiative forcing when the imaginary refractive index of HULIS changes from 0.006 to 0.3. (0.1 µm < dg < 1.0 µm, 1.1< σg <2.0, 0.006 < HULIS IRI < 0.3).
Table 2.
Seasonal variation of radiative forcing when the imaginary refractive index of HULIS changes from 0.006 to 0.3. (0.1 µm < dg < 1.0 µm, 1.1< σg <2.0, 0.006 < HULIS IRI < 0.3).
| Radiative Forcing (W m−2) | Min/Max | Summer | Fall | Winter | Spring | Average |
|---|---|---|---|---|---|---|
| EC | Min | 0.0022 | 0.0022 | 0.0024 | 0.0027 | 0.0023 |
| Max | 0.1071 | 0.1099 | 0.1184 | 0.1325 | 0.1156 | |
| WISOC | Min | −0.067 | −0.0705 | −0.0705 | −0.0511 | −0.0667 |
| Max | −0.0016 | −0.0017 | −0.0017 | −0.0012 | −0.0016 | |
| WSOC-HULIS | Min | −0.0899 | −0.1110 | −0.1393 | −0.2151 | −0.1358 |
| Max | −0.0022 | −0.0027 | −0.0034 | −0.0052 | −0.0033 | |
| HULIS | Min | −0.2065 | −0.5023 | −0.3811 | −0.4248 | −0.4010 |
| Max | 0.2011 | 0.4892 | 0.3713 | 0.4138 | 0.3906 |
© 2017 by the authors. Licensee MDPI, Basel, Switzerland. This article is an open access article distributed under the terms and conditions of the Creative Commons Attribution (CC BY) license (http://creativecommons.org/licenses/by/4.0/).
Share and Cite
MDPI and ACS Style
Lee, J.Y.; Jung, C.H.; Kim, Y.P. Estimation of Optical Properties for HULIS Aerosols at Anmyeon Island, Korea. Atmosphere 2017, 8, 120. https://doi.org/10.3390/atmos8070120
AMA Style
Lee JY, Jung CH, Kim YP. Estimation of Optical Properties for HULIS Aerosols at Anmyeon Island, Korea. Atmosphere. 2017; 8(7):120. https://doi.org/10.3390/atmos8070120
Chicago/Turabian StyleLee, Ji Yi, Chang Hoon Jung, and Yong Pyo Kim. 2017. "Estimation of Optical Properties for HULIS Aerosols at Anmyeon Island, Korea" Atmosphere 8, no. 7: 120. https://doi.org/10.3390/atmos8070120
Note that from the first issue of 2016, this journal uses article numbers instead of page numbers. See further details here.