Article

PAN–Precursor Relationship and Process Analysis of PAN Variations in the Pearl River Delta Region

1
School of Atmospheric Sciences, Sun Yat-sen University, Guangzhou 510275, China
2
Guangdong Province Key Laboratory for Climate Change and Natural Disaster Studies, Sun Yat-sen University, Guangzhou 510275, China
3
Department of Civil and Environmental Engineering, Hong Kong Polytechnic University, Hong Kong 999077, China
4
Institute for Environmental and Climate Research, Jinan University, Guangzhou 510000, China
5
Institute of Tropical and Marine Meteorology, Guangdong Provincial Key Laboratory of Regional Numerical Weather Prediction, China Meteorological Administration, Guangzhou 510000, China
6
School of Atmospheric Sciences, Nanjing University, Nanjing 210000, China
*
Authors to whom correspondence should be addressed.
Atmosphere 2018, 9(10), 372; https://doi.org/10.3390/atmos9100372
Submission received: 3 July 2018 / Revised: 17 September 2018 / Accepted: 21 September 2018 / Published: 25 September 2018
(This article belongs to the Special Issue Storms, Jets and Other Meteorological Phenomena in Coastal Seas)

Abstract

:
Peroxy acetyl nitrate (PAN) is an important photochemical product formed from the reactions between volatile organic compounds (VOCs) and nitrogen oxides (NOx) under sunlight. In this study, a field measurement was conducted at a rural site (the backgarden site, or BGS) of the Pearl River Delta (PRD) region in 2006, with the 10 min maximum PAN mixing ratios of 3.9 ppbv observed. The factors influencing the abundance of PAN at the BGS site was evaluated by the process analysis through the Weather Research and Forecasting-Community Multiscale Air Quality (WRF-CMAQ) model. The results suggested that the increase of PAN abundance at the BGS site was mainly controlled by the gas-phase chemistry, followed by vertical transport, while its loss was modulated mainly by dry deposition and horizontal transport. As the dominant important role of gas-phase chemistry, to provide detailed information on the photochemical formation of PAN, a photochemical box model with near-explicit chemical mechanism (i.e., the master chemical mechanism, MCM) was used to explore the relationship of photochemical PAN formation with its precursors based on the measured data at the BGS site. It was found that PAN formation was VOC-limited at the BGS site, with the oxidation of acetaldehyde the most important pathway for photochemical PAN production, followed by the oxidation and photolysis of methylglyoxal (MGLY). Among all the primary VOC precursors, isoprene and xylenes were the main contributors to PAN formation. Overall, our study provides new insights into the PAN photochemical formation and its controlling factors, and highlighted the importance of gas chemistry on the PAN abundance in the PRD region.

1. Introduction

Peroxy acetyl nitrate (PAN, CH3C(O)O2NO2) is a key photochemical pollutant which plays an important role in photochemistry and has detrimental effects on human and vegetation health [1]. In addition to in situ formation near the emission sources of volatile organic compounds (VOCs) and nitrogen oxides (NOx), PAN could also be formed in air far away from these sources. PAN is relatively stable at low temperatures; however, it can be decomposed when the atmospheric temperature is high [2]. As a NO2 reservoir species, it reduces NO2 concentrations near the emission sources but releases NO2 in regions remote from fresh emission sources [3]. It is, hence, concerning that PAN can affect NOx abundance and, ultimately, influence tropospheric ozone formation on local and regional scales.
PAN is formed from the reaction of NO2 and peroxy acetyl (PA) radical which is produced through photolysis and oxidation of a small number of oxygenated volatile organic compounds (OVOCs) (e.g., acetaldehyde (CH3CHO), acetone, methacrolein (MACR), methyl vinyl ketone (MVK), methyl ethyl ketone, and methylglyoxal (MGLY)) initiated by OH, NO3, and O3. Therefore, the abundances of aforementioned OVOCs will directly impact PAN levels in the atmosphere. Since PAN was first discovered in photochemical smog in Los Angeles in the 1950s, numerous studies have investigated the distribution and source contributions of PAN through field measurements and model simulations [3,4,5,6]. The characterization includes the abundance of PAN, the relationship with its precursors, and the contributions of regional transport in different environments.
The spatial variations of PAN and its formation mechanism has also been investigated in China, including urban, suburban, rural, and remote areas, for example, in Lanzhou [7], in Beijing [8,9,10], and in the Pearl River Delta (PRD) region [11,12]. Zhang et al. [13] found that the thermal decomposition dominated PAN removal in urban environments in Beijing, from June to September 2010. Liu et al. [8] investigated the contribution of different precursors to the photochemical PAN formation with the Regional Chemical and Transport Model (REAM), and found that photooxidation of aromatic non-methane hydrocarbons (NMHCs) was the dominant PAN source at the Peking University (PKU) site. Xue et al. [9] investigated the PAN–precursor relationship at suburban and urban sites in Beijing, with an observation-based box model coupled with the Master Chemical Mechanism (MCM). They found that PAN formation is sensitive to both non-methane hydrocarbons (NMHCs) and NOx, with isoprene and aromatic NMHCs being the most important NMHC precursors, respectively, at suburban and urban sites.
Photochemical smog has been frequently observed in the Pearl River Delta (PRD) region, leading to increasing concerns regarding photochemical pollution. Pollutants that contribute to photochemical smog are the main focus of many studies, and those pollutants include O3, secondary organic aerosol (SOA), and their precursors [14,15,16,17]. Among them, studies on PAN were scarce in this region. Wang et al. [11] investigated photochemical ozone formation based on the observed PAN concentrations at a downwind receptor site in Guangzhou. Zhou et al. [18] investigated the diurnal variations of PAN and its correlation with O3 at a downwind receptor site in the PRD region. A recent study by Xu et al. [12] found that the air masses apparently influenced the variations of PAN and the production efficiency of PAN was correlated to the NOy concentration at a background site in the PRD region. Despite these efforts, knowledge is still lacking regarding the sources and sinks of PAN and the PAN–precursor relationship in the PRD region. In this study, data at a rural site (the backgarden site) were used to investigate the factors influencing the PAN abundance and the PAN–precursor relationship in the PRD region. Note that the measurement data used in the present study were collected in 2006, which may not represent the present atmosphere of PRD, where photochemical products (i.e., O3, PAN, and SOA) and their precursors (VOCs and NOx) have experienced significant variations in the last decade, because of the rapid urbanization/industrialization and considerable control measures implemented in the last decade [19,20]. For example, gross national product (GDP), energy consumption, and developed land area have increased 300%, 160%, and 150%, from 2006 to 2016, respectively [21]; meanwhile, control measures, including laws, standards, regulation, action plans, and others, have been implemented and formulated to alleviate photochemical pollution [22]. Based on the studies of source apportionments of VOCs (vehicle-related emissions), mixed solvents and LPG (liquefied petroleum gas) leakage are considered as the major sources of VOCs in PRD in recent years, with the source contributions varying with the sampling sites, time periods, and types of VOCs measured [20]. However, by comparing with the results in previous studies, our results provided useful information for developing a historical understanding on the PAN photochemistry in this region, and on the evaluation of the effective control measures for photochemical pollution in recent years in PRD [23].

2. Methodology

2.1. Field Measurement

Intensive field measurements were conducted during 5–27 July 2006 at the backgarden site (BGS, 23.548° N 113.066° E) during the Program of Regional Integrated Experiments of Pearl River Delta Region (PRIDE-PRD2006) Air Quality Monitoring Campaign. The measurement site is a super-site located in a rural area about 60 km to northwest of Guangzhou city (Figure 1). The detailed description of the sampling site can be found elsewhere [11]. Briefly, the sampling site was set up on top of a 3-floor building surrounded by trees, farmlands, and a water reservoir, with no industries in vicinity of the sampling site. During the sampling period, southerly winds were frequently observed, making the sampling site a receptor site of urban plumes from the center cities in the PRD region.
Trace gases (i.e., PAN, NOx, NOy, CO, and NMHCs), PPN (peroxypropionyl nitrate), and meteorological parameters were measured continuously during the campaign. PAN and PPN was measured by an online gas chromatograph equipped with an electron capture detector (GC-ECD). The detection limit for PAN and PPN was 5 pptv, with an uncertainty of about ±15% and ±20% of the measured concentrations, respectively. The instrument was calibrated weekly by predetermined PAN concentrations. Detailed description for the measurement of PAN could be found in Wang et al. [11]. As the mixing ratios of PAN were about 8 times those of PPN, and about 20% of all PPN data were below the detection limit (i.e., 5 pptv) [11], only variations of PAN and their impact factors were investigated in the present study.
The air quality regulated trace gases (i.e, O3, NOx, and CO) were measured by a set of commercial gas analyzers (Thermo 49C, 42C, and 48C, respectively). In the present study, NOy was measured by using a NO–O3 chemiluminescence detector combined with a molybdenum converter at 350 °C, while NO2 was measured by chemiluminescence instrument with internal molybdenum converters maintained at 325 °C (42C TEI). A Teflon particulate filter was placed between the inlet and the molybdenum converter to prevent particles from getting into the detector. It has been reported that the application of this analyzer would resulted in the overestimation of NO2, as NO2 and other NOz components, including HNO3, PAN, and HONO, were converted to NO, a process which was dependent on the photochemical ages of air masses at the sampling sites [24], with the percentages of overestimation of 10%~30% in the urban and rural sites of the PRD region, respectively, indicating that the interference of NO2 at the BGS site was not significant [25].
Detailed information, including the calibration, detection limit, and precision of the above parameters, was described in Zhang et al. [17]. Furthermore, temperature, solar radiation, wind direction and speed, and relative humidity, were monitored by an automated weather station.
The NMHCs, including 26 C3–C12 alkanes, 8 C3–C5 alkenes (including the PAN primary precursors of propene, trans-/cis-2-butenes, and isoprene), and 16 C6–C10 aromatics (including the PAN primary precursors of toluene, xylenes, and trimethylbenzenes) were measured by an automated online gas chromatograph equipped with a flame ionization detector (GC-FID) system (see Table S1 for the details). Detailed information for the instrumentation can be found in Zhang et al. [17] and Wang et al. [26]. Briefly, the detection limit of the instrument ranged from 0.1 to 0.3 ppbv for the measured species, with an uncertainty within 2%. The whole dataset of NMHC was used as the input for model simulation [27].

2.2. Photochemical Box Model Incorporating the Master Chemical Mechanism (PBM-MCM)

A photochemical box model, coupled with master chemical mechanism (version 3.2), including the degradation of 143 primary VOCs and the latest IUPAC inorganic reactions [28,29], was used to simulate the in situ formation of PAN and the relationship with its precursors. Detailed description of the model can be found elsewhere [23,30]. The MCM mechanism used in the model is a near-explicit chemical mechanism, which could describe the degradation of NMHCs and formation of PAN at the molecular scale. It has been widely used in previous studies to investigate the formation of secondary products (i.e, O3, PAN, and alkyl nitrate) and their relationship with precursors. In addition to the chemical mechanism, physical processes, including dry deposition, aloft exchange, and atmospheric dilution caused by the variations of the planetary boundary layer height, were taken into account in the model. In this study, the measured concentrations of trace gases (i.e., CO, NOx, and O3), PAN, 50 NMHCs, boundary layer height [31], and meteorological parameters, were used as input for the model simulation. The net production rate of PAN + PA (peroxy acetyl radical) was simulated by the model every hour, as suggested in Xue et al. [9].

2.3. Description and Configuration of Community Multiscale Air Quality (CMAQ) Model

The U.S. Environmental Protection Agency’s Community Multiscale Air Quality (CMAQ) model version 5.0.2 [32,33] was used for air quality simulation during July 2006. Weather Research Forecast (WRF, version 3.7.1) model was conducted to provide offline meteorological conditions for CMAQ. A two-nested domain was set for the modeling system with spatial resolution of 27 km (outer domain) and 9 km (inner domain), respectively. The outer domain covered most of the area of east Asia, aiming to provide sufficient boundary conditions for the inner domain, whereas the inner domain covered the entire Guangdong province, with the PRD region being highly focused (Figure 2). In this study, our model adopted a terrain-following hydrostatic-pressure vertical coordinate, including 30 sigma levels for all domains with the top fixed at 100 hPa. Each sigma level can be calculated using the following equation:
H = (Ph − Pht)/(Phs − Pht)
where Ph was the hydrostatic component of the pressure, and Phs and Pht referred to values along the surface and top boundaries, respectively. η varied from a value of 1 at the surface, to 0 at the upper boundary of the model domain. For the PRD region, the first vertical layer was connected to the surface, and had a depth of ~20 m in vertical. The simulation period was conducted from 0000 UTC 1 July to 0000 UTC 27 July 2006.
The 2008-based Multi-resolution Emission Inventory for China (MEIC), developed by Tsinghua University, was used for anthropogenic emissions. This inventory had a grid resolution of 0.25° × 0.25°, and considered five emission categories, namely, transportation, agriculture, power plant, industry, and residence [34]. Biogenic emissions were calculated using the Model of Emissions of Gases and Aerosols from Nature (MEGAN). It should be noted that anthropogenic and biogenic emissions were both incorporated into the first layer, which was regarded as the terrain surface. The model treated the emissions as follows: once released in the first layer, the anthropogenic and biogenic species would involve photochemistry, and immediately distribute horizontally and vertically in the specific domain, through the atmospheric diffusion and advection, respectively, in the model. The detailed configuration of the WRF-CMAQ model was summarized in Table 1. Our previous studies have demonstrated that this configuration of the modelling system could have great performance in the simulation of air quality in the PRD region [35,36].
In this study, measurement data from seven surface meteorological sites and one surface intensive observation site (i.e., the BGS site) were used to validate the simulated results from both WRF and CMAQ modeling systems. Daily mean surface pressure (PSFC), 2 m air temperature (T2), 2 m relative humidity (RH2), and 10 m wind speed (WS10), measured at the above selected sites, were compared to modelled results during the simulation period (Table 2).
For meteorological variables, the simulated PSFC and T2 were slightly lower than the corresponding observed data, with a mean bias of 0.8 hPa and 0.6 °C, respectively, while the simulated RH2 and WS10 were higher, with a mean bias of 5.3% and 1.3 m/s, respectively. The IOA (index of agreement between observation and simulation) of PSFC, T2, and RH2, were 0.99, 0.82, and 0.75, respectively, indicating good agreement between the observation data and simulation results. However, simulated wind speed was 1.3 m/s higher than that observed, and it should be noted that the wind field was affected by rather complex physical processes, as well as the distribution of land cover. In this study, a grid resolution of 9 × 9 km was applied, and such a resolution might be difficult to reveal the sophisticated topography and topographical circulation. Regardless, by comparing synoptic winds, the model generally captured the patterns of prevailing winds (Figure 3).
Furthermore, the simulated results of O3, PAN, and NOx (NO + NO2) were compared to those monitored at the sampling site (Table 2 and Figure 3). The IOA of O3, PAN, and NOx were 0.84, 0.74, and 0.73, respectively, showing that the trends of the chemical variables were well simulated. Meanwhile, the MB (mean bias) of O3, PAN, and NOx, were −2.2, 0.025, and −5.8 ppbv, respectively, indicating that the magnitude of simulated variables were close to those observed. Moreover, good correlation was found between the observed and simulation data of secondary products, i.e, O3 (R2 = 0.80, p < 0.05) and PAN (R2 = 0.71, p < 0.05) (see Figure S1 in the Supplementary). It could be seen that the peak of O3 and PAN were underestimated on July 18 and July 23, which might be very likely due to the uncertainty of the VOC emission inventory, as both meteorological variables (wind and temperature) and NOx were well reproduced. Indeed, Zheng et al. [37] reported that the uncertainty of emission inventory for VOCs and NOx were relatively high, ranging between −75~150% and −50~150%, respectively. This can also explain the underestimation of NOx during nighttime on July 20 and July 21 (Figure 3). Since the lifetime of NO is rather short, and it could rapidly titrate O3 during the night, the significant peak of nighttime NO could be related to random point sources, which were hard for the emission inventory to record [11]. Nevertheless, the above statistical calculations and time series comparisons demonstrated that the trend and magnitude of WRF-CMAQ modelling results were comparable with those observed and, thus, could be used for further analysis.

3. Results and Discussion

3.1. General Statistics

Table 3 presents the measured concentrations of PAN, trace gases, and main PAN precursors at the BGS site during the sampling period. In general, the median mixing ratio of PAN at the BGS site was 0.31 ± 0.02 ppbv, with the maximum and the average value of daily maximum mixing ratio of 3.9 and 1.3 ppbv, respectively. These levels were lower than those measured at urban and suburban areas in Beijing [8,9,13], and an urban site in Lanzhou in western China [7]. Compared to other field measurements in the PRD region, the mixing ratios of PAN at the BGS site were lower than those observed at the regional background site (the Hok Tsui site, measurement in 2011) [12] and the downwind rural site in the PRD region (the Heshan site, measurement in 2012) [18], which were mainly influenced by the outflow air masses from the center PRD region. The variations of PAN levels in different field measurements were mainly related to the variations of its precursors. For example, in the BGS site, the median mixing ratio of NOx was 12 ± 1 ppbv, while toluene was the most abundant species among all the primary VOC precursors of PAN, with the median mixing ratio of 2335 ± 408 pptv, followed by propene, isoprene, and m/p-xylene. In the PRD region, toluene and other aromatics were mainly from vehicular emissions and solvent usage, while xylenes and trimethylbenzene were emitted from solvent usage. On the other hand, isoprene was mainly from biogenic emissions, and C3–C4 alkenes (i.e, propene and butenes) were from vehicular emissions [22,38,39,40]. For anthropogenic species, the mixing ratios at the BGS site were much lower than the data collected at the downwind rural site in autumn 2007 (the Wanqinsha site) and in autumn 2014 (the Heshan site, unpublished data from Prof. Min Shao, Jinan University), while the mixing ratios of biogenic species and isoprene, between the BGS and Heshan sites, were comparable. Note that the variations of VOCs should be related to the sampling season, sampling location, meteorological conditions, site topography, and so on, though vehicle-related emissions, and mixed solvents and LPG leakage were identified as the major sources of VOCs in PRD in recent years, based on the VOCs’ source apportionment studies [20].
On the other hand, consistent with other secondary products (i.e., O3), PAN presented a typical photochemistry profile, with a broad peak observed during daytime hours and reaching the maximum and minimum mixing ratios in the afternoon and in the early morning.

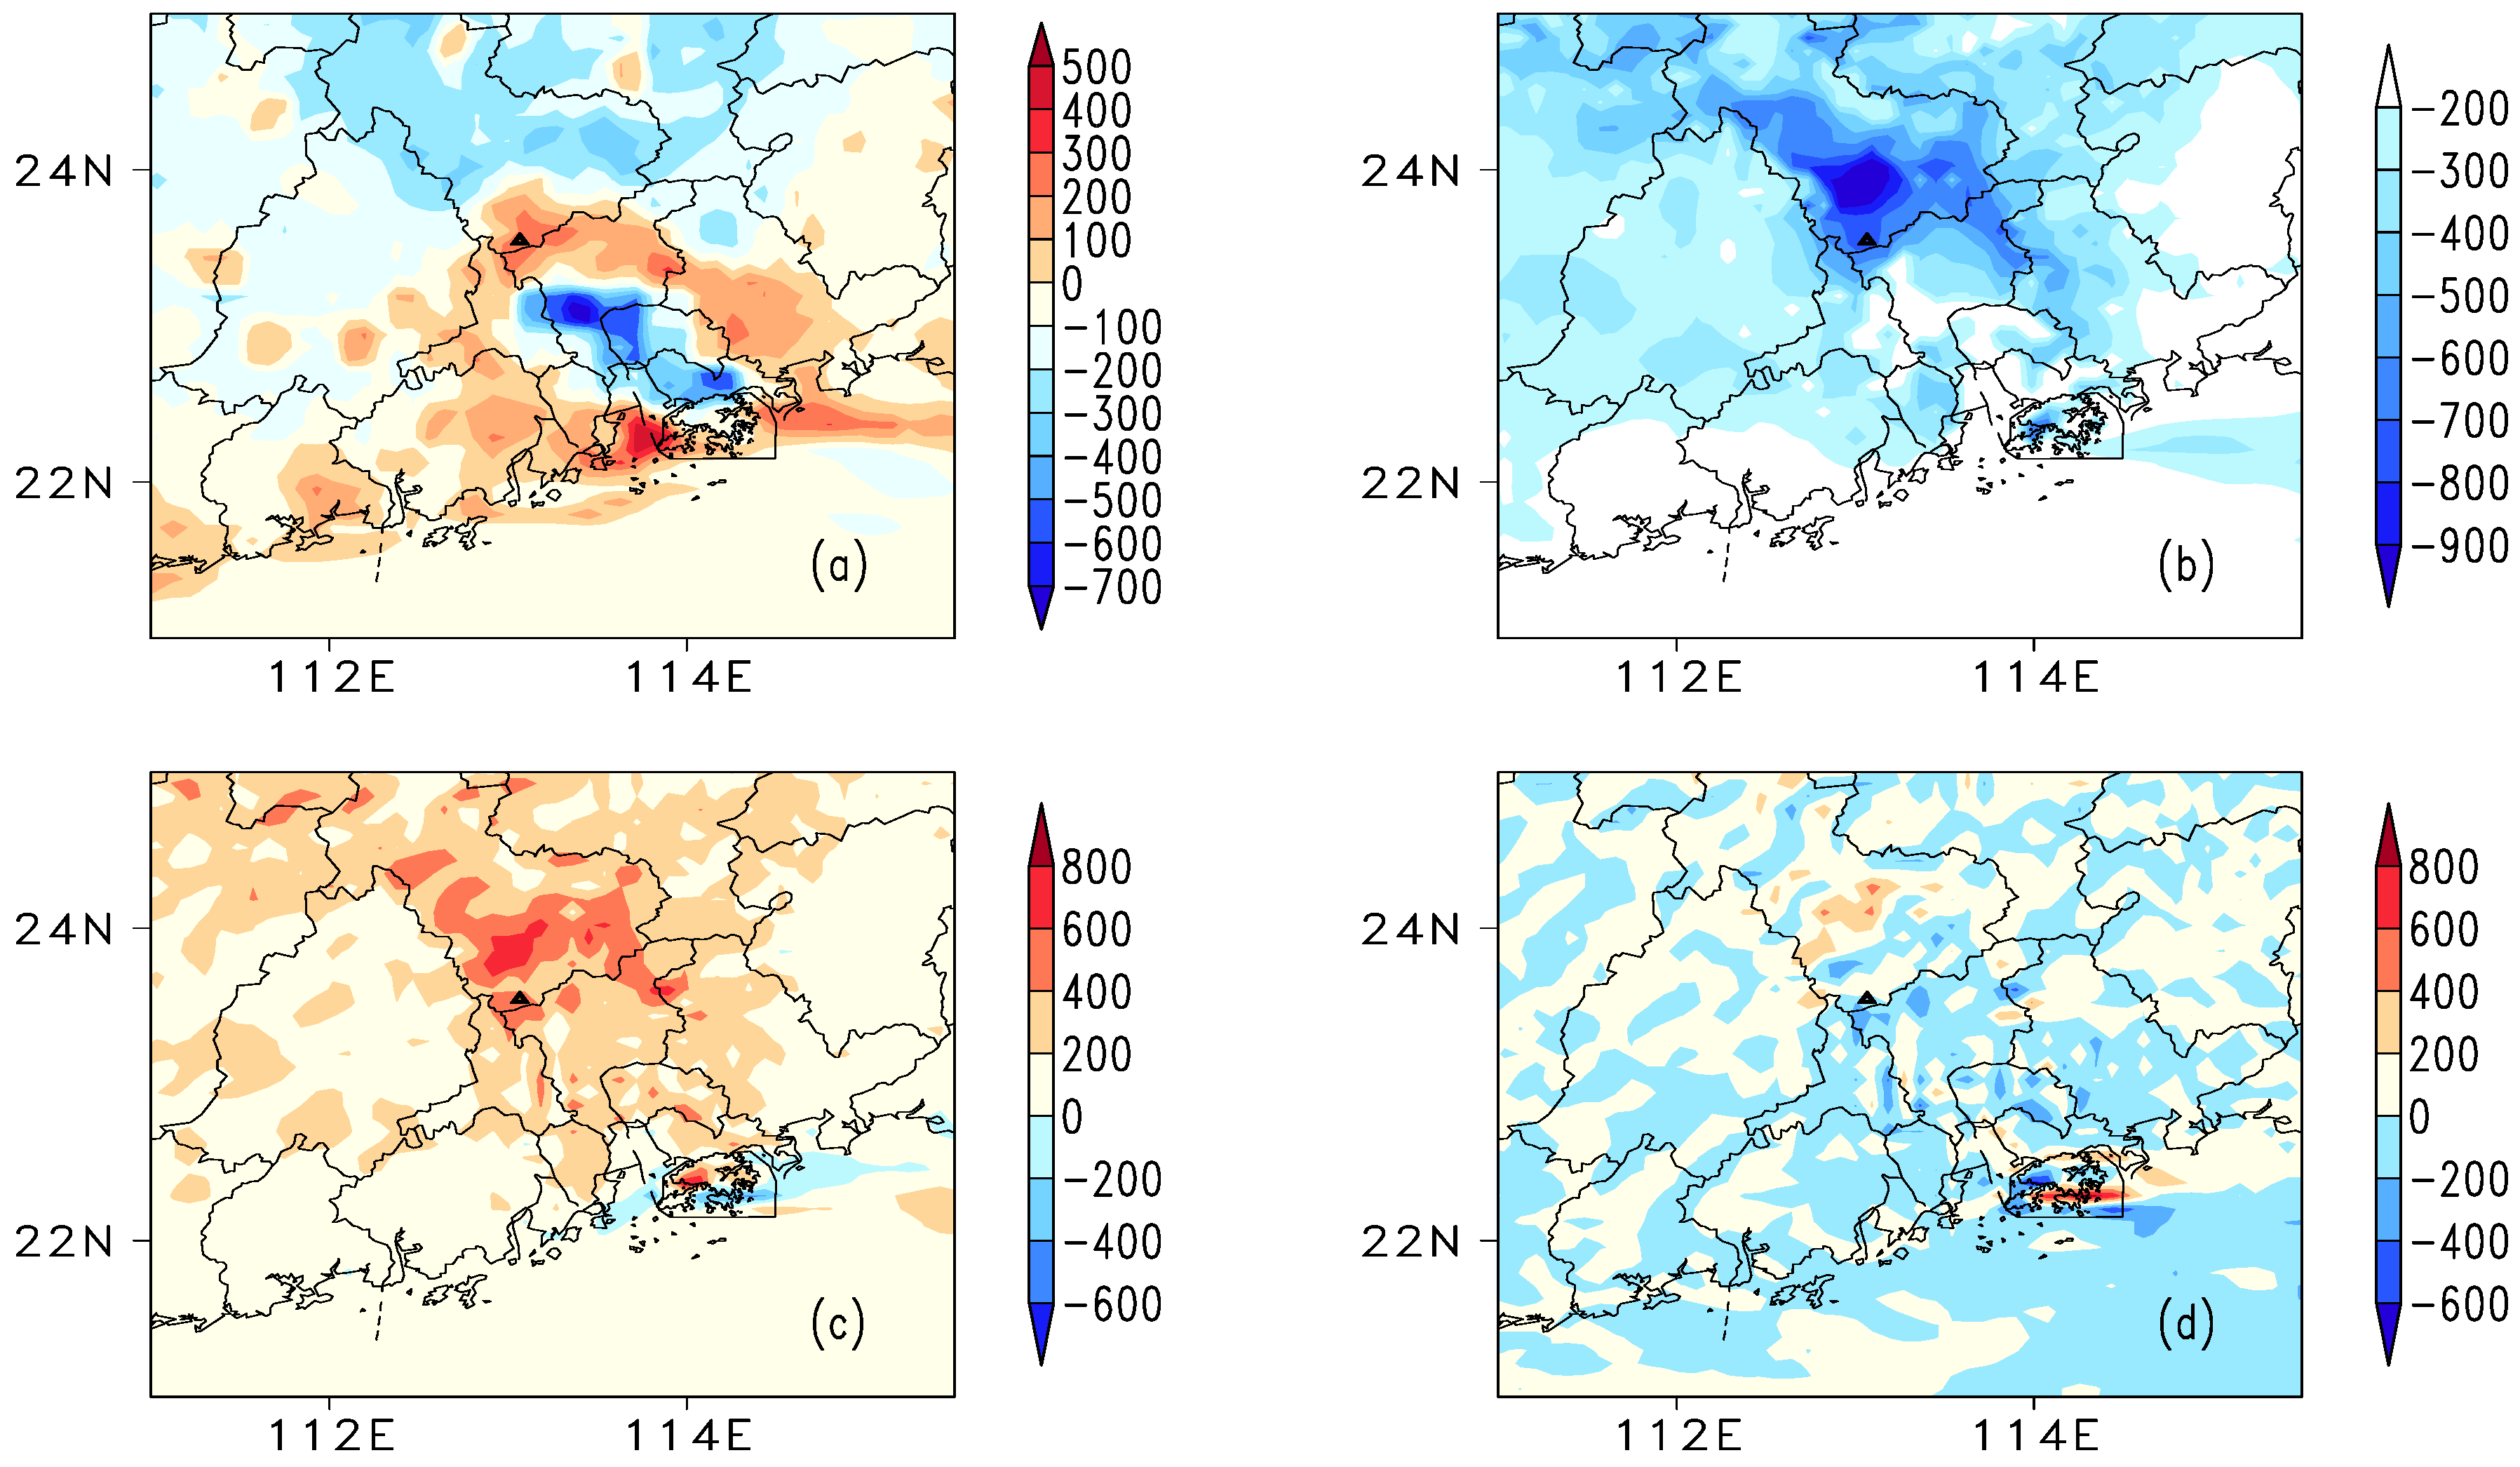
3.2. Dynamic Processes for PAN Abundance

The mixing ratio of PAN at a given site is affected by processes such as photochemical reactions, atmospheric transport (vertical and horizontal), dry deposition, and others. In order to explore the impact factors on the PAN abundance at the BGS site, the integrated process rate (IPR) module from the WRF-CMAQ model was used. The IPR module provides the contributions of individual physical processes, and the net effect of photochemistry to PAN levels at a given site and/or region. The processes examined by the IPR module were vertical and horizontal transport, dry deposition, and gas-phase chemical process (including the production and loss through photochemistry, and the loss due to thermal decomposition).
Figure 4 depicted the spatial distribution of major process contributions to PAN variations at 1400 LT (local time) in PRD. The average spatial contribution, which was obtained by averaging the simulation results at 1400 LT over the PRD region, was calculated as follows:
X = i = 1 i = n g r i d C O N C i ngrid  
where ngrid is the total numbers of girds in the modelling domain (PRD region), and CONCi is the contribution at the ith grid within the region. X referred to the averaged spatial contribution, which was the average value over space at 1400 LT.
The contribution of gas-phase chemistry varied in different areas and presented different patterns, with the maximum value for the removal of PAN and the maximum value for the increase of PAN levels through gas-phase chemistry being 850 and 580 pptv in the southern and northern PRD, respectively (i.e., −850~580 pptv in Figure 4a). Among all the processes that contributed to the increase of PAN levels, the average contribution of gas-phase chemistry was ~25%, while it was about 26% within all the processes that contributed to the decrease of PAN levels. Interestingly, the removal of PAN through gas-phase chemistry could be seen in central urban areas, such as southern Guangzhou, eastern Dongguan, and Shenzhen. However, gas-phase chemistry was found to make contributions to the increase of PAN abundance in most rural areas, such as northern Guangzhou, where BGS is located. As mentioned above, the gas-phase chemical processes considered in the model were the photochemical formation of PAN through peroxy acetyl radical and NO2, and the removal of PAN through the thermal decomposition of PAN and the reaction of PAN and OH radical, among which, thermal decomposition dominated PAN removal [7]. The negative contributions in the central urban areas of PRD region suggested that the amount of PAN removed by gas-phase chemistry was more than those formed through gas-phase chemistry.
The difference in the contributions of gas-phase chemistry between rural and urban areas of the PRD region was mainly related to following factors: (1) PAN formation, through the reaction of peroxy acetyl radical and NO2 in urban areas, was lower than in rural areas. Though the mixing ratios of precursors, i.e., NMHCs and NOx, were usually higher in urban rather than rural areas, the PAN formed through peroxy acetyl radical and NO2 was lower in urban areas, and the concentration of OH radical was usually lower in urban areas. Indeed, by checking the spatial distribution of emissions of NOx and isoprene, it was found that there was less isoprene in urban areas than rural areas of the PRD region, while NOx levels were the opposite (see Figure S2 in the Supplementary). To illustrate the impact of precursors on the chemical formation of PAN, the production of “C2O3 + NO2 → PAN” (C2O3 represented peroxy acetyl radicals in CMAQ model), which could reflect the formation through gas-phase chemistry to the increase of PAN abundance (Figure 5b), were extracted from the model simulation. The results showed that the formation of PAN was higher in rural areas than that in urban areas. By considering the spatial distributions of NOx and isoprene in PRD, it was suggested that higher isoprene levels favored photochemical formations in rural areas, while higher NOx levels suppress radical activity in urban areas. On the other hand, to provide more evidence for the above speculation, the PBM-MCM model was applied to the observed VOC and NOx data observed during summer 2006 at an urban site in Guangzhou. Note that there was no observed PAN data at that site. The mixing ratio of NOx at the urban site of Guangzhou was 56 ± 3 ppbv, higher than that at the BGS site. In addition, the most abundant NMHCs at the urban site was propane (9.2 ± 0.7 ppbv, median ± 95% confidence interval), followed by toluene (6.5 ± 0.4 ppbv), ethane (4.7 ± 0.1 ppbv), n-butane (4.4 ± 0.2 ppbv), ethene (3.6 ± 0.1 ppbv), and i-butane (2.9 ± 0.1 ppbv), higher than those at the BGS site, due to the closure to emissions. For biogenic species, the mixing ratio of isoprene at the urban site (0.84 ± 0.04 ppbv) was still higher than that at the BGS site. However, through the PBM-MCM model simulation, the average production rate of PAN formed from peroxy acetyl radical and NO2 at the urban site was about ~700 pptv/hour, lower than that at the rural site (i.e., the BGS site in this study) (1620 pptv/hour). This was mainly related to the lower concentrations of OH radical at the urban site. For example, the daily average concentration of OH radical, through model simulation at the urban site, was 1.2 × 10⁶ molecule/cm3, lower than that at the rural site (3.7 × 10⁶ molecule/cm3), due to the higher mixing ratio of NO2 that could suppress radical activity and make a dominant contribution to the sink of OH radicals.
Furthermore, the more PAN removed by gas-phase chemistry was also a result of the higher surface temperature in central urban areas, which could increase the thermal decomposition of PAN [10]. The surface temperature in central urban areas was ~2–5 °C higher than that in rural areas, likely due to the difference of underlying surface (Figure 5). Indeed, the sensitivity analysis of the influence of the increased temperature on thermal decomposition of PAN at the BGS site has been investigated by the PBM-MCM model (Section 3.3). It was found that the rate of the thermal decomposition of PAN could increase by ~29% if the temperature was increased by 5 °C (data not shown). On the other hand, though variations in mixing ratios of precursors could result in the different production rates of PAN between urban and rural areas, the deviation between the production rate of PAN and its destruction rate through thermal decomposition, could be smaller at urban areas due to higher temperatures in urban areas [13]. Indeed, through the simulation of the PBM-MCM model, it was found that the deviation between the production rate and destruction rate was about 41 pptv/h at the urban site, lower than those simulated at the rural site (p < 0.01).
In addition to gas-phase chemistry, vertical transportation was another process for the increase of PAN abundance, suggesting that higher PAN levels at upper layers could lead to the increase of PAN levels through downward advection/diffusion. For example, it was found that the area-averaged concentrations of PAN, and gas-phase chemistry to PAN loadings at 800 m (above surface), were 70 pptv (with the maxima value reaching 508 pptv) and 65 pptv (with the maxima value reaching 405 pptv), higher than those of surface (Figure 6), demonstrating, on one hand, the great contribution of gas-phase chemistry at the upper layer and, on the other hand, the positive contributions from vertical transportation diagnosed by the IPR module. Furthermore, both dry deposition and horizontal transportation resulted in the decrease of PAN abundance. Differently, horizontal contribution varied significantly in spatial distribution, with the contribution ranging from ~12.1% of the removal of PAN to ~18.0% of the increase of PAN abundance. Last but not least, dry deposition functioned as a major sink for PAN, with the averaged spatial contribution being ~48% (~251 pptv) over the whole PRD region, significantly higher than other processes for PAN removal. This is consistent with the previous studies, which indicated that dry deposition was the main removal pathway for PAN in the atmosphere [9,41,42]. For example, through a revised parameterization method developed by a new non-stomatal resistance formulation, a realistic treatment of cuticle and ground resistance in winter, and other resistance parameters, the mean values of dry deposition velocity of PAN in land-use categories of 12 vegetation types, and at seven rural sites, were 0.82 ± 0.08 and 0.74 cm/s [41], comparable to the value calculated by the WRF-CMAQ model in the present study (i.e., 0.80 ± 0.05 cm/s). However, the dry deposition velocity in the present study was higher than those modelled in a temperate deciduous forest in the United States [43] (daytime average: ~0.5 cm/s), which was mainly due to the large uncertainties in the parameterization of Rc (canopy resistance). In addition to the comparison of simulation results, the simulated results by the WRF-CMAQ model, in the present study, were similar to that measured in a coniferous forest in North California during summer 2003, with a mean daily maximum value of ~1.2 cm/s [44]. Furthermore, the simulation of GEOS (Goddard Earth Observing System)-Chem model indicated that the dry deposition of PAN could be 0.11 kg N ha−1 yr−1 over the Yangtze River Delta region. Moreover, compared to the observation results, the removal of PAN through dry deposition (~251 pptv), simulated by WRF-CMAQ in the present study, was similar to that calculated based on the observed data at a rural site (i.e., Weybourne Atmospheric Observatory, ~302 pptv/hour) [45].
Diurnal patterns, providing more information on the contributions of different processes to the concentration of PAN, were investigated at the BGS site (Figure 7). In general, the net production rate of PAN started to increase from 0800 LT, and reached a maximum value of 333 pptv/h at 0900 LT, which decreased to minimum values at 1300 LT (i.e., −128 pptv/h, indicating that more PAN was removed than produced, at that time). The contribution of gas-phase chemistry increased in the morning and reached maximum values at around 1000 LT (local time), with an average production rate of 794 pptv/h (~75% of all the processes to the increase of PAN levels) during the whole sampling period. Decreases after the peak are due mainly to the thermal deposition of PAN with increased temperature [7]. Similarly, dry deposition contributed predominantly to PAN removal, with the maximum process contributions of 671 pptv/h to PAN removal at around 1100 LT. Furthermore, similar patterns were found for horizontal and vertical transport, with maximum contributions to the production and removal of PAN at around 1000 LT, with the average rates of 365 and −248 pptv/hour, followed by a decrease trend until 1600 LT.

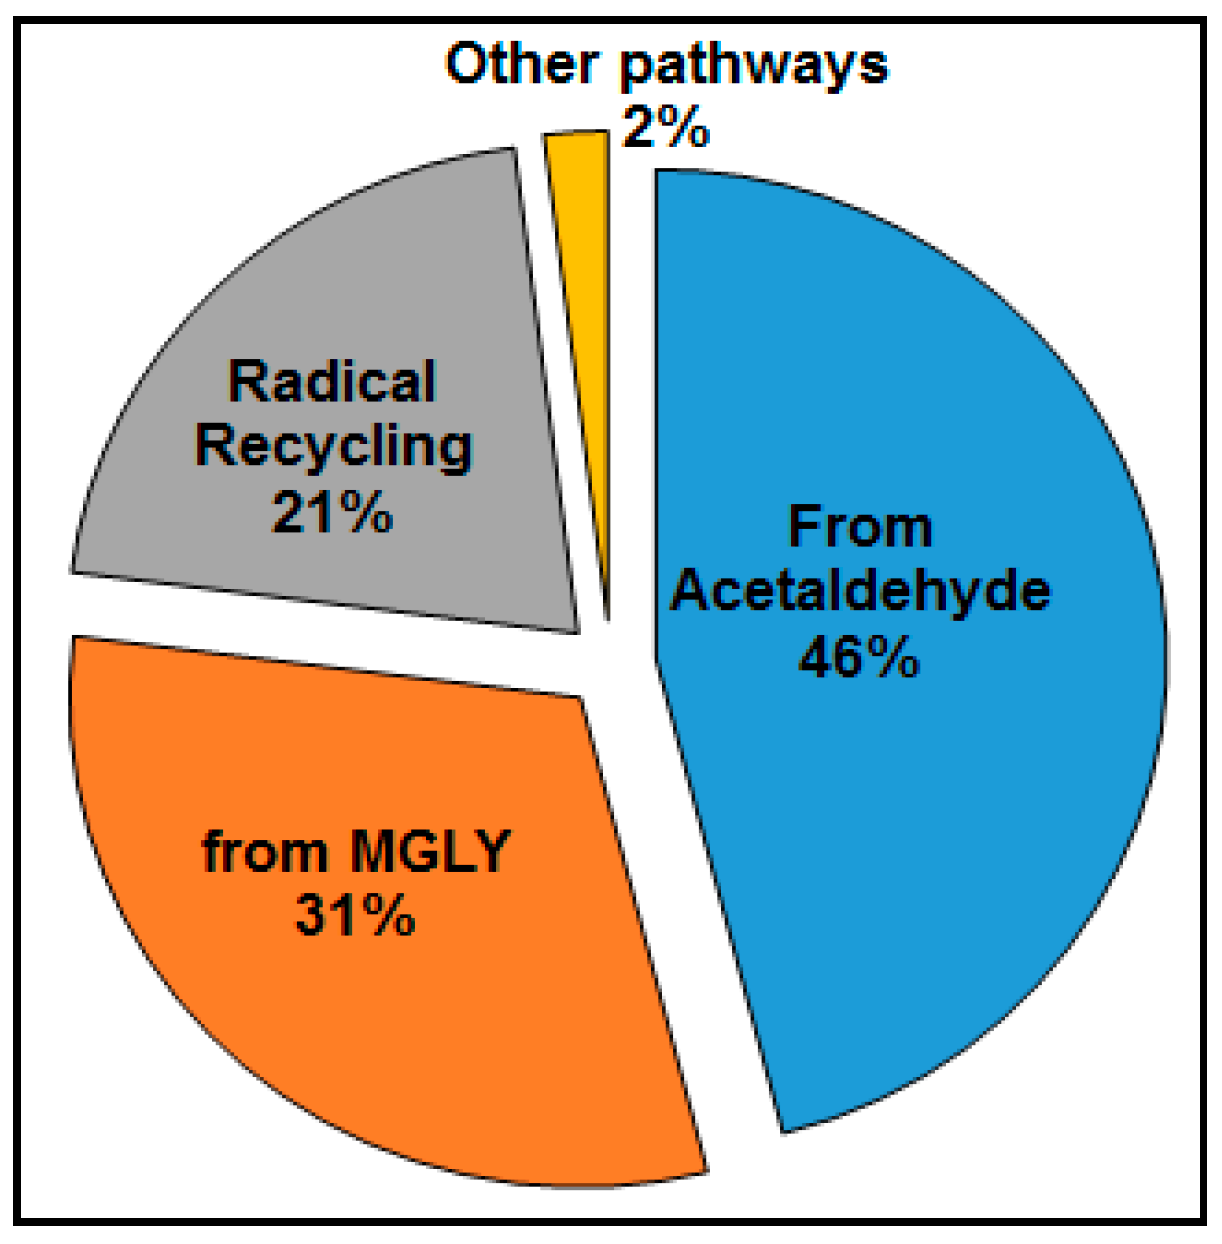
3.3. The PAN–Precursor Relationship

The above analysis suggested that gas-phase chemistry was the most important factors of the accumulation of PAN levels at the BGS site, revealing the necessity for the understanding mechanisms for photochemical PAN formation. Therefore, in this section, the PBM-MCM model was employed to simulate in situ PAN formation, assign the major factors of photochemical PAN formation, and evaluate the PAN–precursor relationship at the BGS site.
Figure 8 shows three major pathways leading to production of PA radical at the BGS site during the sampling period, in the following order: the oxidation of acetaldehyde by OH and NO3 (46 ± 5%), photolysis and oxidation of methylglyoxal (MGLY) by OH and NO3 (31 ± 2%), and radical recycling of other radicals to the PA radical (21 ± 1%). Our results were consistent with those simulated at suburban and urban sites in Beijing [9,13]. The remaining pathway for production of PA radical was very minor (about 2%), contributed to from the oxidation of other OVOCs and MPAN (methacryloyl peroxy nitrate, a secondary product formed through the acylperoxy radical (MACO3) with NO2). In general, secondary sources of both acetaldehyde and MGLY significantly dominated over the corresponding primary sources [23,46,47,48]. Therefore, primary precursors (named first-generation precursors hereafter) that produce important secondary sources, such as acetaldehyde and MGLY, through photochemical reactions, are significant and indirect contributors to PAN production, and need to be further identified.
The RIR (relative incremental reactivity, defined as the ratio of the percent change of the PAN production to the percent change (20% in this study) of the precursor concentration) was used to evaluate the relative importance of the first-generation precursors for the net production of PAN [9]. A larger RIR value for a given precursor means a greater probability; that is, the PAN concentrations can be effectively reduced through cutting down the emission of the precursor. The RIR values for VOCs were all positive, with the average RIRs (the weighted mean for each RIR value of different VOC groups at each sampling day) for alkanes, alkenes, and aromatics of 1.1, 1.2, and 1.4, respectively, while the RIR was negative for NOx, consistent with the sign preferences of the RIR values for both VOCs and NOx, for photochemical ozone formation at another site in the PRD region [47]. However, the RIR patterns of VOCs and NOx were different from those at the suburban and urban sites in Beijing [9], which were mainly associated with the different levels of VOCs and NOx observed in this study, and those in Beijing [49]. The positive RIR values for VOCs indicated that the in situ PAN production at the BGS site was controlled by the concentrations of the VOCs, and reduction of VOC emissions would inhibit PAN production. Figure 9 shows the top 6 VOC species/groups with high RIR values at the BGS site during the sampling period. Among all the VOCs, isoprene had the highest average RIR value (0.58 ± 0.03), suggesting that isoprene was the most important contributor for in situ PAN formation, followed by xylenes, butenes, and toluene. In the PRD region, isoprene was considered to be emitted mainly from biogenic emissions. In addition to PAN, it has been reported that isoprene was one of the most important precursors to photochemical products, including O3 and SOA, though anthropogenic species dominated the abundance of NMHCs [47,50]. Though the concentrations of isoprene were not as high as those of toluene and propene, its higher photochemical reactivity resulted in higher contributions to the formation of PAN. It could be expected that the contributions of isoprene to PAN, O3, and SOA would become more and more significant in future, as more strict control measures have been implemented and formulated to reduce the VOCs from anthropogenic emissions, including solvent usage, biomass burning, industrial emissions, and vehicular emissions [22,51].

4. Conclusions

In this study, the impact factors on the abundance of PAN at a receptor site of the PRD region were investigated using the IPR analysis module from the WRF-CMAQ model. It was found that gas-phase chemistry contributed to PAN removal in the urban center of the PRD region, because of the higher thermal decomposition rate due to higher temperature, while it made a major contribution to the increase of PAN levels in northern PRD, where the BGS site was situated. Therefore, to provide detailed information on the formation mechanism of PAN, the PBM-MCM model was applied to simulate the in situ formation of PAN and its relationship with the primary and secondary precursors. The in situ formation of PAN was VOC-limited, with the oxidation of acetaldehyde by OH and NO3, and the photolysis and the oxidation of MGLY being the main pathways for PAN formation. Furthermore, sensitivity analysis revealed that isoprene was the most important first-generation precursor for PAN formation, followed by butenes, xylenes, and toluene.

Supplementary Materials

The following are available online at https://www.mdpi.com/2073-4433/9/10/372/s1, Figure S1: the correlation between observed and simulated data of PAN (a) and O3 (b) at the BGS site (unit: ppbv), Figure S2: emission rate for NOx and isoprene in Guangdong Province. The left panel is isoprene and the right panel is NOx (unit: mole/s). The figure indicates that isoprene in the rural area is higher than urban center while NOx is opposite, Table S1: the mixing ratios of NMHCs at the Backgarden site (median ± 95% confidence interval).

Author Contributions

In this study, the analysis methods were developed and the whole structure for the manuscript was designed by Z.L., Z.W., N.W. and H.G., J.Y. conducted the data process and wrote the original copy of the manuscript. Furthermore, the simulation of meteorological conditions was evaluated by X.L. The simulation of PBM-MCM model and WRF-CMAQ was conducted by Z.L., Z.H. and N.W. Finally, the manuscript was finalized by Z.L., Z.W. and N.W., which was reviewed by X.W., and. S.F.

Funding

This research received no external funding.

Acknowledgments

This study was supported by the National Key Research and Development Program of China (2016YFC0202206, 2016YFC0203305), the State Key Program of National Natural Science Foundation of China (No. 91644215) and the National Natural Science Foundation of China (No. 41405112 and 21577177), and the Guangdong provincial scientific planning project (2014A020216008, 2016B050502005).

Conflicts of Interest

The authors declare no conflict of interest. The funders had no role in the design of the study; in the collection, analyses, or interpretation of data; in the writing of the manuscript, and in the decision to publish the results.

Data Availability

The data is available to the community and can be accessed by request to Zhenhao Ling ([email protected]) and Shaojia Fan ([email protected]) of Sun Yat-sen University.

References

  1. Vyskocil, A.; Viau, C.; Lamy, S. Peroxyacetyl nitrate: Review of toxicity. Hum. Exp. Toxicol. 1998, 17, 212–220. [Google Scholar] [CrossRef] [PubMed]
  2. Singh, H.B.; Salas, L.J.; Viezee, W. Global distribution of peroxyacetyl nitrate. Nature 1986, 321, 588–591. [Google Scholar] [CrossRef] [PubMed]
  3. LaFranchi, B.W.; Wolfe, G.M.; Thornton, J.A.; Harrold, S.A.; Browne, E.C.; Min, K.E.; Wooldridge, P.J.; Gilman, J.B.; Kuster, W.C.; Goldan, P.D.; et al. Closing the peroxy acetyl nitrate budget: Observations of acyl peroxy nitrates (PAN, PPN, and MPAN) during BEARPEX 2007. Atmos. Chem. Phys. 2009, 9, 7623–7641. [Google Scholar] [CrossRef]
  4. Marley, N.; Gaffney, J.; Ramos-Villegas, R.; Cárdenas González, B. Comparison of measurements of peroxyacyl nitrates and primary carbonaceous aerosol of concentrations in Mexico City determined in 1997 and 2003. Atmos. Chem. Phys. 2007, 7, 2277–2285. [Google Scholar] [CrossRef]
  5. Rubio, M.A.; Oyola, P.; Gramsch, E.; Lissi, E.; Pizarro, J.; Villena, G. Ozone and peroxyacetylnitrate in downtown Santiago, Chile. Atmos. Environ. 2004, 38, 4931–4939. [Google Scholar] [CrossRef]
  6. Zellweger, C.; Forrer, J.; Hofer, P.; Nyeki, S.; Schwarzenbach, B.; Weigartner, E.; Ammann, M.; Baltensperger, U. Partitioning of reactive nitrogen (NOy) and dependence on meteorological conditions in the lower free troposphere. Atmos. Chem. Phys. 2002, 2, 2259–2296. [Google Scholar] [CrossRef]
  7. Zhang, J.M.; Wang, T.; Ding, A.J.; Zhou, X.H.; Xue, L.K.; Poon, C.N.; Wu, W.S.; Gao, J.; Zuo, H.C.; Chen, J.M.; et al. Continuous measurement of peroxyacetyl nitrate (PAN) in suburban and remote areas of western China. Atmos. Environ. 2009, 43, 228–237. [Google Scholar] [CrossRef]
  8. Liu, Z.; Wang, Y.H.; Gu, D.S.; Zhao, C.; Huey, L.G.; Stickel, R.; Liao, J.; Shao, M.; Zhu, T.; Zeng, L.M. Evidence of reactive aromatics as a major source of peroxy acetyl nitrate over China. Environ. Sci. Technol. 2010, 44, 7017–7022. [Google Scholar] [CrossRef] [PubMed]
  9. Xue, L.K.; Wang, T.; Wang, X.F.; Blake, D.R.; Gao, J.; Nie, W.; Gao, R.; Gao, X.M.; Xu, Z.; Ding, A.J.; et al. On the use of an explicit chemical mechanism to dissect peroxy acetyl nitrate formation. Environ. Pollut. 2014, 195, 39–47. [Google Scholar] [CrossRef] [PubMed]
  10. Zhang, J.B.; Xu, Z.; Yang, G.; Wang, B. Peroxyacetyl nitrate (PAN) and peroxypropionyl nitrate (PPN) in urban and suburban atmospheres of Beijing, China. Atmos. Chem. Phys. Discuss. 2011, 11, 8173–8206. [Google Scholar] [CrossRef]
  11. Wang, B.; Shao, M.; Roberts, J.M.; Yang, G.; Yang, F.; Hu, M.; Zeng, L.M.; Zhang, Y.H.; Zhang, J.B. Ground-based on-line measurements of peroxyacetyl nitrate (PAN) and peroxypropionyl nitrate (PPN) in the Pearl River Delta, China. Int. J. Environ. Anal. Chem. 2010, 90, 548–559. [Google Scholar] [CrossRef]
  12. Xu, Z.; Xue, L.K.; Wang, T.; Xia, T.; Gao, Y.; Louie, P.K.K.; Luk, C.W.Y. Measurements of peroxyacetyle nitrate at a background site in the Pearl River Delta region: Production efficiency and regional transport. Aerosol Air Qual. Res. 2015, 15, 833–841. [Google Scholar] [CrossRef]
  13. Zhang, G.; Mu, Y.J.; Zhou, L.X.; Zhang, C.L.; Zhang, Y.Y.; Liu, J.F.; Fang, S.X.; Yao, B. Summertime distributions of peroxyacetyl nitrate (PAN) and peroxypropionyl nitrate (PPN) in Beijing: Understanding the sources and major sink of PAN. Atmos. Environ. 2015, 103, 289–296. [Google Scholar] [CrossRef] [Green Version]
  14. Ding, X.; Wang, X.M.; Gao, B.; Fu, X.X.; He, Q.F.; Zhao, X.Y.; Yu, J.Z.; Zheng, M. Tracer-based estimation of secondary organic carbon in the Pearl River Delta, south China. J. Geophys. Res. 2012, 117, D05313. [Google Scholar] [CrossRef]
  15. Hu, D.; Bian, Q.J.; Li, T.W.Y.; Lau, A.K.H.; Yu, J.Z. Contributions of isoprene, monoterpenes, β-caryophyllene, and toluene to secondary organic aerosols in Hong Kong during the summer of 2006. J. Geophys. Res. 2008, 113, D22206. [Google Scholar] [CrossRef]
  16. Lai, S.C.; Zhao, Y.; Ding, A.J.; Zhang, Y.Y.; Song, T.L.; Zheng, J.Y.; Ho, K.F.; Lee, S.-C.; Zhong, L.J. Characterization of PM2.5 and the major chemical components during a 1-year campaign in rural Guangzhou, Southern China. Atmos. Res. 2016, 167, 208–215. [Google Scholar] [CrossRef]
  17. Zhang, Y.H.; Su, H.; Zhong, L.J.; Cheng, Y.F.; Zeng, L.M.; Wang, X.S.; Xiang, Y.R.; Wang, J.L.; Gao, D.F.; Shao, M. Regional integrated experiments on air quality over Pearl River Delta 2004 (PRIDE-PRD2004): Overview. Atmos. Environ. 2008, 6157–6173. [Google Scholar] [CrossRef]
  18. Zhou, Y.; Yue, D.L.; Zhong, L.J.; Zeng, L.M. Properties of atmospheric PAN pollution in Heshan during summer time. Admin. Tech. Environ. Monitor. 2013, 4, 24–27. (In Chinese) [Google Scholar]
  19. Zhong, L.J.; Louie, P.K.K.; Zheng, J.Y.; Yuan, Z.B.; Yue, D.L.; Ho, J.W.K.; Lau, A.K.H. Science-policy interplay: Air quality management in the Pearl River Delta region and Hong Kong. Atmos. Environ. 2013, 76, 3–10. [Google Scholar] [CrossRef]
  20. Yuan, Z.B.; Zhong, L.J.; Lau, A.K.H.; Yu, J.Z.; Louie, P.K.K. Volatile organic compounds in the Pearl River Delta: Identification of source regions and recommendations for emission-oriented monitoring strategies. Atmos. Environ. 2013, 76, 162–172. [Google Scholar] [CrossRef]
  21. Guangdong Statistical Bureau (GSB), 2006–2016. Guangdong Statistical Yearbook, 2006–2016. Available online: http://www.gdstats./gov.cn (accessed on 13 August 2018).
  22. Guo, H.; Ling, Z.H.; Cheng, H.R.; Simpson, I.J.; Lyu, X.P.; Wang, X.M.; Shao, M.; Lu, H.X.; Ayoko, G.; Zhang, Y.L.; et al. Tropospheric volatile organic compounds in China. Sci. Total Environ. 2017, 574, 1021–1043. [Google Scholar] [CrossRef] [PubMed]
  23. Ling, Z.H.; Guo, H.; Chen, G.X.; Lam, S.H.M.; Fan, S.J. Formaldehyde and acetaldehyde at different elevations in mountainous areas in Hong Kong. Aerosol Air Qual. Res. 2016, 16, 1868–1878. [Google Scholar] [CrossRef]
  24. Zheng, X.; Wang, T.; Xue, L.K.; Louie, P.K.K.; Luk, C.W.Y.; Gao, J.; Wang, S.L.; Chai, F.H.; Wang, W.X. Evaluating the uncertainties of thermal catalytic conversion in measuring atmospheric nitrogen dioxide at four differently polluted sites in China. Atmos. Environ. 2013, 76, 221–226. [Google Scholar]
  25. Xu, Z.; Nie, W.; Nanjing University, Nanjing, China. Personal communication, 2018.
  26. Wang, J.L.; Wang, C.H.; Lai, S.H.; Chang, C.C.; Liu, Y.; Zhang, Y.H.; Liu, S.; Shao, M. Characterization of ozone precursors in the Pearl River Delta by time series observation of non-methane hydrocarbons. Atmos. Environ. 2008, 42, 6233–6246. [Google Scholar] [CrossRef]
  27. Lyu, X.P.; Liu, M.; Guo, H.; Ling, Z.H.; Wang, Y.; Louie, P.K.K.; Luk, C.W.Y. Spatiotemporal variation of ozone precursors and ozone formation in Hong Kong: Grid field measurement and modeling study. Sci. Total Environ. 2016, 569–570, 1341–1349. [Google Scholar] [CrossRef] [PubMed]
  28. Jenkin, M.E.; Saunders, S.M.; Wagner, V.; Pilling, M.J. Protocol for the development of the master chemical mechanism MCMv3 (Part B): Tropospheric degradation of aromatic volatile organic compounds. Atmos. Chem. Phys. 2003, 3, 181–193. [Google Scholar] [CrossRef]
  29. Saunders, S.M.; Jenkin, M.E.; Derwent, R.G.; Pilling, M.J. Protocol for the development of the master chemical mechanism MVMv3 (Part A): Tropospheric degradation of non-aromatic volatile organic compounds. Atmos. Chem. Phys. 2003, 3, 161–180. [Google Scholar] [CrossRef]
  30. Ling, Z.H.; Zhao, J.; Fan, S.J.; Wang, X.M. Sources of formaldehyde and their contributions to photochemical O3 formation at an urban site in the Pearl River Delta, southern China. Chemosphere 2017, 168, 1293–1301. [Google Scholar] [CrossRef] [PubMed]
  31. Wu, M.; Wu, D.; Fan, Q.; Wang, B.M.; Li, H.W.; Fan, S.J. Observational studies of the meteorological characteristics associated with poor air quality over the Pearl River Delta in China. Atmos. Chem. Phys. 2013, 13, 10755–10766. [Google Scholar] [CrossRef] [Green Version]
  32. Byun, D.W.; Ching, J.K.S. Science Algorithms of the EPA Models-3 Community Multiscale Air Quality (CMAQ) Modeling System; Environmental Protection Agency Office of Research & Development: Chicago, IL, USA, 1999. [Google Scholar]
  33. Byun, D.W.; Schere, K.L. Review of the Governing Equations, Computational Algorithms, and Other Components of the Models-3 Community Multiscale Air Quality (CMAQ) Modeling System. App. Mech. Rev. 2006, 59, 51–77. [Google Scholar] [CrossRef]
  34. He, K. Multi-resolution Emission Inventory for China (MEIC): Model framework and 1990–2010 anthropogenic emissions. In Proceedings of the AGU Fall Meeting, San Francisco, CA, USA, 3–7 December 2012. [Google Scholar]
  35. Wang, N.; Lyu, X.P.; Deng, X.J.; Guo, H.; Deng, T.; Li, Y.; Yin, C.Q.; Wang, S.Q. Assessment of regional air quality resulting from emission control in the Pearl River Delta region, southern China. Sci. Total Environ. 2016, 573, 1554–1565. [Google Scholar] [CrossRef] [PubMed]
  36. Wang, N.; Ling, Z.H.; Deng, X.J.; Deng, T.; Lyu, X.P.; Li, T.Y.; Gao, X.R.; Chen, X. Source contributions to PM2.5 under unfavorable weather conditions in Guangzhou City, China. Adv. Atmos. Sci. 2018, 35, 1145–1159. [Google Scholar] [CrossRef]
  37. Zheng, J.Y.; Zhang, L.J.; Che, W.W.; Zheng, Z.Y.; Yin, S.S. A highly resolved temporal and spatial air pollutant emission inventory for the Pearl River Delta region, China and its uncertainty assessment. Atmos. Environ. 2009, 43, 5112–5122. [Google Scholar] [CrossRef]
  38. Guo, H.; Cheng, H.R.; Ling, Z.H.; Louie, P.K.K.; Ayoko, G.A. Which emission sources are responsible for the volatile organic compounds in the atmosphere of Pearl River Delta? J. Hazard. Mater. 2011, 188, 116–124. [Google Scholar] [CrossRef] [PubMed]
  39. Ling, Z.H.; Guo, H.; Cheng, H.R.; Yu, Y.F. Sources of ambient volatile organic compounds and their contributions to photochemical ozone formation at a site in the Pearl River Delta, southern China. Environ. Pollut. 2011, 159, 2310–2319. [Google Scholar] [CrossRef] [PubMed]
  40. Zhang, Y.L.; Wang, X.M.; Barletta, B.; Simpson, I.J.; Blake, D.R.; Fu, X.X.; Zhang, Z.; He, Q.F.; Liu, T.Y.; Zhao, X.Y.; et al. Source attributions of hazardous aromatic hydrocarbons in urban, suburban and rural areas in the Pearl River Delta (PRD) region. J. Hazard. Mater. 2013, 250–251, 403–411. [Google Scholar] [CrossRef] [PubMed]
  41. Zhang, L.; Brook, J.R.; Vet, R. A revised parameterization for gaseous dry deposition in air-quality models. Atmos. Chem. Phys. 2003, 3, 2067–2082. [Google Scholar] [CrossRef] [Green Version]
  42. Han, X.; Zhang, M.G.; Skorokhod, A.; Kou, X.X. Modeling dry deposition of reactive nitrogen in China with RAMS-CMAQ. Atmos. Environ. 2017, 166, 47–61. [Google Scholar] [CrossRef]
  43. Wu, Z.Y.; Wang, X.M.; Chen, F.; Turnipseed, A.A.; Guenther, A.B.; Niyogi, D.; Charusombat, U.; Xia, B.C.; Munger, J.W.; Alapaty, K. Evaluating the calculated dry deposition velocities of reactive nitrogen oxides and ozone from two community models over a temperate deciduous forest. Atmos. Environ. 2011, 45, 2663–2674. [Google Scholar] [CrossRef] [Green Version]
  44. Turnipseed, A.A.; Huey, L.G.; Nemitz, E.; Stickel, R.; Higgs, J.; Tanner, D.J.; Slusher, D.L.; Sparks, J.; Flocke, F.; Guenther, A. Eddy covariance fluxes of peroxyacetyl nitrates (PANs) and NOy at a coniferous forest. J. Geophys. Res. 2006, 111, D09304. [Google Scholar] [CrossRef]
  45. McFadyen, G.G.; Cape, J.N. Physical and chemical influences on PAN concentrations at a rural site. Atmos. Environ. 1999, 33, 2929–2940. [Google Scholar] [CrossRef]
  46. Liu, Y.; Shao, M.; Kuster, W.C.; Goldan, P.D.; Li, X.H.; Lu, S.H.; de Gouw, J.A. Source identification of reactive hydrocarbons and oxygenated VOCs in the summertime in Beijing. Environ. Sci. Technol. 2009, 43, 75–81. [Google Scholar] [CrossRef] [PubMed]
  47. Yuan, B.; Shao, M.; de Gouw, J.; Parrish, D.D.; Lu, S.H.; Wang, M.; Zeng, L.M.; Zhang, Q.; Song, Y.; Zhang, J.B. Volatile organic compounds (VOCs) in urban air: How chemistry affects the interpretation of positive matrix factorization (PMF) analysis. J. Geophys. Res. 2012, 117, D24302. [Google Scholar] [CrossRef]
  48. Cheng, H.R.; Guo, H.; Wang, X.M.; Saunders, S.M.; Lam, S.H.M.; Jiang, F.; Wang, T.; Ding, A.; Lee, S.; Ho, K.F. On the relationship between ozone its precursors in the Pearl River Delta: Application of an observation-based model (OBM). Environ. Sci. Pollut. R. 2010, 17, 547–560. [Google Scholar] [CrossRef] [PubMed]
  49. Wang, T.; Nie, W.; Gao, J.; Xue, L.K.; Gao, X.M.; Wang, X.F.; Qiu, J.; Poon, C.N.; Meinardi, S.; Blake, D. Air quality during the 2008 Beijing Olympics: Secondary pollutants regional impact. Atmos. Chem. Phys. 2010, 10, 7603–7615. [Google Scholar] [CrossRef] [Green Version]
  50. Shao, M.; Zhang, Y.H.; Zeng, L.M.; Tang, X.Y.; Zhang, J.; Zhong, L.J.; Wang, B.G. Groud-level ozone in the Pearl River Delta and the roles of VOCs and NOx in its production. J. Environ. Manag. 2009, 90, 512–518. [Google Scholar] [CrossRef] [PubMed]
  51. Ling, Z.H.; Guo, H.; Lam, S.H.M.; Saunders, S.M.; Wang, T. Atmospheric photochemical reactivity and ozone production at two sites in Hong Kong: Application of a master chemical mechanism–photochemical box model. J. Geophys. Res. 2014, 119, 10567–10582. [Google Scholar] [CrossRef]
Figure 1. Location of the backgarden site and its surrounding areas in the Pearl River Delta Region.
Atmosphere 09 00372 g001
Figure 2. The domain of Weather Research and Forecasting (WRF) and Community Multiscale Air Quality (CMAQ) modeling (black frames: WRF modeling domain, blue frames: CMAQ modeling domain, black dots: surface meteorological sites, red triangle: the surface intensive observation site).
Atmosphere 09 00372 g002
Figure 3. Temporal profiles of winds, temperature, O3, PAN, NO, and NO2 measured (black) at the backgarden site during the study period, along with the simulated values (red) from CMAQ (no observed data were recorded on 22 July due to power outrage).
Atmosphere 09 00372 g003
Figure 4. Spatial distribution of physical and chemical contributions to averaged PAN concentrations at noon time. (a) Gas-phase chemical process, (b) dry deposition, (c) vertical transport, (d) horizontal transport; black triangle highlights the position of BGS. To more clearly present the variations in the contributions of different process, the negative values in the figure represent corresponding processes that made contributions to the removal of PAN, while positive values represent corresponding processes that could increase PAN levels at the sampling site.
Atmosphere 09 00372 g004
Figure 5. Surface distribution of 1400 local time (LT) (a) temperature (unit: K) and (b) reaction rate of C2O3 + NO2 → PAN (unit: ppbv) in Pearl River Delta (PRD). The black triangle highlights the position of the backgarden site (BGS).
Atmosphere 09 00372 g005
Figure 6. Difference of PAN concentrations between 800 m and surface (left panel, PANat 800m − PANat surface) and difference of gas-phase chemistry between 800 m and surface (right panel, CHEMat 800m − CHEMat surface).
Atmosphere 09 00372 g006
Figure 7. The contributions of different processes to the concentration of PAN at the BGS site.
Atmosphere 09 00372 g007
Figure 8. Contributions of different pathways to PA production at the BGS site.
Atmosphere 09 00372 g008
Figure 9. Top 6 VOC species/groups with the highest relative incremental reactivity (RIR) at the backgarden site during the sampling period.
Atmosphere 09 00372 g009
Table 1. The configuration of physical parameterization for WRF model.
WRF v3.7.1CMAQ v5.0.2
Microphysics SchemeMorrison (2 moments)Generalized-Coordinate Driver ModuleYamartino
Cumulus SchemeKain–FristschGas-Phase Chemistry Solver Modulecb05tucl_ae5
Longwave Radiation SchemeRRTMAerosol ModuleAero5
Shortwave Radiation SchemeDudhiaPhotolysis Calculation ModulePhot_inline
Boundary Layer SchemeACM2Cloud ModuleAcm_ae5_kmti
Land Surface SchemePleim–XiuChemical Mechanismcb05tucl
Urban Surface SchemeUCM
Table 2. Comparison of modeling results with observations.
Meteorological Variables (Unit)Mean
Obs.Sim.MBNMBRMSEIOA *
Surface pressure (hPa)998.8998.0−0.80.013.00.99
2 m air temperature (°C)29.128.5−0.6−0.011.20.82
2 m relative humidity (%)80.385.65.30.18.00.75
10 m wind speed (m/s)1.73.01.31.31.70.60
O3 (ppb)29.131.3−2.20.0117.20.84
PAN (ppb)0.5070.5320.0250.050.5610.74
NOx (ppb)21.816.0−5.8−0.2715.30.73
* IOA is the index of agreement (IOA, IOA = 1 i = 1 n ( s i m ( i ) O b s ( i ) ) 2 i = 1 n ( | S i m ( i ) O b s ¯ | + | O b s ( i ) O b s ¯ | ) 2 ).
Table 3. The mixing ratios of PAN, its primary precursors, and trace gases at the backgarden site (median ± 95% confidence interval, unit: PAN, NOx, NOy, and O3 are in ppbv, while non-methane hydrocarbons (NMHCs) are in pptv).
SpeciesMixing RatioSpeciesMixing Ratio
PAN0.31 ± 0.02cis-2-Butene109 ± 11
NOx12 ± 1Isoprene566 ± 68
NOy15 ± 1Toluene2335 ± 408
O321 ± 1m+p-Xylene566 ± 99
Propene1409 ± 96 o-Xylene245 ± 38
trans-2-Butene113 ± 13Trimethylbenzenes264 ± 44

