Article

Potential Impacts of Land Cover Change on the Interannual Variability of Rainfall and Surface Temperature over West Africa

1
Laboratoire d’Océanographie, des Sciences de l’Environnement et du Climat (LOSEC), UFR Sciences et Technologies, Université A. SECK de Ziguinchor, Ziguinchor 270000, Senegal
2
IRD, CNRS, Grenoble INP, IGE, Université de Grenoble Alpes, F-38000 Grenoble, France
*
Author to whom correspondence should be addressed.
Atmosphere 2018, 9(10), 376; https://doi.org/10.3390/atmos9100376
Submission received: 15 June 2018 / Revised: 13 September 2018 / Accepted: 21 September 2018 / Published: 28 September 2018
(This article belongs to the Special Issue Precipitation Variability and Change in Africa)

Abstract

:
We used the Abdu Salam International Centre for Theoretical Physics (ICTP) Regional Climate Model version 4.5 (RegCM4.5), to investigate the potential impacts of land cover change of the Sahel–Sahara interface on the West African climate over an interannual timescale from 1990 to 2009. A simulation at 50 km grid spacing is performed with the standard version of the RegCM4.5 model (control run), followed by three vegetation change experiments at the Sahel-Sahara interface (15° N and 20° N): forest, tall grass, and short grass savanna. The impacts of land cover change are assessed by analyzing the difference between the altered runs and the control one in different sub-domains (western Sahel, central Sahel, eastern Sahel, and Guinea). Results show that the presence of forest, tall grass, and short grass savanna at the Sahel–Sahara interface tends to decrease the mean summer surface temperature in the whole domain. Nevertheless, this decrease is more pronounced over the Central Sahel when considering the forest experiment. This temperature decrease is associated with a weakening (strengthening) of the sensible (latent) heat flux in the whole domain. An analysis of the radiation field is performed to better explain the changes noted in the latent heat flux, the sensible heat flux, and the surface temperature. When considering the rainfall signal, the analysis shows that the afforestation options tend to alter the precipitation in the considered sub-domains substantially by increasing it in the whole Sahel region, with strong interannual variability. This rainfall increase is associated with an increase of the atmospheric moisture. Finally, we investigated the impacts of the afforestation options on some features of the rainfall events, and on the atmospheric dynamics during wet and dry years. All afforestation options tend to increase the frequency of the number of rainy days in regions located south of 18° N during both periods. Nevertheless, this increase is stronger over the Central and Eastern Sahel during wet years in the forest case. All afforestation experiments induce an increase (decrease) of the low-levels monsoon flux in the Eastern Sahel (western Sahel) during both periods. At the mid-levels, the three afforestation options tend to move northward and to decrease the intensity of the African Easterly Jet (AEJ) south of 13° N during wet and dry years.The intensity of the AEJ is weaker during the wet period. The vegetation change experiments also affect the Tropical Easterly Jet (TEJ), especially during wet years, by increasing its intensity over the southern Sahel. The analysis of the activity of African Easterly Waves (AEWs) patterns exhibits a decrease of the intensity of these disturbances over the Sahel during both periods. This may be due to the weakening of the meridional temperature contrast between the continent and the Gulf of Guinea due to the Sahel–Sahara surface temperature cooling induced by the afforestation. In summary, this study shows that during both periods, the increase of the atmospheric moisture due to the afforestation is associated with favorable AEJ/TEJ configurations (weaker and northward position of the AEJ; stronger TEJ) which in turn may create a stronger convection and then, an increase in the Sahel rainfall. This Sahel rainfall increase is associated with a strengthening of the intense and heavy rainfall events which may impact diversely local populations.

1. Introduction

The West African rainfall pattern is marked by a strong variability from the interannual timescale to decadal timescales. The most striking example of this variability is a transition from a wet period (1950–1968) to a dry period marked by rainfall deficit from the early 1970s [1,2]. Indeed, since the early work of [3,4], the interannual variability of rainfall over the Sahel has been a recurring topic for populations and of interest to a diversified scientific community as climatologists, atmospheric dynamists, hydrologists, and ecologists. Moreover, this rainfall variability is critical for many activities, such as water resources monitoring and rain-fed agriculture. Many studies have been devoted to the simulation and the understanding of this rainfall variability over West Africa [5,6,7]. [5] found that the majority of the regional climate models (RCMs) are able to better simulate the rainfall variability over the regions of West Africa with a high correlation coefficient compared with observation data. These authors also concluded that a good performance of the regional climate models in simulating the monsoon dynamic feature variability is very important for a better representation of the rainfall variability over West Africa. In fact, during the past decades, such variability has caused a decrease of rainfall during the rainy season [8,9,10] leading to drought and famine. To understand the origin of this rainfall variability, several mechanisms have been identified. These mechanisms include the sea surface temperature anomalies [11,12,13,14,15], continental surface conditions [16,17], the variability of the African easterly waves [18], and wind dynamics [19,20], in addition to the possible effect of global climate change [21,22].
Furthermore, environmental modifications in West Africa have been linked to a degradation of the natural land cover. The pioneering study of land cover change in this region is that of [3], which suggested that the rainfall-producing circulation over this region is sensitive to changes in the state of the vegetation at the desert border with the Sahara. Several other modeling studies [23,24,25,26,27,28,29,30] have investigated the role of land surface processes on the different characteristics of the West African climate. The results of all these studies suggest that the conditions of the land surface, as characterized by vegetation cover play a significant role in rainfall variability over West Africa. Moreover, among those studies on the impact of vegetation cover, [31] found a modest sensitivity of the West African monsoon to desertification in the Sahel, but suggested that regional rainfall may be more sensitive to deforestation further south on the Guinea coast. Xue et al. [25] argued that desertification affects both the intensity and spatial extent of precipitation, and the associated circulation over West Africa. All of the results enumerated above encouraged further experiments to more closely study the impacts of land cover change on the West African climate.
An African initiative called the Great Green Wall project recently becomes fully operational in the Sahel region. Its consists of greening a strip of land extending from Senegal to Djibouti at the Sahel-Sahara interface, with the aim of fighting against desertification, land degradation, and climate change consequences. This greening effort will improve the living conditions and strengthen the resilience of the local populations with a sustainable development and management of natural resources. Then, understanding the West African climate response to various greening programs such as the Great Green Wall project becomes an important topic to investigate. However, given that the climatic system is non-linear with the existence of thresholds of reaction, feedbacks, interactions of different spatial and temporal scales, the answer to such a forcing could be complicated by all the complex interactions between its components. The main goal of this work is to investigate the potential impacts of the Sahel–Sahara interface land cover change on the interannual variability of rainfall and surface temperature, as well as changes in the atmospheric dynamic cover over West Africa. The model description, the experimental setup, and the data used are presented in the next section, followed by the results and the discussion.

2. Model Description, Experimental Design, and Data Used

2.1. Model Description

We used the latest version of the Regional Climate Model (RegCM4.5), developed at the Abdu Salam International Center for Theoretical Physics (ICTP-Italy-Trieste), as described in [32]. The RegCM4.5 is a hydrostatic, compressible, sigma-p vertical coordinate model, which includes various options of physics parameterizations. The model has 18 levels in the vertical, and it is based on the hydrostatic dynamic core of the National Centre for Atmospheric Research/Pennsylvania State University’s mesoscale meteorological model Version 5 (NCAR/PSU’s MM5; [33]). In RegCM4, the radiative transfer calculations are carried out with the radiative transfer scheme of the Community Climate Model (CCM3) [34], as implemented by [35]. This scheme includes calculations for the short-wave and infrared parts of the spectrum, including both atmospheric gases and aerosols.
For our experiments, interactions between the land surface and the atmosphere were described using the Biosphere Atmosphere Transfer Scheme (BATS1E; [36]), while the scheme of [37] was used to represent fluxes from ocean surfaces. Large scale rain was parameterized with sub-grid explicit moisture and a cloud scheme (SUBEX) developed by [38], which is a physically-based parameterization, including subgrid-scale cloud fraction, cloud water accretion, and evaporation of falling rain drops. The model has been used for a wide range of applications, including simulations of the West African monsoon spatio-temporal variability [6,26,39,40].

2.2. Experimental Design

The land surface processes are represented by the Biosphere Atmosphere Transfer Scheme 1E (BATS1E), as described in [36] whereas the nonlocal vertical diffusion scheme of the [41] model is used for the parameterization of the planetary boundary layer. We used mixed convection schemes, those of [42] with the closure of [43] for the main land and [44] for the ocean. The simulation domain, as well as the considered sub-domains (central Sahel, western Sahel, eastern Sahel and the Guinean region) and the topography are represented in Figure 1. The domain was enough large to properly simulate the processes that govern rainfall variability over West Africa, and to minimize inconsistencies between the boundary conditions and the model.
Four experiments (models runs) were integrated using four different land cover patterns (Figure 2) from November 1989 to December 2009. The first two months were considered as the spin-up times and they are not included in the analysis. The simulations were carried out at a spatial resolution of 50 km.
The default land cover patterns (vegetation) of West Africa provided by the standard version of the RegCM4 model were used in the first experiment named the control run (Figure 2a).The second, third, and fourth experiments named RegCM4_ALTER are identical to the first with the exception that the vegetation cover in the region located between 15° N and 20° N (Sahel–Sahara interface) which is a combination of grass (15° N–16° N), semi-desert (16° N–18° N), and desert (18° N–20° N) is changed respectively to forest/field mosaic (Figure 2b as in [30]), tall grass savanna (Figure 2c), and short grass savanna (Figure 2d). The different types of land cover patterns used are shown in Table 1. Following these plant cover changes (afforestation), several physical parameters, such as albedo, leaf area index, and the roughness length were significantly modified, as shown by Table 2.

2.3. Data and Methods

The model simulations were initialized and driven by the ERA-Interim reanalysis (spatial resolution of 1.5° × 1.5° [45,46]). A reanalysis data is the result of the combination of the outputs of a numerical weather model with all of the available observation data. Meteorological reanalyses are currently the best way to describe the state of the atmosphere, especially in areas where in situ observation data are insufficient, such as the case in West Africa. The ERA-Interim reanalyses are available from 1979 to the present time, and they have been used previously for various studies [47,48,49] because of their good ability to reproduce the main components of the West African monsoon system [50,51].
The Global Precipitation Climatology Project (GPCP, [52]) data, with a spatial resolution of 2.5° × 2.5°, were used to analyze the temporal evolution of precipitation in the considered sub-domains. GPCP data are a combination of in situ measurements and satellite estimates.
The observed global land monthly mean surface temperature dataset developed recently at the Climate Prediction Center (CPC) of the National Centers for Environmental Prediction (NCEP) [53] are used to validate the model land surface temperature output. This data set is a combination of two large individual data sets of station observations collected from the Global Historical Climatology Network version 2 and the Climate Anomaly Monitoring System (GHCN + CAMS). These gridded time-series data cover the period 1948 to the present, and they are calculated on a high resolution of 0.5° × 0.5° grids, which are based on an archive of global land monthly mean surface temperatures provided by more than 7280 weather stations distributed around the world for the GHCN, and 6158 for the CAMS. Fan et al. [53] show that the quality of this new GHCN + CAMS land surface air temperature is reasonably good, and that the new data set can capture most common temporal-spatial features in the observed climatology and anomaly fields over both regional and global domains.
We assessed the impacts of the land cover changing on rainfall by analyzing the difference between the altered versions of the model and the control one. The method of [54] is used to calculate the standardized anomalies of rainfall (IR) in the considered sub-domains (central Sahel, western Sahel, eastern Sahel, and the Guinean region). This method allows for the synthesis of information that is delimited in space and time. The grid points delimited by the two latitudes and the two longitudes of each sub-domains of a given parameter (precipitation here) are first standardized (to get rid of the units of measurements), then averaged for each year i.
P p i = V p i V p ¯ σ p
where V p i , V p ¯ and σ p represent respectively the precipitation of the point p for the year i, the mean, and the standard deviation.
I R i = 1 N p = 1 N P p i
where N is the number of points available.

3. Results

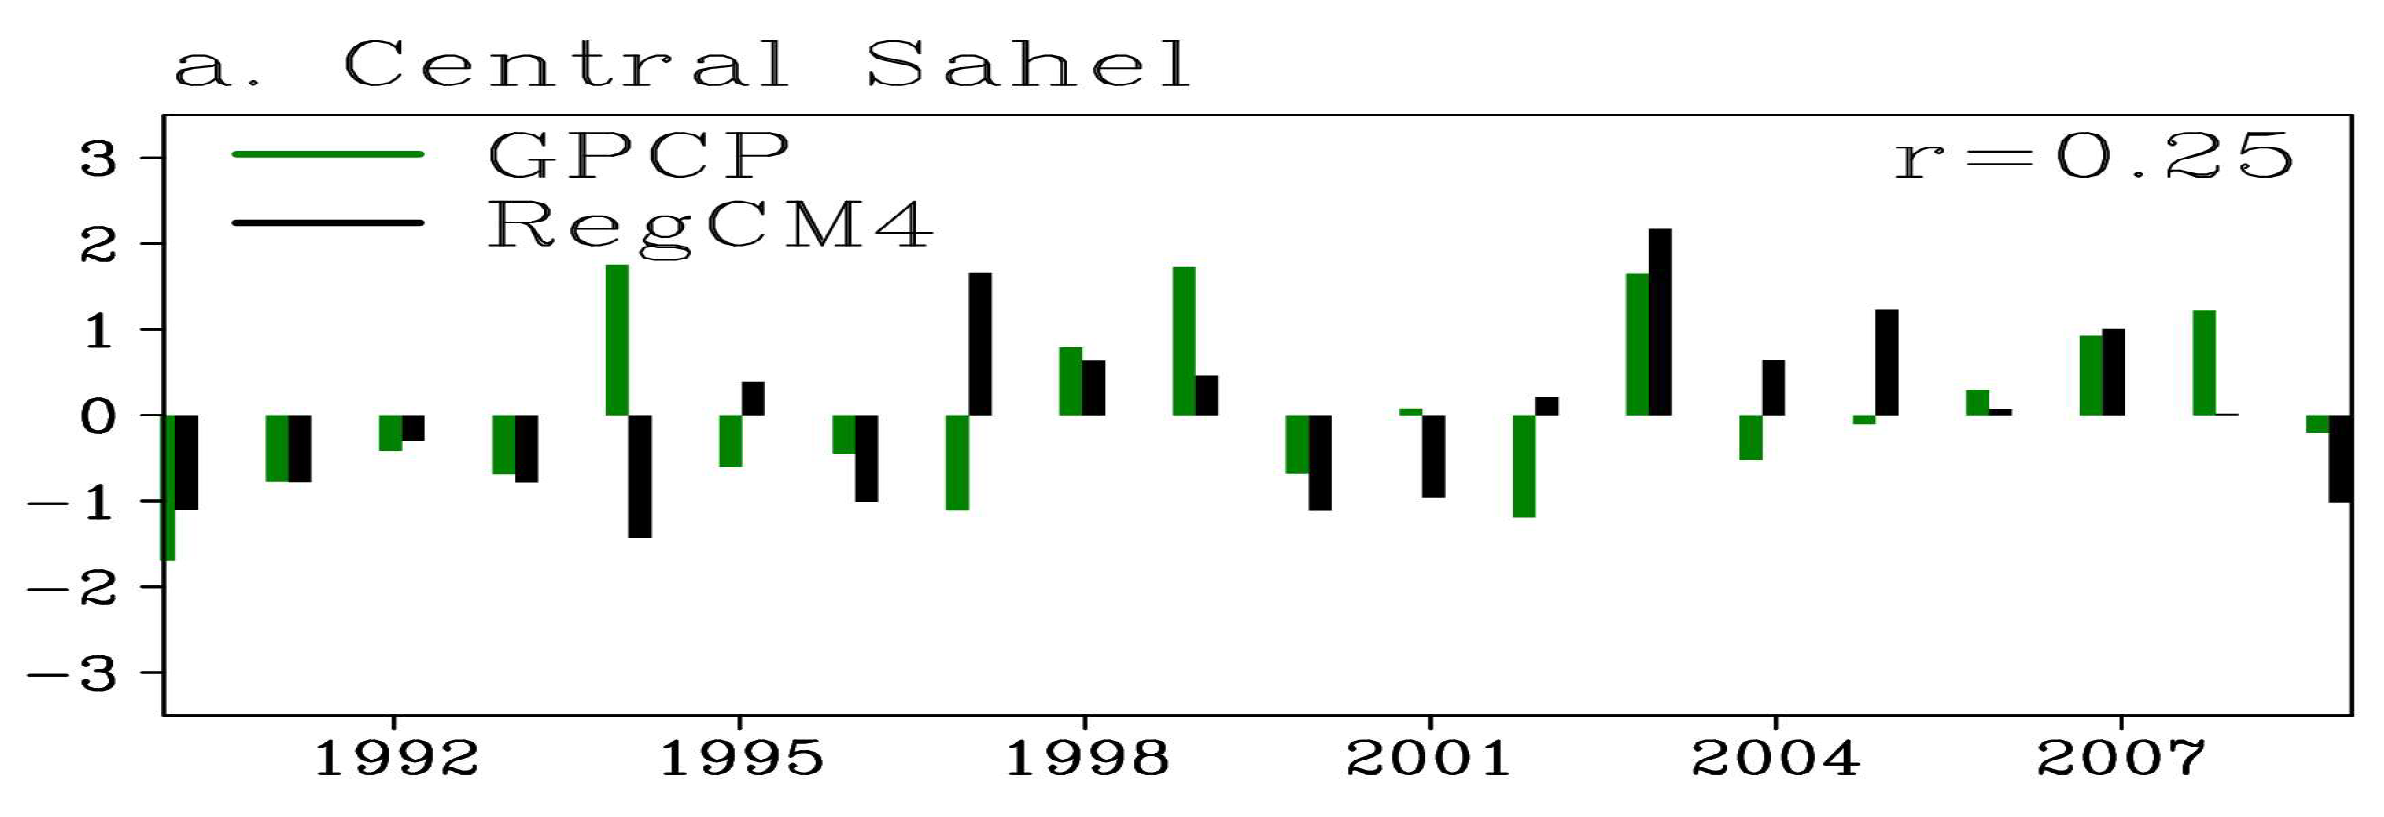
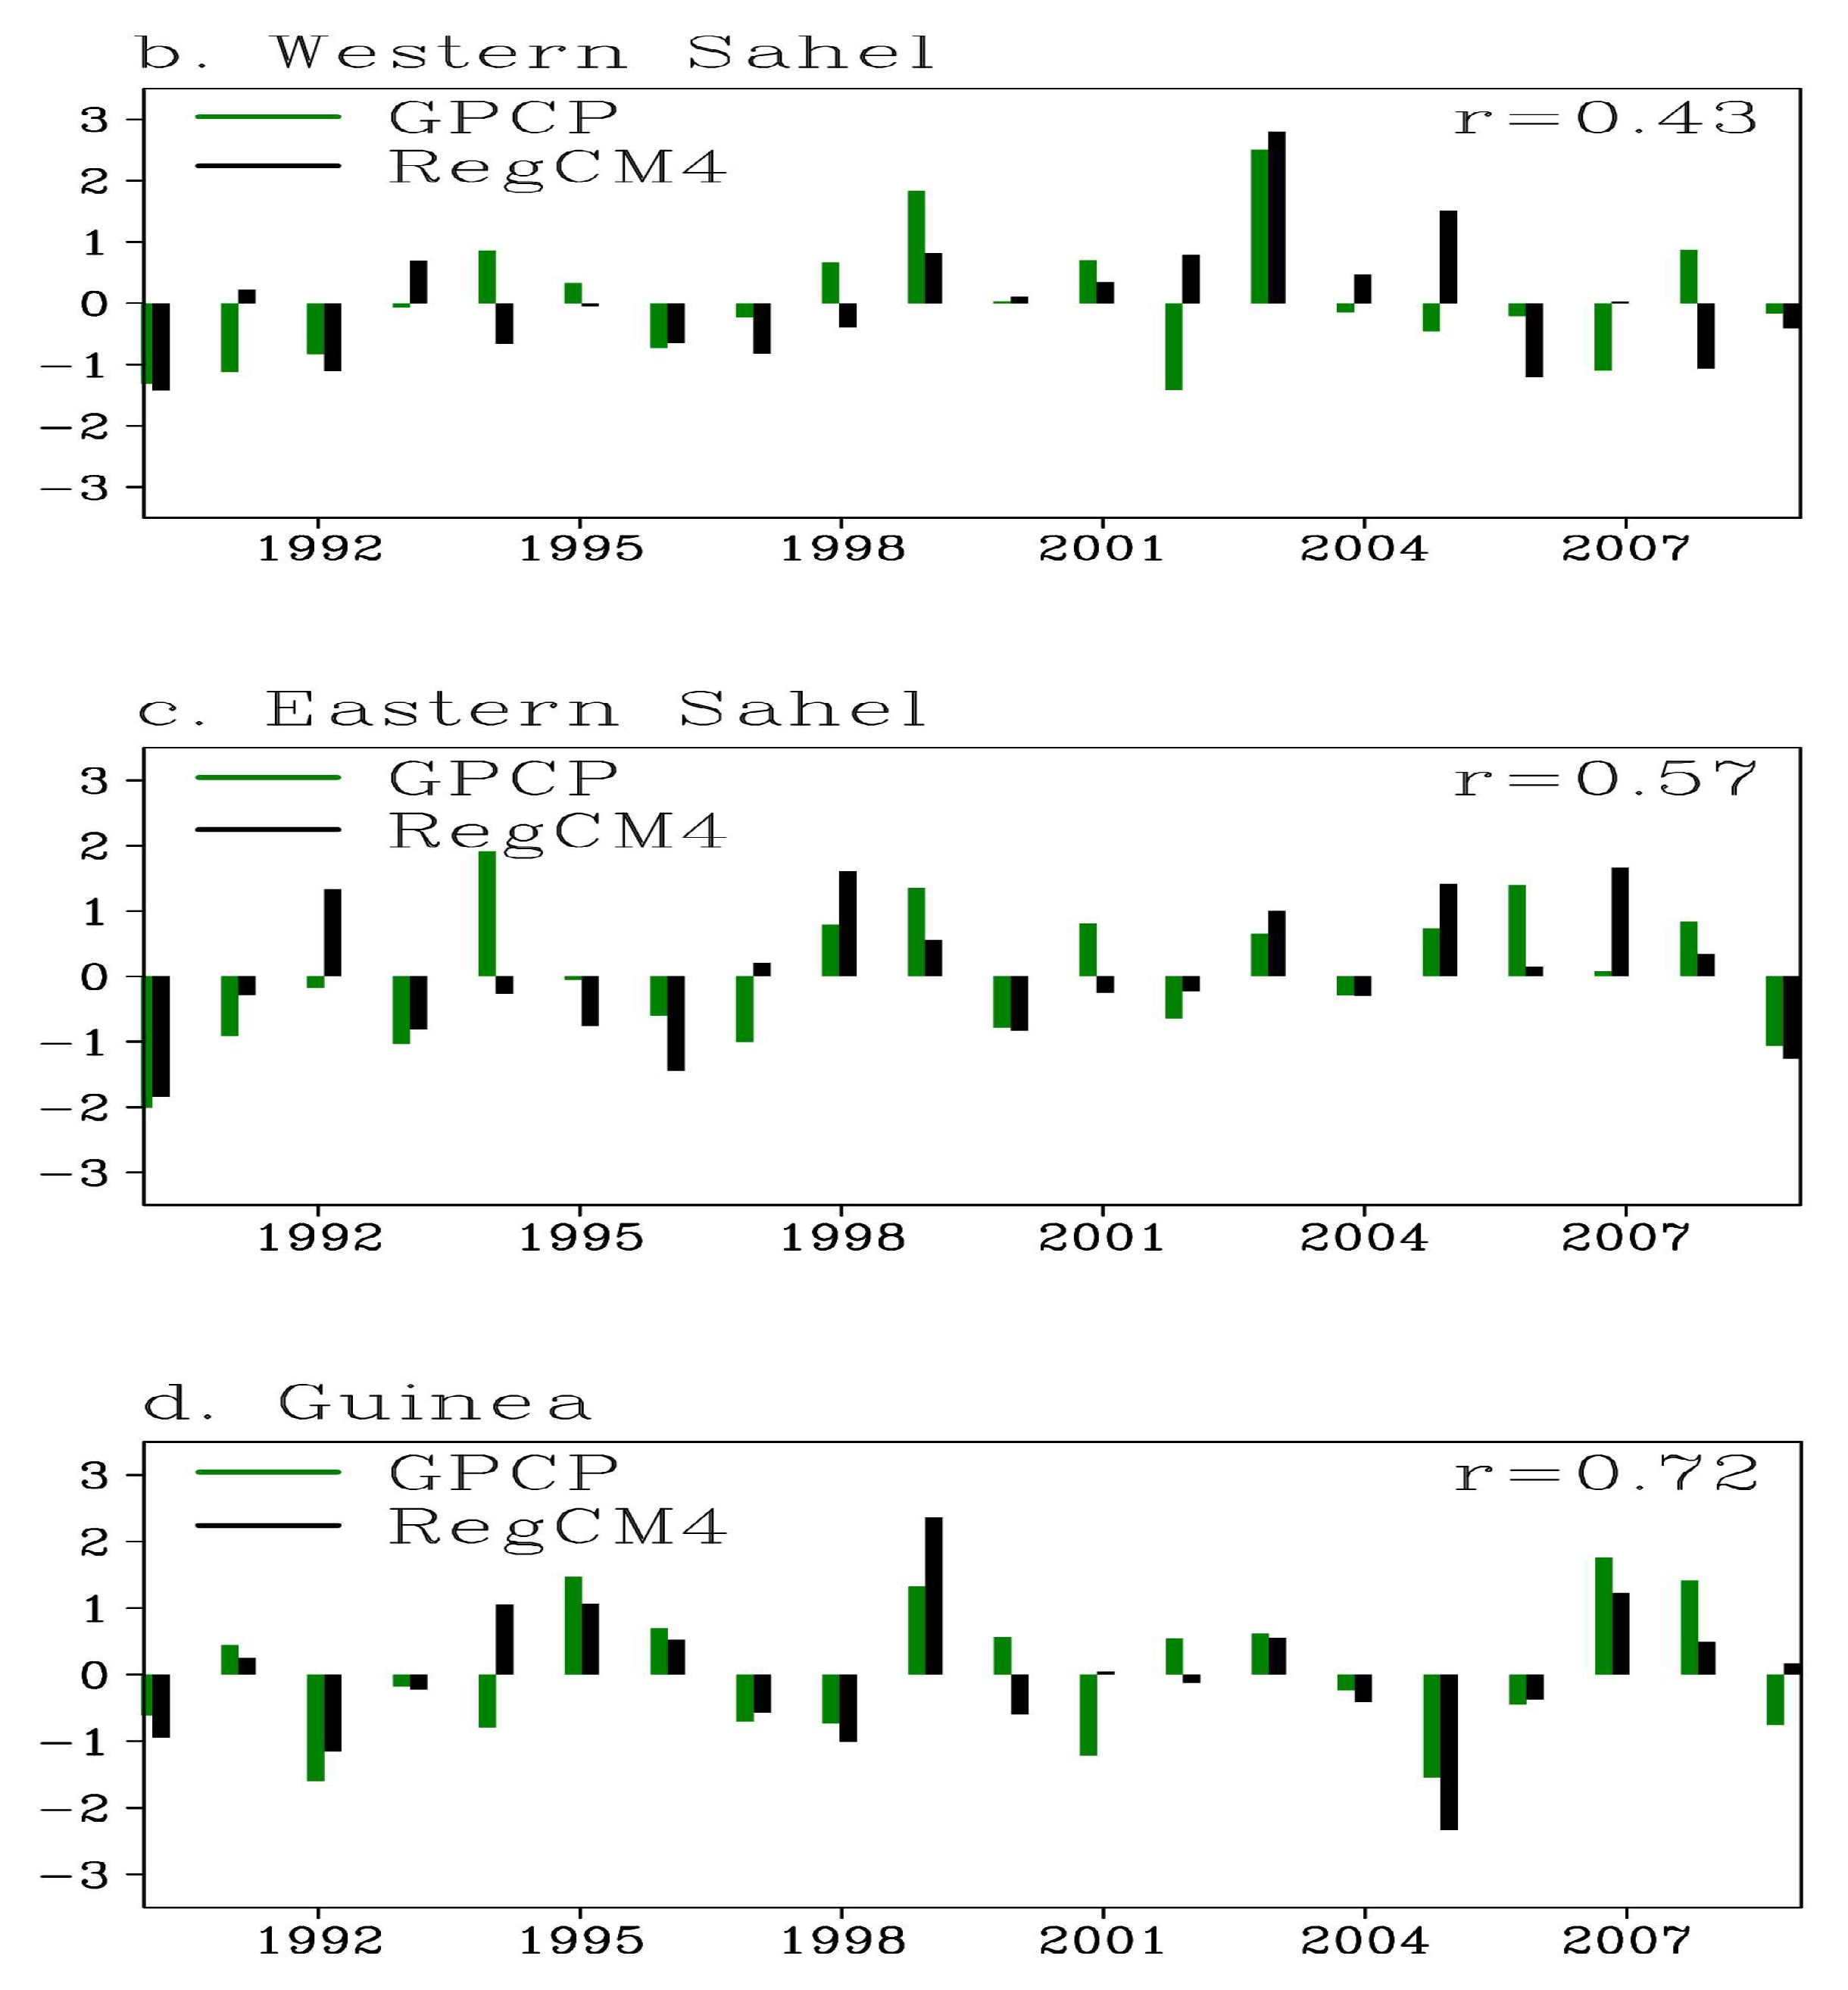
3.1. Model Validation

We first validated the simulation of the standard version of the RegCM4 model before studying the impacts of the land cover change on West Africa by comparing the summer rainfalls and the land surface air temperatures as simulated by the model with the GPCP observation data and the Climate Prediction Center (CPC) of the National Centers for Environmental Prediction (NCEP) observation-based global land mean surface air temperature dataset, respectively.
Figure 3 represents the mean summer rainfall (June to September from 1990 to 2009) for GPCP climatology, the standard version of RegCM4 model and their difference. GPCP climatology exhibits a zonal distribution with precipitation decreasing from the South to the North and maxima located in orographic regions: Fouta Jallon Mountains, Jos Plateau, and Cameroon Highlands. The standard version of RegCM4 reproduces the zonal structure of rainfall as well as the maxima. The difference between the standard version of RegCM4 and the GPCP climatology ranges between −1.5 mm/day over the Eastern Sahel and 1 mm/day over the Guinean coast, particularly in the southern part of the Cameroon Highlands. A dry bias of about −1 mm/day prevails throughout the western Sahel region (Figure 3c). These low biases show the ability of the RegCM4 model to simulate the West African climate realistically. Figure 4 represents the mean summer land surface temperature (June to September from 1990 to 2009) for the GHCN_CAMS observations data, the standard version of the RegCM4 model, and their difference. The GHCN_CAMS data show a north–south gradient, with coldest temperatures (below 22 °C) over the orographic regions (Guinean Highlands (10° N, 13° W), Jos plateau (10° N, 7.5° E), and Cameroon Mountains (6° N, 12° E)), and higher temperatures (above 30 °C) over the Sahara Desert (above 34 °C) (Figure 4a). RegCM4 (Figure 4b) well simulates this north–south gradient, and the maximum (above 34 °C) around the area of the Saharan Heat Low (SHL) is centered over 25° N, and it is partly linked to the onset of the rainy season over the Sahel [55,56]. The model well reproduces the minima (below 22 °C) over the orographic regions, demonstrating its capability to capture fine-scale features over regions of steep orography.
A cold bias (below −2 °C) prevails over the Guinean coast and the Central part of the Sahara Desert. The model generally exhibits low biases over The Sahel region. However, it slightly overestimates the surface temperature over the coastal regions of western Sahel (around 1 °C) and over Eastern Sahel (Figure 4c). It is difficult to determine the causes of the temperature biases for the Regional Climate Models (RCMs) [57]. Overall, some authors [32,33,34,35,36,37,38,39,40,41,42,43,44,45,46,47,48,49,50,51,52,53,54,55,56,57,58] showed that the cold bias simulated by the regional climate models could partly originate from an inaccurate representation of surface albedo, vegetation distribution, cloud radiative forcing, and partitioning of net solar and longwave radiation into latent and sensible heat. However, the low biases in Figure 4 show the ability of the RegCM4 model to simulate the West African land surface temperature patterns. The next step is to evaluate the impacts of the land cover change on West African rainfall and temperature interannual variability.

3.2. Interannual Variability

The following study evaluated the potential impacts of the land cover changing in the Sahel Sahara interface on the interannual variability of rainfall and surface temperature, as well as changes in precipitation features and in the atmospheric dynamics over West Africa. Figure 5 shows the standardized anomalies of summer rainfall from GPCP observation, and the standard version of the RegCM4 model. The persistence of dry years from 1990 to 1993 over the Sahel band observed in the GPCP product was well simulated by the RegCM4 model, and generally, the intensities and the signs of the anomalies were well simulated compared to GPCP observation. A significant change in the variability of rainfall was noted after 1993, with alternations between very wet years and very dry years. This confirmed the previous results of [1,59,60]. These authors showed that the period after 1993 seemed to be a turning point for the Sahel, with the succession of very wet years and very dry years. Furthermore, Le barbé et al. [61] showed that over West Africa, a long period of rainfall deficit is associated partly with a decrease of the number of rainy events during the core of the rainy season. This period of rainfall deficits leads to drought, famine, and the collapse of economies in West African countries. A strong positive correlation (exceeding 0.5) was obtained over the Eastern Sahel and the Guinean region.
Figure 6 shows the difference of the summer (from June to September; JJAS) rainfall between the altered simulations and the reference run. The analysis showed that the presence of forest and tall and short grass at the Sahel–Sahara interface substantially alter the rainfall by increasing it over the whole Sahel region, with a strong interannual variability. The maximum rainfall changes are found in the Sahel band with a stronger increase over the western part. The forest experiment (Figure 6a) tended to favor larger precipitation amounts than that of tall grass savanna (Figure 6b). The land vegetation change performed with tall and short grass savanna affected rainfall similarly (Figure 6b,c). Reforesting the Sahel–Sahara interface leads to wetter conditions in the western Sahel region than in the other sub-domains (Figure 6a).
These results confirmed the remote effect of reforestation, meaning that the change of vegetation cover can affect rainfall locally or on distant regions [28]. The increase in rainfall over the Sahel is also in agreement with the results of [62,63]. The direct consequence of such increase could include a change in the frequency of hydroclimatic extreme events such as severe floods over the Sahel band [30,64].
The forest option leads to wetter conditions in the Sahel band (especially in western Sahel) than that of tall and short grass savanna (Table 3). Furthermore, the land vegetation change done with the tall and short grass savanna affected rainfall similarly over central Sahel and the Guinea region. Generally, the impact of the three afforestation options was weaker in the Guinea region (Table 3).
To better explain the impacts of land surface conditions on rainfall, the evolution from 1990 to 2009 for the summer evapotranspiration (JJAS) for the control run and the changes of evapotranspiration induced by all afforestation options is shown in Figure 7. The control run showed a lower variation of evapotranspiration in the whole domain (Figure 7a), with stronger values (above 4 cg/m2/s) located in the Guinea region. The impacts of the vegetation change for all options (forest, tall grass, and short grass savanna) strongly increased the evapotranspiration over the Sahel than over the Guinea Coast, with maxima in the central Sahel region (Figure 7b–d). Overall, the presence of forest (Figure 7b) leads to larger evapotranspiration over the Sahel band than that of the tall grass savanna (Figure 7c). However, the evapotranspiration increase remains slightly higher in the tall grass experiment (Figure 7c) than in the short grass experiment (Figure 7d). The increase in evapotranspiration variability in the three altered experiments was consistent with that of the relative humidity pattern (figure not shown).
The increase of rainfall (Figure 6) induced by the presence of forest, tall grass, and short grass may be due to an increase of the evapotranspiration in the whole domain (Figure 7) and the strengthening of the atmospheric moisture.
In this section, the potential impacts of the land cover changing on the surface temperature trend were assessed.
Figure 8 shows the temporal evolution of the surface temperature for the control run, and the changes of surface temperature induced by the land cover change. In the control run, the central Sahel and the eastern Sahel regions are warmer than the western Sahel region and the Guinean coast during the study period; the lowest temperature values (<25 °C) being noted in the Guinean region. The incorporation of forest, tall grass, and short grass savanna in the model at the Sahel–Sahara interface led to a decrease of the surface temperature over the whole Sahel band (Figure 8b–d). This was consistent with the observed rainfall increase simulated in this sub-domain (Figure 6), which tended to create evaporative cooling over that domain, but also with the evapotranspiration increase simulated over these sub-domains (Figure 7). The cooling effect induced by the land cover change was more pronounced over the Central Sahel with the forest option than with that of the tall grass and short grass savanna simulations. However, all afforestation options did not affect the temperature over the Guinean region too much (Figure 8b–d).
Figure 9 shows the sensible heat flux over the considered sub-domains for the standard version of the RegCM4 model and the difference between the altered simulations and the reference run. In the control run, the maxima of the sensible heat flux (≥60 W·m−2) are found over the Sahel region, and the minima (<35 W·m−2) are simulated over the Guinean region. The presence of forest, tall grass, and short grass savanna leads to a decrease of the sensible heat flux over central and western Sahel, and they tend to increase it over eastern Sahel (Figure 9b–d). Nevertheless, this decrease induced by the land cover change is more pronounced over the central and western Sahel with the forest experiment than with the other two experiments.
The analysis of the latent heat flux (Figure S1) shows that the reforestation leads to a larger increase in the Sahel (especially in central Sahel) than in the Guinea Coast. This increase may be the result of a stronger simulated evapotranspiration (Figure 7b) in the forest experiment.
The surface temperature decrease (Figure 8b–d) could be partly due to the weakening of the sensible heat flux (Figure 9b–d) and the strong increase of the latent heat flux over the Sahel. This conclusion is consistent with the studies of [65].
These fluxes analysis results are also consistent with the rainfall increase induced by the reforestation.
Finally, this interannual variability study shows that the Sahel region (especially central Sahel) is more impacted by all afforestation options than the Guinea area.
This analysis over the sub-domains shows consistent results with peaks (drops) in surface temperature, generally corresponding to drops (peaks) in evapotranspiration, rainfall, and latent heat as well as with peaks (drops) in sensible heat. The decrease in temperature during 1992, 1996, and 2003 may be partly due to the combined effects of the strengthening (weakening) of the latent (sensible) heat flux. This general cooling in the Sahel region induced by the presence of forest, tall grass, and short grass savanna may temper the occurrence of heat wave episodes, as well as the rise of surface temperatures due to global warming. Furthermore, [28] showed that while reforestation induces cooling over some areas (especially over the reforested area), it produces warming over other areas (usually bordering the reforested area). However, our results did not show this contrast between the reforested area and regions close to that domain, suggesting that the reforestation experiments results may depend on the location of vegetation cover change and the details of the modeling experiments.
This part is devoted to the analysis of some surface radiation parameters that are necessary for a better interpretation of the change in the sensible heat flux, the latent heat flux, and the surface temperature. The analysis of the surface net upward longwave flux (Figure 10a) shows that the standard version of the RegCM4 model simulates stronger values (>60 W·m−2) over the Sahel (central, western and eastern). High values (>90 W·m−2) are found over eastern Sahel (Figure 10a); while the lowest values (<40 W·m−2) are found over the Guinea zone (Figure 10a). The impact of the three vegetation types (Figure 10b–d) is to decrease the surface net upward longwave flux over the Sahel band, with stronger values (−20 W·m−2) recorded in 2003 in the forest experiment; in coherence with the interannual variability of the surface temperature. This result suggests that the surface temperature decrease (Figure 8) could be partly linked to the decrease of the surface net upward longwave radiation.
Figure 11 shows the interannual variability of the surface net downward shortwave flux (W·m−2) for the RegCM4 model (top) and the difference between the three altered runs and the control one (down). The standard version of the RegCM4 model exhibited strong values (>150 W·m−2) of shortwave flux over all sub-domains. The highest values (>200 W·m−2) were found over western Sahel.
All afforestation options tend to increase the surface net downward shortwave flux over all sub-domains particularly in eastern Sahel. The strengthening of this flux over the Sahel is consistent with the reduction of the reflective shortwave radiation at the surface due to the greening effect induced by the vegetation cover changes. In fact, the greening of the land surface tends to reduce the albedo and then the reflection. The changes in latent heat flux and net upward longwave radiation are consistent, suggesting that the increase of the net downward shortwave flux may induce stronger evapotranspiration and then the reinforcement of latent heat flux.
The analysis of the net radiation flux at the surface (Figure S2) shows that the three afforestation options tend to increase this flux over West Africa as in the case of the latent heat. At the first order, the surface net radiation flux is balanced by the sum of latent and sensible heat flux, because of the fact that the ground flux is often negligible. This result suggests that the surface net radiation flux is dominated by the latent heat component induced by the strong evapotranspiration.

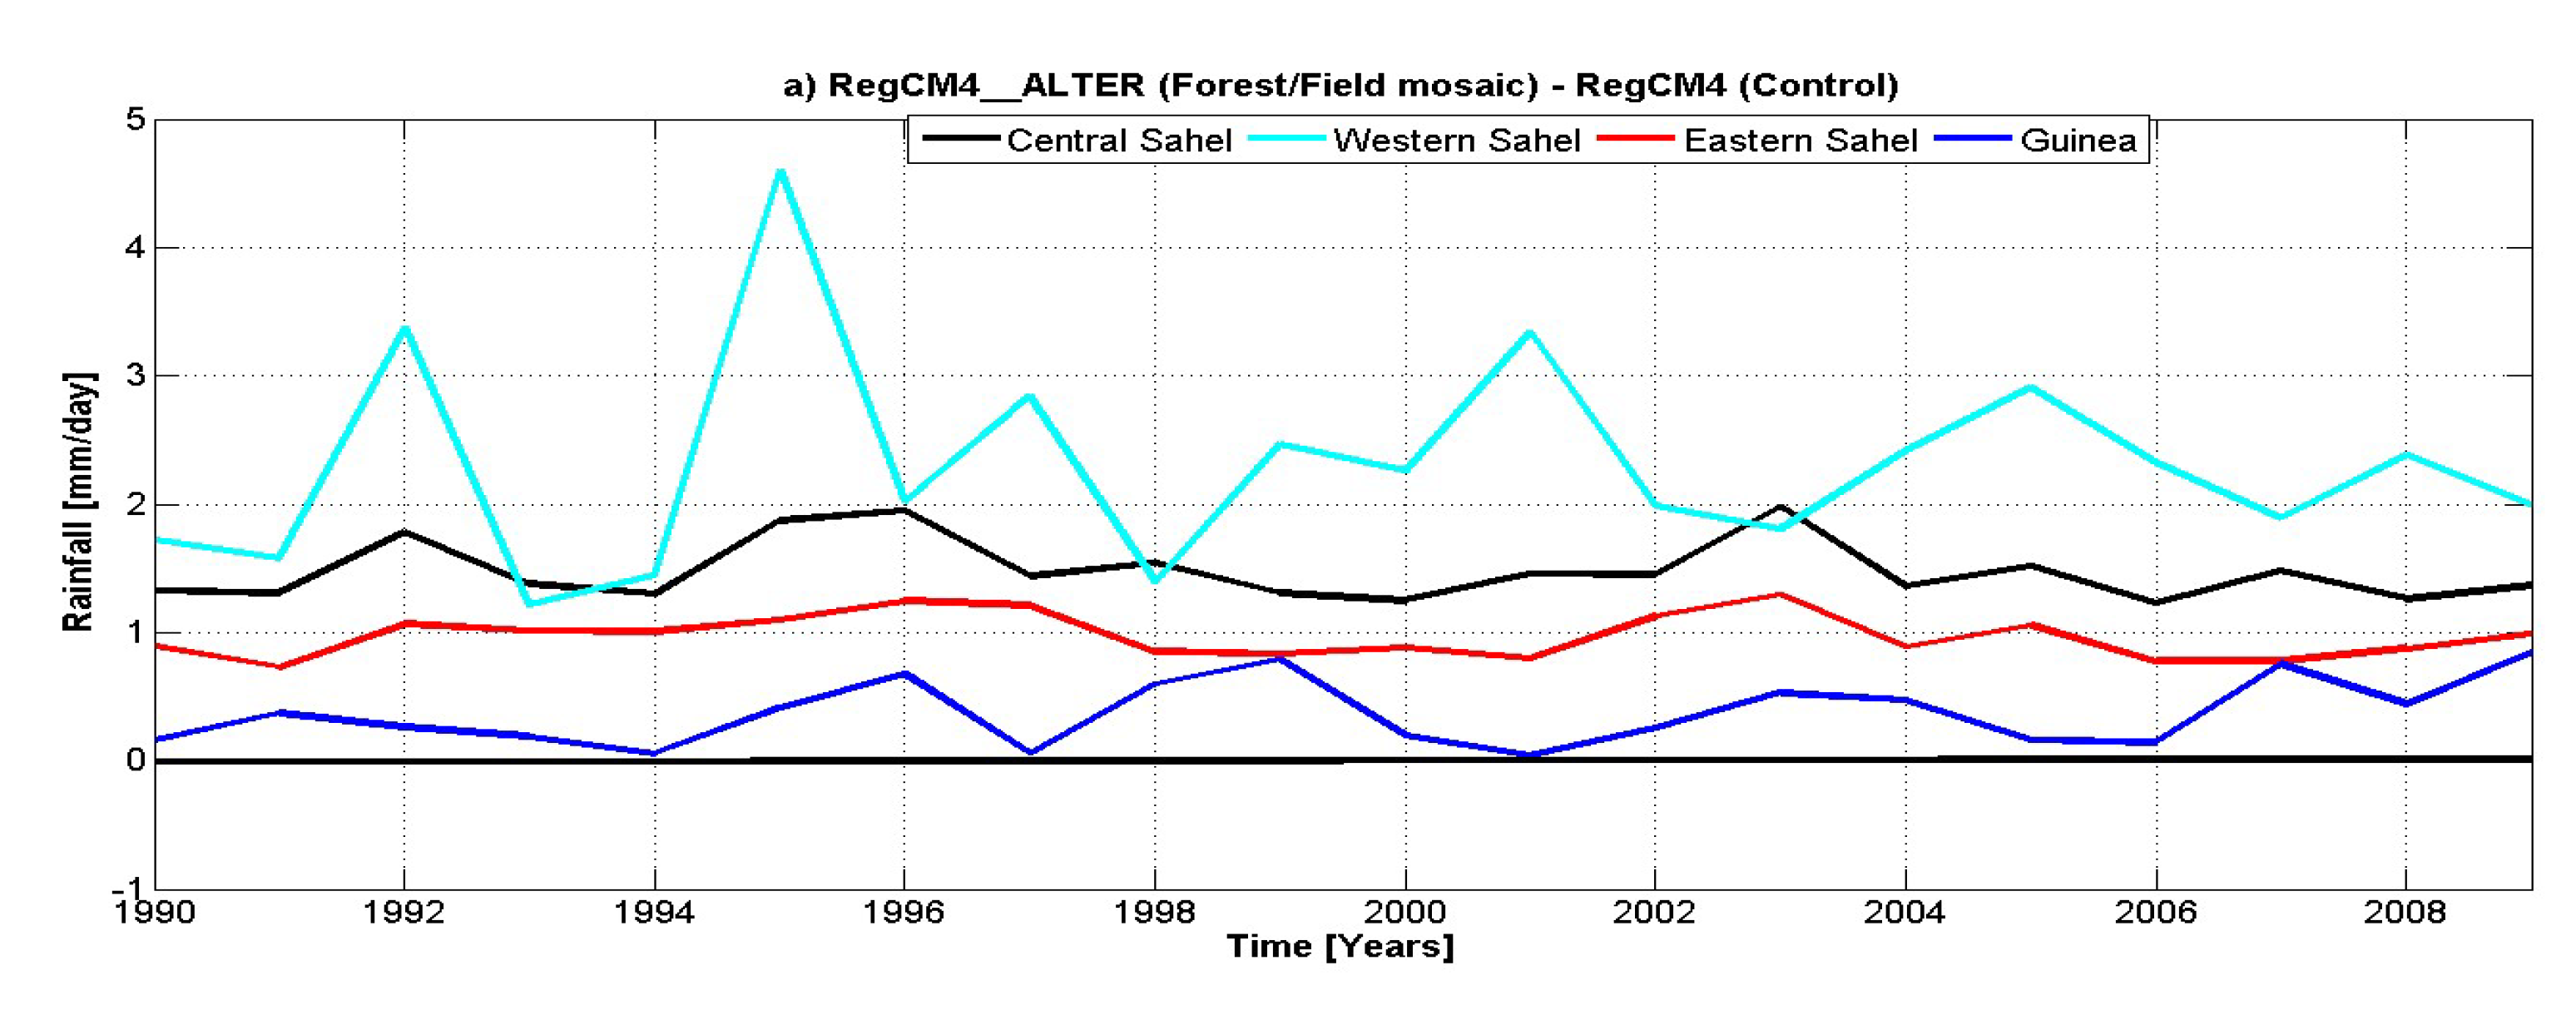
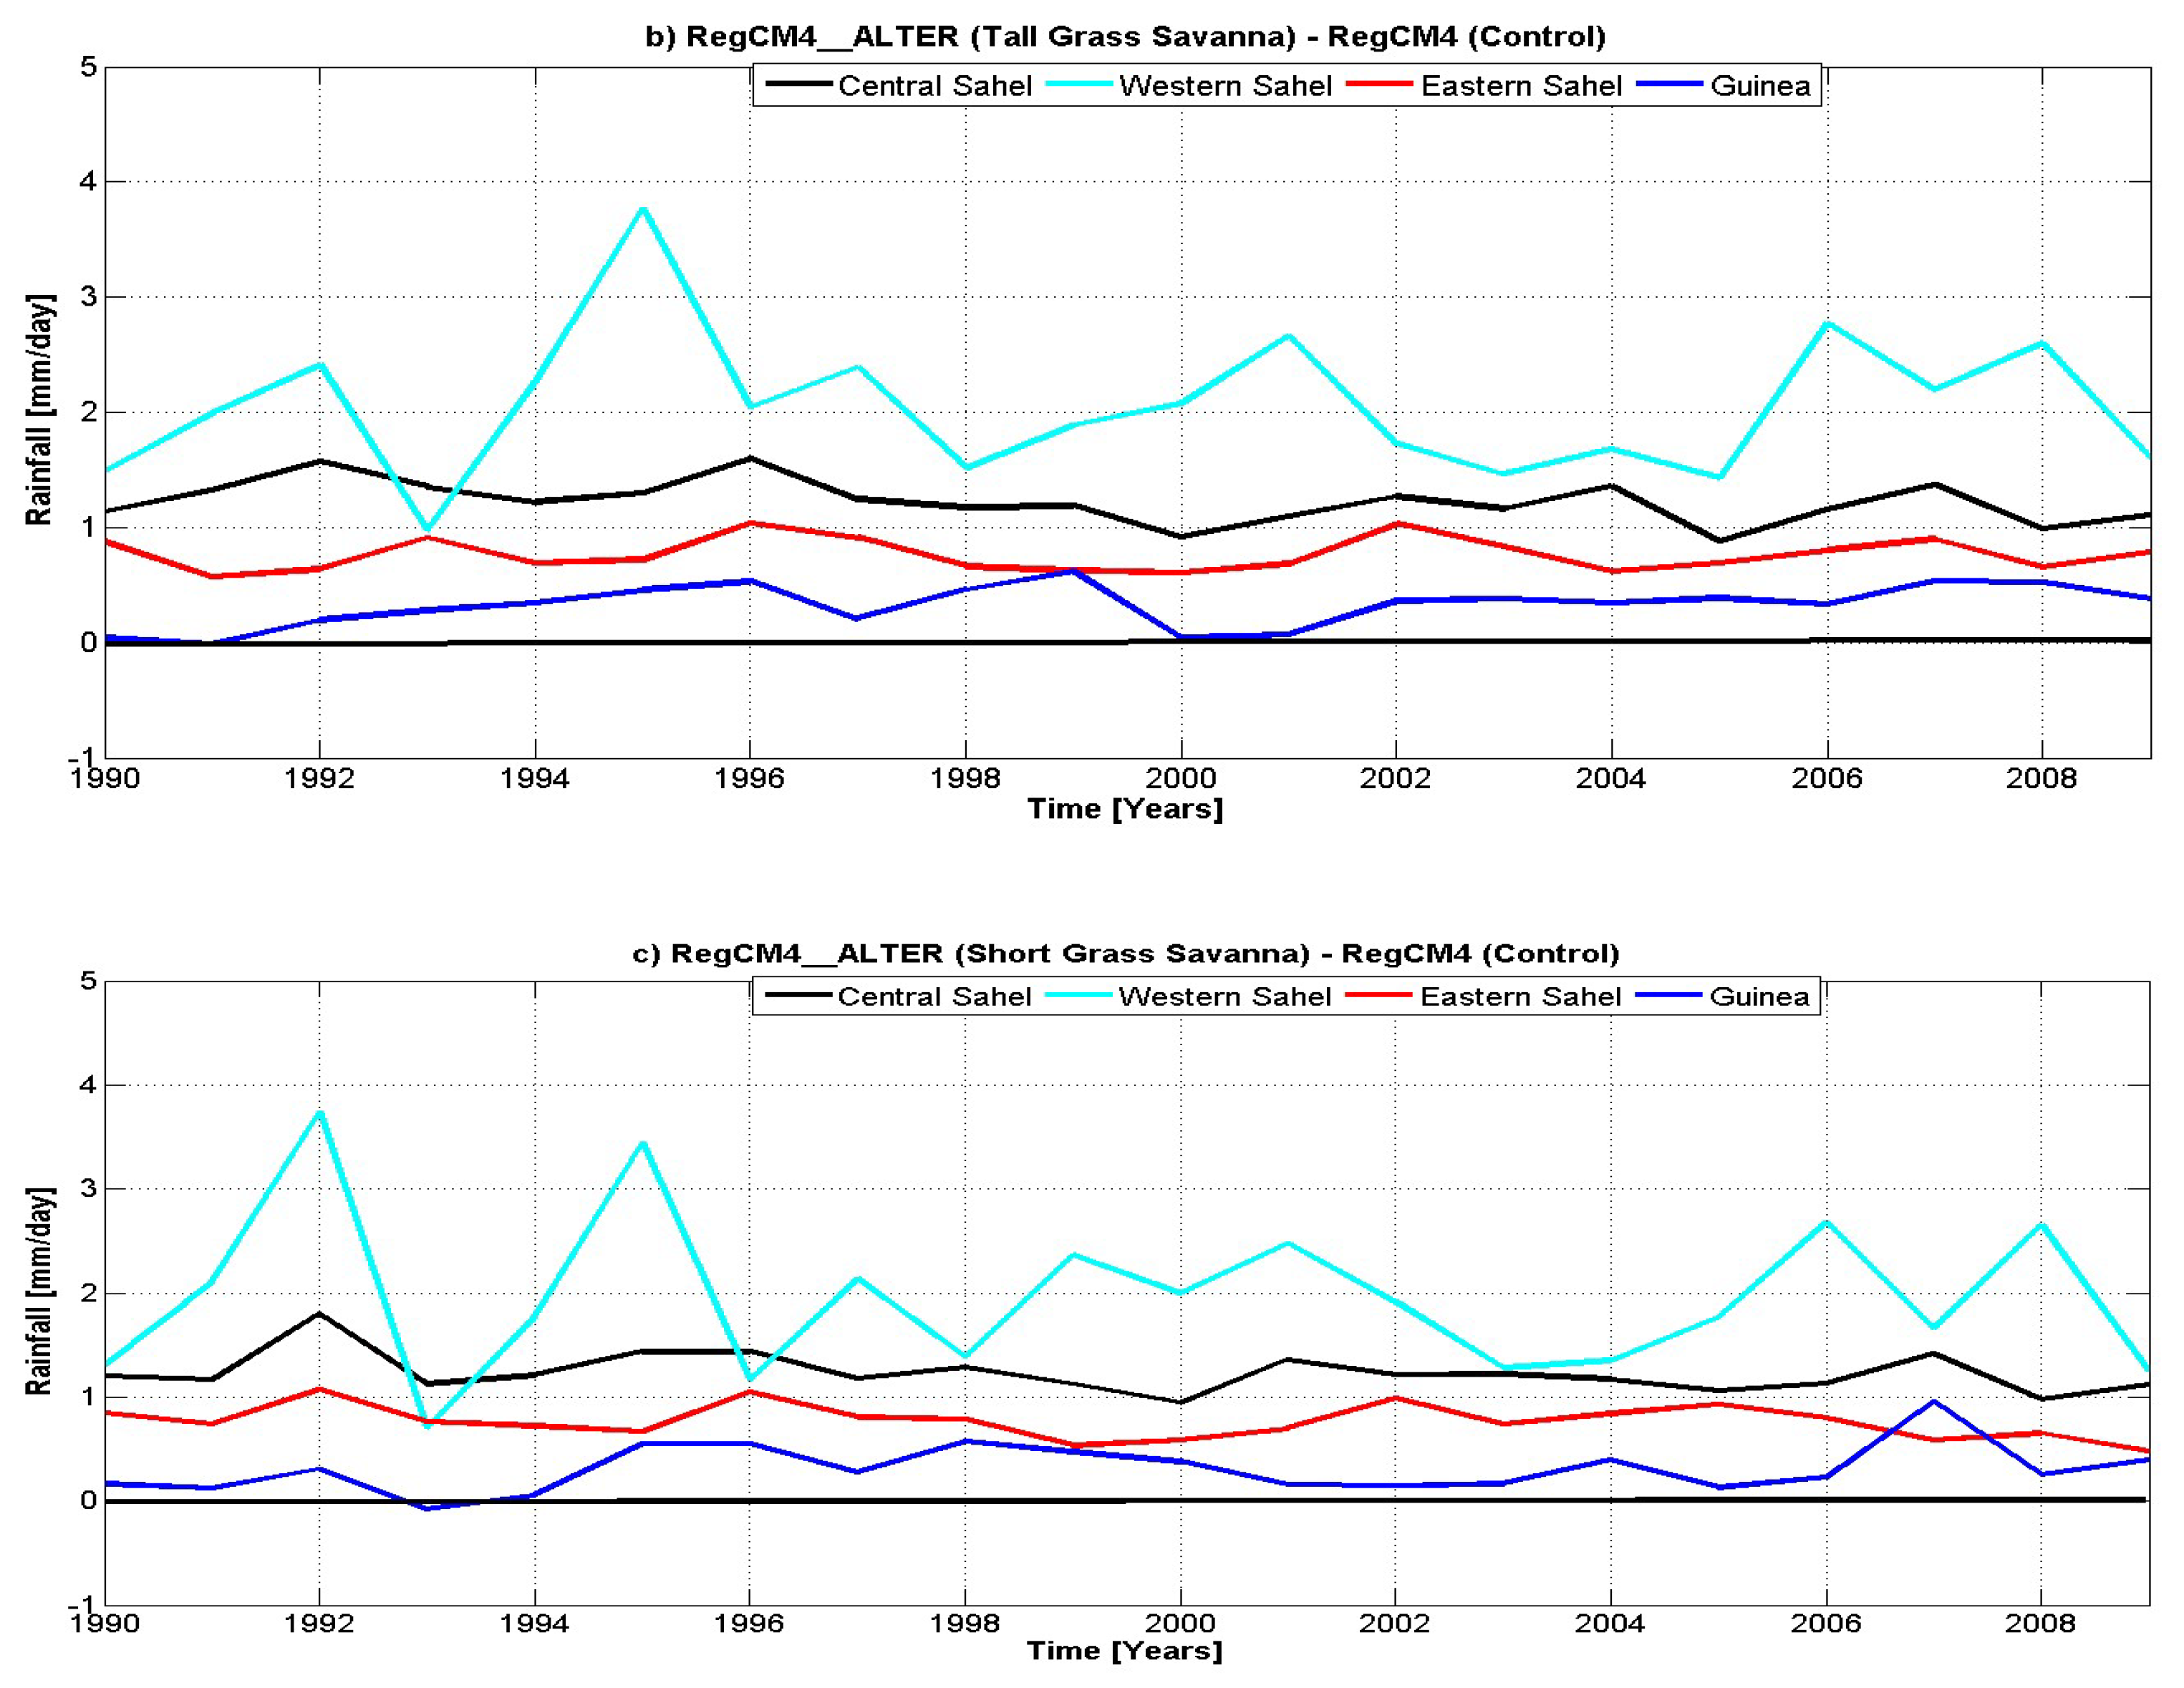
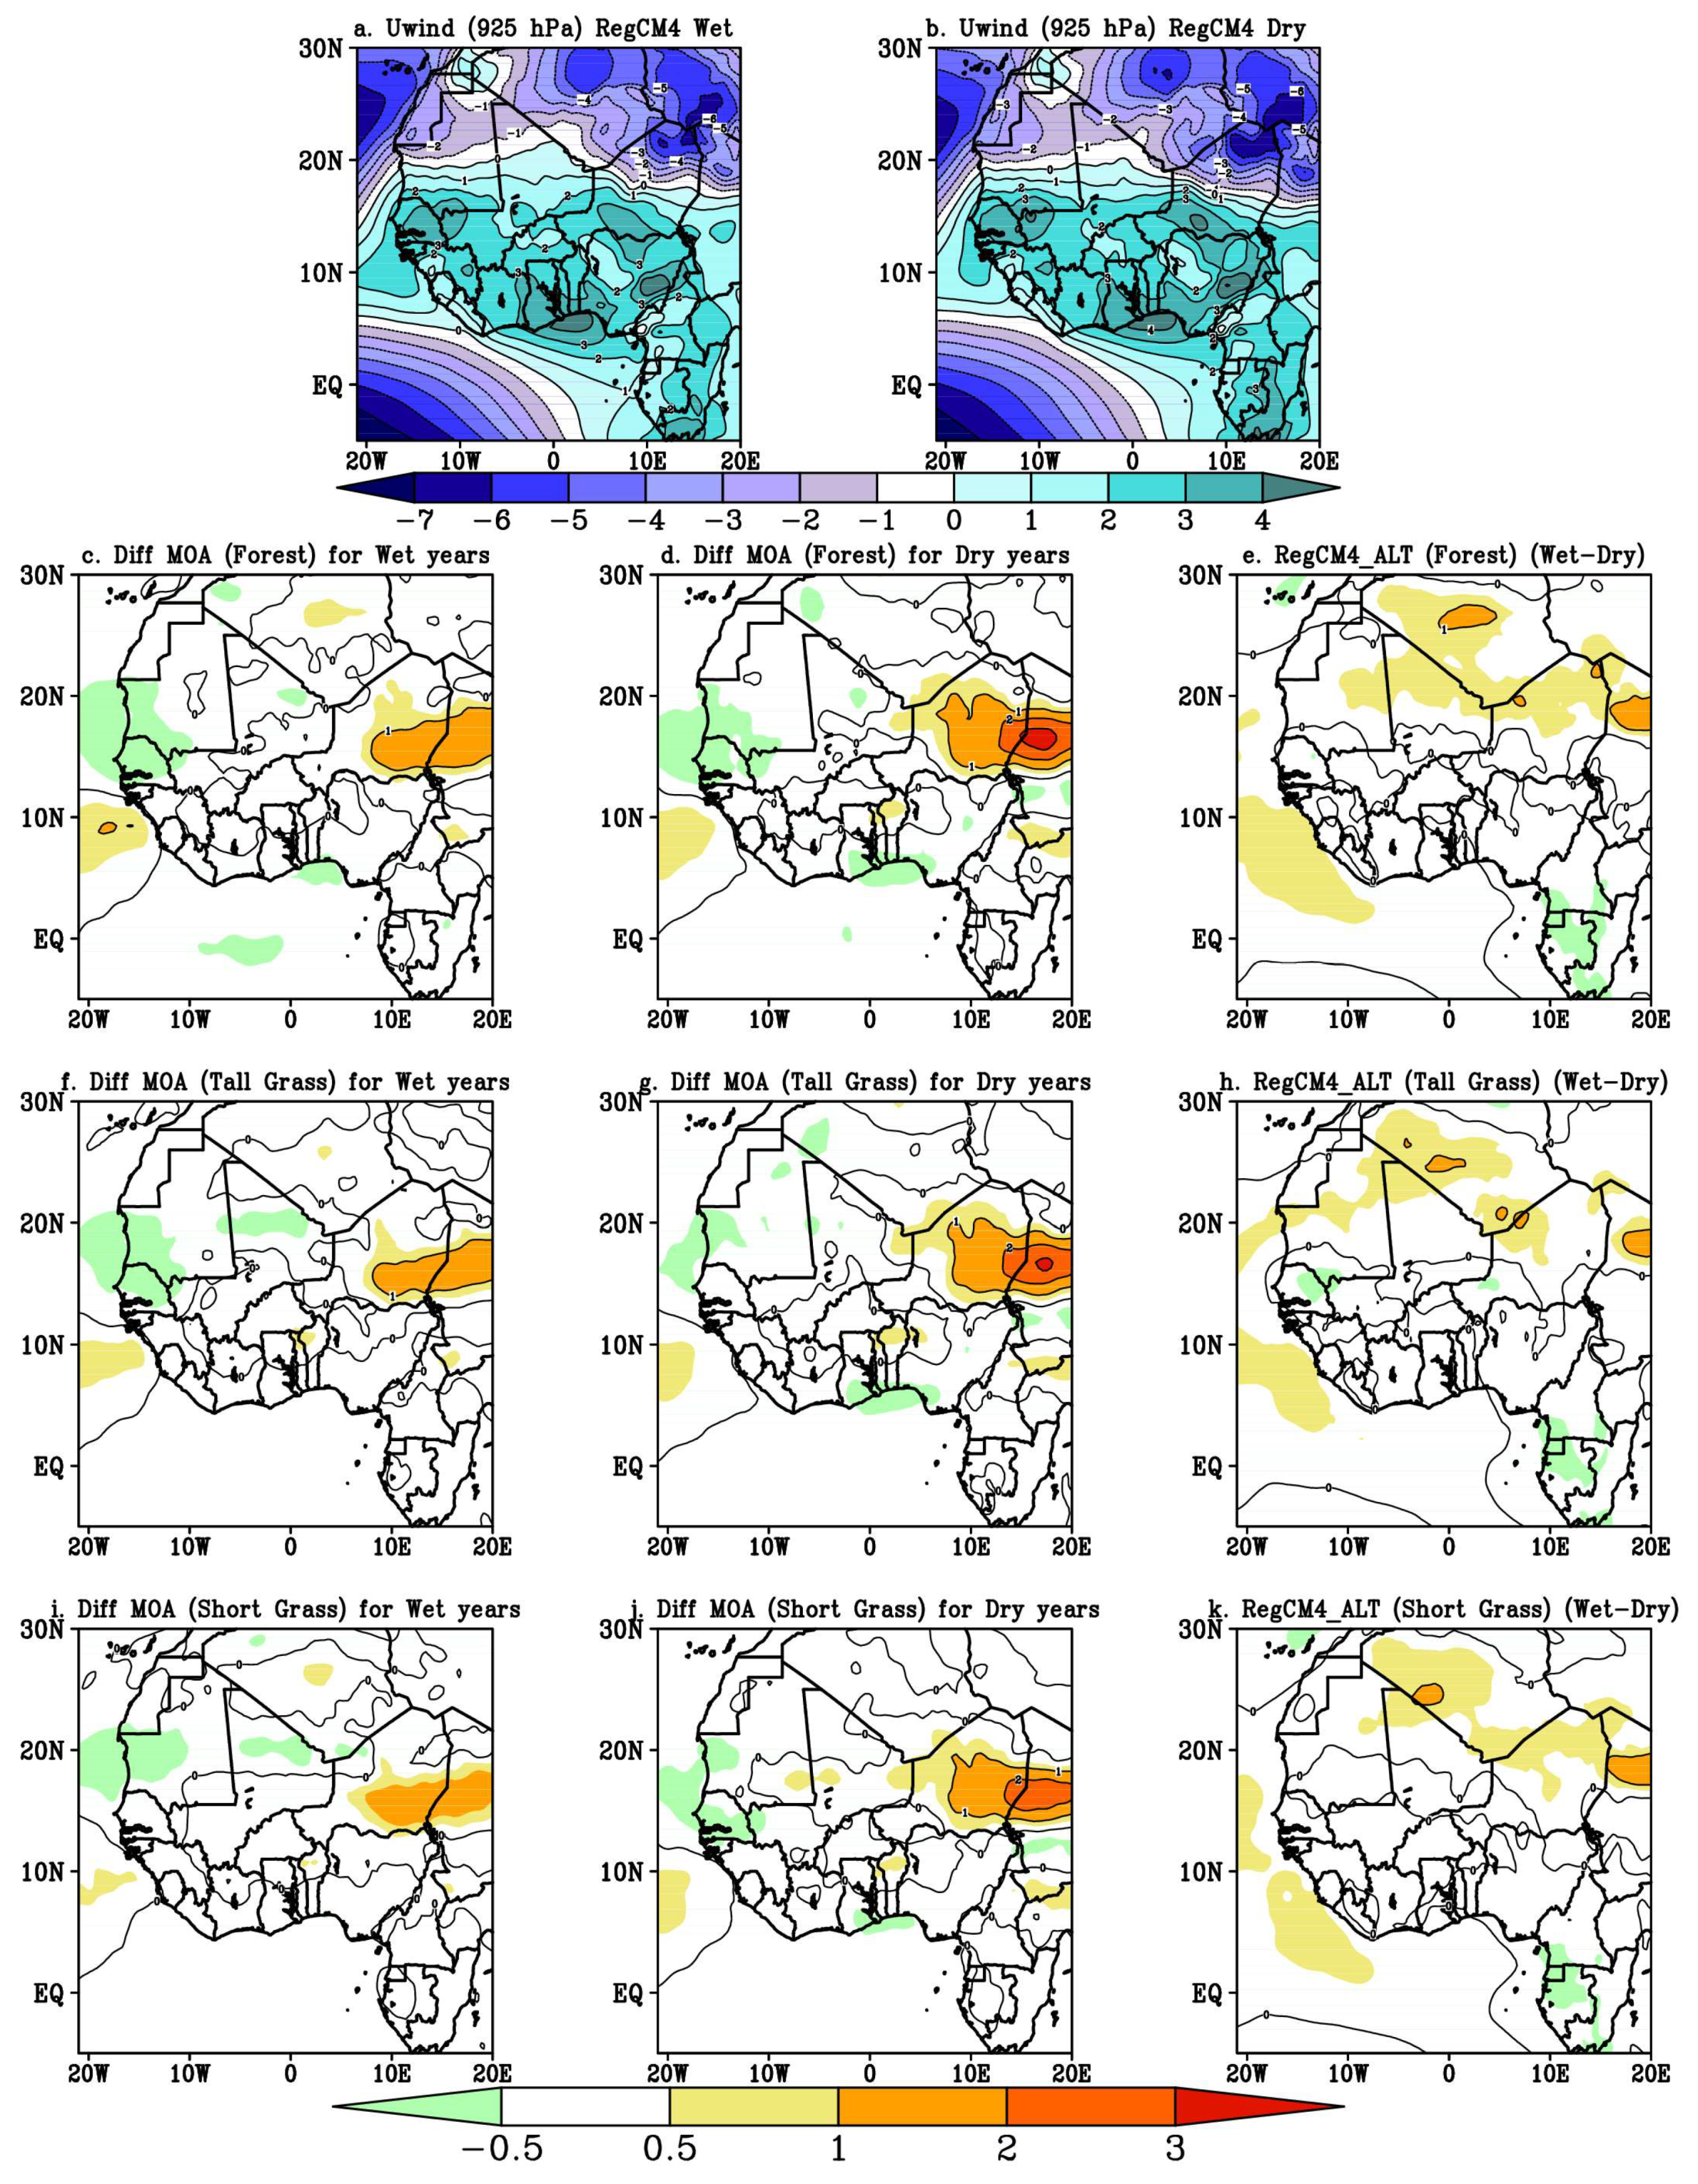
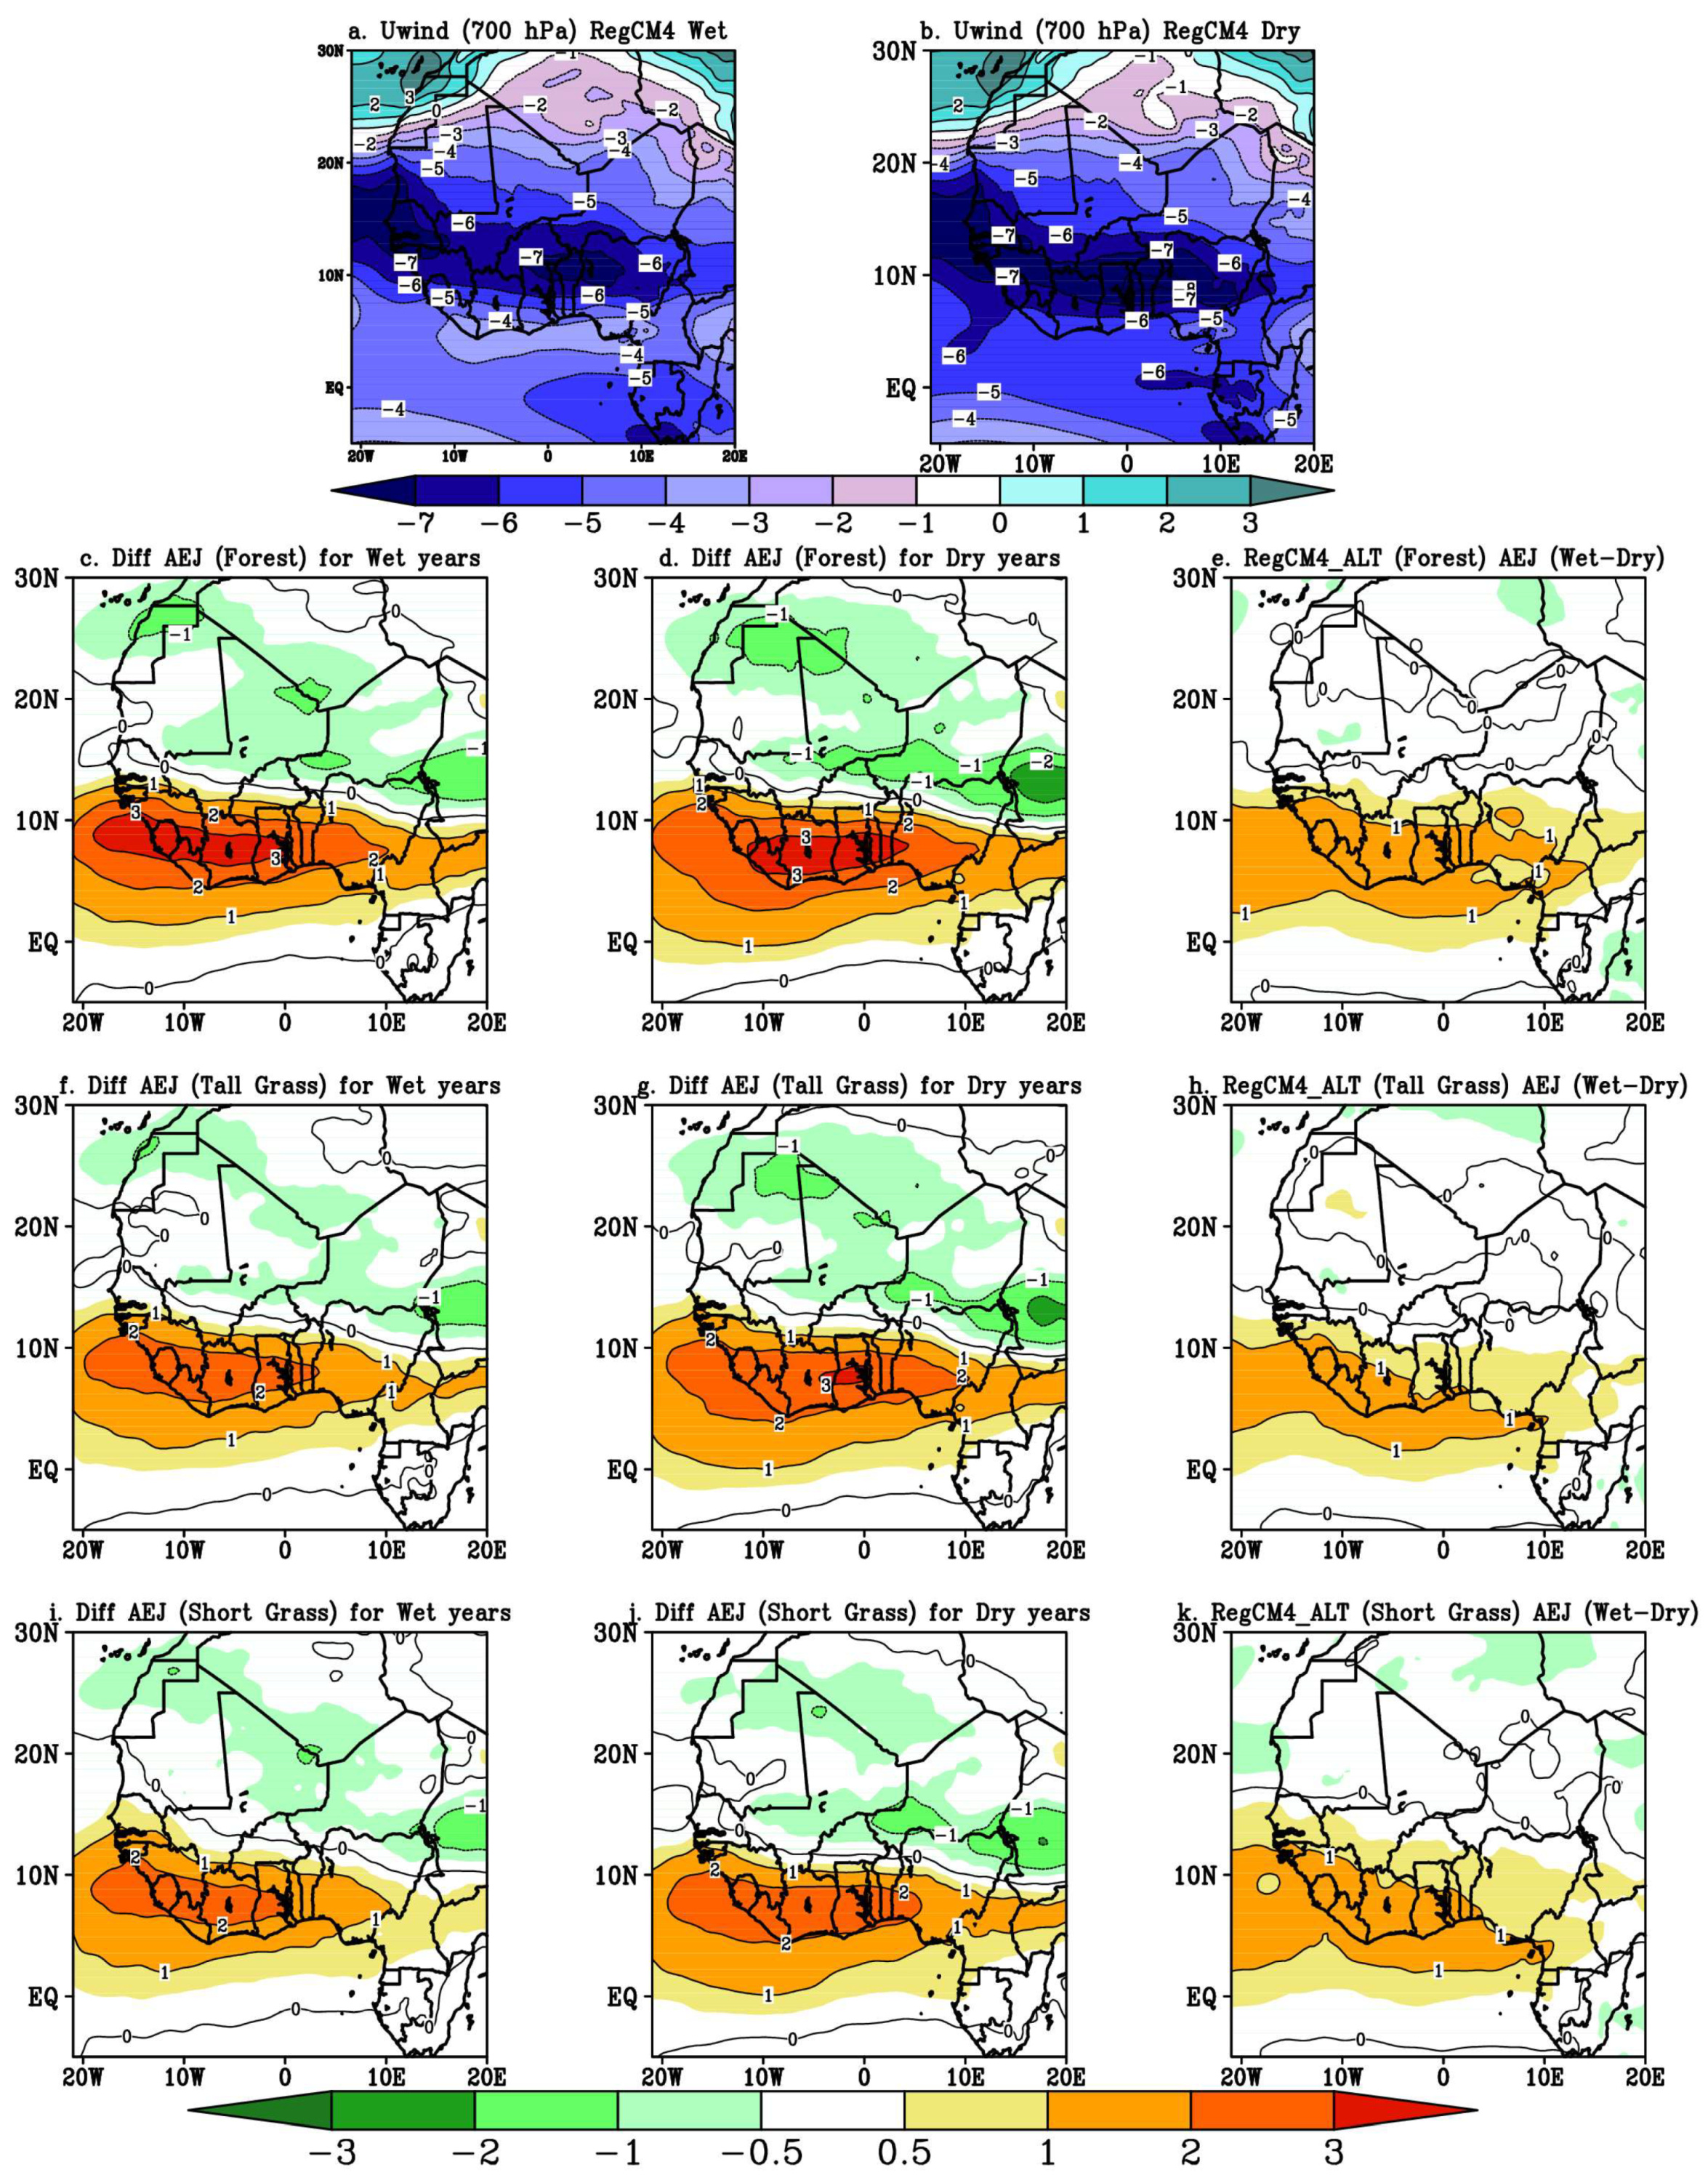
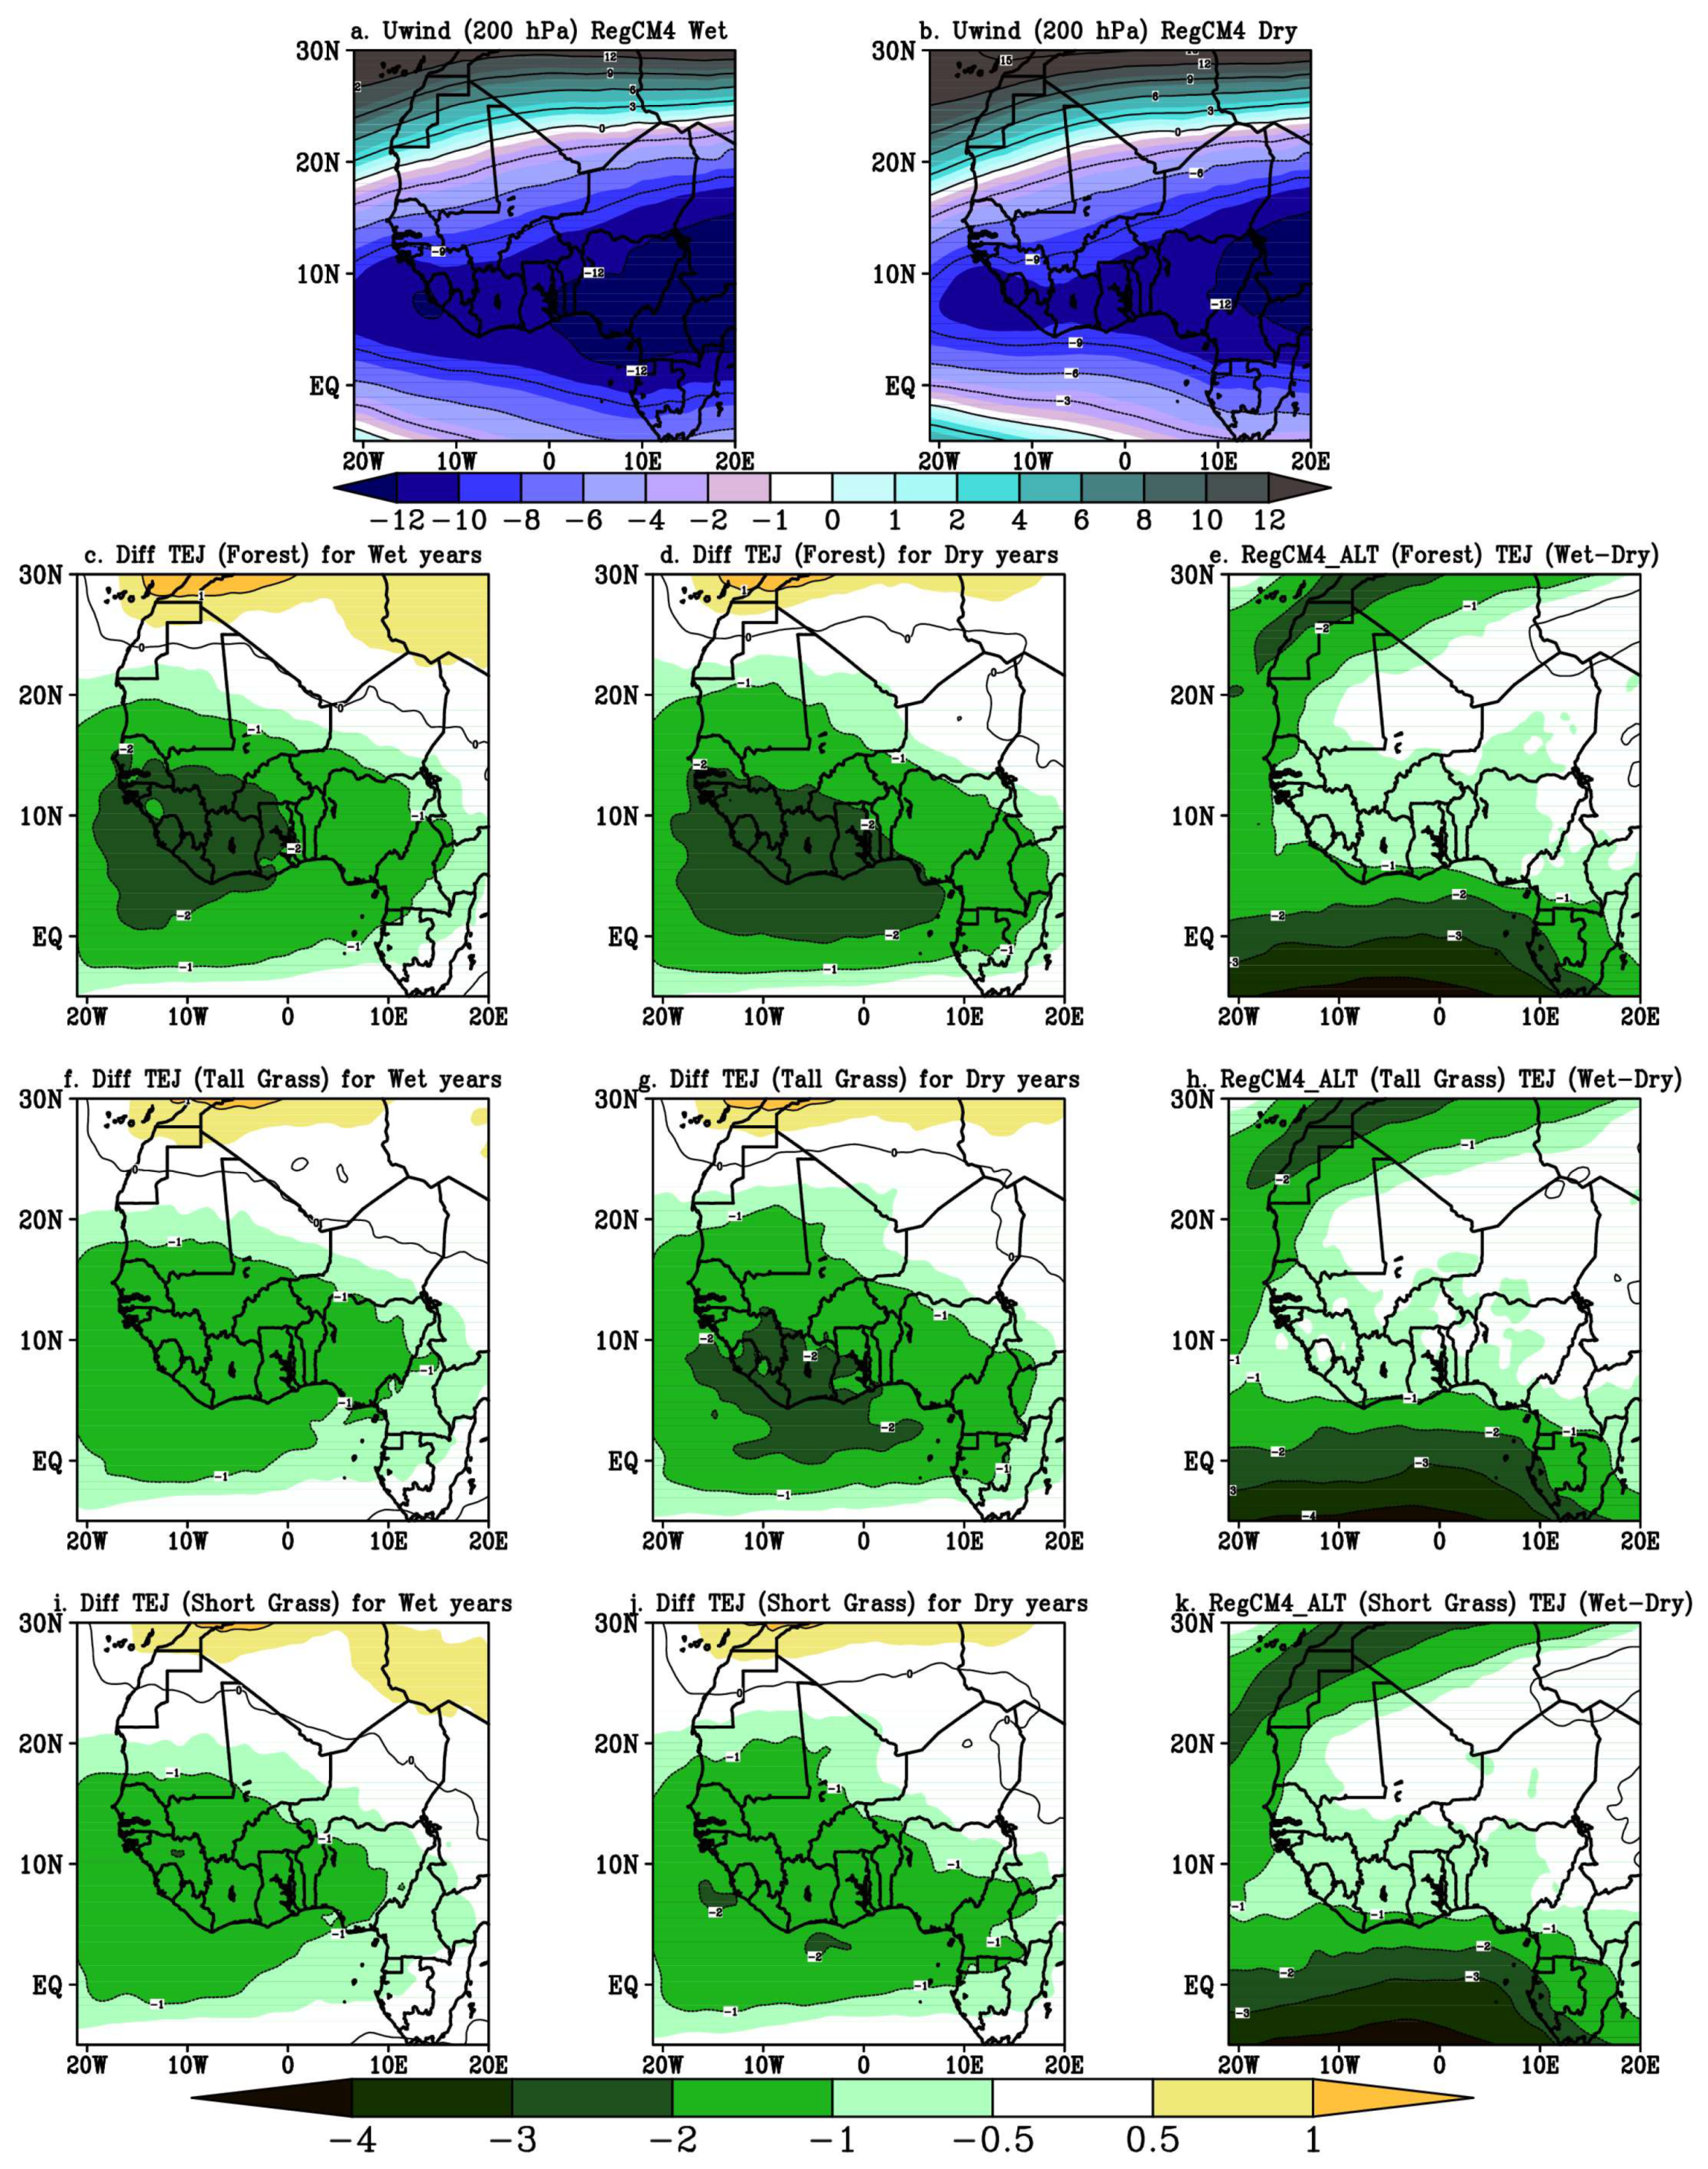
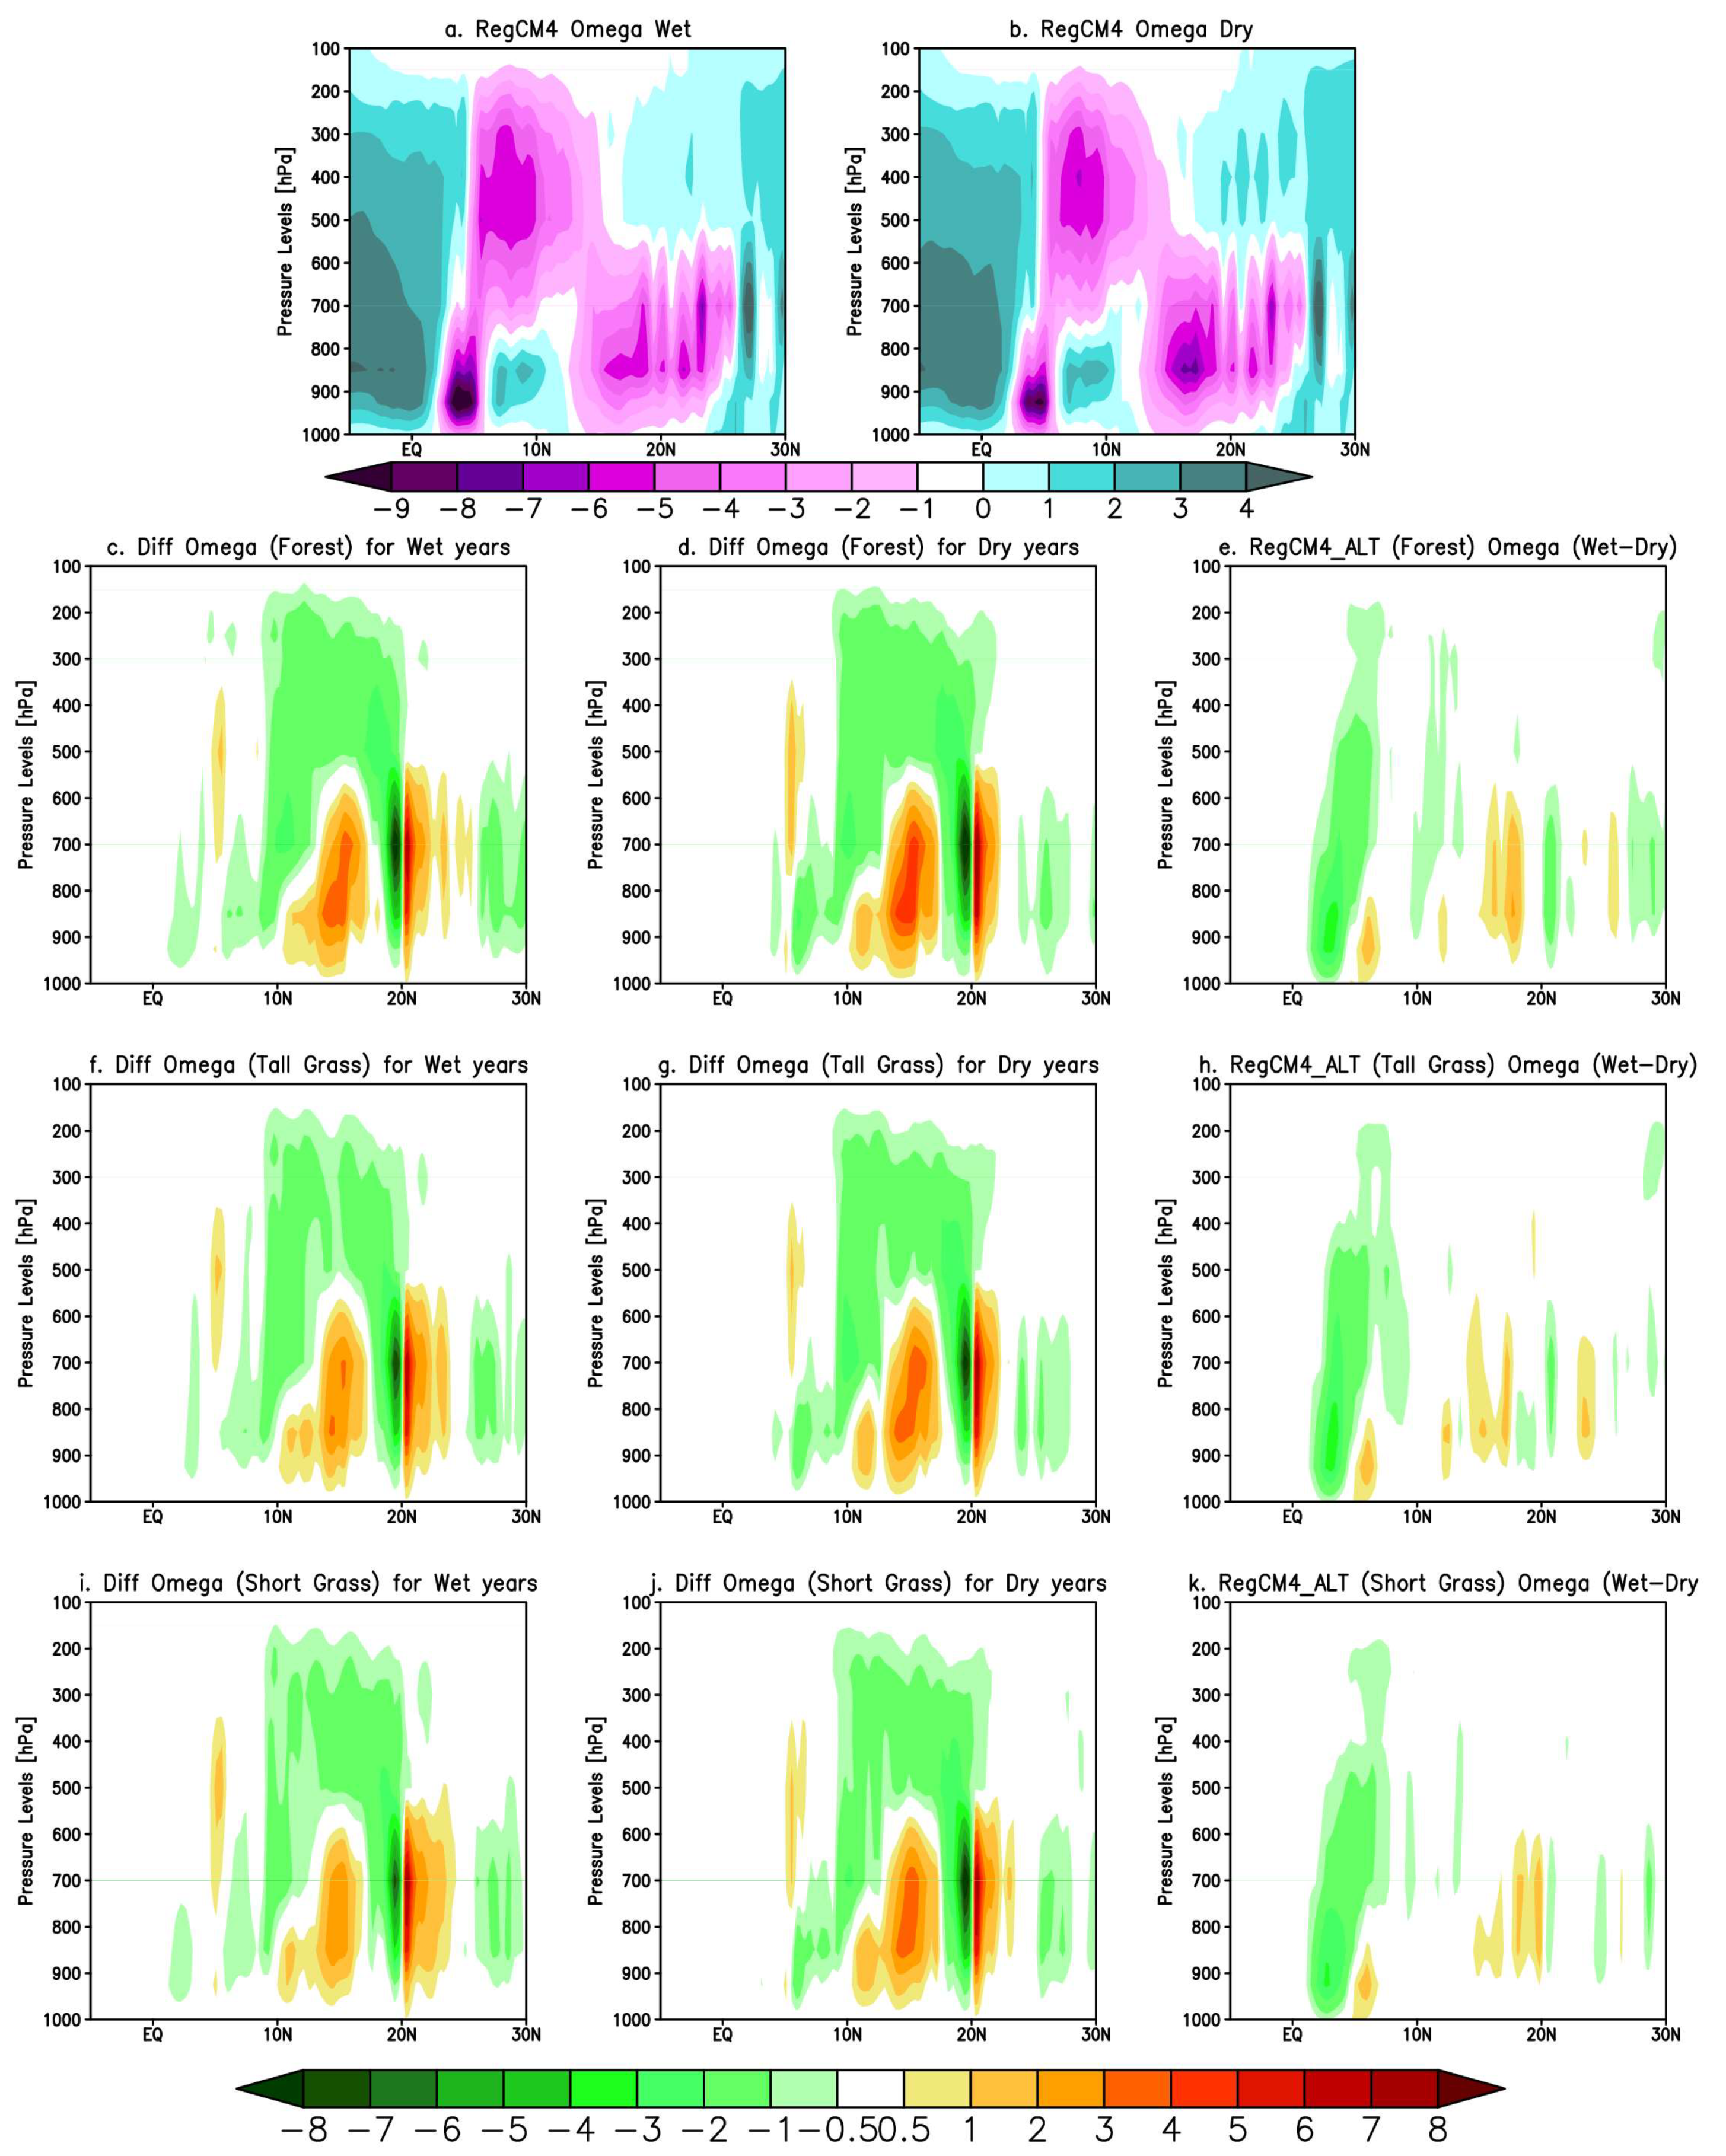
3.3. Impacts of Reforestation on Some Rainfall Features and on Wind Dynamics

Dry years are a threat to agriculture, food security, and water availability in West Africa, particularly in the Sahelian zone. This zone has witnessed persistently oppressive droughts that have led to a decrease in agricultural productivity since the 1960s. Other impacts of the dry years include migration, water conflicts, and degradation of biodiversity in the region. Here, we examined the impacts of the vegetation changeon some features of the rainfall events and on the wind dynamics over West Africa by considering changes between the means of four dry years (1990, 1993, 1996, and 2000) and four wet years (1994, 1999, 2003, and 2008) as diagnosed in Figure 5, based on anomalies over the three sub-domains of the Sahel band (central, western and eastern). We try to understand the behavior of these extreme years in a reforested condition of the Sahel–Sahara interface.
Figure 12 shows the frequency of the number of rainy days (number of days with a daily cumulative precipitation greater than 1 mm) averaged over the peak of the summer period (June–July–August–September) for wet yearsand dry years from the standard version of the RegCM4 model and the difference between the three altered versions and the standard one. During these two contrasting periods (wet years and dry years), the maximum of the number of rainy days was obtained from over the mountainous areas, near and off Fouta Jallon highlands, and over the ocean (Figure 12a,b). A north–south gradient, with the number of rainfall events decreasing over northern Sahel, was also noticed. The standard version of the model showed a spatial distribution of the number of rainy days that was similar for both periods, although the strongest number of rainy days was captured over the eastern part of the Sahel and the Cameroon highlands during the wet period (Figure 12a,b). An analysis of the difference between the altered and the standard versions (Figure 12c,d) showed that the three land cover distributions (reforestation, tall grass, and short grass) tend to increase the frequency of the number of rainy days roughly over a region that is located between the latitudes 8° N and 16° N for the two contrasting periods (Figure 12c,d,f,g,i,j). Nevertheless, this increase is stronger in the central and eastern Sahel regions during the wet period (Figure 12e) with the forest option than with the other two experiments (Figure 12h,k). The presence of tall grass leads to a strong wetter condition over the Western Sahel during the wet period (Figure 12f) compared to the short grass one (Figure 12i). However, these two experiments (tall and short grass) show a similar increase of the number of rainy days over the whole Sahel band during the dry period (Figure 12g,j).
The frequency of the intense rainfall events (R ≥ 10 mm/day) for wet years and dry years is displayed in Figure 13. Intense rainfall events play an important role in water resource availability, as well as in agriculture and pastoralism, which remain the pillars of the economy of West African countries. Strong values of the intense rainfall events are concentrated over the orographic regions and the ocean for both periods (Figure 13a,b). The spatial distribution shows a north–south gradient. This distribution is the same for the two periods (Figure 13a,b). The analysis of the difference between the three altered versions and the standard one (Figure 13c,d,f,g,i,j) showed an increase of the frequency of the intense rainfall events over the Sahel, over the orographic regions and the ocean for both periods. This distribution is similar to the pattern of the rainy days. The presence of forest strongly increases the intense rainfall events over the northern part of the Cameroon highlands, Benin and the western part of Nigeria during the wet period (Figure 13c) compared to the other two experiments.
The tall and short grass experiments show a similar increase of the frequency of the intense rainfall events over the whole Sahel region during both periods (Figure 13f,g,i,j). In addition, all afforestation options lead to a strong wet condition over the Guinea coast, especially during the wet period (Figure 13e,h,k). This analysis suggests that the afforestation may favor an increase in available water resources, which in turn may impact positively some key sectors (agriculture and pastoralism) of the economy of West African countries.
In order to go deeper in the diagnosis of the extreme rainfall events, the contribution of heavy rainfall events characterized by the 99th percentile (mm/day) of daily rainfall events is calculated and displayed in Figure 14. These very strong rainfall events are known to be favorable to flooding, and therefore they are a major concern for local populations and policymakers. The standard version of the RegCM4 model exhibits a zonal distribution of precipitation with maxima localized over the ocean and the orographic regions: Fouta Jallon Mountains and Cameroon highlands for the two periods (wet years and dry years) (Figure 14a,b). The difference between the three altered experiments and the control one shows generally an increase of the mean 99th percentile (extremely wet days) over the altered zone (between 15° N and 20° N) and the oceanic region for both periods. The forest option exhibits a similar spatial pattern to those of the tall and short grass savanna simulations (Figure 14). Reforestation increases strongly on the extremely wet days over the northern Sahel and the Guinea Coast during the wet period (Figure 14c,e), compared to the other two experiments. However, the southern part of Cameroon is characterized by a decrease of the 99th percentile. The tall grass experiment showed a strong increase of the frequency of the extremely wet days over the northern Sahel region during the wet period (Figure 14f) compared to the short grass one (Figure 14i). All afforestation options lead to strong extremely wet events over the northern Sahel and the Guinea coast, especially during the wet period (Figure 14e,h,k).
In summary, this percentile analysis suggests again that land cover change highly influences the contribution of very wet days during the two contrasting periods (wet years and dry years).
In summary, this analysis shows that the afforestation of the Sahel–Sahara interface may induce positive effects (increase in available water resources) and adverse impacts such as the increase of flooding. The appropriate measures needed to tackle the negative effects should be planned by the local populations and policymakers for a better management.
This part of the work treats the impacts of the land cover changeon wind dynamics during these two contrasting periods, in order to better understand changes in precipitation. The main features of wind dynamics over West Africa during the summer period are low-levels of monsoon flux, the mid-levels African Easterly Jet (AEJ) and the Tropical Easterly Jet (TEJ), located at the upper levels. Figure 15 shows the averaged JJAS zonal wind at 925 hPa over West Africa for wet years and dry years from the standard version of the RegCM4 model and the difference between the altered versions and the standard one (down).The monsoon flux extends northward over the continent up to 20° N with maxima located in the western Sahel, eastern Sahel, and the Gulf coast (Figure 15a,b).
This low-level wind analysis also showed a strengthening (weakening) of the monsoon flux in the eastern Sahel (western Sahel) region during the wet and dry years, for all afforestation options (Figure 15c,d,f,g,i,j). Any systematic difference was diagnosed over thecentral Sahel and the Guinea region when considering the difference between wet and dry years (Figure 15e,h,k). Nevertheless, the three vegetation change experiments also strengthened the monsoon flux slightly in northern Sahel and in the Atlantic Ocean during wet years (Figure 15e,h,k).
Figure 16 shows the averaged JJAS zonal wind at 700 hPa over West Africa for the wet years and dry years from the standard version of the RegCM4 model (Figure 16a,b), and the difference between thealtered versions and the standard one (down). The standard version of the RegCM4 model well simulates the position of the African Easterly Jet (AEJ) with two strong cores centered around 10° N over the continent, and around 15° N over the West African coast, consistent with the findings of [19,20,40]. The analysis of the difference between the altered versions and thecontrol one (down) shows positive values south of 13° N, suggesting that the three afforestation options tend to decrease the intensity of the AEJ for both periods,but especially during wet years (Figure 16c–k).Nevertheless, this decrease is stronger south of 12° Nin the forest case(Figure 16c–e).The presence of tall grass leads to a stronger decrease of the intensity of the AEJ at around 12° N, especially during dry years (Figure 16g), compared to short grass (Figure 16j). All vegetation change experiments simulated a decrease of the AEJ intensity south of the Sahel during the wet period (Figure 16e,h,k). The general decrease of the AEJ intensity is consistent with the temperature cooling, as suggested by [66,67]. These authors stated that the weakening of the AEJ (a thermally driven jet) can be explained by the decrease in temperature over the continent, and thus the contrast between the Gulf of Guinea and the continental surface.
The three afforestation options also increase the intensity of the AEJ slightly in northern Sahel for both periods (Figure 16c,d,f,g,i,j) suggesting that this mid-tropospheric jet extends more northward over the continent.
The weakening of the AEJ intensityduring both periods (especially in wet years)and itsnorthward position for all afforestation experiments,were consistent with the results of [18] who showed a decrease and a northward position of the AEJ during wet years over West Africa. This result is also in line with [66] who stated that a strong AEJ would be associated with weaker precipitation in the Sahel, and stronger precipitation north of the Guinean coast.
Figure 17 shows the averaged JJAS zonal wind at 200 hPa over West Africa for the wet years and dry years from the standard version of the RegCM4 model (Figure 17a,b), and the difference between thealtered versions and the standard version (down).The control version of the model well simulates the position of the Tropical Easterly Jet (TEJ),which is located to the south, near 6° N and the Subtropical Westerly Jet located to the north of 22° N during the considered wet years and dry years. The Tropical Easterly Jet (TEJ) remains stronger over the south (around 6° N) during these two contrasting periods (Figure 17a,b).
The analysis of the difference between the altered versions and the standard run showed that the threeafforestation options affected the TEJ during the two periods by increasing its intensity over the Sahel and the Gulf of Guinea (around 6° N) (Figure 17c,d,f,g,i,j). This increase was stronger south of 10° N over the Gulf of Guinea with the forest experiment (Figure 17c–e). Additionally, a strengthening of the TEJ intensity was diagnosed for all vegetation experiments during the wet period (Figure 17e,h,k), in consistence with previous studies [68] who showed a reinforcement of the TEJ during wet years. This result was also consistent with [18,69] studies who found that significant differences exist between wet and dry years in the atmospheric circulation over the Sahel: in wet (dry) years, the TEJ tends to be stronger (weaker).
Finally, this analysis suggests that the rainfall increase induced by the reforestation is driven by a favorable configuration of the thermodynamic and dynamic conditions.
Figure 18 shows a vertical cross-section of the JJAS vertical velocity for wet years and dry years, averaged over the Sahel (between 10° W–10° E). The first updraft region was observed from the low to upper levels over the Guinea region (around 5° N) and the second area was located over the reforested zone in the lower and the middle layers (between 925 hPa and 600 hPa) for both periods (Figure 18a,b). The first updraft corresponded to the InterTropical Convergence Zone (ITCZ), while the second referred to the heat low [70]. The analysis of the difference between the altered and the control runs showed that the presence of forest, tall and short grass at the Sahel-Sahara interfacetends to increase the convection over the Guinean region and the northern part of the afforestation zone (17° N–20° N) for both periods, with an intensity slightly stronger in the forest option (Figure 18c–e). The increase of the convection over the northern part of the reforested zone is consistent with the strengthening of the moisture due to the evapotranspiration in the same area.
The last part of this work was about the impact of the land cover change on the patterns of 3–5 days African Easterly Waves (AEWs) (Figure 19). The AEWs are key drivers of West African climate variability during the boreal summer [71,72]. They are defined as disturbances around the zonal circulation of the mid-tropospheric AEJ, and they have been identified as the main factor modulating convection and daily rainfall in this region [72]. These disturbances propagate along two tracks over the continent (North and South of the AEJ), which merge over the Atlantic Ocean in a single track [72,73].
Grist et al. [71] showed that wet (dry) years over West Africa are characterized by an increase (decrease) of the intensity of AEWs.
The standard version of the RegCM4 model shows a strong AEW activity north of the ITCZ (around 15° N) over the Sahel region, and a weaker signal around the Gulf of Guinea during wet and dry years (Figure 19a,b). The difference between the altered versions and the standard one shows significant changes in the AEW activity over the study region for both periods. All afforestation options tended to decrease (increase) the 3- to 5-day wave activity respectively over the Sahel region (over the Guinea region south of 9° N and over the Atlantic Ocean) (Figure 19c,d,f,g,i,j). Nevertheless, this decrease is stronger with the forest experiment (Figure 19c–e).The tall and short grass savanna options tends to decrease more the 3- to 5-day wave activity over the central and eastern Sahel during dry years compared to wet years (Figure 19f,g,i,j).The decrease of AEW intensity over the Sahel may be the result of the weakening of the temperature contrast between the Sahara desert and the Gulf coast due to the surface temperature cooling induced by the afforestation [74].
This decrease of the intensity of AEWs suggested that the activities of these disturbances do not explain the Sahel rainfall increase in the land cover change experiments. Moreover, the increase of the intensity of AEWs over the Guinea region may induce a strengthening of the convection in the same area, as diagnosed in Figure 18.
Finally, this analysis showed that the dynamic may induce different climate responses when land cover change experiments are performed. At the first order, the vegetation cover change experiments tended to increase the evapotranspiration and then the water vapor content of the atmosphere. However, the dynamics of the climate and climate feedbacks may have complicate the primary response of the vegetation. This study suggests that during both periods, the increase of water vapor content is associated with favorable AEJ/TEJ configurations (weaker and northward position AEJ; stronger TEJ) that may create a stronger convection. These dynamic and thermodynamic favorable conditions may increase rainfall.

4. Conclusions and Discussions

This work aims at assessing the potential impacts of land cover changes on the interannual variability of rainfall and surface temperature, and to investigate changes on some precipitation features and on the atmospheric dynamic over West Africa. The simulations done with the standard version of the RegCM4 model and the altered ones are inter-compared. Results show that all afforestation options tend to decrease significantly the surface temperature during the summer season over the whole Sahel band. Nevertheless, this decrease is more pronounced over the Central Sahel with the forest option than with the other two experiments. Decreased temperature induced by reforestation may be caused by the weakening of the sensible heat flux and the enhanced latent heat flux over the whole Sahel region.
Moreover, changes in the net upward longwave radiation at the surface are consistent with the decrease of the sensible heat flux and the surface temperature. The increase of the net shortwave downward flux is also in coherence with the reinforcement of the latent heat flux. The surface energy balance analysis shows that the latent heat flux is the main component of the net radiation at the surface.
All afforestation options also tend to increase rainfall consistently with the strengthening of the evapotranspiration and the atmospheric moisture content. This analysis also shows that the Sahel region (especially central Sahel) is more impacted by the presence of forest, tall grass, and short grass savanna than is the Guinea area.
The cooling of surface temperature induced by all afforestation options may slow down the rise of temperature due to global warming, and decrease heat waves episodes over the Sahel region. The decrease in surface temperature and heat waves episodes may translate into positive effects on the local population’s health. The rainfall increase combined with surface temperature cooling may also be beneficial for the Sahelian countries agriculture.
The analysis of rainfall events and extremes shows that the afforestation tends to increase them. This may translate into beneficial effects on the agriculture and the pastoralism which are the pillars of the economy of Sahel countries. However some adverse effects linked to this afforestation such as flooding, may increase.
The last part of this study was devoted to the impact of the land cover changing on rainfall events and the atmospheric circulation. The incorporated forest, tall grass, and short grass savanna at the Sahel-Sahara interface tends to increase the frequency of the number of rainy days roughly over a region located between the latitudes 8° N and 16° N during wet and dry years. Nevertheless, this increase is stronger over the Central and Eastern Sahel during the wet period with the forest option than with that of tall and short grass savanna.
The analysis of wind conditions changes shows strengthening (weakening) of the monsoon flux in the eastern Sahel (western Sahel) during the wet and dry years. All afforestation options tend to decrease the intensity of the AEJ south of 13° N, and to increase the convection over the northern part of the afforestation zone (17° N–20° N) for both periods. Additionnaly, the AEJ decrease is stronger south of 12° N in the forest case. Additionally, the AEJ moves northward over the continent during both periods. The three afforestation options also affect the TEJ during both periods by increasing its intensity over the Sahel and the Gulf of Guinea (around 6° N) and especially during wet years. Nevertheless, this increase is stronger south of 10° N over the Gulf of Guinea with the forest experiment. The weakening (strengthening) of the AEJ (TEJ) is consistent with the increase in rainfall induced by the vegetation change experiments.
The analysis of the African easterly wave activity shows that all afforestation options tend to decrease (increase) the 3- to 5-day wave activity respectively over the Sahel region (over the Gulf of Guinea south of 9° N and over the Atlantic Ocean). However, this decrease is stronger in the forest case. Overall, the presence of tall and short grass savanna tends to decrease the 3- to 5-day wave activity over the Sahel during the dry years. This AEW activity decrease during both periods over the Sahel region is consistent with the induced surface temperature cooling, which may weaken the temperature contrast between the Sahara Desert and the Gulf coast and then the activity of AEWs. The increase of the intensity of AEWs in the Guinea region may strengthen the convection over that region.
This wind analysis suggests that the vegetation change may induce favorable large scale configuration for the occurrence of deep convection, as well as in wet than in dry periods but especially in the wet years.
This study shows that the vegetation change strengthens the West African summer rainfall, whatever the considered vegetation cover and period, suggesting that the ongoing greening effort such as the Great Green Wall project in the Sahel–Sahara interface may be a good option in creating favorable environmental conditions for the increase of the summer Sahel rainfall. An increase of rainfall will be beneficial for the economy of Sahel countries, which depends largely on summer rain-fed agriculture.
These modeling results also indicate that the cooling and wetting effects induced by the Sahel–Sahara interface reforestation may alter the rise of the temperature due to global warming effects over the Sahel region. This work can be considered as a support for the West Africa policymakers for better planning of the management of adverse potential effects (such as floods, drought, etc.) of greening efforts, such as the Great Green Wall.
Finally, these results suggest that the vegetation cover change may play an important role on the West African climate during the future in this climate change context.

Supplementary Materials

The following are available online at www.mdpi.com/xxx/s1, Figure S1: Interannual variability of JJAS latent heat flux for: (a) RegCM4 (control), (b) RegCM4_ALTER (Forest/Field mosaic)—RegCM4 (control), (c) RegCM4_ALTER (Tall grass savanna)—RegCM4 (control), and (d) RegCM4_ALTER (Short grass savanna)—RegCM4 (control) over the Central Sahel, Western Sahel, Eastern Sahel and the Guinea, Figure S2: Net radiation flux at the surface (W/m2) for: (a) RegCM4 (control), (b) RegCM4_ALTER (Forest/Field mosaic)—RegCM4 (control), (c) RegCM4_ALTER (Tall grass savanna)—RegCM4 (control), and (d) RegCM4_ALTER (Short grass savanna)—RegCM4 (control) over the Central Sahel, Western Sahel, Eastern Sahel and the Guinea.

Author Contributions

I.D. and M.C. performed the design of experiments and processed the data. All authors discussed the results and contributed to the manuscript.

Funding

This research is partly funded by the NERC/DFID Future Climate for Africa programme under the AMMA-2050 project; grant number NE/M019969/1 and the APC was funded by the ANR project ACASIS (2014–2017, grant: ANR-13-SENV-0007).

Acknowledgments

The authors would like to thank the Assane SECK University of Ziguinchor, the SCAC of the French Embassy in Senegal, and the “Fonds d’Impulsion de la Recherche Scientifique (FIRST) du MESRI/Senegal” for their support.

Conflicts of Interest

The authors declare no conflict of interest.

References

  1. Nicholson, S.E.; Some, B.; Kone, B. An analysis of recent rainfall conditions in West Africa, including the rainy seasons of the 1997 E1Nino and the 1998 La Nina years. J. Clim. 2000, 13, 2628–2640. [Google Scholar] [CrossRef]
  2. Le Barbé, L.; Lebel, T.; Dominique, T. Rainfall variability in West Africa during the years 1950–90. J. Clim. 2002, 15, 187–202. [Google Scholar] [CrossRef]
  3. Charney, J.G. Dynamics of deserts and drought in the Sahel. Q. J. R. Meteorol. Soc. 1975, 101, 193–202. [Google Scholar] [CrossRef]
  4. Lamb, P.J. Persistence of sub-Saharan drought. Nature 1982, 299, 46–48. [Google Scholar] [CrossRef]
  5. Diallo, I.; Sylla, M.B.; Camara, M.; Gaye, A.T. Interannual variability of rainfall over the Sahel based on multiple regional climate models simulations. Theor. Appl. Clim. 2013, 113, 351–362. [Google Scholar] [CrossRef]
  6. Camara, M.; Diedhiou, A.; Sow, B.A.; Diallo, M.D.; Diatta, S.; Mbaye, I.; Diallo, I. Analyse de la pluie simulée par les modèles climatiques régionaux de CORDEX en Afrique de l’Ouest. Sécheresse 2013, 24, 14–28. [Google Scholar]
  7. Gbobaniyi, E.; Sarr, A.; Sylla, M.B.; DIallo, I.; Lennard, C.; Dosio, A.; Diedhiou, A.; Kamga, A.; Klutse, N.A.B.; Hewitson, B.; et al. Climatology, annual cycle and interannual variability of precipitation and temperature in CORDEX simulations over West Africa. Int. J. Clim. 2014, 34, 2241–2257. [Google Scholar] [CrossRef]
  8. L’Hôte, Y.; Mahé, G.; Somé, B.; Triboulet, J.P. Analysis of a Sahelian annual rainfall index from 1896 to 2000; the drought continues. Hydrol. Sci. J. 2002, 47, 563–572. [Google Scholar] [CrossRef] [Green Version]
  9. Dai, A.; Lamb, P.J.; Trenberth, K.E.; Hulme, M.; Jones, P.D.; Xie, P. The recent Sahel Drought is Real. Int. J. Clim. 2004, 24, 1323–1331. [Google Scholar] [CrossRef]
  10. Biasutti, M.; Giannini, A. Robust Sahel drying in response to late 20th century forcings. Geophys. Res. Lett. 2006, 33, L11706. [Google Scholar] [CrossRef]
  11. Fontaine, B.; Trasaska, S.; Janicot, S. Evolution of the relationship between near global and Atlantic SST mode and the rainy season in West Africa: Statistical analyses and sensitivity experiments. Clim. Dyn. 1998, 14, 353–368. [Google Scholar] [CrossRef]
  12. Giannini, A.; Saravanan, R.; Chang, P. Oceanic forcing of Sahel rainfall on interannual to interdecadal timescales. Science 2003, 302, 102730. [Google Scholar] [CrossRef] [PubMed]
  13. Hoerling, M.; Hurrell, J.; Eischeid, J.; Phillips, A. Detection and attribution of twentieth–century northern and southern African rainfall change. J. Clim. 2006, 19, 3989–4008. [Google Scholar] [CrossRef]
  14. Nicholson, S.E.; Webster, P.J. A physical basis for the interannual variability of rainfall in the Sahel. QJR Meteorol. Soc. 2007, 133, 2065–2084. [Google Scholar] [CrossRef] [Green Version]
  15. Hagos, S.; Cook, K.H. Ocean warming and late twentieth-century Sahel drought and recovery. J. Clim. 2008, 21, 3797–3814. [Google Scholar] [CrossRef]
  16. Semazzi, H.F.M.; Sun, L. The role of orography in determining the Sahelian climate. Int. J. Climatol. 1997, 17, 581–596. [Google Scholar] [CrossRef]
  17. Wang, G.; Eltahir, E.A.B. The role of vegetation dynamics in enhancing the low-frequency variability of the Sahel rainfall. Water Resour. Res. 2000, 36, 1013–1021. [Google Scholar] [CrossRef]
  18. Grist, J.P.; Nicholson, S.A. A study of the dynamic factors influencing the rainfall variability in the West African Sahel. J. Clim. 2001, 14, 1337–1359. [Google Scholar] [CrossRef]
  19. Jenkins, G.S.; Gaye, A.T.; Sylla, M.B. Late 20th century attribution of drying trends in the Sahel from the Regional Climate Model (RegCM3). Geophys. Res. Lett. 2005, 32, L22705. [Google Scholar] [CrossRef]
  20. Nicholson, S.E. On the factor modulating the intensity of the tropical rainbelt over West Africa. Int. J. Climatol. 2008. [Google Scholar] [CrossRef]
  21. Paeth, H.; Hense, A. SST versus climate change signals in West African rainfall: 20th Century and future projections. Clim. Chang. 2004, 65, 179–208. [Google Scholar] [CrossRef]
  22. Held, I.M.; Delworth, T.L.; Lu, J.; Findell, K.L.; Knutson, T.R. Simulation of Sahel drought in the 20th and 21st centuries. PNAS 2005, 102, 17891–17896. [Google Scholar] [CrossRef] [PubMed]
  23. Rowell, D.P.; Blondin, C. The influence of soil wetnessd is tribution on short range rainfall forecasting in the West African Sahel. Q. J. R. Meteorol. Soc. 1990, 116, 1471–1485. [Google Scholar] [CrossRef]
  24. Xue, Y.; Shukla, J. The influence of land surface properties on Sahel climate. Part I: Desertification. J. Clim. 1993, 6, 2232–2245. [Google Scholar] [CrossRef]
  25. Xue, Y.; Juang, H.M.H.; Li, W.; Prince, S.; De Fries, R.; Jiao, Y.; Vasic, R. Role of land surface processes in monsoon development: East Asia and West Africa. J. Geophys. Res. 2004, 109, D03105. [Google Scholar] [CrossRef]
  26. Abiodun, B.J.; Pal, J.S.; Afiesimama, E.A.; Gutowski, W.J.; Adedoyin, A. Simulation of West African monsoon using RegCM3 Part II: Impacts of deforestation and desertification. Theor. Appl. Clim. 2008, 93, 245–261. [Google Scholar] [CrossRef]
  27. Alo, C.A.; Wang, G. Role of vegetation dynamics in regional climate predictions over western Africa. Clim. Dyn. 2010, 35, 907–922. [Google Scholar] [CrossRef]
  28. Abiodun, B.J.; Adeyewa, Z.D.; Oguntunde, P.G.; Salami, A.T.; Ajayi, V.O. Modeling the impacts of reforestation on future climate in West Africa. Theor. Appl. Clim. 2012, 110, 77–96. [Google Scholar] [CrossRef]
  29. Sylla, M.B.; Jeremy, S.P.; Wang, G.L.; Lawrence, P.J. Impact of land cover characterization on regional climate modeling over West Africa. Clim. Dyn. 2015. [Google Scholar] [CrossRef]
  30. Diba, I.; Camara, M.; Sarr, A.B. Impacts of the Sahel-Sahara Interface Reforestation on West African Climate: Intra-seasonal Variability and Extreme Precipitation Events. Adv. Meteorol. 2016, 2016, 3262451. [Google Scholar] [CrossRef]
  31. Zheng, X.; Eltahir, E. The response to deforestation and desertification in a model of West African monsoons. Geophys. Res. Lett. 1997, 24, 155–158. [Google Scholar] [CrossRef] [Green Version]
  32. Giorgi, F.; Coppola, E.; Solmon, F.; Mariotti, L.; Sylla, M.B.; Bi, X.; Elguindi, N.; Diro, G.T.; Nair, V.; Giuliani, G.; et al. RegCM4: Model description and preliminary tests over multiple CORDEX domains. Clim. Res. 2012, 52, 7–29. [Google Scholar] [CrossRef]
  33. Grell, G.A.; Dudhia, J.; Stauffer, D.R. Description of the Fifth Generation Penn State/NCAR Mesoscale Model (MM5); Technical Note NCAR/TN−398 + STR; NCAR: Boulder, CO, USA, 1994. [Google Scholar]
  34. Kiehl, J.T.; Hack, J.J.; Bonan, G.B.; Boville, B.A.; Briegleb, B.P.; Williamson, D.L.; Rasch, P.J. Description of the NCAR Community Climate Model (CCM3). NCAR Tech. Note 1996. [Google Scholar] [CrossRef]
  35. Giorgi, F.; Mearns, L.O.; Shields, C.; McDaniel, L. Regional nested model simulations of present day and 2 × CO2 climate over the Central Plains of the US. Clim. Chang. 1998, 40, 457–493. [Google Scholar] [CrossRef]
  36. Dickinson, R.E.; Henderson, S.A.; Kennedy, P.J. Biosphere-Atmosphere Transfer Scheme (BATS) version1e as coupled to the NCAR Community Climate Model. NCAR Tech. Note 1993. [Google Scholar] [CrossRef]
  37. Zeng, X.; Zhao, M.; Dickinson, R.E. Intercomparison of bulk aerodynamic algorithms for the computation of sea surface fluxes using TOGACOARE and TAO data. J. Clim. 1998, 11, 2628–2644. [Google Scholar] [CrossRef]
  38. Pal, J.S.; Small, E.; Eltahir, E.A.B. Simulation of regional-scale water and energy budgets: Representation of subgrid cloud and precipitation processes within RegCM. J. Geophys. Res. 2000, 105, 29579–29594. [Google Scholar] [CrossRef] [Green Version]
  39. Pal, J.S.; Giorgi, F.; Bi, X.; Elguindi, N.; Solmon, F.; Gao, X.; Rauscher, S.A.; Francisco, R.; Zakey, A.; Winter, J. The ICTP RegCM3 and RegCNET: Regional climate modeling for the developing world. Bull. Am. Meteorol. Soc. 2007, 88, 1395–1409. [Google Scholar] [CrossRef]
  40. Sylla, M.B.; Dell’Aquila, A.; Ruti, P.M.; Giorgi, F. Simulation of the Intraseasonal and the Interannual Variability of Rainfall over West Africa with a Regional Climate Model (RegCM3) during the Monsoon Period. Int. J. Climatol. 2010, 30, 1865–1883. [Google Scholar]
  41. Holtslag, A.A.M.; de Bruijn, E.I.F.; Pan, H.L. A high resolution air mass transformation model for short-range weather forecasting. Mon. Weather. Rev. 1990, 118, 1561–1575. [Google Scholar] [CrossRef]
  42. Grell, G.A. Prognostic evaluation of assumptions used by cumulus parameterizations. Mon. Weather Rev. 1993, 121, 764–787. [Google Scholar] [CrossRef]
  43. Fritsch, J.M.; Chappell, C.F. Numerical prediction of convectively driven mesoscale pressure systems. Part I: Convective parameterization. J. Atmos. Sci. 1980, 37, 1722–1733. [Google Scholar] [CrossRef]
  44. Emanuel, K.A. A scheme for representing cumulus convection in large-scale models. J. Atmos. Sci. 1991, 48, 2313–2335. [Google Scholar] [CrossRef]
  45. Simmons, A.S.; Uppala, D.; Kobayashi, S. ERA-Interim: New ECMWF reanalysis products from 1989 onwards. ECMWF Newsl. 2007, 110, 29–35. [Google Scholar]
  46. Uppala, S.; Dee, D.; Kobayashi, S.; Berrisford, P.; Simmons, A. Towards a climate data assimilation system: Status update of ERA-Interim. ECMWF Newsl. 2008, 115, 12–18. [Google Scholar]
  47. Kothe, S.; Ahrens, B. On the radiation budget in regional climate simulations for West Africa. J. Geophys. Res. 2010, 115, D23120. [Google Scholar] [CrossRef]
  48. Oettli, P.; Sultan, B.; Baron, C.; Vrac, M. Are regional climate models relevant for crop yield prediction in West Africa? Environ. Res. Lett. 2011, 6, 014008. [Google Scholar] [CrossRef] [Green Version]
  49. Paeth, H.; Hall, N.M.; Gaertner, M.A.; Alonso, M.D.; Moumouni, S.; Polcher, J.; Ruti, P.M.; Fink, A.H.; Gosset, M.; Lebel, T.; et al. Progress in regional downscaling of West African precipitation. Atmos. Sci. Lett. 2011, 12, 75–82. [Google Scholar] [CrossRef]
  50. Dee, D.P.; Uppala, S.M.; Simmons, A.J.; Berrisford, P.; Poli, P.; Kobayashi, S.; Andrae, U.; Balmaseda, M.A.; Balsamo, G.; Bauer, D.P.; et al. The ERA-Interim reanalysis: Configuration and performance of the data assimilation system. Q. J. R. Meteorol. Soc. 2011, 137, 553–597. [Google Scholar] [CrossRef]
  51. Diallo, I.; Bain, C.L.; Gaye, A.T.; Moufouma-Okia, W.; Niang, C.; Dieng, M.D.B.; Graham, R. Simulation of the West African monsoon onset using the HadGEM3-RAregional climate model. Clim. Dyn. 2014, 43, 575–594. [Google Scholar] [CrossRef]
  52. Adler, R.F.; Huffman, G.J.; Chang, A.; Ferraro, R.; Xie, P.; Janowiak, J.; Rudolf, B.; Schneider, U.; Curtis, S.; Bolvin, D.; et al. The version-2 global precipitation climatology project (GPCP) monthly precipitation analysis (1979-present). J. Hydrometeorol. 2003, 4, 1147–1167. [Google Scholar] [CrossRef]
  53. Fan, Y.; van den Dool, H. A global monthly land surface air temperature analysis for 1948—present. J. Geophys. Res. 2008, 113, D01103. [Google Scholar] [CrossRef]
  54. Kraus, E.B. Subtropical droughts and cross equatorial energy transports. Mon. Weather. Rev. 1977, 105, 1009–1018. [Google Scholar] [CrossRef]
  55. Hagos, S.M.; Cook, K.H. Dynamics of the West African monsoon jump. J. Clim. 2007, 20, 52–64. [Google Scholar] [CrossRef]
  56. Thorncroft, C.D.; Nguyen, H.; Zhang, C.; Peyrillé, P. Annual cycle of the West African monsoon: Regional circulations and associated water vapour transport. Q. J. R. Meteorol. Soc. 2011, 137, 129–147. [Google Scholar] [CrossRef]
  57. Sylla, M.B.; Giorgi, F.; Stordal, F. Origins of rainfall and temperature bias in high resolution simulations over Southern Africa. Clim. Res. 2012, 52, 193–211. [Google Scholar] [CrossRef]
  58. Konaré, A.; Zakey, A.S.; Solmon, F.; Giorgi, F.; Rauscher, S.; Ibrah, S.; Bi, X. A regional climate modeling study of the effect of desert dust on the West African monsoon. J. Geophys. Res. 2008, 113, D12206. [Google Scholar] [CrossRef]
  59. Ali, A. Climate Variability and Change in the Sahel. Understanding the Current Situation by Observing Climate Change in the Sahel. A Challenge for Sustainable Development. Agrhymet. Mon. Bull. 2011, 17–20. Available online: http: //www.agrhymet.ne/PDF/pdfeng/specialChCang.pdf (accessed on 15 June 2018).
  60. Tarhule, A.; Lamb, P.J. Climate research and seasonal forecasting for West Africans: Perceptions, dissemination, and use. Bull. Am. Meteorol. Soc. 2003, 84, 1741–1759. [Google Scholar] [CrossRef]
  61. Le Barbé, L.; Lebel, T. Rainfall climatology of the Hapex-Sahel region during the years 1950–1990. J. Hydrol. 1997, 188–189, 43–73. [Google Scholar]
  62. Xue, Y.; Shukla, J. The influence of land surface properties on Sahel climate. Part II: Afforestation. J. Clim. 1996, 9, 3260–3275. [Google Scholar] [CrossRef]
  63. Beltr´an-Przekurat, A.; Pielke, R.A.S.R.; Eastman, J.L.; Coughenour, M.B. Modelling the effects of land-use/land-cover changes on the near-surface atmosphere in southern South America. Int. J. Clim. 2012, 32, 1206–1225. [Google Scholar] [CrossRef]
  64. Diasso, U.; Abiodun, B. Future impacts of global warming and reforestation on drought patterns over West Africa. Theor. Appl. Climatol. 2017. [Google Scholar] [CrossRef]
  65. Wang, L.; Cheung, K.W. Potential impact of reforestation programmes and uncertainties in land cover effects over the loess plateau: A regional climate modeling study. Clim. Chang. 2017. [Google Scholar] [CrossRef]
  66. Cook, K.H. Generation of the African easterly jet and its role in determining West African precipitation. J. Clim. 1999, 12, 1165–1184. [Google Scholar] [CrossRef]
  67. Lafore, J.P.; Asencio, N.; Bouniol, D.; Couvreux, F.; Flamant, C.; Guichard, F.; Hall, N.; Janicot, S.; Kocha, C.; Lavaysse, C.; et al. Évolution de Notre Comprehension du Système de Mousson Ouest-Africain. La Météorologie 2012, 11–16. Available online: http: //hdl.handle.net/2042/48127 (accessed on 15 June 2018).
  68. Janicot, S.; Thorncroft, C.D.; Ali, A.; Asencio, N.; Berry, G.; Bock, O.; Bourles, B.; Caniaux, G.; Chauvin, F.; Deme, A.; et al. Large-scale overview of the summer monsoon over West Africa during the AMMA field experiment in 2006. Ann. Geophys. Eur. Geosci. Union 2008, 26, 2569–2595. [Google Scholar] [CrossRef] [Green Version]
  69. Fontaine, B.; Janicot, S.; Moron, V. Rainfall anomaly patterns and wind field signals over West Africa in August (1958–1989). J. Clim. 1995, 8, 1503–1510. [Google Scholar] [CrossRef]
  70. Lavaysse, C.; Flamant, C.; Janicot, S.; Parker, D.J.; Lafore, J.P.; Sultan, B.; Pelon, J. Seasonal evolution of the West African heat low: A climatological perspective. Clim. Dyn. 2009, 33, 313. [Google Scholar] [CrossRef]
  71. Grist, J.P.; Nicholson, S.E.; Barcilon, A.I. “Easterly waves over Africa. PartII: Observed and modeled contrasts between wet and dry years. Mon. Weather Rev. 2002, 130, 212–225. [Google Scholar] [CrossRef]
  72. Diedhiou, A.; Janicot, S.; Viltard, A.; DeFelice, P.; Laurent, H. Easterly wave regimes and associated convection over West Africa and tropical Atlantic: Results from NCEP/NCAR and ECMWF reanalyses. Clim. Dyn. 1999, 15, 795–822. [Google Scholar] [CrossRef]
  73. Pytharoulis, I.; Thorncroft, C.D. The low-level structure of African Easterly Waves in 1995. Mon. Weather Rev. 1999, 127, 2266–2280. [Google Scholar] [CrossRef]
  74. Skinner, C.B.; Diffenbaugh, N.S. Projected changes in African easterly wave intensity and tracking response to greenhouse forcing. Proc. Natl. Acad. Sci. USA 2014, 9, 6882–6887. [Google Scholar] [CrossRef] [PubMed]
Figure 1. Topography of the simulation domain and the considered sub-domains (central Sahel, western Sahel, eastern Sahel and Guinea).
Atmosphere 09 00376 g001
Figure 2. Distribution of land cover types used in this study: (a) the standard version of RegCM4 model, (b) RegCM4_ALTER (Forest/Field mosaic), (c) RegCM4_ALTER (Tall Grass Savanna), and (d) RegCM4_ALTER (Short Grass Savanna). The rectangles indicate the altered zone (between 15° N–20° N).
Atmosphere 09 00376 g002
Figure 3. Mean summer rainfall (mm/day) averaged from 1990 to 2009 over West Africa: (a) Global Precipitation Climatology Project (GPCP) climatology, (b) RegCM4 (control), and (c) RegCM4 (control)—GPCP from June to September (JJAS).
Atmosphere 09 00376 g003
Figure 4. Mean summer Land Surface Temperature (LST)averaged from 1990 to 2009 over West Africa: (a)GHCN_CAMS Climatology of the Climate Prediction Center/National Center of Environmental Prediction (CPC/NCEP), (b) RegCM4, and (c) RegCM4—GHCN_CAMS Climatology.
Atmosphere 09 00376 g004
Figure 5. Interannual variability of normalized JJAS rainfall anomaly from GPCP (green) and the standard version of the RegCM4 model (black) over central Sahel (a), western Sahel (b), eastern Sahel (c), and Guinea(d).
Atmosphere 09 00376 g005aAtmosphere 09 00376 g005b
Figure 6. Difference of JJAS rainfall (mm/day) for: (a) RegCM4_ALTER (Forest/Field mosaic)—RegCM4 (control), (b) RegCM4_ALTER (Tall grass savanna)—RegCM4 (control), and (c) RegCM4_ALTER (Short grass savanna)—RegCM4 (control) over the central Sahel, western Sahel, eastern Sahel, and Guinea regions.
Atmosphere 09 00376 g006aAtmosphere 09 00376 g006b
Figure 7. Interannual variability of JJAS evapotranspiration (cg/m2/s) for: (a) RegCM4 (control), (b) RegCM4_ALTER (Forest/Field mosaic)—RegCM4 (control), (c) RegCM4_ALTER (Tall grass savanna)—RegCM4 (control), and (d) RegCM4_ALTER (Short grass savanna)—RegCM4 (control) over the central Sahel, western Sahel, eastern Sahel, and Guinea regions.
Atmosphere 09 00376 g007
Figure 8. Interannual variability of JJAS surface temperature for: (a) RegCM4 (control), (b) RegCM4_ALTER (Forest/Field mosaic)—RegCM4 (control), (c) RegCM4_ALTER (Tall grass savanna)—RegCM4 (control), and (d) RegCM4_ALTER (Short grass savanna)—RegCM4 (control) over the central Sahel, western Sahel, eastern Sahel, and Guinea regions.
Atmosphere 09 00376 g008
Figure 9. Interannual variability of JJAS sensible heat flux for: (a) RegCM4 (control), (b) RegCM4_ALTER (Forest/Field mosaic)—RegCM4 (control), (c) RegCM4_ALTER (Tall grass savanna)—RegCM4 (control), and (d) RegCM4_ALTER (Short grass savanna)—RegCM4 (control) over central Sahel, western Sahel, eastern Sahel and the guinea.
Atmosphere 09 00376 g009aAtmosphere 09 00376 g009b
Figure 10. Interannual variability of JJAS surface net upward longwave flux (W/m2) for: (a) RegCM4 (control), (b) RegCM4_ALTER (Forest/Field mosaic)—RegCM4 (control), (c) RegCM4_ALTER (Tall grass savanna)—RegCM4 (control), and (d) RegCM4_ALTER (Short grass savanna)—RegCM4 (control) over the central Sahel, western Sahel, western Sahel and Guinea.
Atmosphere 09 00376 g010
Figure 11. Interannual variability of JJAS surface net downward shortwave flux (W/m2) for: (a) RegCM4 (control), (b) RegCM4_ALTER (Forest/Field mosaic)—RegCM4 (control), (c) RegCM4_ALTER (Tall grass savanna)—RegCM4 (control), and (d) RegCM4_ALTER (Short grass savanna)—RegCM4 (control) over the central Sahel, western Sahel, eastern Sahel and Guinea.
Atmosphere 09 00376 g011
Figure 12. Number of rainy days (daily cumulative precipitation greater than 1 mm) over West Africa during the summer period (JJAS) for wet years and dry yearsfrom: (a,b) RegCM4,(c,d) RegCM4_ALTER (Forest/Field mosaic)—RegCM4 (control), (f,g) RegCM4_ALTER (Tall grass savanna)—RegCM4 (control), (i,j) RegCM4_ALTER (Short grass savanna)—RegCM4 (control) and (e,h,k) RegCM4_ALTER (wet–dry).
Atmosphere 09 00376 g012
Figure 13. Mean summer frequency of intense rainfall days (R ≥ 10 mm/day) over West Africa for wet years and dry years from: (a,b) RegCM4, (c,d) RegCM4_ALTER (Forest/Field mosaic)—RegCM4 (control), (f,g) RegCM4_ALTER (Tall grass savanna)—RegCM4 (control), (i,j) RegCM4_ALTER (Short grass savanna)—RegCM4 (control) and (e,h,k)RegCM4_ALTER (Wet–Dry).
Atmosphere 09 00376 g013
Figure 14. Mean JJAS 99th percentile of daily rainfall events (mm/day) over West Africa for wet years and dry years, from: (a,b) RegCM4, (c,d) RegCM4_ALTER (Forest/Field mosaic)—RegCM4 (control), (f,g) RegCM4_ALTER (Tall grass savanna)—RegCM4 (control), (i,j) RegCM4_ALTER (Short grass savanna)—RegCM4 (control) and (e,h,k)RegCM4_ALTER (Wet–Dry).
Atmosphere 09 00376 g014
Figure 15. Averaged JJAS zonal wind at 925 hPa for wet years and dry years from: (a,b) RegCM4, (c,d) RegCM4_ALTER (Forest/Field mosaic)—RegCM4 (control), (f,g) RegCM4_ALTER (Tall grass savanna)—RegCM4 (control), (i,j) RegCM4_ALTER (Short grass savanna)—RegCM4 (control) and (e,h,k)RegCM4_ALTER (Wet–Dry).
Atmosphere 09 00376 g015
Figure 16. Averaged JJAS zonal wind at 700 hPa over West Africa for wet years and dry years from: (a,b) RegCM4, (c,d) RegCM4_ALTER (Forest/Field mosaic)—RegCM4 (control), (f,g) RegCM4_ALTER (Tall grass savanna)—RegCM4 (control), (i,j) RegCM4_ALTER (Short grass savanna)—RegCM4 (control) and (e,h,k)RegCM4_ALTER (Wet–Dry).
Atmosphere 09 00376 g016
Figure 17. Averaged JJAS zonal wind at 200 hPa over West Africa for wet years and dry years from: (a,b) RegCM4, (c,d) RegCM4_ALTER (Forest/Field mosaic)—RegCM4 (control), (f,g) RegCM4_ALTER (Tall grass savanna)—RegCM4 (control), (i,j) RegCM4_ALTER (Short grass savanna)—RegCM4 (control) and (e,h,k)RegCM4_ALTER (Wet–Dry).
Atmosphere 09 00376 g017
Figure 18. Averaged JJAS vertical velocity (Omega 10−2 Pa/S) for wet years and dry years from: (a,b) RegCM4 (Control), (c,d) RegCM4_ALTER (Forest/Field mosaic)—RegCM4 (control), (f,g) RegCM4_ALTER (Tall grass savanna)—RegCM4 (control), (i,j) RegCM4_ALTER (Short grass savanna)—RegCM4 (control) and (e,h,k)RegCM4_ALTER (Wet–Dry).
Atmosphere 09 00376 g018
Figure 19. Mean variance of the 3- to 5-dayfiltered JJAS 700 hPa meridional wind for wet years and dry years from: (a,b) RegCM4, (c,d)RegCM4_ALTER (Forest/Field mosaic)—RegCM4 (control), (f,g) RegCM4_ALTER (Tall grass savanna)—RegCM4 (control), (i,j) RegCM4_ALTER (Short grass savanna)—RegCM4 (control) and (e,h,k) RegCM4_ALTER (Wet–Dry).
Atmosphere 09 00376 g019
Table 1. Land cover types/vegetation classes used in this study. NB: The values below indicate the type of land cover used in this study, which can be found in the legend of Figure 2.
1. Crop/mixed farming
2. Short grass
3. Evergreen needleleaf tree
4. Deciduous needleleaf tree
5. Deciduous broadleaf tree
6. Evergreen broadleaf tree
7. Tall grass
8. Desert
9. Tundra
10. Irrigated crop
11. Semi-desert
12. Icecap/glacier
13. Bog ormarsh
14. Inland water
15. Ocean
16. Evergreen shrub
17. Deciduous shrub
18. Mixed woodland
19. Forest/field mosaic
20. Water and land mixture
Table 2. Biosphere Atmosphere Transfer Scheme (BATS) vegetation/land cover.
ParametersShort GrassTall GrassForest
Vegetation albedo for wave lengths <0.7 μm0.100.080.06
Vegetation albedo for wave lengths >0.7 μm0.300.300.18
Difference between max fractional
Vegetation cover and cover at 269 K
0.10.00.4
Roughness length (m)0.050.100.30
Min stomatal resistence (s/m)6060120
Max Leaf Area Index266
Stem (dead matter area index)4.02.02.0
Root zone soil layer depth (mm)100010002000
Table 3. Mean summer rainfall difference (from 1990 to 2009) between the altered runs and the control one over central Sahel, western Sahel, eastern Sahel, and the Guinea region. The unit is in mm/day.
Sub-DomainsShort Grass–CtlTall Grass–CtlForest–Ctl
Central Sahel (10° W–10° E and 10° N–20° N)1.21.21.5
Western Sahel (18° W–10° Wand 10° N–20° N)1.92.02.3
Eastern Sahel (10° E–20° E and 10° N–20° N)0.70.81.0
Guinea (8° W–4° E and 5° N–9° N)0.30.30.4

