Spectroscopic BIL-SFG Invariance Hides the Chaotropic Effect of Protons at the Air-Water Interface


LAMBE UMR8587, Laboratoire Analyse et Modélisation pour la Biologie et l’Environnement, Université d’Evry val d’Essonne, Université Paris-Saclay, Blvd F. Mitterrand, Bat Maupertuis, 91025 Evry, France
*
Authors to whom correspondence should be addressed.
Atmosphere 2018, 9(10), 396; https://doi.org/10.3390/atmos9100396
Submission received: 13 September 2018
/
Revised: 1 October 2018
/
Accepted: 3 October 2018
/
Published: 11 October 2018
(This article belongs to the Special Issue Physical Chemistry of the Air-Water Interface)
Abstract
:The knowledge of the water structure at the interface with the air in acidic pH conditions is of utmost importance for chemistry in the atmosphere. We shed light on the acidic air-water (AW) interfacial structure by DFT-MD simulations of the interface containing one hydronium ion coupled with theoretical SFG (Sum Frequency Generation) spectroscopy. The interpretation of SFG spectra at charged interfaces requires a deconvolution of the signal into BIL (Binding Interfacial Layer) and DL (Diffuse Layer) SFG contributions, which is achieved here, and hence reveals that even though HO has a chaotropic effect on the BIL water structure (by weakening the 2D-HBond-Network observed at the neat air-water interface) it has no direct probing in SFG spectroscopy. The changes observed experimentally in the SFG of the acidic AW interface from the SFG at the neat AW are shown here to be solely due to the DL-SFG contribution to the spectroscopy. Such BIL-SFG and DL-SFG deconvolution rationalizes the experimental SFG data in the literature, while the hydronium chaotropic effect on the water 2D-HBond-Network in the BIL can be put in perspective of the decrease in surface tension at acidic AW interfaces.
1. Introduction
Because water is an ubiquitous solvent, its interface with other media (e.g., air, solid, biomolecule) is of fundamental interest, with applications ranging from heterogeneous chemistry in the atmosphere to technology, to biochemistry. The air-water interface (AW) is probably the aqueous interface that has attracted one of the most important amount of attention from the scientific community, for its relevance in atmospheric science and as the paradigm of hydrophobic media [1,2,3,4,5,6,7,8,9,10,11]. The acidity/basicity conditions of the aqueous surface play a key role in the chemistry at the air-water interface, thus the large number of fundamental works measuring the charge of this interface and attempting to reveal the location of HO and OH ions at the aqueous surface.
Surface sensitive experimental techniques and molecular dynamics (MD) simulations have provided a wealth of microscopic information on the air-water interface within the past decade [8,12,13,14,15,16,17]. Vibrational Sum Frequency Generation (SFG) spectroscopy [18] has especially been a key experiment in bringing this knowledge forward [8,9,10,19]. One pivotal issue is that this technique is able to probe the vibrational response of the interfacial first water monolayer only (denoted afterwards BIL for Binding Interfacial Layer [20,21]) in the case of neutral interfaces [21,22], and that phase resolved SFG spectroscopy [12,14,23,24,25] furthermore provides the knowledge on the average orientation of the (interfacial) molecules with the direct interpretation of the sign of the imaginary Im and real Re components of the non-linear second order susceptibility at the origin of the SFG activity of non-centrosymmetric interfacial water. Combining DFT-based MD and phase resolved SFG (experiment and simulation) we have recently revealed that water at the interface with the air (neutral planar interface) is organized into a very specific H-Bond-network of lower dimensionality than the liquid H-Bond network, with more than 90% of interfacial water being interconnected through H-Bonds (HBs) all oriented parallel to the surface, and forming an extended & continuous 2D-HB-Network (2DN) [22,26]. Such 2DN water skin at the interface with water is furthermore made of 2D-polygons of limited sizes (4–6 membered rings) and connected to the subsequent bulk water layer via an average one HB per water molecule [26,27].
Once the interface is charged, the interpretation of the SFG signal starts to be more tricky as this spectroscopy now probes an interfacial region of far larger thickness than the BIL discussed above, [20,21,28,29,30,31] where the final SFG signal is now a convolution of second () and third order () non-linear contributions, plus interferences [20,21,28,29,30,31]. Tian et al. have shown that any charged interface is composed of two distinct interfacial regions that are SFG active [20]: the Binding Interfacial Layer (BIL), i.e., the first water monolayer as shown in our recent works [21,31] (which is the only layer probed at neutral interfaces), and the Diffuse Layer (DL) made of the subsequent bulk water layer(s) reoriented by the surface field (at charged interfaces). The DL is made SFG active because the surface field induced liquid water reorientation breaks the liquid centrosymmetry. The final SFG signal at any charged interface is therefore:
where the DL contribution is the product of the third order non-linear susceptibility of bulk water by the electric potential across the DL [20,21,28,29,30,31].
Unravelling the interfacial structure of the air-water interface at various pH conditions from SFG spectroscopy experiments thus requires the deconvolution of BIL and DL signals, which has not been done yet in the literature. However, this is easily achievable from MD simulations as soon as the two BIL and DL water layers can be defined and extracted from the simulations. This is what we have done in the recent past, providing definitions of the BIL and DL layers from the point of view of the water molecules only (definitions based on three structural descriptors of water) at any charged interface (interface between water and solid/or air), hence providing the means to theoretically calculate and spectroscopic SFG signals, individually, by including only the identified water molecules that belong to each water layer into the calculation [21,31]. With these two individual signals in hand, one is able to give a clear assignment of the experimental SFG signatures into contributions arising from these distinct water layers. The most critical issue in this spectroscopic deconvolution is that only the signal carries the relevant structural information on the organisation of water at the charged interface. The does not carry such relevant information as it is systematically composed of the same signal, i.e., the third order non-linear signal (well-known, see e.g., refs. [20,21] for this signal extracted from, respectively, experiment alone/theory alone) modulated in sign and amplitude by the electric potential across the DL. Put in other words, the molecular structure of the DL giving rise to the SFG is the one of liquid water, modulated by a reorientation of the global H-Bond network through the electrostatic driving force of the surface field. As revealed in ref. [31], while the signal does not carry relevant information on the water interfacial structure per se, it does carry other highly relevant information, such as the direct knowledge of the electric field across the DL, of the EDL (Electric Double Layer) formation when electrolytes are included in the aqueous bulk, of the direct measure of the aqueous pH and of the surface charge. While the signal carries no direct information on the interfacial water structure, its final contribution to the total signal can be non negligible (depending on the surface electric field) and it has to be removed from the total SFG signal in order to reveal the only relevant structural interfacial information to be assigned, and solely contained in the .
This is exactly what we illustrate in the present work where we revisit the acidic air-water (planar) interface by using DFT-based MD simulations for theoretical phase resolved SFG spectroscopy, where we deconvolve the SFG signal into BIL and DL water layers contributions and hence provide the assignment of the relevant experimental SFG spectral features. The DFT-MD furthermore provides the basic microscopic knowledge of the possible modifications induced by the presence of the protons into the interfacial 2D-HB-network water skin observed at the neutral interface. To that end, we keep our simulations very simple by adding one proton only at the air-water interface, and learn from this how the 2DN water skin can be strengthened/weakened by the presence of the proton and how these structural changes affect the vibrational properties recorded at the air-water interface.
The need to revisit this highly investigated acidic air-water interface stems from the fact that definitive conclusions on how protons affect the water arrangement in the BIL are still missing from the literature, while the enrichment/depletion in protons at the interface is still a matter of on-going debate within the scientific community: SFG [32,33,34] and Second Harmonic Generation (SHG) [35,36] spectroscopies suggest a higher propensity for the hydronium ion to bind to the surface, while electrokinetic experiments point towards a basic air-water interface [37,38,39,40,41,42,43]. Many theoretical investigations have also been dedicated to this topic, see e.g., the recent work and review from the Hassanali group [38], with conclusions ranging from a strong preference of protons for the interface [38] to a little or negligible preference of protons for the interface [39,40]. Theoretical investigations have also been aimed at identifying the physical origins of the proton trapping at the interface: a favourable enthalpic term arising from the displacement of unfavourable interfacial water molecules as the ion moves towards the interface is shown to outweigh the entropic penalty due to the decrease in instantaneous water surface fluctuations near the excess proton [44].
The novelty brought forward in the present work is the focus on if and how the HO cation can be accomodated within the BIL 2DN water skin layer, and how this correlates into an SFG signature that can be clearly identified and extracted from the SFG spectrum of the acidic air-water interface.
2. Computational Methods
Density Functional Theory based Molecular Dynamics (DFT-MD) simulations have been performed on the acidic air/liquid water (AW) interface, with a liquid water composed by 256 molecules, one single HO ion solvated in the topmost interfacial water layer, and air approximated by vacuum. Four independent simulations are performed, each separate trajectory starts from a random configuration of liquid water put in contact with the air, and the cation is added randomly at the interface. The electronic set-up follows our previous works [22,31] on air-water interfaces (neat and in presence of electrolytes). The simulations have been performed with the CP2K package [45,46], the BLYP [47,48] functional is adopted in combination with mixed Gaussian-Plane Waves basis sets and GTH pseudopotentials [49]. Grimme D2 corrections [50,51] are taken into account for a better description of van der Waals interactions. The DZVP-MOLOPT-SR basis set, augmented with a 400 Ry plane wave basis set have been used. Default algorithms and convergence criteria have been adopted. The simulation box has dimensions of 19.734 × 19.734 × 35.0 Å and periodic boundary conditions have been applied in all three spatial directions. A snaphshot from simulations illustrating the simulation box is presented in Figure 1. Born-Oppenheimer dynamics are performed, the electronic wavefunction is calculated at each time step, the classical nuclei displacements are obtained through the Velocity-Verlet algorithm with a 0.4 fs time-step. All the four DFT-MD simulations are systematically divided into two parts, an equilibration dynamics of 10 ps duration (in the NVE ensemble, however allowing rescaling of velocities whenever necessary), followed by pure NVE production runs of 25 ps each (thus a total sampling of 100 ps).
For structural and spectroscopic analyses, the vector normal to the surface is taken oriented towards the vacuum. The analysis into H-Bonds formed between two water molecules (or one water molecule and the hydronium ion) uses the geometrical definition from ref. [52], with O(-H)⋯O ≤ 3.2 Å and O-H⋯O angle in the range [140–220]. The identification of water interfacial layers, namely BIL (Binding Interfacial Layer), DL (Diffuse Layer) and Bulk liquid water, has been obtained following our methodology derived and fully described in ref. [21] on the basis of water structural properties only.
The total resonant electric dipole non-linear susceptibility and its real and imaginary components are calculated following the time-dependent method of Morita and Hynes [53,54], using the model already applied in refs [21,22]. Briefly, assuming that in the high frequency region (>3000 cm) only the O-H stretching motions are contributing to the spectrum, and neglecting intermolecular cross-correlation terms, one has:
where k and T are the Boltzmann constant and temperature of the simulated system and () are any direction in the laboratory frame. Since SFG signals are here calculated in geometry, PQR correspond to directions (z is the normal to the water surface, defined from liquid to vapour phase). is a time-correlation function, and are respectively the individual O-H bond contribution to the total polarization and dipole moment of the system and and ) their time derivatives. M is the number of water molecules and and are indexes identifying each of the two O-H oscillators per molecule. Using the direction cosine matrix (D) projecting the molecular frame onto the laboratory frame , and assuming that the O-H stretching is much faster than the modes involving a bond reorientation, one can write:
The D matrix and the projection of the velocities on the O-H bond axis () are directly obtained from the DFT-MD trajectory, while are parametrized [55,56].
SFG spectra arising from BIL/DL are obtained including only the water molecules that belong to BIL/DL into the summation in Equation (2).
3. Results and Discussion
So many things have already been said on aqueous HO at the interface with the air (see e.g., refs. [37,38,39,40,41,42,43] for a short selection). Here we revisit the structural properties of the cation at the interface with the purpose to make a direct link with SFG (Sum Frequency Generation) vibrational spectroscopy, and especially use our deconvolution of the SFG signal into contributions arising from the water layers called BIL (for Binding Interfacial Layer) and DL (for Diffuse Layer) for getting a rational and more definitive knowledge of how the acidic AW interface is structurally organised. One essential aspect that will be immediately discussed below is to revisit the localisation of HO at the aqueous interface with the air in the context of the water interfacial skin being organised as a 2D-HBond-Network at the neat interface, as shown and discussed in refs. [22,26,27]. In this 2D-HBond-Network water skin (2DN), water molecules maximize their number of H-Bonds and are hence engaged preferentially in H-Bonds parallel to the surface (thus the 2-Dimensional nomenclature). This is the dominant HB-structure in the BIL at the interface with the air. While engaged in the 2DN through one O-H group, the water molecules have their second O-H either dangling towards the air (1/3 of the BIL water molecules) or H-Bonded towards the subsequent bulk liquid water (2/3 of BIL water). These O-H groups are respectively the reason for the 3700 cm free-OH and 3400 cm liquid-like SFG bands at the air-liquid water interface, respectively.
All results discussed afterwards focus on structural and spectroscopic properties of the neutral vs the acidic air-water interface, while dynamical properties of interfacial water are not discussed, as longer time-scales than the ones (tens of ps) offered by our DFT-MD simulations would be more appropriate for convergence. However, for these latter we refer to our recent work, [26] where the dynamics of water within the interfacial 2D-HB-Network is compared to the one of bulk water by means of classical MD simulations. All results presented in this work are based on averages over the four independent 25 ps (after equilibration) DFT-MD simulations of the acidic AW (Air/liquid Water) interface. Each simulation differs for the initial location of the HO cation, randomly chosen within the BIL interfacial layer (BIL, Binding Interfacial Layer, see more in Section 2 and below). As will be shown immediately below, the cation remains in the BIL for all the simulation time (100 ps without counting equilibration).
3.1. Solvation of the Hydronium Cation in the BIL
Figure 1 reports the density profiles for water and HO, as a function of the distance from the Willard and Chandler instantaneous surface [17]. The density profile for the neat AW interface, taken from ref. [22], is also reported for comparison, as well as the boundaries for the L0–L3 water layers found in this work at the acidic AW interface (see Section 2 for details on the definitions of these layers, and refs. [21,31]). Using the criteria presented in refs. [21,31] for defining water layers into BIL, DL and Bulk, L0 and L1 layers together form the BIL with a thickness of ∼3.5 Å. The water density is ∼1.3 higher than the one of bulk water, and interestingly the first peak in the water density profile of the acidic AW interface is almost unchanged from the one obtained at the neat AW interface. As shown in refs. [22,26,27] (DFT-MD and classical MD simulations alike), on average, 90% of the water molecules located in the L1 layer at the neat AW interface are inter-connected within one single non-interrupted H-Bond (HB) network through HBs oriented parallel to the instantaneous surface and forming a 2D-HB-Network (2-Dimensional HB network, 2DN for short notation) made of 2D-polygons. The 2DN is located in between ∼1.0 and 2.8 Å from the surface, see Figure 1. The same 2DN is obtained at the acidic AW interface, more details will be discussed below and in the next sections. In refs. [22,26,27], we have also shown that this specific 2DN structural arrangement of the water molecules at the interface with the air (in the BIL) is at the origin of some of the structural and dynamical properties of the neat AW interface. This very special 2DN water skin at the aqueous interface with the air is spatially preceded by a few rare water molecules located in the layer denoted L0, these water somehow surfing on the 2DN if one uses a more macroscopic or coarse-grain view of the interface. The density profile of the HO cation is also reported in Figure 1 (in red), showing that, once in the BIL, the hydronium spends most of the time at the boundary between L0 and L1 water layers, hence lying just above the 2DN. Such specific location offers an asymmetric solvation environment, which perfectly fits the very nature of the HO cation, that can donate three strong HBs to three water molecules that belong to the 2DN, while simultaneously pointing the oxygen less favorable H-bonding site towards the vapor phase. A representative snapshot of the hydronium solvation structure at the AW interface extracted from the MD trajectory is shown in Figure 2B, while panel Figure 2A illustrates the surfing of the cation above the 2DN.
Subsequent to the BIL, one finds two water layers labelled L2 and L3 in Figure 1 (analysing the water up to the middle of the simulation box), which are already organised as centrosymmetric bulk liquid water at the neat AW interface [22,26], but are not yet organised as such at the acidic AW interface. Because of the presence of the cation hydronium at the surface (in the BIL) the acidic AW surface is now positively charged, with the resulting surface field reorienting the water molecules beyond the BIL water layer. As explained in refs. [20,21,31], this gives rise to a DL water layer, before centrosymmetric bulk liquid is recovered. This will be more detailed in the next section. For here, we only stress that there are differences in the density profiles of L2 and L3 water layers in between the neat and the acidic interfaces, because of the surface electrostatic field driving force reorienting some water molecules beyond the BIL and hence structuring water differently at the neat and acidic AW interfaces in these layers.
Because the hydronium cation is found surfing above the water 2DN network, it comes naturally that when looking at the interfacial proton hopping mechanism, the first event should systematically be a jump of the proton to a water molecule that belongs to the 2DN. This is indeed observed in all the four simulations here performed. A summary of the number of proton jumps identified along each trajectory is furthermore presented in Figure 3A: nine proton hopping events have been observed in total (over 100 ps dynamics).
We analyze in Figure 3B the proton hopping path that occurs in each MD simulation in terms of water layer’s appearance. The x-axis provides the sequence of jumps (in increasing order) and the y-axis provides the layer to which belongs the water molecule receiving (and then donating) the proton. Despite the limited number of proton jumps along each of the ab initio trajectories (over the total 100 ps), one can see that, as expected, the hopping mechanism systematically starts with the proton transferred from a water molecule located in L0 to a water located in the 2DN. After this first jump, the Grotthuss mechanism continues and follows the HB-chains along the 2DN (i.e., the proton is transferred between waters located in the 2DN), and ends up (in these short simulations) with the proton transferred back to a water in the L0 sub-layer. While our limited statistics over these rare events does not allow final quantitative conclusions, our findings are however consistent with observations made in Ref. [38] that the proton jumps are made parallel to the surface. Indeed, Giberti and Hassanali revealed in Ref. [38] a preferential direction for the Grotthuss mechanism at the air-water interface, with the proton jumping within water wires connected by HBs parallel to the surface, consistent with our present data. This hence suggests that the interfacial 2D-HB-Network naturally provides preferential pathways (denoted wires in Ref. [38]) for the proton hopping to occur parallel to the surface, so that this specific network could possibly be instrumental into an increased residence time of protons at the interface (i.e., in the BIL), as already inferred in Ref. [26].
3.2. BIL & DL Water Layers and SFG Spectroscopy: DL-SFG Dominates the Spectral Changes at the Acidic Air/Water Interface
We now turn to the investigation of the local modifications induced by the proton in the interfacial water arrangement by combining the detailed structural characterization from DFT-MD with SFG spectroscopy. While vibrational spectroscopy is well-recognized as an essential tool in unravelling structures, the microscopic assignment of the SFG spectral features at interfaces still remains challenging. While theory is an indispensable tool to achieve such microscopic structural comprehension, the 1-to-1 spectroscopy-structure relationship can however still be hard to achieve because the total interfacial SFG active signal hides two structural components that have to be disentangled, as discussed in Refs. [20,21,31,57]. Any aqueous interface is indeed composed of water organised in two specific layers denoted BIL (Binding Interfacial Layer) and DL (Diffuse Layer, existing only at charged interfaces), before the centrosymmetric SFG non-active bulk water is recovered. Their individual spectroscopic signatures have to be deconvolved in order to correctly interpret the total SFG signal. As shown in Refs. [20,21] and discussed in details in Ref. [31], because the DL is bulk liquid water being reoriented by the surface field (at charged interfaces), the DL-SFG signal at any charged aqueous interface is simply given by , i.e., the third order non-linear susceptibility of bulk liquid water multiplied by the electric potential across the DL water layer. The DL-SFG signal is therefore systematically composed of the two bands of the signal (at 3200 and 3400 cm) modulated in intensity and sign (for phase-resolved SFG) by the specific of each aqueous interfacial system. Experimentally, once is known, can be revealed. Theoretically, this is much simpler as is directly calculated by the definition of in Equation (2), restricting the summation over the water molecules that belong exclusively to the DL. We have shown in Ref. [31] some of the microscopic and more macroscopic knowledge hidden in the DL-SFG, and how to extract these from experiments and/or simulations.
The important issue is that there is no specific interfacial structural information to be gained from the DL-SFG signatures (at 3200 and 3400 cm) as they systematically correspond to a bulk-like organisation of water subsequent to the BIL layer. Once the DL-SFG contribution is removed from the total SFG signal, the BIL-SFG spectroscopic contribution is revealed, and it is the only significant spectroscopic signal to be interpreted in order to gain the knowledge of the water organisation at the interface.
To achieve the knowledge of BIL-SFG at the acidic air/liquid water interface, we apply the procedure developed and validated in Refs. [21,31], based on three structural descriptors of the water organisation. By evaluating the water density profile (Figure 1), the water average coordination number (Table 1) and water-water HBs combined strength and orientation (3D-plots in Figure 4), the BIL, DL and Bulk water layers can be assigned. The average water coordination in each layer is obtained by counting the number of HBs formed by each water molecule at each MD step and averaging over time and over all molecules in a given layer (L0–L3). The 3D-plots in Figure 4 are obtained by evaluating the joint probability for a water-water HB to be formed in each layer (L0–L3) with a given O-O distance and a given orientation with respect to the normal to the surface (oriented towards the air). The orientation is given in cosine values. For bulk water, an homogeneous distribution in cosine values is obtained [21], which corresponds to a 3D-plot identical to the one presented in Figure 4A for the L3 layer at the acidic air/water interface. Any deviation from this behavior indicates that the isotropic nature of the water-water H-Bonding of the centrosymmetric bulk is not recovered.
When the hydronium cation is located in the BIL at the acidic air/water interface, all three descriptors described above and calculated for L0 and L1 layers differ significantly from their counterparts in bulk water. Indeed, water is on average under-coordinated with respect to bulk, with respectively 1.9 and 2.9 HBs formed per water molecule, versus the canonical 3.4 HBs/water molecule obtained in the bulk liquid (see Table 1, the 3.4 reference value is obtained from a reference simulation of bulk water using the same simulation set-up as the one used here [22]). Figure 4A shows a highly inhomogeneous orientation distribution of the water-water HBs formed in layers L0 and L1, clearly reflecting a break from bulk-like centrosymmetry. These two descriptors combined with the observed higher density of water than the reference in the liquid give the result that L0 and L1 layers together form the BIL at the acidic air/water interface, with the same 3.5 Å thickness as the one observed at the neat air/water interface. Once HO is present in the BIL, the 3D-plots in Figure 4 show that centrosymmetry is broken also in the L2 layer, which shows up in the net orientation of the O-H groups pointing toward the bulk (red spot at negative cosine values), while keeping the same average water coordination as in the bulk (Table 1). It is also clear from Figure 4 that the L2 layer has an underneath more homogeneous liquid water structure, revealed in the global homogeneous background of O-O distances/HB angle distribution in blue color, reminiscent of the homogeneous distribution that will be discussed just afterwards for centrosymmetric liquid water. With the added knowledge that the water density in the L2 layer is close to the one of bulk water (Figure 1), these three descriptors put together provide the knowledge that the L2 layer is the DL (i.e., reoriented non-centrosymmetric bulk water) at the acidic interface. This layer does not exist at the neat air/water interface (because of the isoelectric surface). Once the analyses are done in layer L3 at the acidic AW interface, all three structural descriptors are identical to the ones calculated for bulk liquid water: centrosymmetric bulk liquid water is thus recovered at the rather short distance of 7.5 Å from the surface at the acidic air/liquid water interface. This is 4.0 Å more distant than what was observed at the neat AW interface.
Once BIL and DL layers are defined, their contribution to the total SFG spectrum can be readily deconvolved by calculating the SFG signals arising from the water molecules located in each of the two layers separately (i.e., Equation (2) restricted to the water molecules belonging to one given layer). The results are shown in Figure 5, where the BIL/DL/Bulk/Total SFG spectra calculated for each trajectory are plotted in comparison to the neat interface signal [22]. We also show in the figure that the L3 layer defined here as bulk water is indeed centrosymmetric and non SFG active, confirming the BIL/DL/Bulk boundaries obtained here. The BIL-SFG signal of the neat air/water interface is also reported in the Figure.
The most striking result from this deconvolution is that the BIL-SFG signal (top of Figure 5) is roughly unchanged when adding one proton at the air-water interface, so that all differences observed when comparing the total spectrum of the neat AW interface (dashed light-blue line at the bottom of Figure 5) to the one at the acidic AW interface (colored lines at the bottom of Figure 5) solely arise from the DL contribution to SFG spectroscopy (a non-zero contribution only for the charged acidic interface). Focusing on the BIL-SFG signal, one can clearly see that the four independent DFT-MD trajectories with one proton located in the BIL provide a BIL-SFG spectrum identical to the one obtained at the neat interface. This is of course stated within statistical errors in mind, but the small differences eventually observed when comparing the SFG signal of the acidic AW interface to the neutral AW one are of the same order of magnitude as the differences observed in between the four SFG spectra calculated from the four separate trajectories of the acidic AW interface. In all four trajectories for the acidic AW interface, there is a negative DL-SFG contribution, which sign and magnitude solely depend on the potential difference across the DL while the shape is characterized by the two-bands structure of the spectrum of centrosymmetric bulk water (i.e., ). Because of the usual convention for the choice of the normal to the surface being directed towards the air, a negative DL-SFG spectrum in the OH-stretching region arises from a positively charged surface (O-H groups oriented outwards the surface normal, i.e., towards the bulk), while a positive signal arises from a negatively charged surface [21]. The negative sign of the DL-SFG signal is thus the direct probe of the presence of the hydronium cation within the first interfacial water monolayer, i.e., within the BIL.
Interestingly, experiments reporting Im measured for the air-water interface in acidic conditions, either in presence of HCl, HI or HSO electrolytes [32,33], have reported a decrease in amplitude of the signal in the 3000–3600 cm frequency range with respect to the neat interface. This is indeed what our simulations provide (one cation at the interface), see the total SFG signals for the two interfaces at the bottom of Figure 5. The general consensus from the published experiments was that such amplitude decrease in the SFG signal could be ascribed to ions in the electrolyte having different proximity to the surface, with the proton cation located closer to the interface than the anion. Combined with our simulation results and the SFG spectroscopy deconvolution, it is possible to conclude that the spectral changes experimentally observed at acidic air-water interfaces are solely due to the third-order DL contribution to SFG, arising from the enrichment of the surface in protons (with respect to the anion counter-ions), while the BIL-SFG spectrum remains constant (at least when one proton only is taken into account in the BIL).
3.3. Beyond BIL-SFG Invariance: The Chaotropic Effect of Hydronium at the Air-Water Interface
The BIL-SFG spectroscopic invariance in going from the neat to the acidic air-water interface revealed in the previous section would suggest, at first glance, that there is no significant structural modification within the interfacial 2D-HB-network (2DN) once the proton is solvated in the BIL. However, it is experimentally well-known that when acids are added to water, the water surface tension slightly decreases, [58] thus pointing towards a change in the interfacial structure. Since we have just concluded that the proton is preferentially located in the BIL with respect to the anions used in the electrolytes in the SFG experiments, this decrease in surface tension has to arise from the way the hydronium cation affects the interfacial structure, hence resulting into an apparent contradiction with our calculated BIL-SFG spectroscopic invariance. To solve this controversy, we now look into more details at the molecular arrangement of water in the BIL.
We have already presented that the interfacial water interconnectivity is dominated by the formation of an extended 2D-HB-Network (2DN), built upon water-water HBs all oriented parallel to the surface. This 2DN is located between 1.0 and 2.8 Å from the instantaneous liquid surface, both at the neutral and acidic air-water interfaces (see Figure 1). The existence of the 2DN is clearly reflected in the 3D-plot (Figure 4B) of the combined HB distance and HB orientation calculated for the BIL (equivalently for the L1 layer) at the neat and acidic AW interfaces (see also Ref. [27] for a thorough discussion at the neat interface). The plot obtained for the neat interface shows a well-defined red spot at cosine values around zero, which is due to the vast majority of HBs formed by interfacial water oriented parallel to the surface. When the proton is located in the BIL, the red spot broadens towards more negative cosine values, meaning that part of the HBs that were forming the 2DN at the neutral AW interface are now broken, these OH-groups reorient in order to form new HBs with the water molecules located in the subsequent L2 (DL) layer (BIL-DL HBs). This results into a weakening of the 2DN at the acidic AW interface, which can also be seen when evaluating the average number of intra-2DN HBs, i.e., HBs formed between water molecules both belonging to the 2DN, which slightly decreases from 1.7 to 1.6 HBs/molecule when going from the neat to the acidic interface. The broken intra-2DN HBs are not SFG-active, they are therefore not detectable in the spectroscopic signal. However, the newly formed BIL-DL HBs can now contribute to the negative BIL-SFG intensity at 3400 cm. It is therefore possible that proton interfacial concentrations higher than the 1.2 M simulated in the present work (i.e., one proton over 45 water molecules in the BIL) could induce reorientation of a higher number of O-H groups towards the DL and could hence impact more substantially the BIL-SFG activity by modulating the intensity of the negative 3400 cm band. This could then be detectable in the signal.
To understand the spatial extension of the structural perturbation induced by the presence of one HO into the BIL, we present in Figure 6 the time averaged spatial resolution of the average number of intra-2DN HBs formed per water molecule in the 2DN, projected onto the (x,y) plane parallel to the surface. The zero in this plot is the location of the hydronium ion. The plot reveals that the presence of the hydronium cation in the BIL generates a hole in the intermolecular connectivity within the 2DN. This is easily understood by the fact that HO is on average surfing above the 2DN, and hence donates (on average) three HBs to three water molecules located in the 2DN. In order to accomodate the hydronium cation, these three water molecules are consequently reoriented towards the bulk, leading to the breaking of an average one intra-2DN HB per molecule (which were initially connecting each of these 3 waters to one of their first nearest neighbours within the BIL-2DN). We hence see in Figure 6 that the chaotropic effect of the proton on the structure of water at the interface extends within a radius of roughly 4.5 Å, involving the three water molecules discussed above (which are directly H-Bonded to the hydronium ion) plus their first nearest neighbours.
The hydronium solvation in the BIL thus affects the water interfacial structure, with the proton having a chaotropic effect on the 2DN roughly over a ∼4.5 Å radius around the ion. However, as these structural modifications involve the breaking of HBs that were initially oriented parallel to the surface, they are not accompanied by any change in the BIL-SFG spectrum of the acidic air-water interface (when compared to the neat interface), since these in-plane HBs are non SFG active. There is therefore no direct SFG spectroscopic signature of the hydronium induced structural modification in the 2DN-BIL water layer in the O-H stretching region.
4. Conclusions
We have revisited the structure and SFG spectroscopy of the acidic air-water interface, by coupling structural characterization from DFT-MD simulations and theoretical SFG spectroscopy. This reveals that once one hydronium is located in the BIL (Binding Interfacial Layer), it is on average surfing above the 2D-HBond-Network (2DN) made by the water molecules within the 3.5 Å thickness at the interface with the air. In this position, the hydronium can on average donate three HBs to water molecules belonging to the 2DN and simultaneously point its less favourable oxygen H-Bonding site towards the vacuum. Because of the presence of the 2DN at the interface with the air, the proton hopping mechanism proceeds through this priviledged 2D network, thus the observed jumps parallel to the aqueous surface along HB-chains connecting water molecules within the 2DN. This more priviledged direction for the proton hoppings was already observed and commented by the Hassanali group [38], showing that interfacial Grotthuss mechanism occurs preferentially through water wires parallel to the surface. In the light of our findings, these water wires are nothing else than possible HB pathways along the 2DN, which thus helps increasing the residence time of the proton into the BIL, i.e., at the direct interface with the air. Other competitive pathways for the Grotthus mechanism exist, leading the proton into the liquid, as commented in ref. [38]. Water wires are also present in liquid water, in 3D rather than 2D dimensions [59], with possible roles on the proton and/or hydroxide ions diffusion motion. Similar water wires are also found to play central roles in proton diffusivity in biological systems and at membrane-water interfaces [60,61]. In the light of the results shown here for the 2DN wires at the air-water interface, one might be tempted to rediscuss these literatures and investigate if a similar connection between HB-network of reduced dimensionality and anisotropic proton diffusion can also be found.
As regards the vibrational response of the acidic air-water interface measured by surface specific SFG spectroscopy, the most striking result from our investigation is that the BIL-SFG signal is constant, whether the BIL carries one proton (acidic air-water interface) or does not (neutral air-water interface). The measured spectral changes in the SFG spectroscopy of the air-water interface when interrogated in acidic conditions solely arise from the DL-SFG contribution. The DL water layer (Diffuse Layer, i.e., non-centrosymmetric bulk-like liquid water reoriented by the surface field) appears at the acidic interface because of the accumulation of a positive charge in the BIL, i.e., at the interface. These findings rationalize the SFG spectra measured for different acids in water (HI, HCl, HSO) in the literature. These spectra systematically display a net negative decrease of the Im intensity in the region below 3600 cm, which microscopic assignment is shown here solely due to the existence of the DL at these acidic air-water interface. The negative sign and more negative intensity of the DL-SFG spectrum calculated at the acidic air-water interface indirectly reveals the enrichment in hydronium cations in the BIL (i.e., due to a positively charged surface). Our work furthermore shows the importance of deconvolving BIL-SFG and DL-SFG signatures from the total SFG spectra in order to be able to provide a rational interpretation of the experimental data.
The BIL-SFG invariance revealed in this work somehow contradicts, at first glance, the experimentally observed slight decrease of water surface tension with increasing acids concentration. With the purpose of shedding new light into this raising controversy, we have shown that there is indeed a chaotropic effect of the proton on the structure of water in the BIL, roughly within 4.5 Å radius around the ion, which however has no direct signature in the BIL-SFG spectroscopy. The proton induces reorientation of the three 2DN-BIL-water molecules to which it donates H-Bonds, hence breaking water-water HBs that were initially formed between these water molecules with their first nearest neighbors. Because these H-Bonds within the 2DN were parallel to the surface, they are SFG-non active. The new H-Bonds created with the subsequent DL water molecules are identical to the ones already present at the neat interface, that were giving rise to the 3400 cm SFG negative band. SFG is therefore not a good probe in tracking such local modifications arising from the chaotropic effect of the hydronium on the 2DN-water. The direct consequence of this chaotropic effect is however a slight weakening of the 2DN structure (if this effect would be additive, the more hydroniums at the interface the more weakening of the 2DN network). Since it is the only structural change induced by the hydronium solvation in the BIL-2DN, this finding hints at the existence of a correlation between the extended interfacial 2D-HB-Network structure and the high surface tension of water, as well as the slight decrease of the surface tension in acidic conditions.
Author Contributions
S.P. contributed to the simulations and their interpretation. All co-authors contributed to the simulation interpretation and put them into the context of experimental data/interpretation. All co-authors contributed to the writing of the manuscript.
Funding
This work was funded by ANR DYNAWIN Grant ANR-14-CE35-0011-01 (ANR Agence Nationale de la Recherche).
Acknowledgments
This work was performed under Grant ANR DYNAWIN ANR-14-CE35-0011-01, and using HPC resources from GENCI-France Grant No. 072484 (CINES/IDRIS/TGCC). A special thank to the Challenge TGCC Curie-2017. We also thank Dr. Alessandra Serva for discussions.
Conflicts of Interest
The authors declare no conflict of interest.
References
- Laskin, A.; Gaspar, D.J.; Wang, W.; Hunt, S.W.; Cowin, J.P.; Colson, S.D.; Finlayson-Pitts, B.J. Reactions at Interfaces as a Source of Sulfate Formation in Sea Salt Particles. Science 2003, 301, 340–344. [Google Scholar] [CrossRef] [PubMed]
- Dawson, M.; Varner, M.E.; Perraud, V.; Ezell, M.J.; Gerber, R.B.; Finlayson-Pitts, B.J. Simplified Mechanism for New Particle Formation from Methane Sulfonic Acid, Amines, and Water via Experiments and Ab Initio Calculations. Proc. Nat. Acad. Sci. USA 2012, 109, 18719–18724. [Google Scholar] [CrossRef] [PubMed]
- Knipping, E.M.; Lakin, M.J.; Foster, K.L.; Jungwirth, P.; Tobias, D.J.; Gerber, R.B.; Dabdub, D.; Finlayson-Pitts, B.J. Experiments and Simulations of Ion-Enhanced Interfacial Chemistry on Aqueous NaCl Aerosols. Science 2000, 288, 301–306. [Google Scholar] [CrossRef] [PubMed] [Green Version]
- Katrib, Y.; Deiber, G.; Schweitzer, F.; Mirabel, P.; George, C. Chemical Transformation of Bromine Chloride at the Air/Water Interface. J. Aerosol Sci. 2001, 32, 893–911. [Google Scholar] [CrossRef]
- Clifford, D.; Donaldson, D.J. Direct Experimental Evidence for a Heterogeneous Reaction of Ozone with Bromide at the Air- Aqueous Interface. J. Phys. Chem. A 2007, 111, 9809–9814. [Google Scholar] [CrossRef] [PubMed]
- Laskin, A.; Wang, H.; Robertson, W.H.; Cowin, J.P.; Ezell, M.J.; Finlayson-Pitts, B.J. A New Approach to Determining Gas-Particle Reaction Probabilities and Application to the Heterogeneous Reaction of Deliquesced Sodium Chloride Particles with Gas-Phase Hydroxyl Radicals. J. Phys. Chem. A 2006, 110, 10619–10627. [Google Scholar] [CrossRef] [PubMed]
- Graham, J.D.; Roberts, J.T.; Anderson, L.D.; Grassian, V.H. The 367 nm PhotoChemistry of OClO Thin Films and OClO Adsorbed on Ice. J. Phys. Chem. 1996, 100, 19551–19558. [Google Scholar] [CrossRef]
- Shen, Y.R.; Ostroverkhov, V. Sum-Frequency Vibrational Spectroscopy on Water Interfaces: Polar Orientation of Water Molecules at Interfaces. Chem. Rev. 2006, 106, 1140–1154. [Google Scholar] [CrossRef] [PubMed]
- Allen, H.C.; Casillas-Ituarte, N.N.; Sierra-Hernandez, M.R.; Chen, X.; Tang, C.Y. Shedding light on water structure at air-aqueous interfaces: Ions, lipids, and hydration. Phys. Chem. Chem. Phys. 2009, 11, 5538–5549. [Google Scholar] [CrossRef] [PubMed]
- Jubb, A.; Hua, W.; Allen, H. Environmental Chemistry at Vapor/Water Interfaces: Insights from Vibrational Sum Frequency Generation Spectroscopy. Annu. Rev. Phys. Chem. 2012, 63, 107–130. [Google Scholar] [CrossRef] [PubMed]
- Jungwirth, P.; Winter, B. Ions at Aqueous Interfaces: From Water Surface to Hydrated Proteins. Annu. Rev. Phys. Chem. 2008, 59, 343–366. [Google Scholar] [CrossRef] [PubMed]
- Nihonyanagi, S.; Kusaka, R.; Inoue, K.; Adhikari, A.; Yamaguchi, S.; Tahara, T. Accurate Determination of Complex χ(2) Spectrum of the Air/Water Interface. J. Chem. Phys. 2015, 143, 124707. [Google Scholar] [PubMed]
- Zhang, Z.; Piatkowski, L.; Bakker, H.; Bonn, M. Ultrafast Vibrational Energy Transfer at the Water/Air Interface Revealed by Two-Dimensional Surface Vibrational Spectroscopy. Nat. Chem. 2011, 3, 888–893. [Google Scholar] [CrossRef] [PubMed]
- Sun, S.; Liang, R.; Xu, X.; Zhu, H.; Shen, Y.R.; Tian, C. Phase Reference in Phase-Sensitive Sum-Frequency Vibrational Spectroscopy. J. Chem. Phys. 2016, 144, 244711. [Google Scholar] [CrossRef] [PubMed]
- Ishiyama, T.; Imamura, T.; Morita, A. Theoretical Studies of Structures and Vibrational Sum Frequency Generation Spectra at Aqueous Interfaces. Chem. Rev. 2014, 114, 8447–8470. [Google Scholar] [CrossRef] [PubMed]
- Kessler, J.; Elgabarty, H.; Spura, T.; Karhan, K.; Partovi-Azar, P.; Hassanali, A.A.; Kuhne, T.D. Structure and Dynamics of the Instantaneous Water/Vapor Interface Revisited by Path-Integral and Ab Initio Molecular Dynamics Simulations. J. Phys. Chem. B 2015, 119, 10079–10086. [Google Scholar] [CrossRef] [PubMed] [Green Version]
- Willard, A.; Chandler, D. Instantaneous Liquid Interfaces. J. Phys. Chem. B 2010, 114, 1954–1958. [Google Scholar] [CrossRef] [PubMed] [Green Version]
- Du, Q.; Freysz, E.; Shen, Y.R. Vibrational Spectroscopy of Water at the Vapor/Water Interface. Phys. Rev. Lett. 1993, 70, 2313–2316. [Google Scholar] [CrossRef] [PubMed]
- Tian, C.; Shen, Y.R. Recent progress on sum-frequency spectroscopy. Surf. Sci. Rep. 2014, 69, 105. [Google Scholar] [CrossRef]
- Wen, Y.C.; Zha, S.; Liu, X.; Yang, S.; Guo, P.; Shi, G.; Fang, H.; Shen, Y.R.; Tian, C. Unveiling Microscopic Structures of Charged Water Interfaces by Surface-Specific Vibrational Spectroscopy. Phys. Rev. Lett. 2016, 116, 016101. [Google Scholar] [CrossRef] [PubMed] [Green Version]
- Pezzotti, S.; Galimberti, D.R.; Shen, Y.R.; Gaigeot, M.P. Structural definition of the BIL and DL: A new universal methodology to rationalize non-linear chi(2)(omega) SFG signals at charged interfaces, including chi(3)(omega) contributions. Phys. Chem. Chem. Phys. 2018, 20, 5190–5199. [Google Scholar] [CrossRef] [PubMed]
- Pezzotti, S.; Galimberti, D.R.; Gaigeot, M.P. 2D H-Bond Network as the Topmost Skin to the Air-Water Interface. J. Phys. Chem. Lett. 2017, 8, 3133–3141. [Google Scholar] [CrossRef] [PubMed]
- Ostroverkhov, V.; Waychunas, G.A.; Shen, Y.R. New Information on Water Interfacial Structure Revealed by Phase-Sensitive Surface Spectroscopy. Phys. Rev. Lett. 2005, 94, 046102. [Google Scholar] [CrossRef] [PubMed]
- Zhang, L.; Tian, C.; Waychunas, G.A.; Shen, Y.R. J. Am. Chem. Soc. 2008, 130, 7686. [CrossRef] [PubMed]
- Yamaguchi, S. Development of Single-channel Heterodyne-detected Sum Frequency Generation Spectroscopy and its Application to the Water/Vapor Interface. J. Chem. Phys. 2015, 143, 034202. [Google Scholar] [CrossRef] [PubMed]
- Pezzotti, S.; Serva, A.; Gaigeot, M.P. 2D-HB-Network at the air-water interface: A structural and dynamical characterization by means of ab-initio and classical molecular dynamics simulations. J. Chem. Phys. 2018, 148, 174701–174710. [Google Scholar] [CrossRef] [PubMed]
- Serva, A.; Pezzotti, S.; Bougueroua, S.; Galimberti, D.R.; Gaigeot, M.P. Combining ab-initio and classical molecular dynamics simulations to unravel the structure of the 2D-HB-network at the air-water interface. J. Mol. Struct. 2018, 1165, 71–78. [Google Scholar] [CrossRef]
- Gonella, G.; Lutgebaucks, C.; de Beer, A.G.F.; Roke, S. Second Harmonic and Sum-Frequency Generation from Aqueous Interfaces Is Modulated by Interference. J. Phys. Chem. C. 2016, 120, 9165–9173. [Google Scholar] [CrossRef]
- Ohno, P.E.; Saslow, S.A.; Wang, H.F.; Geiger, F.M.; Eisenthal, K.B. Phase-referenced nonlinear Spectroscopy of the alpha-quartz/water Interface. Nat. Comm. 2016, 7, 13587–13591. [Google Scholar] [CrossRef] [PubMed]
- Joutsuka, T.; Hirano, T.; Sprik, M.; Morita, A. Effects of third-order susceptibility in sum frequency generation spectra: A molecular dynamics study in liquid water. Phys. Chem. Chem. Phys. 2018, 20, 3040–3053. [Google Scholar] [CrossRef] [PubMed]
- Pezzotti, S.; Galimberti, D.R.; Shen, Y.R.; Gaigeot, M.P. What the Diffuse Layer (DL) Reveals in Non-Linear SFG Spectroscopy. Minerals 2018, 8, 305. [Google Scholar] [CrossRef]
- Tian, C.; Ji, N.; Waychunas, G.A.; Shen, Y.R. Interfacial Structures of Acidic and Basic Aqueous Solutions. J. Am. Chem. Soc. 2008, 130, 13033–13039. [Google Scholar] [CrossRef] [PubMed] [Green Version]
- Hua, W.; Verreault, D.; Allen, H.C. Relative Order of Sulfuric Acid, Bisulfate, Hydronium, and Cations at the Air013Water Interface. J. Am. Chem. Soc. 2015, 137, 13920–13926. [Google Scholar] [CrossRef] [PubMed]
- Tarbuck, T.L.; Ota, S.T.; Richmond, G.L. Spectroscopic Studies of Solvated Hydrogen and Hydroxide Ions at Aqueous Surfaces. J. Am. Chem. Soc. 2006, 128, 14519–14527. [Google Scholar] [CrossRef] [PubMed]
- Petersen, P.B.; Saykally, R.J. Evidence for an Enhanced Hydronium Concentration at the Liquid Water Surface. J. Phys. Chem. B 2005, 109, 7976–7980. [Google Scholar] [CrossRef] [PubMed]
- Petersen, P.B.; Saykally, R.J. Is the liquid water surface basic or acidic? Macroscopic vs. molecular-scale investigations. Chem. Phys. Lett. 2008, 458, 255–261. [Google Scholar] [CrossRef]
- Buch, V.; Milet, A.; Vácha, R.; Jungwirth, P.; Devlin, J.P. Water surface is acidic. Proc. Nat. Acad. Sci. USA 2007, 104, 7342–7347. [Google Scholar] [CrossRef] [PubMed] [Green Version]
- Giberti, F.; Hassanali, A.A. The excess proton at the air-water interface: The role of instantaneous liquid interfaces. J. Chem. Phys. 2017, 146, 244703. [Google Scholar] [CrossRef] [PubMed] [Green Version]
- Baer, M.D.; Kuo, I.F.W.; Tobias, D.J.; Mundy, C.J. Toward a Unified Picture of the Water Self-Ions at the Air-Water Interface: A Density Functional Theory Perspective. J. Phys. Chem. B 2014, 118, 8364–8372. [Google Scholar] [CrossRef] [PubMed]
- Wu, Y.; Chen, H.; Wang, F.; Paesani, F.; Voth, G.A. An Improved Multistate Empirical Valence Bond Model for Aqueous Proton Solvation and Transport. J. Phys. Chem. B 2008, 112, 467–482. [Google Scholar] [CrossRef] [PubMed]
- Takahashi, H.; Maruyama, K.; Karino, Y.; Morita, A.; Nakano, M.; Jungwirth, P.; Matubayasi, N. Energetic Origin of Proton Affinity to the Air/Water Interface. J. Phys. Chem. B 2011, 115, 4745–4751. [Google Scholar] [CrossRef] [PubMed]
- Tse, Y.L.S.; Chen, C.; Lindberg, G.E.; Kumar, R.; Voth, G.A. Propensity of Hydrated Excess Protons and Hydroxide Anions for the Air-Water Interface. J. Am. Chem. Soc. 2015, 137, 12610–12616. [Google Scholar] [CrossRef] [PubMed]
- Wick, C.D. Hydronium Behavior at the Air-Water Interface with a Polarizable Multistate Empirical Valence Bond Model. J. Phys. Chem. C 2012, 116, 4026–4038. [Google Scholar] [CrossRef]
- Kumar, R.; Knight, C.; Voth, G.A. Exploring the behaviour of the hydrated excess proton at hydrophobic interfaces. Faraday Discuss. 2013, 167, 263–278. [Google Scholar] [CrossRef] [PubMed]
- Hutter, J.; Iannuzzi, M.; Schiffmann, F.; VandeVondele, J. CP2K: Atomistic Simulations of Condensed Matter Systems. WIREs Comput. Mol. Sci. 2014, 4, 15–25. [Google Scholar] [CrossRef] [Green Version]
- VandeVondele, J.; Krack, M.; Mohamed, F.; Parrinello, M.; Chassaing, T.; Hutter, J. Quickstep: Fast and Accurate Density Functional Calculations Using a Mixed Gaussian and Plane Waves Approach. Comp. Phys. Commun. 2005, 167, 103–128. [Google Scholar] [CrossRef] [Green Version]
- Becke, A.D. Density-Functional Exchange-Energy Approximation with Correct Asymptotic Behavior. Phys. Rev. A 1988, 38, 3098–3100. [Google Scholar] [CrossRef]
- Lee, C.; Yang, W.; Parr, R.G. Development of the Colle-Salvetti Correlation-Energy Formula into a Functional of the Electron Density. Phys. Rev. B 1988, 37, 785–789. [Google Scholar] [CrossRef]
- Goedecker, S.; Teter, M.; Hutter, J. Separable Dual-Space Gaussian Pseudopotentials. Phys. Rev. B 1996, 54, 1703–1710. [Google Scholar] [CrossRef]
- Grimme, S. Accurate Description of Van der Waals Complexes by Density Functional Theory Including Empirical Corrections. J. Comput. Chem. 2004, 25, 1463–1473. [Google Scholar] [CrossRef] [PubMed]
- Grimme, S. Semiempirical GGA-Type Density Functional Constructed with a Long-Range Dispersion Correction. J. Comput. Chem. 2006, 27, 1787–1799. [Google Scholar] [CrossRef] [PubMed]
- White, J.A.; Schwegler, E.; Galli, G.; Gygi, F. The Solvation of Na+ in Water: First-Principles Simulations. J. Chem. Phys. 2000, 113, 4668–4673. [Google Scholar] [CrossRef]
- Morita, A.; Hynes, J.T. A Theoretical Analysis of the SFG Spectrum of the Water Surface. II-Time Dependent Approach. J. Phys. Chem. B 2002, 106, 673–685. [Google Scholar] [CrossRef]
- Morita, A.; Ishiyama, T. Recent Progress in Theoretical Analysis of Vibrational Sum Frequency Generation Spectroscopy. Phys. Chem. Chem. Phys. 2008, 10, 5801–5816. [Google Scholar] [CrossRef] [PubMed]
- Khatib, R.; Backus, E.H.G.; Bonn, M.; Perez-Haro, M.J.; Gaigeot, M.P.; Sulpizi, M. Water Orientation and Hydrogen-Bond Structure at the Fluorite/Water Interface. Sci. Rep. 2016, 6, 24287. [Google Scholar] [CrossRef] [PubMed]
- Corcelli, S.A.; Skinner, J.L. Infrared and Raman Line Shapes of Dilute HOD in Liquid H2O and D2O from 10 to 90 C. J. Phys. Chem. A 2005, 109, 6154–6165. [Google Scholar] [CrossRef] [PubMed]
- Urashima, S.H.; Myalitsin, A.; Nihonyanagi, S.; Tahara, T. The Topmost Water Structure at a Charged Silica/Aqueous Interface Revealed by Heterodyne-Detected Vibrational Sum Frequency Generation Spectroscopy. J. Phys. Chem. Lett. 2018, 9, 4109–4114. [Google Scholar] [CrossRef] [PubMed]
- Weissenborn, P.K.; Pugh, R.J. Surface Tension of Aqueous Solutions of Electrolytes: Relationship with Ion Hydration, Oxygen Solubility, and Bubble Coalescence. J. Colloid Interface Sci. 1996, 184, 550–563. [Google Scholar] [CrossRef] [PubMed]
- Hassanali, A.; Giberti, F.; Cuny, J.; Kühne, T.D.; Parrinello, M. Proton transfer through the water gossamer. Proc. Natl. Acad. Sci. USA 2013, 110, 13723–13728. [Google Scholar] [CrossRef] [PubMed] [Green Version]
- Zhang, C.; Knyazev, D.G.; Vereshaga, Y.A.; Ippoliti, E.; Nguyen, T.; Carloni, P.; Pohl, P. Water at hydrophobic interfaces delays proton surface-to-bulk transfer and provides a pathway for lateral proton diffusion. Proc. Natl. Acad. Sci. USA 2012, 109, 9744–9749. [Google Scholar] [CrossRef] [PubMed] [Green Version]
- Yang, H.; Li, Z.; Si, W.; Lin, K.; Ma, J.; Li, K.; Sun, L.; Sha, J.; Chen, Y. Identification of Single Nucleotides by a Tiny Charged Solid-State Nanopore. J. Phys. Chem. B 2018, 122, 7929–7935. [Google Scholar] [CrossRef] [PubMed]
Figure 1.
(A) Time averaged water density profiles () normalized with respect to bulk water density (), as a function of the distance (r) from the instantaneous water surface. The r = 0 value corresponds to the instantaneous surface, r is positive when going into the liquid phase, and negative into the vapour phase. The density profile is obtained by averaging over the four simulations of the air-water interface including one hydronium at the interface (black solid line), it is compared to the one obtained at the neat air-water interface, taken from ref. [22]. The L0–L3 water layers are shown, as well as the boundaries of the 2DN. The density profile of the hydronium is also reported and enhanced by a factor of five to better appreciate its average position between L0 ald L1 layers, just above the 2DN. (B) Snapshot of the simulation box of the acidic air-water interface, highlighting the instantaneous interface in blue-shade (top & bottom), the water in the BIL (Binding Interfacial Layer) in blue, the water in the DL (Diffuse Layer) in green, and the water in centrosymmetric bulk in red. Waters are represented by one sphere in a coarse-grain manner.

Figure 2.
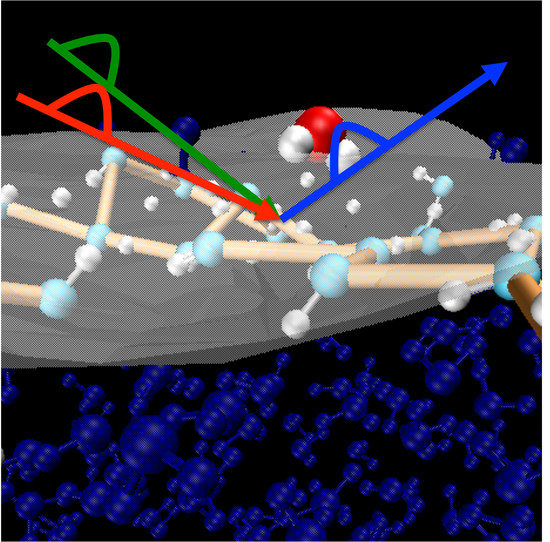
(A) Snapshot from DFT-MD highlighting the most probable position observed for HO surfing above the 2DN (2D-HBond-Network at the interface with the air). HO is depicted with red oxygen, water molecules in the 2DN with cyan oxygens. The instantaneous surface is also shown in gray-shade and the HBs forming the 2DN are highlighted in orange. (B) Snaphshot from DFT-MD simulations (top view) highlighting the most probable interfacial configuration of the hydronium, donating three HBs to three water molecules belonging to the 2DN and simultaneously pointing the O-atom towards the vacuum.
Figure 2.
(A) Snapshot from DFT-MD highlighting the most probable position observed for HO surfing above the 2DN (2D-HBond-Network at the interface with the air). HO is depicted with red oxygen, water molecules in the 2DN with cyan oxygens. The instantaneous surface is also shown in gray-shade and the HBs forming the 2DN are highlighted in orange. (B) Snaphshot from DFT-MD simulations (top view) highlighting the most probable interfacial configuration of the hydronium, donating three HBs to three water molecules belonging to the 2DN and simultaneously pointing the O-atom towards the vacuum.

Figure 3.
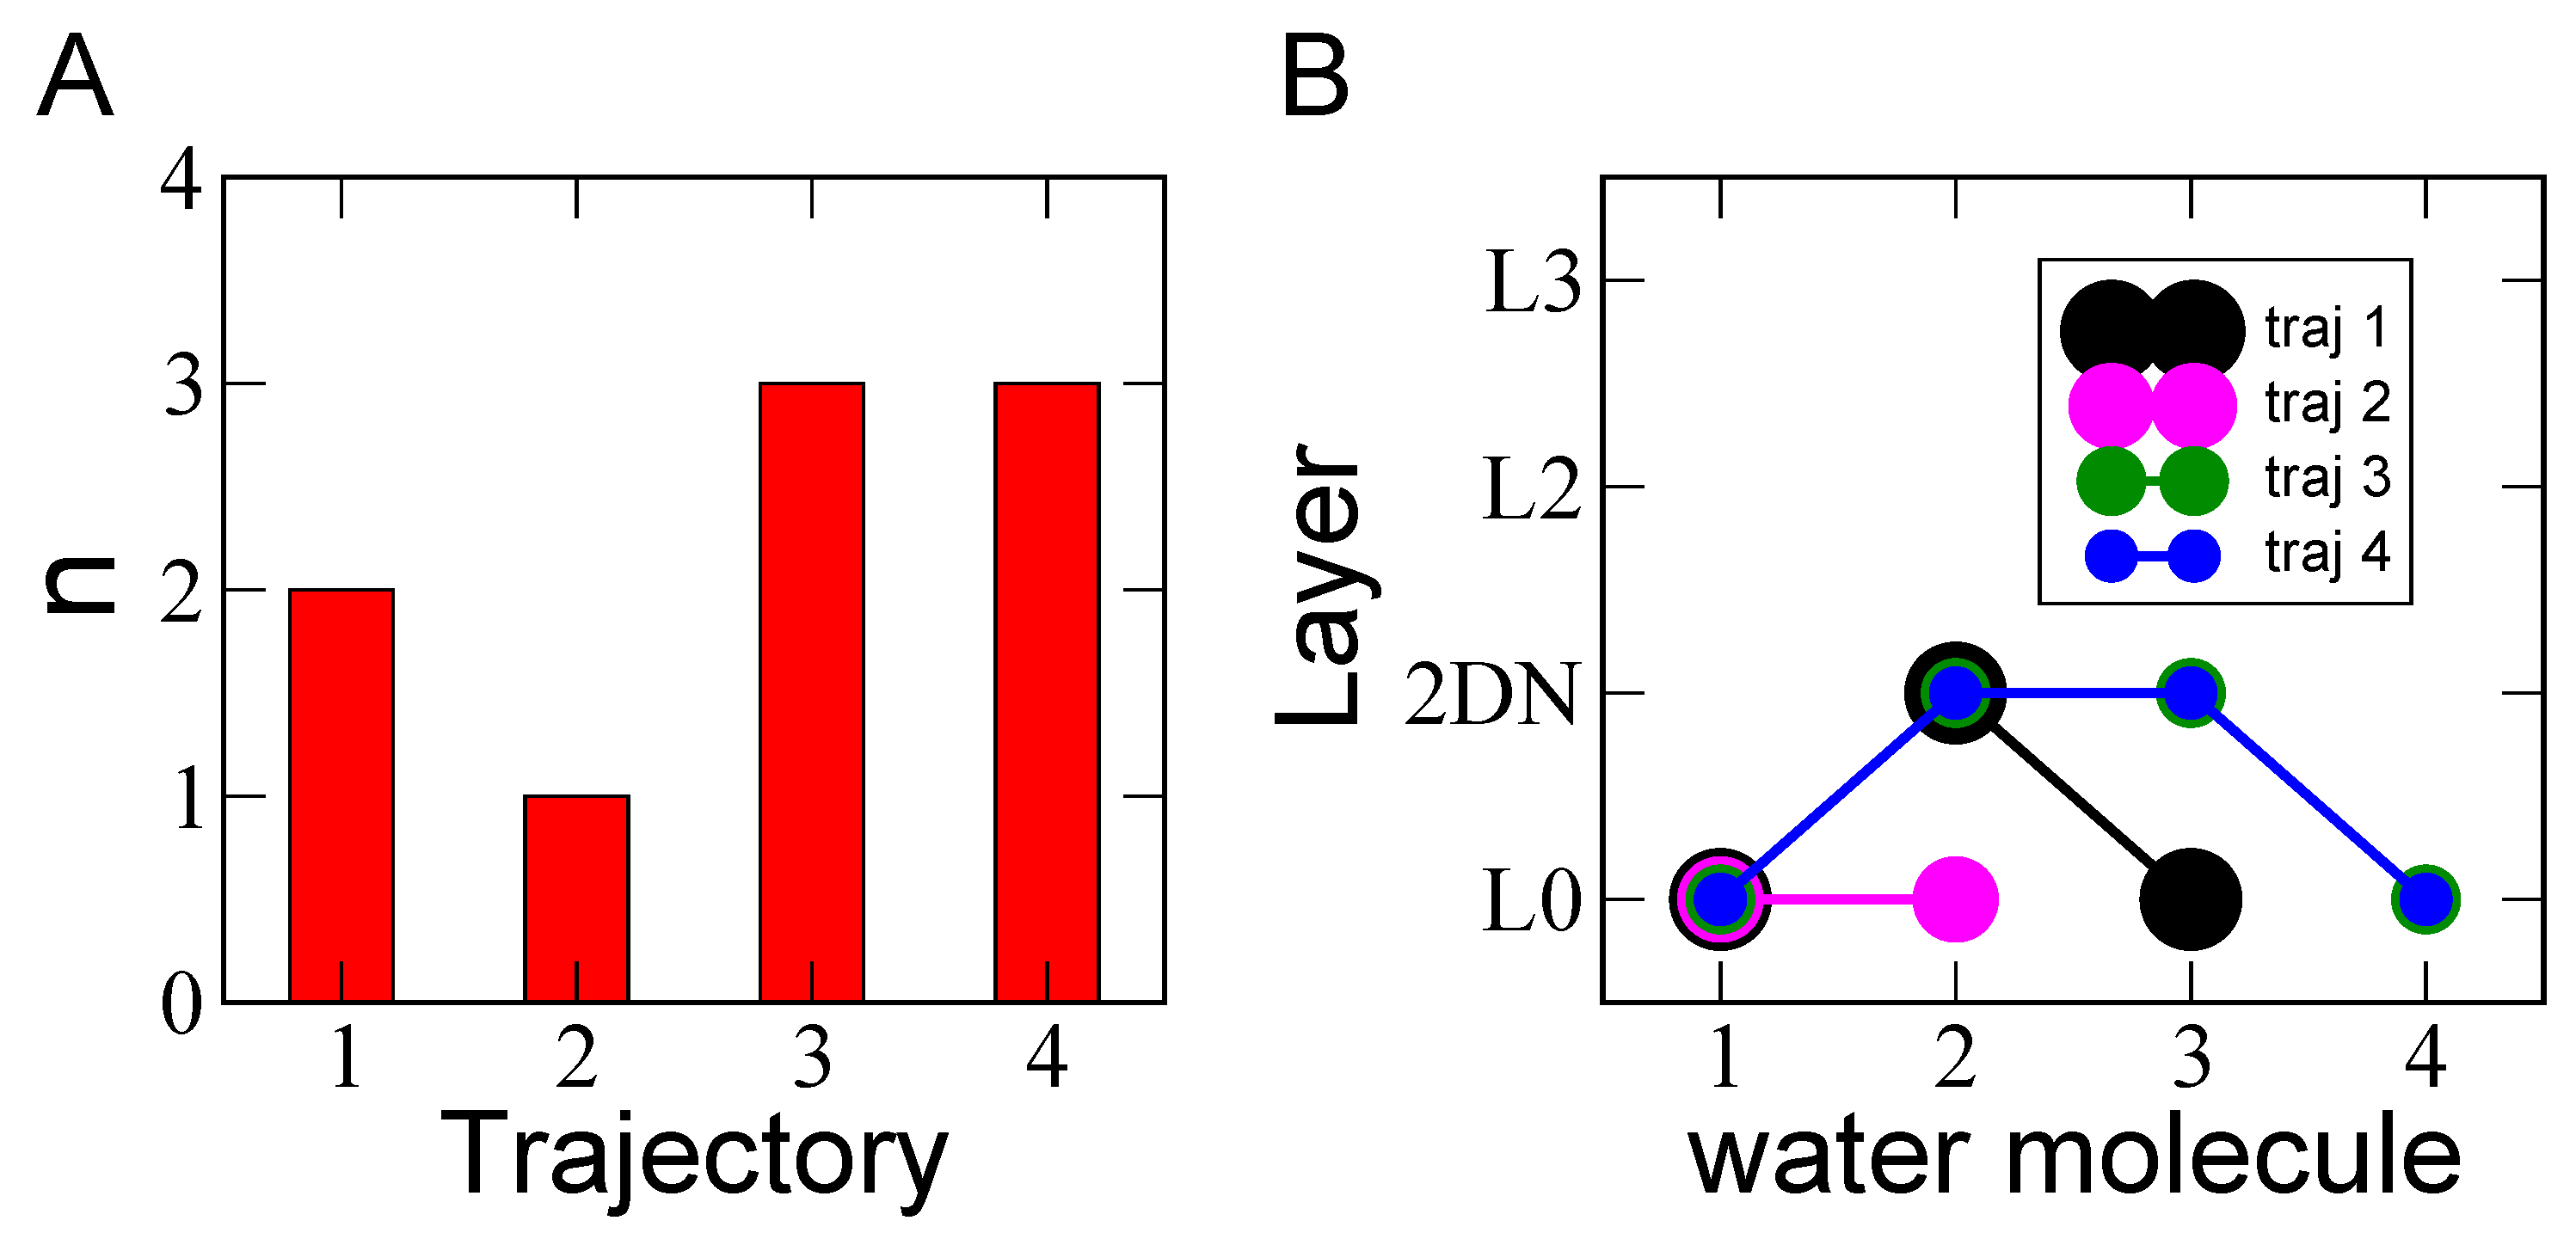
(A) Number of proton hopping events (n) observed for each of the four DFT-MD 25 ps trajectories. (B) for each trajectory, the proton hopping mechanism is illustrated by reporting the layer (L0–L3) to which each water molecule involved in the hopping belongs to. The label 1–4 on the x-axis refers to the sequence of jumps.
Figure 3.
(A) Number of proton hopping events (n) observed for each of the four DFT-MD 25 ps trajectories. (B) for each trajectory, the proton hopping mechanism is illustrated by reporting the layer (L0–L3) to which each water molecule involved in the hopping belongs to. The label 1–4 on the x-axis refers to the sequence of jumps.

Figure 4.
(A) 3D-plots of the H-bond patterns formed between the water molecules in each (L0–L3) layer, calculated as an average over the four independent simulations performed in this work. The x-axis represents the O-O distance (Å) between 2 H-Bonded water molecules and the y-axis provides the angle (cosine value) between the O-O vector (from donor to acceptor) and the normal to the surface (oriented from liquid to vapour phase). The colors represent the probability (P) to find one O-H group forming one HB with a given distance and orientation. The probability increases from blue to red. For each layer, the final assignment to BIL/DL/Bulk is also reported in the figure. (B) Comparison between the L1 layer 3D-plots obtained for the acidic (same as in panel A) and neat (from Ref. [26]) AW interfaces.

Figure 5.
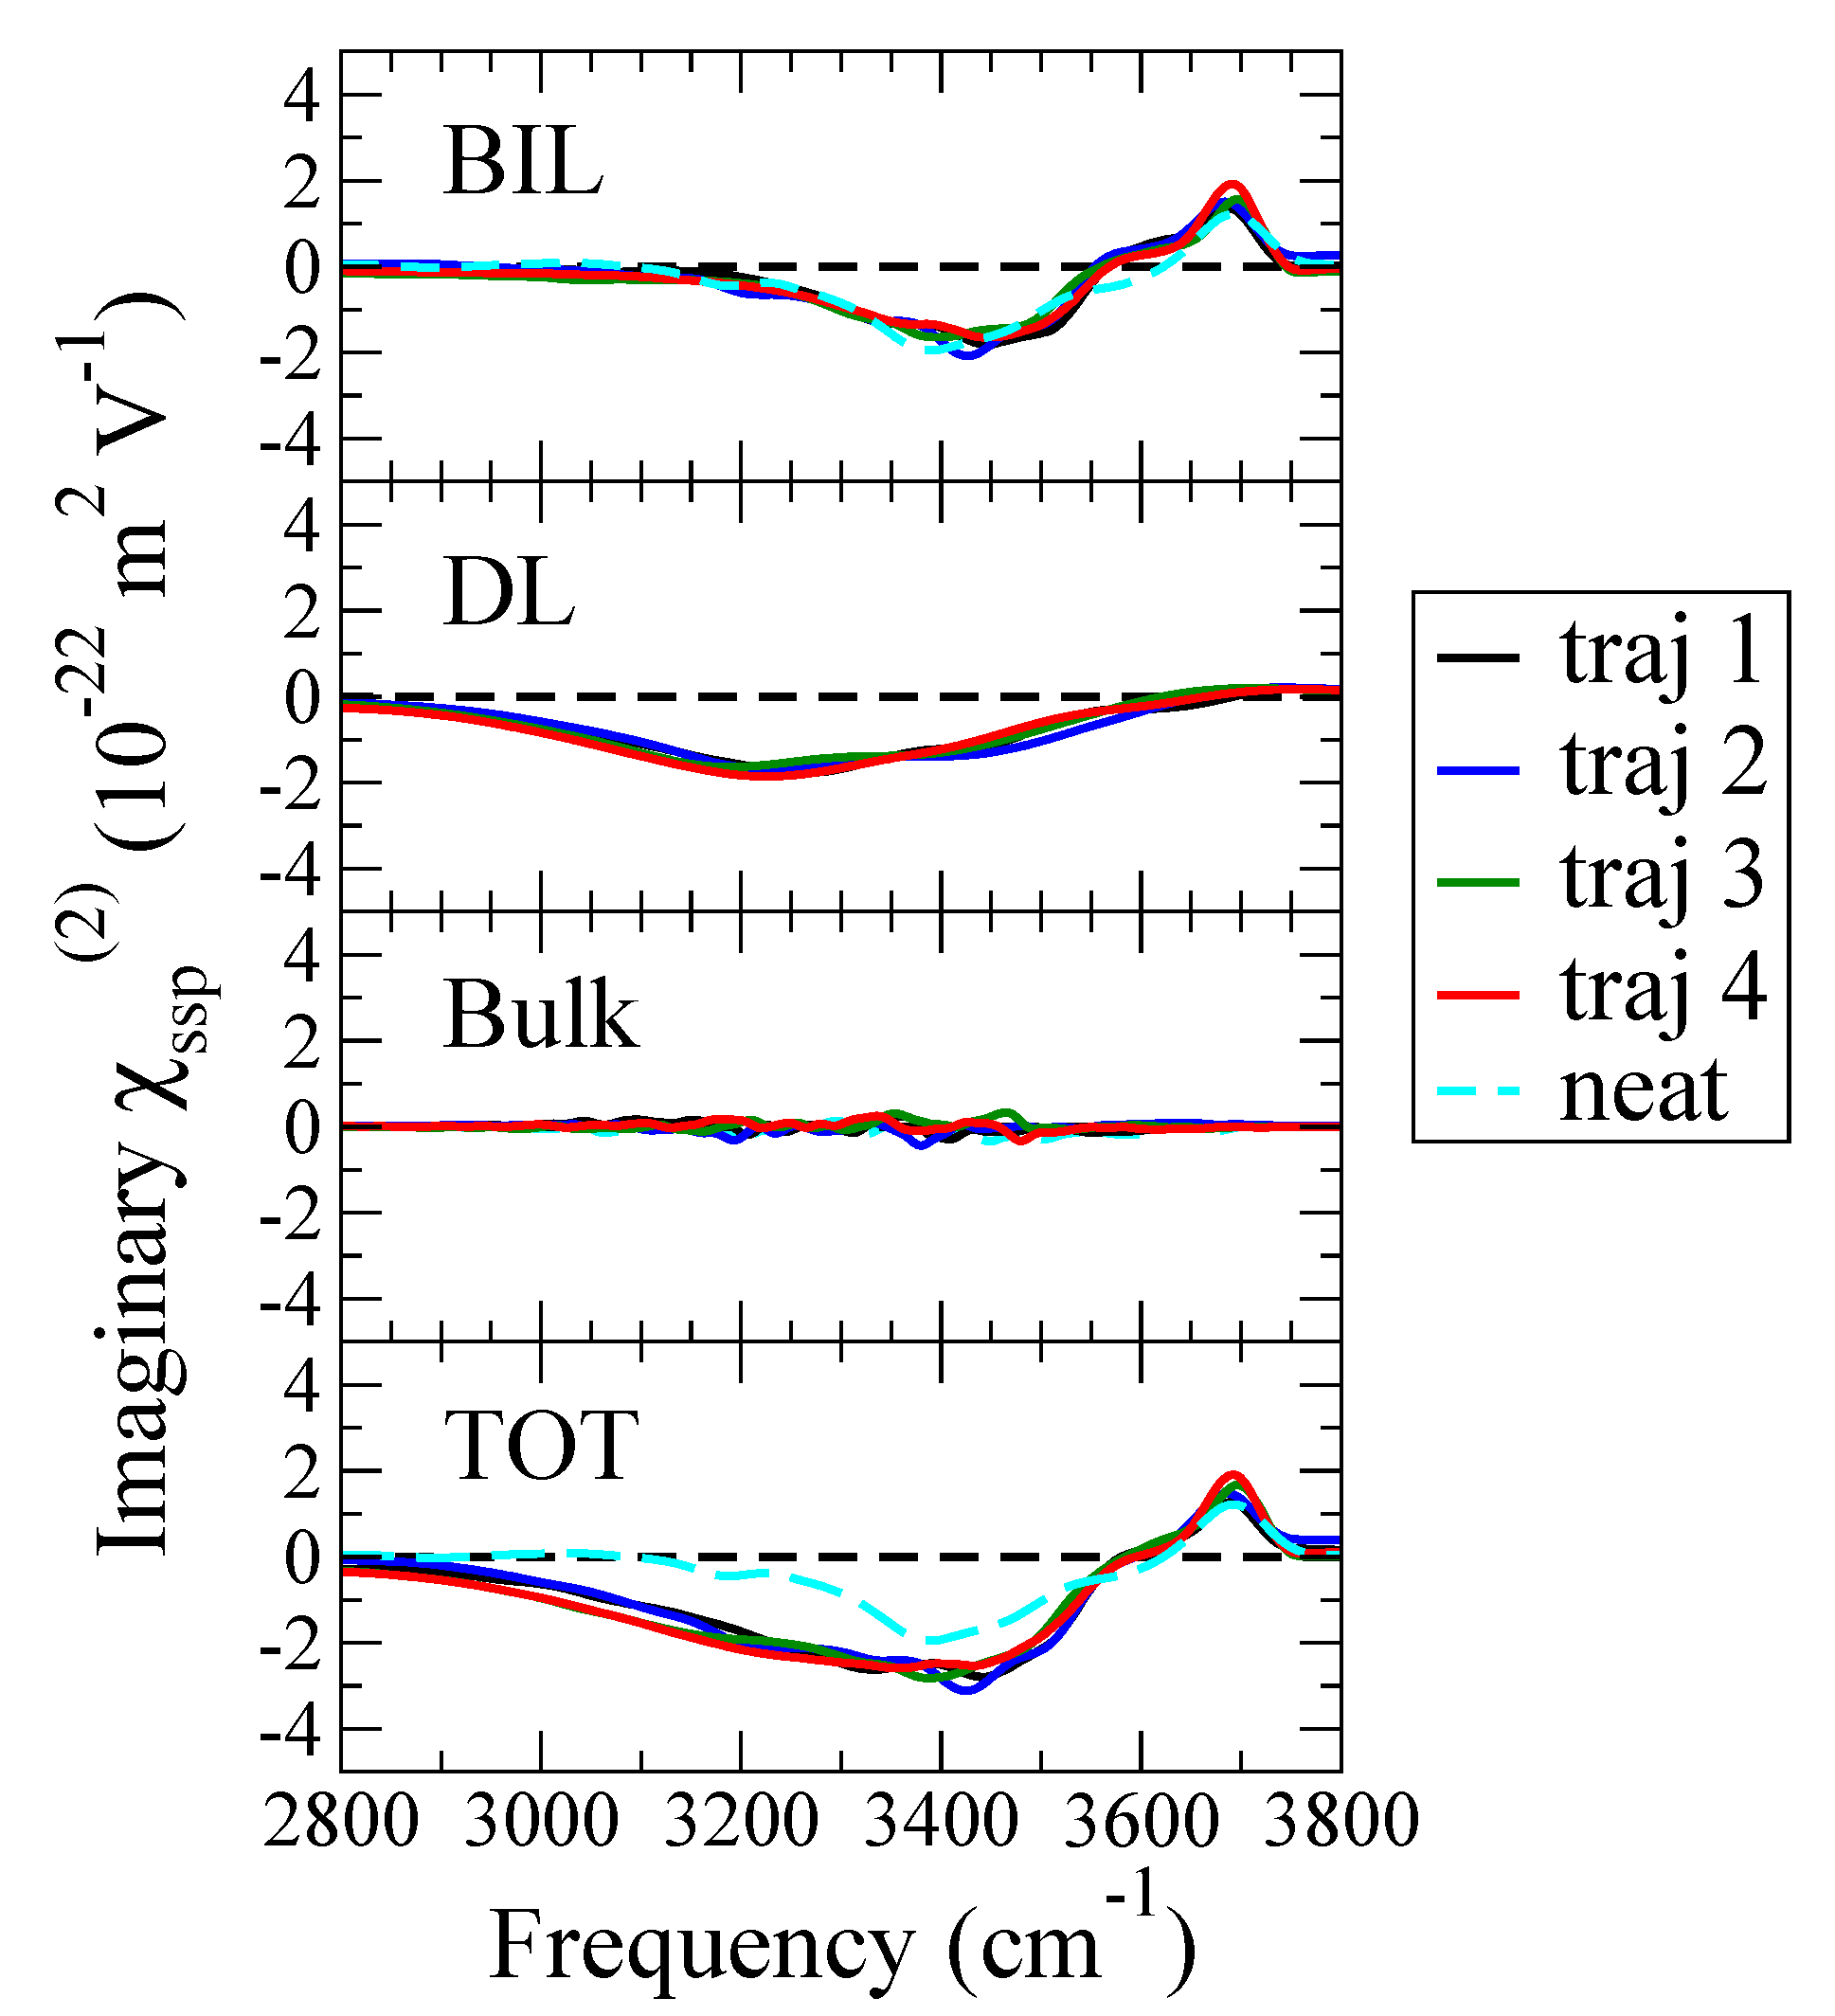
Theoretical phase-resolved SFG. Im spectra calculated from the four DFT-MD simulations, considering only the water molecules in the BIL, only the water molecules in the DL, only the water molecules in the Bulk, and all the water molecules. The total and deconvolved SFG spectra calculated for the neat air-water interface [22] are also reported for comparison (cyan).
Figure 5.
Theoretical phase-resolved SFG. Im spectra calculated from the four DFT-MD simulations, considering only the water molecules in the BIL, only the water molecules in the DL, only the water molecules in the Bulk, and all the water molecules. The total and deconvolved SFG spectra calculated for the neat air-water interface [22] are also reported for comparison (cyan).

Figure 6.
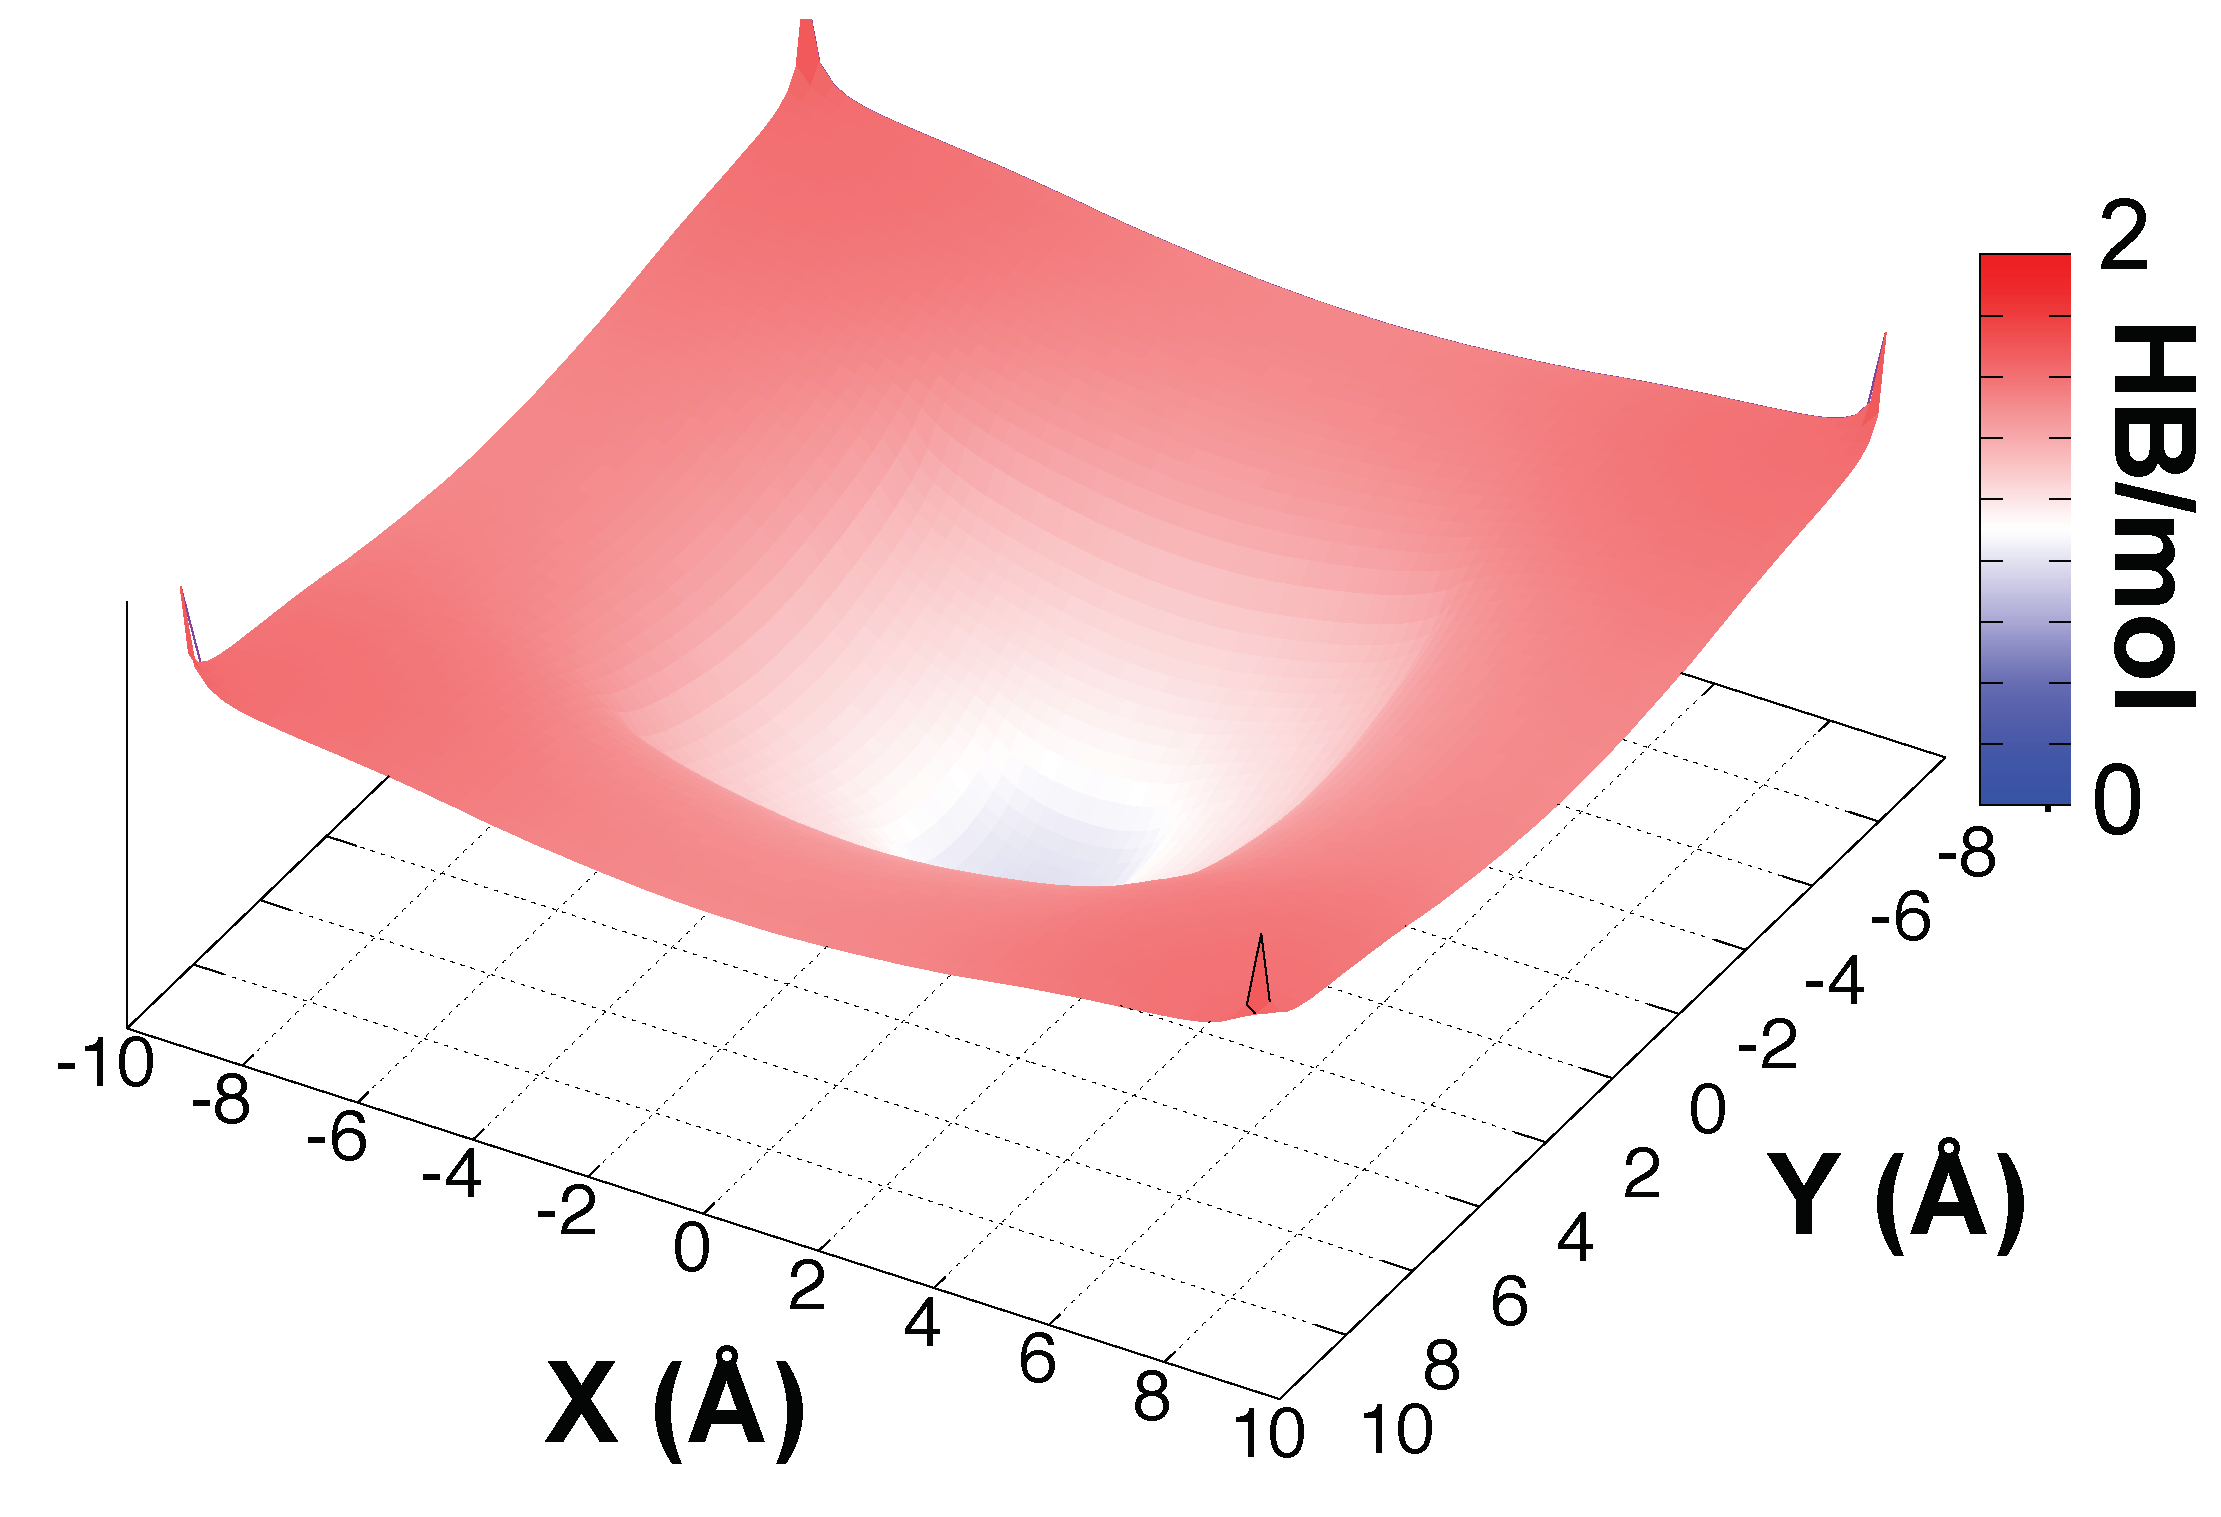
Time-averaged spatial resolution of the number of intra-2DN HBs (between two water molecules both belonging to the 2DN) per water molecule in the 2DN in each (x;y) point of a grid. The xy plane is oriented parallel to the surface and the (0;0) point is the projection of the hydronium position on the xy plane.
Figure 6.
Time-averaged spatial resolution of the number of intra-2DN HBs (between two water molecules both belonging to the 2DN) per water molecule in the 2DN in each (x;y) point of a grid. The xy plane is oriented parallel to the surface and the (0;0) point is the projection of the hydronium position on the xy plane.


Table 1.
Average number of HBs per water molecule as a function of the layer they belong to (L0, L1, L2 and L3, see Figure 1), calculated by averaging over the four independent DFT-MD trajectories of the acidic air-water interface (one hydronium ion located in the BIL) and for the neat air-water interface [26]. The fluctuations in the numbers in between the four trajectories for the acidic interface are negligible. The number of intra-2DN HBs (HBs formed between two water molecules both belonging to the 2DN) per water molecule is also reported for both the acidic and neutral AW interfaces.
| n of HBs/Molecule | |||||
|---|---|---|---|---|---|
| System | L0 | L1 | L2 | L3 | intra-2DN |
| AW-neat | 1.9 | 2.9 | 3.4 | 3.4 | 1.7 |
| AW + HO | 1.9 | 2.9 | 3.4 | 3.4 | 1.6 |
© 2018 by the authors. Licensee MDPI, Basel, Switzerland. This article is an open access article distributed under the terms and conditions of the Creative Commons Attribution (CC BY) license (http://creativecommons.org/licenses/by/4.0/).
Share and Cite
MDPI and ACS Style
Pezzotti, S.; Gaigeot, M.-P. Spectroscopic BIL-SFG Invariance Hides the Chaotropic Effect of Protons at the Air-Water Interface. Atmosphere 2018, 9, 396. https://doi.org/10.3390/atmos9100396
AMA Style
Pezzotti S, Gaigeot M-P. Spectroscopic BIL-SFG Invariance Hides the Chaotropic Effect of Protons at the Air-Water Interface. Atmosphere. 2018; 9(10):396. https://doi.org/10.3390/atmos9100396
Chicago/Turabian StylePezzotti, Simone, and Marie-Pierre Gaigeot. 2018. "Spectroscopic BIL-SFG Invariance Hides the Chaotropic Effect of Protons at the Air-Water Interface" Atmosphere 9, no. 10: 396. https://doi.org/10.3390/atmos9100396
Note that from the first issue of 2016, this journal uses article numbers instead of page numbers. See further details here.