Article

The Impact of Adverse Weather and Climate on the Width of European Beech (Fagus sylvatica L.) Tree Rings in Southeastern Europe

1
Faculty of Agriculture, University of East Sarajevo, East Sarajevo 71123, Bosnia and Herzegovina
2
Institute of Lowland Forestry and Environment, University of Novi Sad, Novi Sad 21101, Serbia
3
Faculty of Agriculture, University of Novi Sad, Novi Sad 21101, Serbia
4
Slovenian Forestry Institute, Vecna pot 2, Ljubljana SI-1000, Slovenia
*
Author to whom correspondence should be addressed.
Atmosphere 2018, 9(11), 451; https://doi.org/10.3390/atmos9110451
Submission received: 24 September 2018 / Revised: 30 October 2018 / Accepted: 2 November 2018 / Published: 15 November 2018

Abstract

:
European beech (Fagus sylvatica L.) is the most important deciduous tree species in Europe. According to different climate scenarios, there is a relatively high probability of a massive decline in and loss of beech forests in southern Europe and in the southern part of central Europe. Thus, the authors of this study explored the dynamics of tree diameter increments and the influence of extremely dry years on the width of tree rings. This study used dendroecological methods to analyze the growth and diameter increments of European beech trees at locations in Serbia and the Republic of Srpska. The sampling was conducted along the vertical distribution of beech forests, at five sites at the lower limit of the distribution, at five optimal sites of the distribution, and at five sites at the upper limit of the distribution. Long-term analyses indicate that dry conditions during a growing season can reduce tree-ring width, but a reduction in tree growth can be expected as a result of more than one season of unfavorable conditions. Low temperatures in autumn and winter and prolonged winters can strongly affect upcoming vegetation and reduce tree development even under normal thermal conditions during a growing season.

1. Introduction

European beech (Fagus sylvatica L.) has a very wide range of distribution, from northern Sweden and Norway [1] over eastern Poland [2] to western Latvia, southern Lithuania and western Russia [3] to south of the Balkan Peninsula, central Italy, and mountainous regions of Sicily and Corsica [2] and to the west to France and southern England and northern Spain [1]. This species occupies the area from 37° to 60° N and from 8° to 35° E. In comparison with others tree species of Europe, this species remains in a relatively natural condition, and thus, current populations of European beech are suitable for studying the adaptation strategies of long-living, deciduous species to climate and changes in climate [4]. Climate change will cause changes in forest structure [5]. A considerable increase in air temperature, in addition to a simultaneous decrease in precipitation during growing seasons (GS) in central and southern Europe, will increase the probability of long and intensive summer droughts, which may severely affect vegetation in natural and managed ecosystems [6]. The current form of forest management in all parts of Europe will not be sustainable in the future [7,8], and forestry experts need to understand the types of forests that will be most suitable under future climatic conditions.
In the next few decades, the maximum lifespan of European beech trees could be shortened at higher elevations in central Europe because of this species faster growth and in the Mediterranean mountains (e.g., Apennines) due to drought-induced mortality [9]. Several studies of European beech forests identify particular sensitivities to summer drought conditions [10,11,12,13,14]. Some studies show that European beech-dominated forests are not severely endangered to negative climate change effects; therefore, their key functions can be maintained [15]. In lowland areas, where European beech is often grown in association with oak (Quercus sp.), each of these species has different ecological requirements. The dominance of the European beech has begun to decline in locations where the mean annual temperature exceeds 11.2 °C and the annual precipitation drops below 510 mm [16]. European beech trees near their distribution limit have already adapted to extreme conditions, and we expect changes in the growth patterns of beech under mesic conditions [17].
The beech forests in Serbia and the Republic of Srpska are not significantly affected by dieback. Its stands are well-preserved with heterogeneous structures [18]. Because different climate scenarios predict increasing temperatures and reduced amounts of precipitation, there is a possibility of future massive dieback and loss of beech forests [19,20,21]. There have not been any massive declines in beech stands in the Republic of Serbia and the Republic of Srpska, but there have been sporadic diebacks of individual beech trees [20]. However, neighboring countries, such as Hungary, have recorded massive diebacks of beech forests [19].
Some of the most important predictions regarding European beech forest under climate change are that the natural habitat of European beech will shift northwards and will reach higher altitudes in the mountains [22]. The dominance of European beech in temperate European deciduous forests will be lessened in some cases because European beech tends to retreat in upland and submontane landscapes where the summer seasons will become drier in the future [23]. Long-term simulations of climate change impacts on forest dynamics in silver fir–European beech stands in Dinaric Mountains in Slovenia [24] revealed that European beech will be favored by higher temperatures in contrast to drought-induced growth reduction in silver fir. Growth simulations performed in Slovakia indicate that the productivity of beech forests in central Europe at altitudes of approximately 500 meters will be reduced by the end of the 21st century [25]. Dieback of beech forests is expected to increase by 5%, and 70% of its stands will have reduced productivity [25]. The productivity of beech stands decreases in warm summer periods and in the periods with a greater number of dry months. Beech continues to grow despite droughts as long as it has sufficient moisture. However, its increment is reduced [26,27]. Growth simulations for European beech show that this kind of forest will change in the future in the Czech Republic [28,29]. Changes in climatic conditions in Europe indicate a moving habitat for this species [30,31], but European beech forests will remain the most important natural forests in temperate Europe during this century [32]
Dieback of beech stands occurs due to increased mean and maximum air temperatures, increased intensity of evapotranspiration, reduced precipitation and higher sunshine duration [33]. Diebacks occur in different biomes and in forests with different climate conditions [34]. The heat wave recorded in 2003 affected central Europe and caused a decrease in the growth and productivity of forests in this part of Europe [35].
To explain the effects of climate on the growth of beech trees, it is necessary to study the relationships between the width of growth rings and climate elements (temperature and precipitation) at a monthly scale [36]. It is assumed that diameter increments reflect physiological processes, while the mean monthly temperature and the average amount of precipitation are significantly related to climatic elements that affect the physiology of trees [37].
Vertical zoning of vegetation provides the basis for the definition of bioclimatic units in dendroclimatic signals [38,39], which provide a quantitative bioclimatic classification of tree populations. If there are other measurement records, then it is possible to investigate the temporal dependence between the climate and tree growth [40] and formulate hypotheses about the possible effects of climate change on the dynamics of plant communities [41,42,43].
Hot and dry summers have negative effects on beech growth, while the conditions for the growth of beech are expected to improve at the upper limit of distribution [44]. Growth of beech trees in southeastern Europe correlates with summer air temperatures and precipitation [45]. The width of growth rings is reduced in dry periods and warm summer months. The effect of high temperatures on the width of growth rings is more noticeable at lower altitudes. Reduced rainfall during the growing season is a limiting factor to the growth of beech forests at lower altitudes [35].
Climate affects the width of growth rings, and the width depends on the altitude and the latitude of investigated sites [38,39]. For example, in southwestern Europe, the air temperature in May and the precipitation in the summer and winter months are the main initiators of tree diameter growth. High increment values are observed in rainy years [35]. A study of the responses of beech forests in southeastern Europe [46] found that in June and July, there was no correlation between the growth of trees and air temperature or between the growth of trees and the amount of precipitation. Notably, the strongest correlations have been found between the width of growth rings and the amount of precipitation in the year that preceded growth ring formation.
In Romania, climate change did not affect these forests, although the increment was reduced in June and September and the amount of precipitation decreased in summer months [35]. The differences in the temperatures between the hottest and the coldest months and between the mean annual precipitation rates were proven to be the most important parameters of the resistance and adaptability of beech forests [47]. The same study noted that precipitation in the winter period will be an important factor of ecological resistance and adaptability of this species to climate change.
Large amounts of rainfall play an important role in the growth of beech, and the lack of precipitation and reduced growth are correlated with drought [39,48,49]. The effects drought can have on tree growth can be either long term or short term. A short term period relates to a period of 1–5 years after a drought, and this period provides information on forest recovery after a drought [50]. A long-term period refers to the period of 10–30 years in which the response of forests to drought is observed by comparing the growth trends of individual trees for several years or decades after a drought, taking into account the cumulative effects of consecutive droughts [51]. The trees growing in the temperate and Mediterranean region are more susceptible to short-term and medium-term droughts, while the trees growing in areas with prevailing continental climates are more sensitive to long-term droughts [52].
Many scientists have addressed the problem of beech forests at their lower distribution limit [3,21,53,54,55] and found that there are negative correlations between the width of growth rings and increased air temperatures during the growing season. This scenario will cause a shift in the range of the distribution of beech towards higher altitudes [35]. There are positive correlations between the width of growth rings and the amounts of precipitation [53,56,57].
At the lower distribution limit of beech stands, the growth of beech is limited by high temperatures and low precipitation during the growing season, as noted by [58,59]. In the stands located at lower altitudes, the width of growth rings had a negative correlation with the increased precipitation in April, while in the stands at higher altitudes, the width of growth rings had a positive correlation with the increased precipitation in the period from July to September [45]. In Romania, at the lower limit of the distribution of beech forests, negative correlations were observed between the air temperatures in June and the availability of water and the width of growth rings of beech trees [60,61]. The availability of water in September of the year preceding the growth increment had a positive effect on growth, probably due to water reserves in the soil.
The aim of this research was to examine the influence of weather and climate on the dynamics of growth ring width of dominant European beech trees (Fagus sylvatica L.) in pure stands (stands in which representation of one species is more than 90%) at different altitude zones (lower limit, optimum and upper limit of the vertical distribution of beech forests) and to estimate the long-term effects of drought in the coming years. The working hypotheses of the study are as follows: (a) long-term temperature and precipitation regime affect tree-ring width (TRW) changes but sensitivity of plant depends on location in respect to upper or lower limits of distribution; (b) meteorological conditions prior to vegetation period can affect TRW development; and (c) effects of adverse weather events can be identified as a significant change in TRW during a growing season.

2. Methods

2.1. Selected Locations

The study of climate impacts on growth and vitality of trees, depending on the horizontal and vertical distribution of beech forests, was conducted at a total of 15 sites, 9 sites in the Republic of Serbia and 6 sites in the Republic of Srpska.
Both countries are located on the Balkan Peninsula, but the northern part of Serbia includes the Pannonian lowland. The selected locations are situated in the mountain areas of the Dinaric Alps, the Balkan Mountains and parts of the Rilo-Rhodope system. Only two locations in northern Serbia (Vojvodina region) are hilly areas in the Pannonian lowland. In addition to their continental position, the mountains have their own climate characteristics caused by rapidly changing altitudes and different temperature, precipitation, and sunshine duration regimes. Additionally, mountains are a barrier for air mass movement and therefore an important climate modifier.
The dominant climate of the selected region is mild temperate/mesothermal climate and continental/microthermal climate strongly affected by polar air masses penetrating southward and weather systems coming from Genoa Gulf and the Mediterranean [62]. A detailed analysis of regional climatology and its changes is presented in Section 2.2.
Sample locations were at the lower limit (LOW) of beech distribution, at the optimum (OPT) location of beech, and at the upper limit (UPP) of beech distribution. Sampling was designed to include sites that were distributed to cover the whole territory, the Republic of Serbia and the Republic of Srpska (Figure 1 and Table 1). For the remainder of the text, we analyzed the area of distribution (LOW, OPT, UPP) regardless of the country of a certain location.

2.2. Sampling and Processing Cores

At individual sites, dominant trees were sampled at approximately equal altitudes and with approximately the same microclimate conditions. The sample included 15 dominant trees at each location. After drying, the samples were glued to wooden slats, brushed, and polished so that the rings were more visible. The samples were scanned at a high resolution by the ATRICS system [63], and then, using the CooRecorder software [64], the widths of the rings were measured. Then, using the program C Dendro [64], chronologies were prepared for export to the PAST-5 ™ program (SCIEM, Austria). Chronologies were crossed and synchronized in PAST-5 ™ dendrochronological software, using visual screening and statistical parameters.
The chronology of beech trees was used to observe and analyze the years with a decrease in diameter increment. Then, we analyzed extremely dry years at all sites and examined the decreased width of tree rings.
Using the climate database e-OBS [65], average monthly temperatures and monthly precipitation amounts for the period 1951–2013 (2015) were calculated for all the analyzed sites. For the long-term climate analysis and selection of dry years, climatological data were divided into four different climatic periods (Clim1: 1951–1980, Clim2: 1961–1990, Clim3: 1971–2000 and Clim4: 1981–2010). The assessment of dry conditions was made in respect to the deviation in the annual temperature and precipitation from the normal. The year in which the annual temperature was above the climatological average and the annual precipitation was below the climatological average was considered as the ‘dry condition’ year. The relationship between climate and radial growth of trees is shown using Pearson’s correlation (bootRes package).
Understanding the causes and consequences of the weather and climate impacts on the development of beech trees should help us develop a more accurate assessment of the future for this important forest species in Serbia and the Republic of Srpska. Therefore, a detailed analysis of regional climate characteristics was conducted, and the observed climate change was expressed through (a) the deviation in temperature and precipitation in respect to reference climatology (Table 2) and (b) the coefficient of variation for temperature and precipitation for all climatological periods (Table 3). In all analysis, 1951–1980 (Clim1) was considered a reference climatology (Table A1, Appendix A).

3. Results

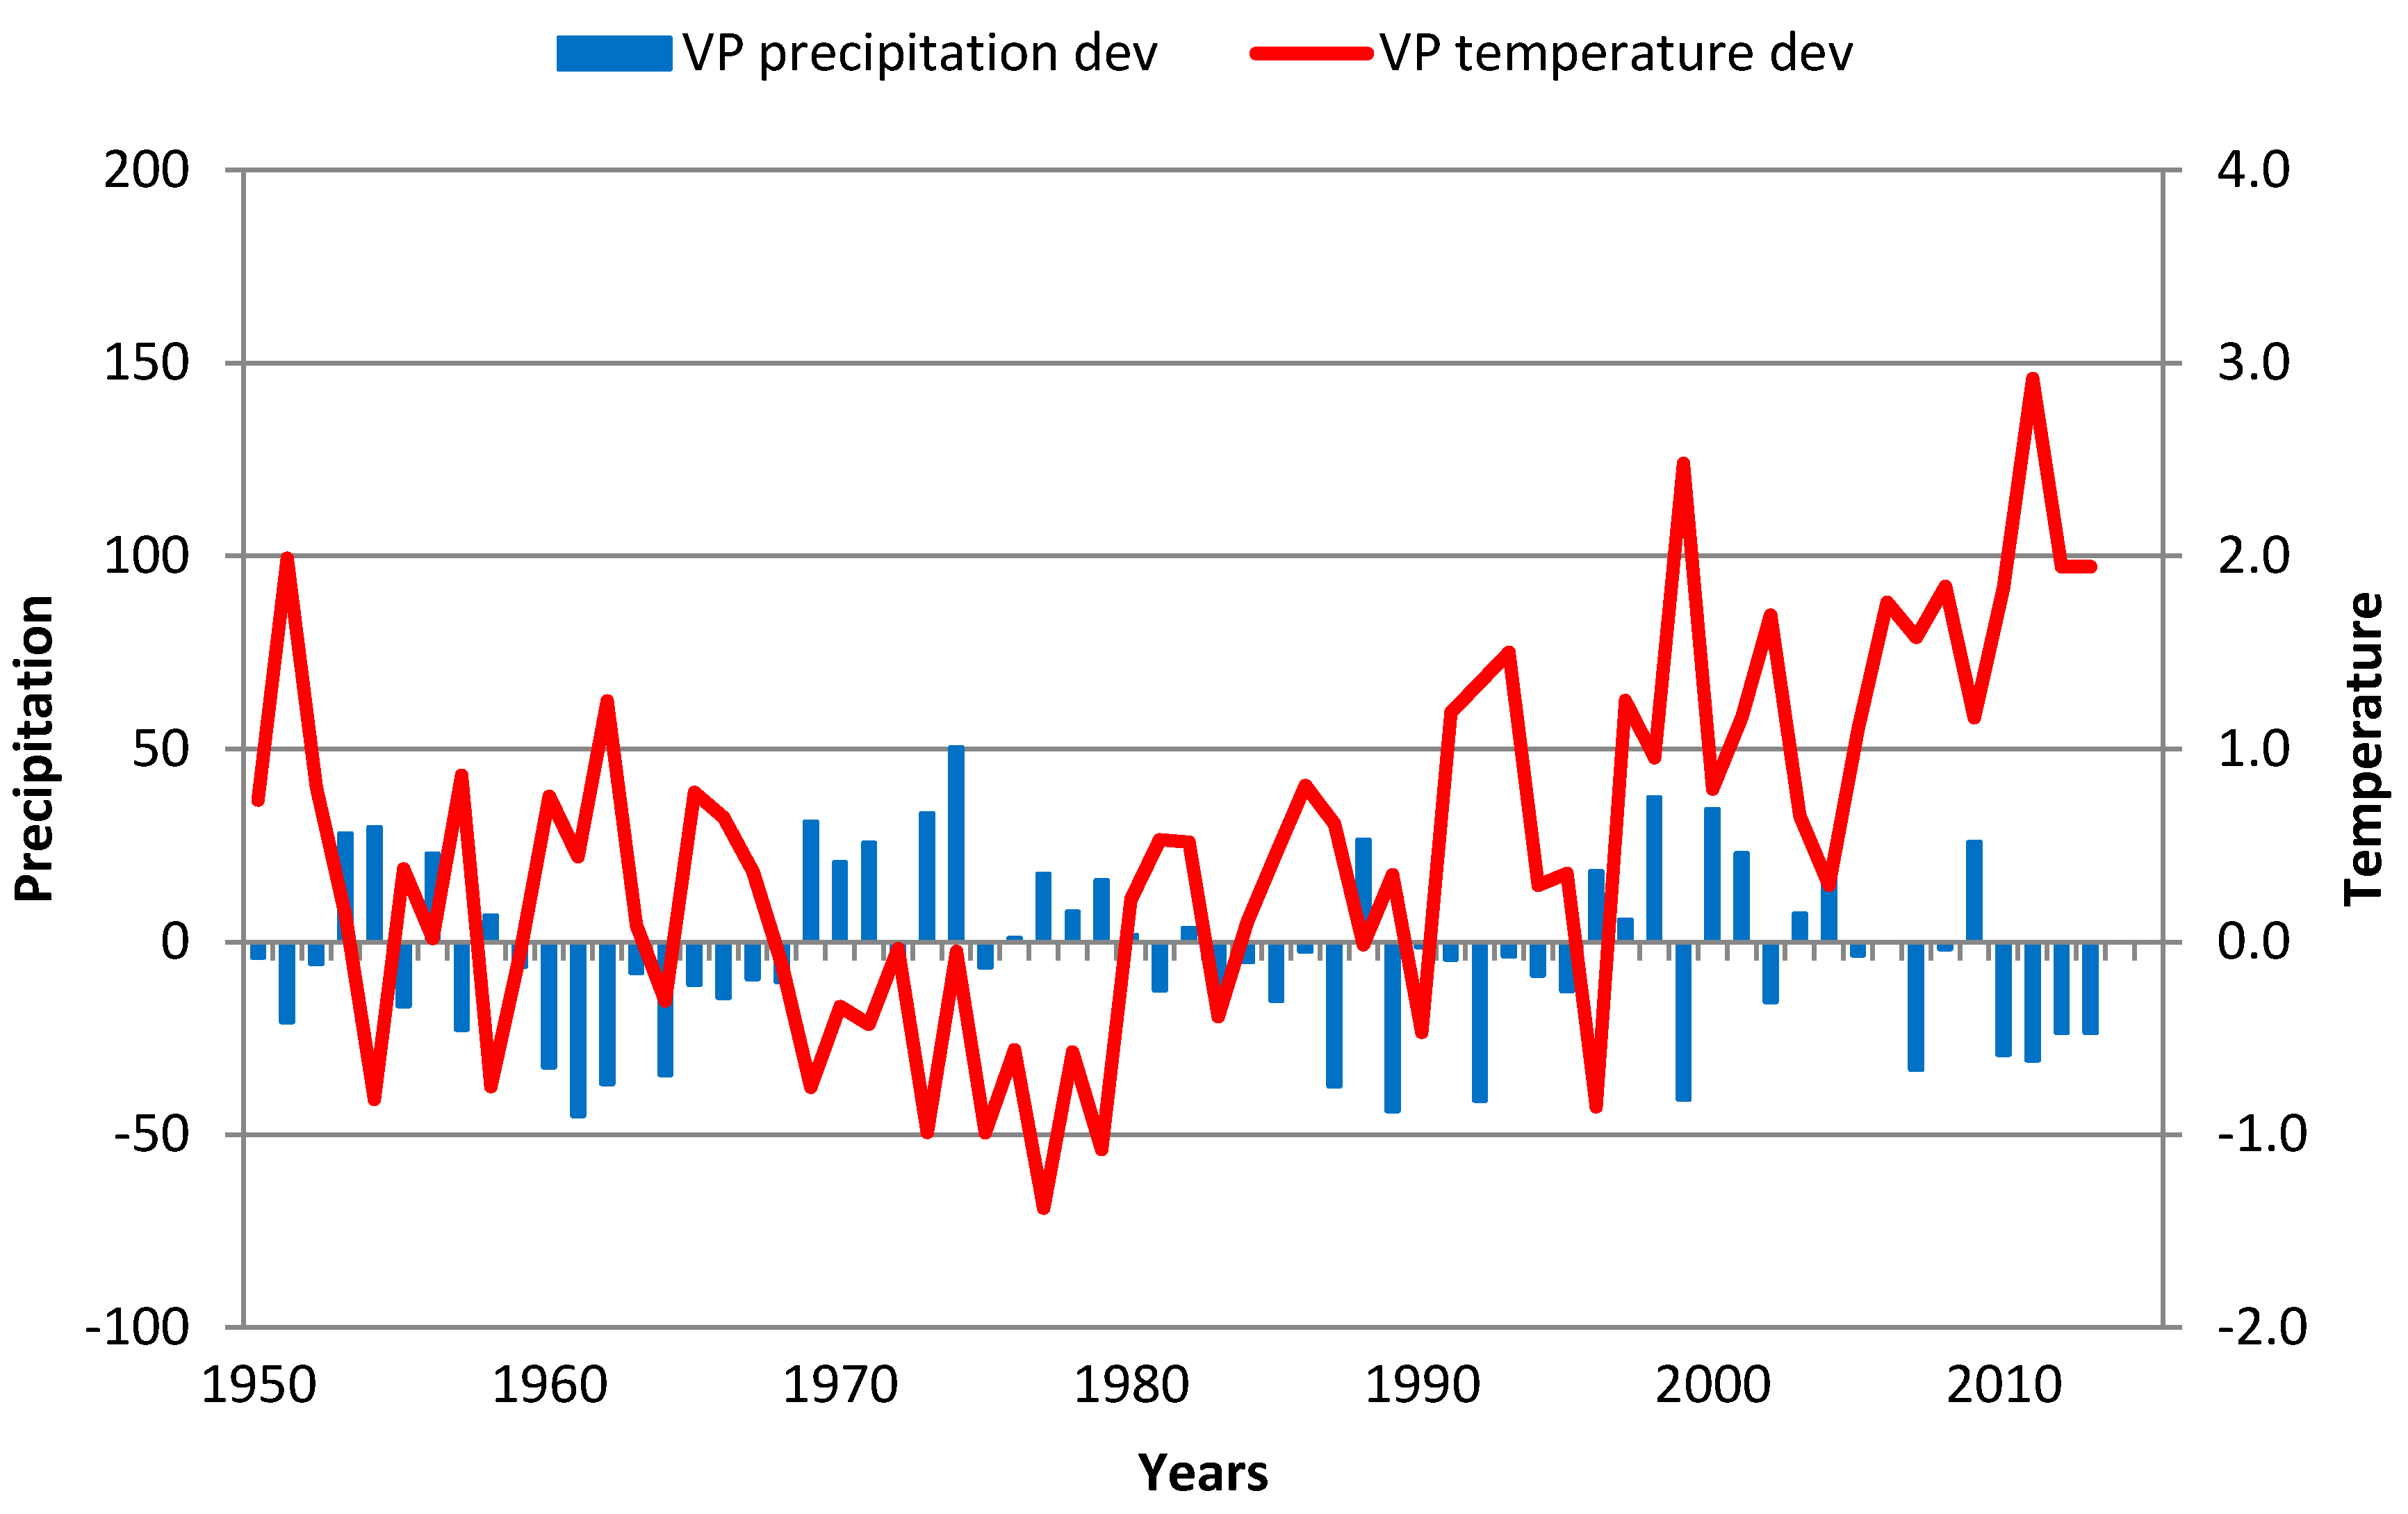
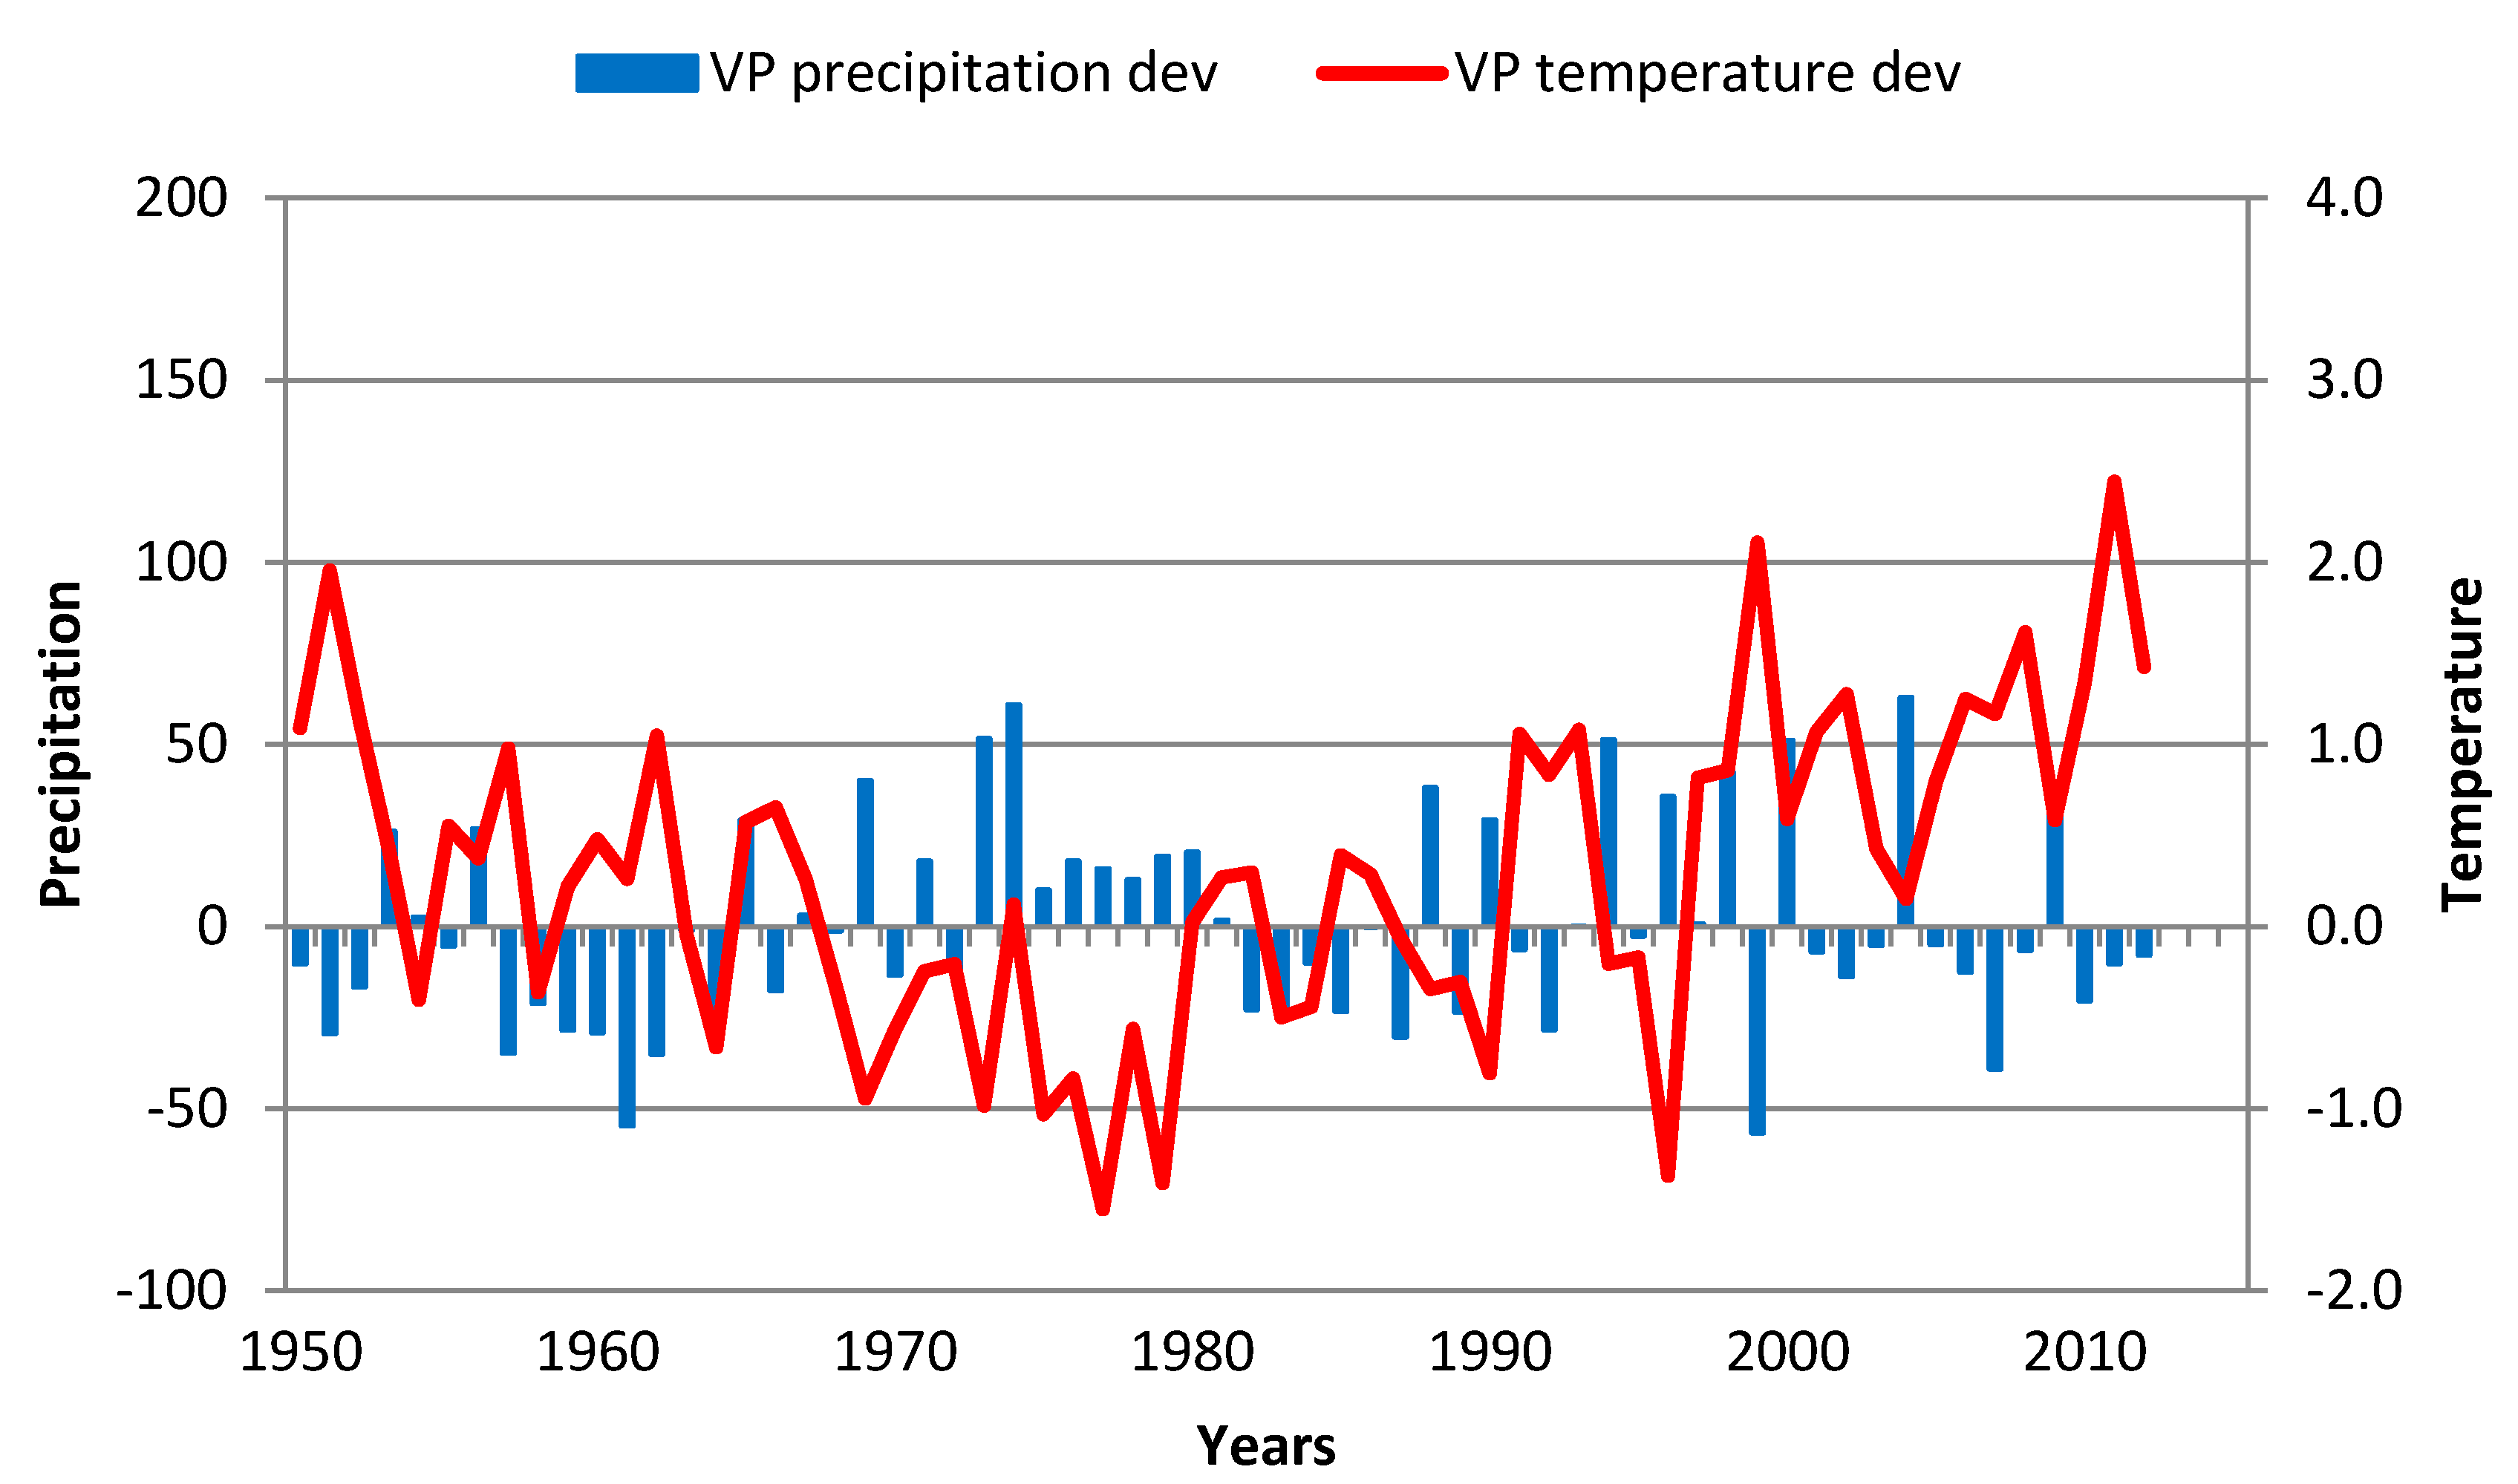
3.1. Observed Climate Change

Deviations in annual and GS normal temperatures indicate a clear and stable increase in temperature for all regions for Clim3 and Clim4. In all climatological periods, the lowest annual temperature deviation was identified in the OPT region, while in LOW and UPP regions, almost the same deviations in temperature were identified in comparison to reference climatology. However, the changes in annual and GS precipitation were not as straight forward. Importantly, for all examined climatological periods and regions, deviations were in a range between −8% and 9%. In each region, we identified (two) locations with a decreasing trend in precipitation, and the remaining areas had clear increases in precipitation over the time.
The differences between the forests with decreasing and increasing trends in precipitation were greater from the LOW to UPP region, indicating increasing variability in growing conditions.
Temperature variation for all climatological periods and locations was between 4% and 10%. Slightly higher values were noted in the UPP region in comparison to the LOW region and over the course of a year in comparison to that for the GS. Precipitation variation was much greater, ranging from 12% to 29%. Much more pronounced precipitation in the GS was at slightly higher values in the LOW region than in the UPP region.

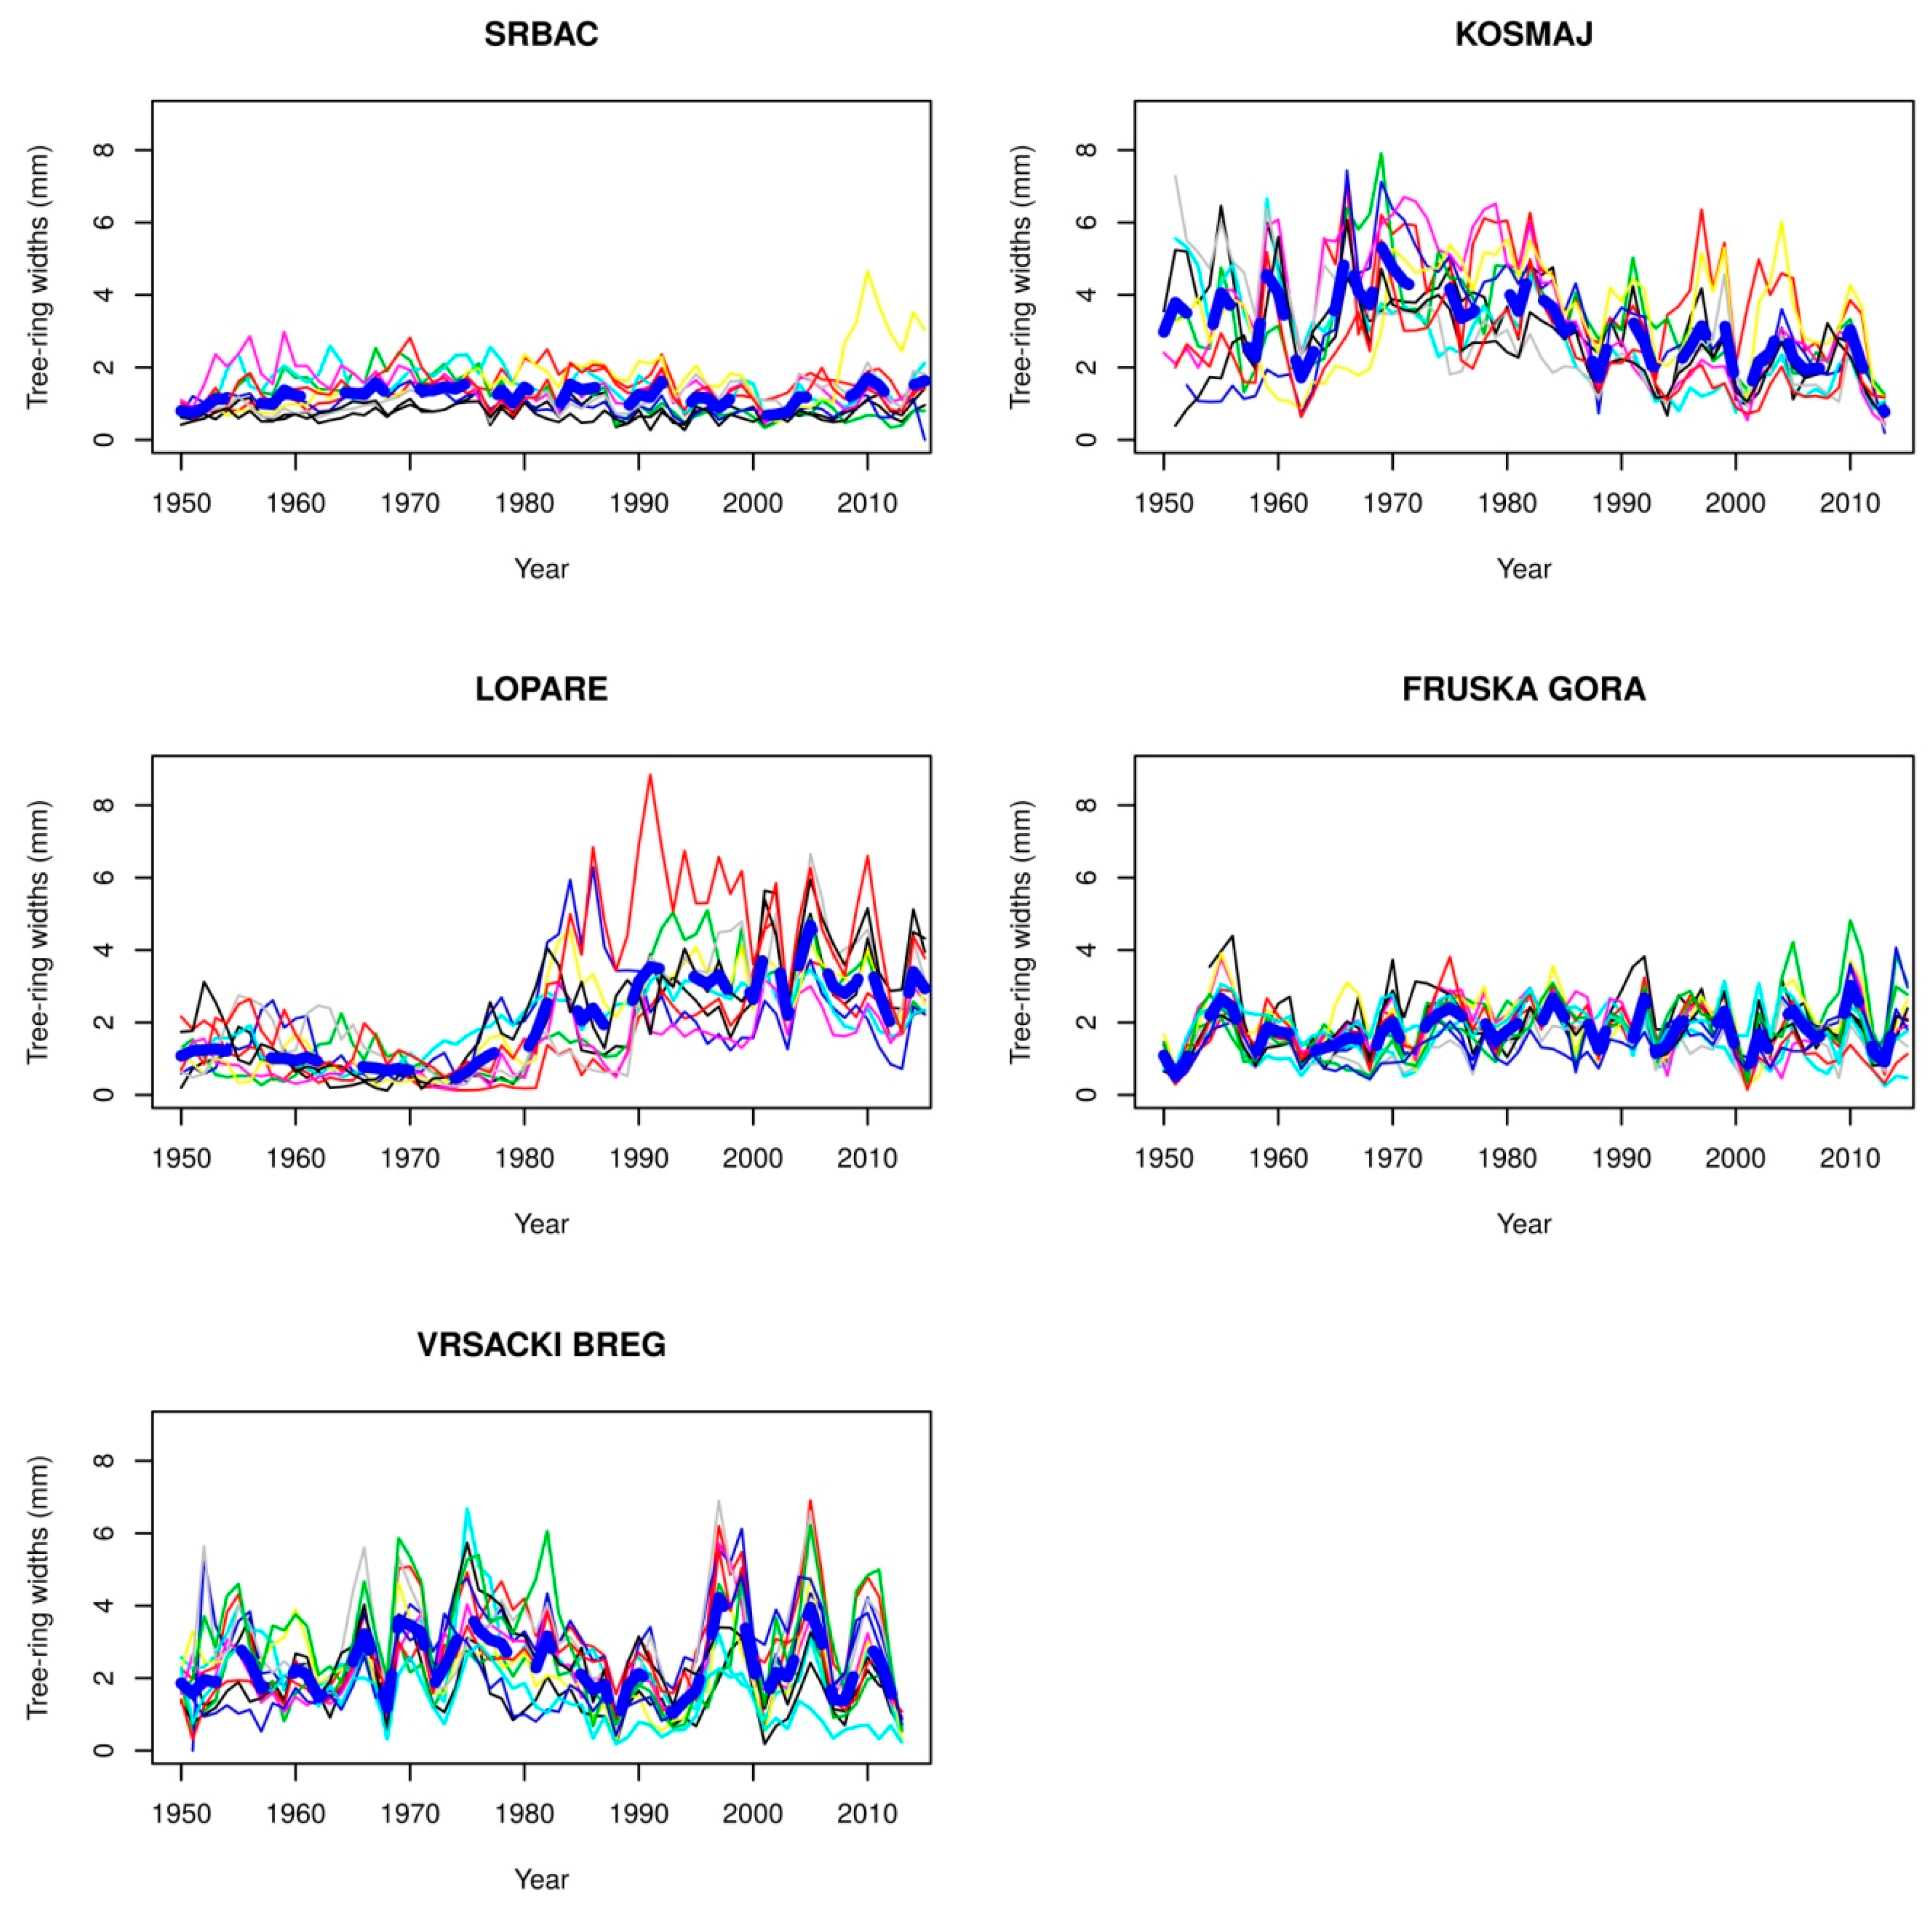
3.2. Chronology of Beech Trees

Figure 2, Figure 3 and Figure 4 show the chronology of beech trees at the lower, optimum and upper limits of the vertical distribution of beech forests. Different zones of vertical distribution and different locations show different variability in the width of growth ring sin the period from 1950 to 2013 (2015). The localities at the upper limit of the vertical distribution of beech forests had mostly smooth chronologies, i.e., chronologies with poorly expressed peaks. This result means that the widths of the growth rings at these locations were mostly uniform. The locations at the lower (Lopare, Kosmaj, and Vrsacki Breg) and optimum limits of distribution (Mrkonjic Grad, Kukavica, and Istocna Boranja) showed significant variability in the width of growth rings; therefore, these sites were analyzed in more detail to determine whether the variability in growth ring width was partially or completely caused by the weather and/or climate.
Observing the chronologies of trees in all three zones of the vertical distribution of beech forests, it can be observed that in each zone, there are localities with small variations in the growth ring widths among trees and low values of growth ring widths. At the lower distribution limit of beech forests, before 1980, the locations of the forests are in Srbac, Fruska Gora, and the locality of Lopare. The chronologies with small values of growth ring widths and small variations in the growth ring widths between tree sat the optimum limit of distribution include Vlasenica and Mrkonjic Grad, while the locations at the upper limit included Babin Zub, Istocni Drvar, Vlasina, and Jahorina before 1990.
At Lopare (353 m a.s.l.), the average growth ring width of all trees was smaller than 1 mm, and the variations among the growth ring widths were also small before 1980. Since 1980, the chronology has increased in terms of the average width of growth rings (2–4 mm), and there has been an increase in the variation among the growth ring widths. This scenario can be explained by the fact that the trees had been growing in the shade until 1980. After that year, the shade was removed, and consequently, they increased their diameter growth.
From the chronology of trees at Lopare, an increase in the width of growth rings and increment was observed since the late 1970s. This situation is atypical because the air temperature has been increasing and has been followed by an increase in the width of growth rings at the lower limit of vertical distribution. Thus, it can be concluded that this phenomenon was probably caused by the more intensive implementation of forest management measures in these stands since the late 1970s.
The chronology of the Mrkonjic Grad location shows high average values of growth ring width (approximately 4 mm) before 1976, after which a sharp decrease was recorded. The decrease was caused by an extremely dry year. Then, the values of the average width of growth rings have been declining. In 1980, a decision was made to exclude this site from regular management and to declare it a nature reserve. Since that time, silvicultural and management measures have not been implemented at Mrkonjic Grad, which has led to a reduction in the increment and growth ring width.
At the locality of Jahorina, the average width of growth rings before 1987 was approximately 2 mm, and then, it increased in the period from 1987 to 2015. This growth indicates that in the period before 1987, beech trees in the stand in Jahorina were overtopped by rival trees and did not have enough light and space to grow and develop normally. Since 1987, more intensive cuttings have been carried out as part of management measures so that the trees have had more intensive diameter growth and produced wider growth rings.

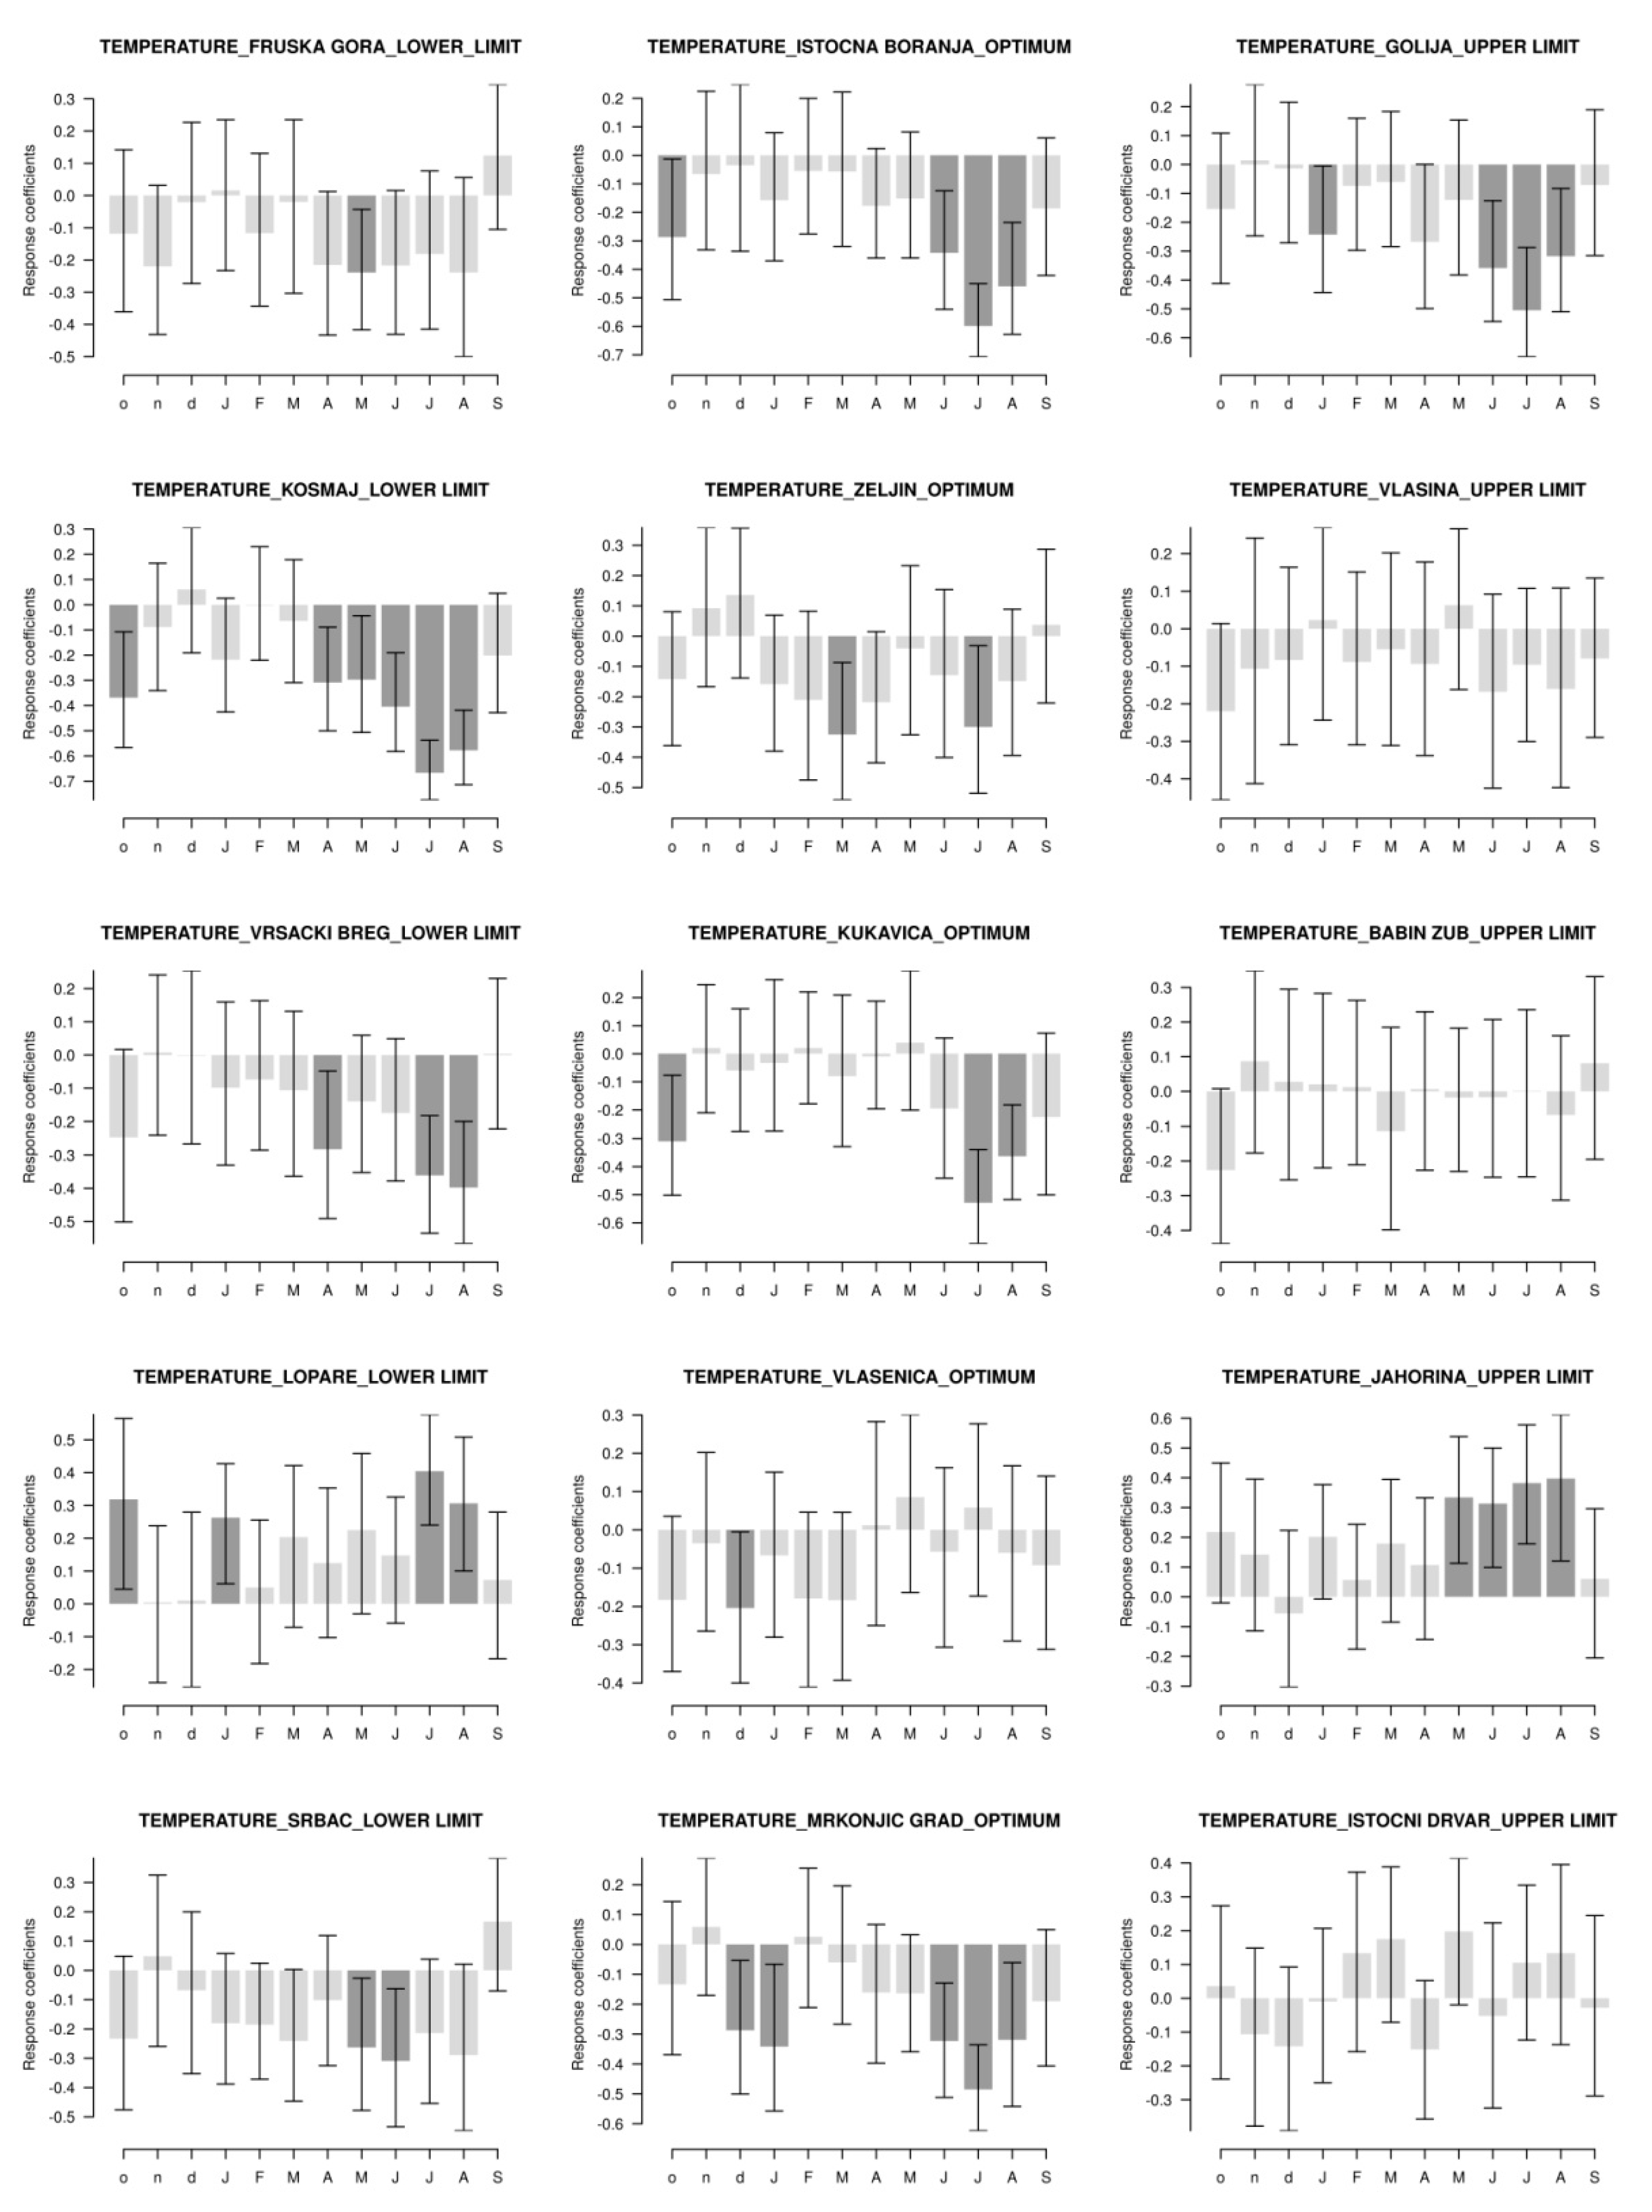
3.3. Relationship between Climate and Radial Growth of Trees

In this section, relationships between climate and radial growth of trees are shown using Pearson’s correlation (bootRes package). Figure 5 shows the relationship between temperature and TRW, and Figure 6 shows the relationship between precipitation and TRW.
From Figure 5, we can observe that localities at the lower limit of the vertical distribution European beech had mostly negative correlations between temperatures and tree-ring width. The exception is the locality of Lopare, which had positive correlations. All localities at the optimum locations had negative correlations. Three of the five analyzed localities at the upper limit did not show any correlations. The Golija locality showed a negative correlation, while the Jahorina locality showed a positive correlation between air temperature and tree-ring width.
From Figure 6, we can observe that two of the five localities did not have any correlations between precipitation and tree-ring width for European beech. Three of the five localities had positive correlations. At one of those three localities (Vrsacki Breg), there was a negative correlation in May of the current year. At the optimum locations, three of the five localities did not have any correlations. Two of the five localities had positive correlations, but the locality Istocna Boranja had a negative correlation in September of the current year. At the localities at the upper limit, three of the five localities did not have any correlations. At the Golija locality, correlations were negative, while at the Istocni Drvar locality, the correlation was positive during June of the current year.

4. Discussion

Devitalization and dieback of trees have been caused by the interaction of a number of factors. The greatest impact on trees has been exerted by abiotic factors such as drought, extremely high temperatures, air pollution, underground and flood waters, and CO2 concentration [66,67,68,69,70]. Climate conditions are considered to be one of the main controlling factors that affect the growth and vitality of forest trees. The response of trees to climate conditions depends on the species of trees, the origin of stands, age, competition of other trees, and site conditions [71]. Diameter increment has long been recognized as an indicator of climate impact [12,72], and it is used to study the impact of climate conditions on the growth of forest trees [73,74].
Meteorological data measured during the last 65 years in the Republic of Serbia and the Republic of Srpska indicate clear changes in climate in all selected regions. These changes are not substantial, but they are steady, particularly during the 1971–2000 and 1981–2010 climatological periods. Certain differences can be noticed among regions and periods. Temperature variations are higher during the year than during the GS and greater at the upper limit than at the lower limit of distribution. The variation in precipitation is higher, particularly in the GS, due to a reduction in precipitation during summer. However, this variation is much lower than in neighboring lowland areas [75].
For region specific analysis, the stands of beech with optimum growth conditions were negatively influenced by the precipitation in August and by the air temperature in September of the year preceding the increment. The precipitation during the growing season of the current year had a positive effect on growth [11]. The availability of water in May and June of the current year was essential for the growth and survival of beech trees at optimum conditions [39,55,56].
In the stands at higher altitudes, increased air temperatures in May were positively correlated with growth, but the correlation was negative for all other months of the growing season. Significant positive correlations between the amount of precipitation in the growing season and the width of growth rings in the summer months were recorded in the year before growth ring formation [45]. Low temperatures in winter, as well as high temperatures in July and droughts in summer, were limiting factors for the growth of beech stands at the upper limit of distribution [76].
Air temperature and the amount of precipitation are the most commonly used climatic factors that affect the distribution of species at global, regional and local levels [77]. The amount of precipitation is an important factor that affects the growth of beech forests at sites that are close to their distribution limits [78]. To determine whether these variables are important in both the Republic of Serbia and the Republic of Srpska in regard to the impact of climate on beech growth and to determine which adverse weather events can decisively influence this development, we identified sites whose chronologies were distinguished by the significant variability in tree rings width.

4.1. Kosmaj

From 1951 to 1969, there was a significant variation (27%) but a slightly positive trend (0.05 year−1) in tree chronology (TRW). The significant variability could have been related to cold winters (monthly temperatures below Clim1) and a permanent decrease in precipitation. This effect was particularly strong in the 1961–1965 period when a warm GS with average or slight above average temperatures (Figure 7) could not cause a reduction in development caused by winter temperatures permanently below Clim1. A large decrease in TRW occurred in 1962 as a result of a very cold and long winter when the average December—February temperature (DJF) (0.4 °C) was below the Clim1 average (0.8 °C), while from December 1961 to March 1962, monthly average temperatures were below the Clim1 temperature each month. From 1969 to 2010, a negative trend in TRWs (−0.064 year−1) was clearly observed (Figure 3) and was strongly correlated with GS precipitation. In this period, a decrease in TRW in 2000 was the result of very dry conditions over the year (Table A2 in Appendix A), while in 2004, this decrease was the result of lower GS temperatures (below Clim4), particularly during the summer even as the GS precipitation was normal. Decreases in TRWs in 1981 and 1989 cannot be explained by meteorological conditions.

4.2. Vrsacki Breg

The most pronounced characteristic of this location was TRW variability that increased over time (from 29% (Clim1) to 40% (Clim4)) and coincided with an increase in temperature variability and negligible changes in precipitation variability (Table 4). The impact of GS precipitation and temperature deviations was significant, but the differences among these two factors are quite clear (Figure 8). These differences can be observed in the TRW variation during Clim1, when the average value was 2.4. In that climatological period, two interesting subperiods occurred. One subperiod was 1957–1963, when GS precipitation was permanently below the average (from 20% to 55%) and TRWs varied from 1.5 to 2.3 with an average of 1.9. A decade later, during 1967–1979, GS temperatures were below the Clim1 normal (for 0.2 °C to 1.4 °C), but the TRW variation was more significant, from 1.2 to 3.9 with an average value of 2.9. The years with some adverse weather events that particularly affected TRW were the following:
  • 1968: period 1966–1968 was very cold in Vrsacki Breg region with only a few months per year (February–June 1968, for example) with temperatures above normal. A cold winter and late summer and autumn were particularly important to the dramatic reduction in TRW (1.2) in this year;
  • 1988: the decrease in TRW (0.7) was again caused by a cold period from March 1988 to the end of the year (except in July and August), when monthly temperatures were below normal and the precipitation was below average for the GS and over the year;
  • 2001: the decrease in TRW (1.2) was the result of a very dry period in February 2000–March 2001, when monthly temperatures were permanently above normal and the precipitation was far below average in 2000.

4.3. Lopare

A dramatic change in the correlation between TRW development and GS temperature and precipitation before and after 1980 (Figure 2 and Figure 9) was the result of a change in forest management (more information is in Section 3.2.). After 1980, TRW was positively correlated with precipitation and negatively correlated with temperature during the GS. A significant reduction in TRW was observed in the following periods:
  • 1987 (1988) had a very cold period from June 1986 to May 1987 when monthly average temperatures were permanently below Clim3. The 1988 winter (including November) was warmer than normal, and the cold spring (Mar–June) with temperatures again below normal resulted in TRW being far below the 1981–2010 average (3);
  • 2003 had a cold period from August 2002 to April 2003, followed by a warm May–August period;
  • 2012(2013) had very warm years 2011–2013 when (except February 2011 and 2012) temperatures were permanently above normal while precipitation was below normal inducing dry conditions.

4.4. Kukavica

The period from 1950 to 1975 was characterized by an increase in TRW (0.09 year−1), particularly in 1969, as a result of a slightly colder summer and warmer spring and autumn. The coefficient of variation for annual precipitation was very large (96.5%). After 1975, there was a slight decrease in TRW with significant decreases in the following periods:
  • 1980 was quite a cold year (Figure 10) at this locality with temperatures below normal over the January–September period;
  • 1988 had low temperatures during the March–December period (except in July and August) with GS precipitation (both in 1987and 1988) at approximately 25% below the GS average;
  • 1994 had temperatures above normal during May 1993 to December 1994 (except November 93 and June 94), and 1993 GS precipitation was 40% below average;
  • 2001 had dry conditions that continued from 2000 into 2001 in the form of reduced precipitation (monthly precipitation below average) in 7 out of the 10 first months.

4.5. Istocna Boranja

The increased TRW trend at this locality in the 1950–1975 period (0.07 year−1) was replaced with a decrease in TRWs (−0.04 year−1) during the remainder of the analyzed period. A very low coefficient of correlation for the Clim1 period was the result of TRW trends that could not be explained by temperature and precipitation regimes in specific years. For example, in 1955 and 1959, both annual and GS precipitation levels (Figure 11) were almost 50% above average, while temperatures during the spring and summer (1955), and summer and autumn (1959) were below normal. These scenarios did not affect TRW changes. Specific reductions in TRWs were recorded in the following years:
  • 1988 had a warm autumn and winter of 1987 (September 1987–February 1988) and summer of 1988 (July–September 1988) and significantly (37%) reduced GS precipitation;
  • 1994 had average GS precipitation, but from April 1993 to the end of 1994, the temperatures were above normal;
  • 2001 had temperatures above normal from February 2000 to March 2001, and annual and GS precipitation levels in 2001 were 50% above average.

4.6. Mrkonjic Grad

TRW development is particularly interesting at this locality. From 1955 to 1962, there was a strong (0.5 year−1), linear (R2 = 0.99) increase in TRWs, and clear variations in GS temperature and precipitation can be seen over this period (Figure 12) with a decreasing trend in temperature deviations during a longer period. After 1962, a much slower (−0.06 year−1) but also linear (R2 = 0.84) decrease over the next 54 years was clearly seen, and even GS temperatures slightly increased, while variation in GS precipitation was 40%. The exception was 1976, when a dramatic decrease in TC (from 2.9 to 0.9) occurred due to a very cold period preceding and during this decrease. Specifically, from June 1975 to December 1976, average monthly temperatures were up to the Clim3 normal or far below it. Even GS precipitation level during both years were 40–50% above average, but these values were not enough to stop a large reduction in TC.
This decrease in the width of tree rings was the result of a change in the management. The forest compartment in which a stand is located was excluded from the system of regular management, and a proposal was made to declare it a reserve. This scenario means that it was not possible to carry out silvicultural and management measures, which consequently caused a decrease in the width of tree rings; thus, the change in air temperatures did not cause the decrease. For that reason, we do not present MG correlations in Table 4.
Similar studies were carried out in some neighboring countries. For example, in Slovenia, at a locality near Ljubljana, correlations with climate indicate that precipitation in month of May affects TRW and that the TRWs were wider when May was wet [48]. Precipitation in May has both direct and indirect effects on growth, with the latter effects due to the amount of available water in summer, which also depends on the water storage capacity of the soil [79]. The most important climatic factor explaining variations in the growth of beech in Slovenia was the mean of the maximum temperatures in August. Tree-ring width was also negatively correlated with the minimum temperature in March and positively correlated with precipitation in May and July. The maximum temperature in the previous November and precipitation in the previous September also positively affected tree-ring width [48].TRW was negatively affected by June temperature and positively by June precipitation [80]. The positive effect of July precipitation and negative effect of July temperature were slightly less pronounced but still consistent.

5. Conclusions

The long-term analysis indicates that at the climatological level and dry conditions during GS will reduce TRW, but real reductions in tree growth can be expected as a result of more than one season of unfavorable conditions.
The site-specific analysis of TRW reductions associated with adverse weather events indicates that low autumn and winter temperatures and prolonged duration of winter can strongly affect the upcoming vegetation and reduce tree development even under normal thermal conditions during the GS. It appears that from a point-of-view of increasing TRW, the best weather conditions are associated with a normal to slightly colder summer and warm spring and autumn without extreme cold periods during winter.
At the upper limit of the vertical distribution of beech forests in Serbia and the Republic of Srpska, chronologies have less pronounced peaks than at the optimum and lower distribution limits, indicating that the impact of climate on the width of growth rings is more pronounced at the lower and optimum limits.
In beech forests in Serbia and the Republic of Srpska, there has been a reduction in the width of growth rings, i.e., diameter increment, caused by changing air temperatures and amounts of precipitation. This reduction is more pronounced at the lower limit of the vertical distribution of beech forests and at optimum areas than at the upper limit, but our assumption is that this reduction still does not have an impact on the range of the distribution of beech forests or on the movement of beech to higher altitudes in the Republic of Serbia and in the Republic of Srpska.
According to the environmental stratification of Europe [81], all selected locations belong to continental and Pannonian environmental zones, which are the most represented zones in Europe. The results presented in this study are based on biological and meteorological measurements and therefore represent a good starting point for further analysis of the expected impacts of climate change on beech forest growth not only in the selected regions but also all over the Pannonian and continental zones. Thus, an analysis of climate change impacts on agroclimatic conditions in Europe under expected climate change [82] is of particular importance.

Author Contributions

Conceptualization, S.S., B.M. and B.L.; Methodology, S.S., B.M., D.S., T.L. and B.L.; Software, S.S., T.L. and D.S.; Validation, B.L., S.O., T.L. and D.S.; Formal analysis, B.L. and S.S.; Investigation, S.S., D.S. and B.M.; Resources, S.O. and T.L.; Supervision and validation, B.M., S.O., B.L., D.S. and T.L.; Data curation, T.L. and D.S.; Writing—Original draft preparation, S.S., B.L. and B.M.; Writing—Review and editing, B.L., B.M., T.L., S.S., D.S. and S.O.; Visualization, B.L., B.M., D.S. and S.S.; Translation, M.G.; Project administration, B.L.

Funding

Publication of this paper is supported by the H2020-TWINN-2015 ‘SERBIA FOR EXCELL’ project. This project has received funding from the European Union’s HORIZON 2020 research and innovation programme under grant agreement no. 691998. The work described in this paper was realized as a part of the project “Studying climate change and its influence on the environment: impacts, adaptation and mitigation” (43007) financed by the Ministry of Education and Science of the Republic of Serbia within the framework of integrated and interdisciplinary research for the period of 2011–2017.

Acknowledgments

We thank the Institute of Lowland Forestry and Environment from Novi Sad, Serbia (http://www.ilfe.org/sr) and Slovenian forestry Institute from Ljubljana (http://en.gozdis.si/home/) for ceded dendrochronology laboratory.

Conflicts of Interest

The authors declare that they have no competing interests.

Appendix A

Table A1. Normal temperatures and average annual precipitation on sampling sites for the 1951–1980 reference climatology.
CLIMATOLOGY 1 (1951–1980)
LOCALITY MonthsAverage
JanFebMarAprMayJunJulAugSepOctNovDec
LOWER LIMIT
LOPARE (LO)t (°C)−1.01.45.310.214.618.219.519.115.310.35.71.110.0
H(mm)49.049.045.061.081.089.079.067.056.051.065.067.063.3
SRBAC (SR)t (°C)−0.32.16.111.015.619.220.720.116.411.36.31.710.9
H(mm)53.052.048.066.073.081.069.064.056.059.080.073.064.5
FRUSKA GORA (FG)t (°C)−1.21.15.410.815.719.220.619.916.010.85.81.110.4
H (mm)38.041.037.047.063.082.064.055.039.040.053.054.051.1
KOSMAJ (KO)t (°C)−0.61.65.510.815.519.020.520.116.311.06.31.610.6
H (mm)43.041.042.054.082.087.074.059.047.046.052.054.056.8
VRSACKI BREG (VB)t (°C)−0.51.55.811.316.219.621.120.817.011.66.61.811.1
H (mm)40.042.035.052.074.083.064.052.040.039.050.054.052.1
OPTIMUM
VLASENICA (VL)t (°C)−2.9−0.92.67.011.615.116.616.513.08.23.7−0.97.5
H (mm)54.053.050.065.087.088.081.068.066.068.076.071.068.9
MRKONJIC GRAD (MG)t (°C)−1.60.13.47.712.315.917.717.313.68.84.40.18.3
H (mm)75.073.070.084.082.087.063.073.071.098.0124.0109.084.1
ISROCNA BORANJA (IB)t (°C)−1.50.84.59.413.917.518.818.514.89.85.20.69.4
H (mm)48.047.046.061.087.092.083.071.059.053.064.064.064.6
ZELJIN (ZE)t (°C)−2.20.13.99.113.717.118.618.514.79.55.00.19.0
H (mm)43.042.044.056.093.086.072.061.052.052.059.055.059.6
KUKAVICA (KU)t (°C)−1.31.14.810.014.618.119.819.615.710.45.70.89.9
H (mm)37.042.045.051.070.069.050.046.044.051.060.053.051.5
UPPER LIMIT
JAHORINA (JA)t (°C)−2.9−1.31.95.910.614.115.815.912.47.73.5−1.06.9
H (mm)64.061.056.064.078.079.068.062.070.086.090.080.071.5
ISTOCNI DRVAR (ID)t (°C)−2.9−1.51.65.710.414.015.815.511.97.23.01.26.6
H (mm)80.077.079.093.087.090.064.081.079.0111.0139.0116.091.3
GOLIJA (GO)t (°C)−5.0−2.90.65.510.213.515.014.911.46.72.5−2.55.8
H (mm)44.039.041.050.081.077.069.062.055.064.068.056.058.8
VLASINA (V)t (°C)−4.8−2.90.35.310.013.515.415.411.66.52.0−2.75.8
H (mm)35.038.044.053.083.083.060.053.042.051.054.049.053.8
BABIN ZUB (BZ)t (°C)−3.3−1.32.68.112.916.418.418.314.49.13.9−0.58.3
H (mm)42.044.047.061.098.098.072.058.055.050.058.050.061.1
Table A2. Dry years at all analyzed sites.
Lower limitOptimumUpper limit
YearLopareSrbacF GoraKosmajV BregVlasenicaM GradI BoranjaZeljinKukavicaJahorinaI DrvarGolijaVlasinaB Zub
1951**************
1952** * **********
1953******** ****
1954
1955
1956
1957**** *** ***
1958***************
1959
1960* *** **** **
1961***************
1962 *
1963 ** *
1964
1965
1966 * *
1967 * *** ** *
1968 *** * ***
1969
1970
1971* * *
1972 *** ** *
1973
1974
1975 ** * *
1976
1977 *
1978
1979* * * *
1980
1981
1982********* *****
1983***** *** ** *
1984
1985 *
1986 * **
1987
1988**** **** ****
1989 ** * * *
1990***************
1991
1992*********** ***
1993**** **********
1994***************
1995
1996
1997** ** **
1998 * ** * ** *
1999 *
2000***************
2001 **
2002 * *
2003************ **
2004 *
2005
2006 * * * *
2007 * *
2008****** **** * *
2009 **
2010
2011***************
2012********** *
2013* * * *** * *
2014
2015 * ** **
Cells of red colors represent years in which were observed extreme dry conditions.

References

  1. Jovanović, B. Dendrologija sa Osnovama Fitocenologije; Naučna Knjiga: Beograd, Serbia, 1971. [Google Scholar]
  2. Lavadinović, V.; Isajev, V. Genetski potencijal semenskih objekata bukve u Srbiji- osnova za oplemenjivanje vrste. Zbornik radova Instituta za šumarstvo 2002, 46–47, 32–39. [Google Scholar]
  3. Bolte, A.; Czajkowski, T.; Kompa, T. Thenorth-eastern distribution range of European beech–areview. Forestry 2007, 80, 413–429. [Google Scholar] [CrossRef]
  4. Mátyás, C.; Berki, I.; Czúcz, B.; Gálos, B.; Móricz, N.; Rasztovits, E. Future of beech in Southeast Europe from the perspective of evolutionary ecology. Acta Silvatica et Lignaria Hungarica 2010, 6, 91–110. [Google Scholar]
  5. Nabuurs, G.J.; Pussinen, A.; van Bruselen, J.; Schelhaas, M.J. Future harvesting pressure on European forests. Eur. J. For. Res. 2007, 126, 391–400. [Google Scholar] [CrossRef]
  6. European Environmental Agency (EEA). Impacts of Europe’s Changing Climate; EEA Report No. 2; European Environmental Agency: Copenhagen, Denmark, 2004. [Google Scholar]
  7. Strengbom, J.; Dahlberg, A.; Larsson, A.; Lindelöw, A.; Sandström, J.; Widenfalk, O.; Gustafsson, L. Introducing Intensively Managed Spruce Plantations in Swedish Forest Landscapes will Impair Biodiversity Decline. Forests 2011, 2, 610–630. [Google Scholar] [CrossRef] [Green Version]
  8. Seidl, R.; Rammer, W.; Lexer, M.J. Climate change vulnerability of sustainable forest management in the Eastern Alps. Clim. Chang. 2011, 106, 225–254. [Google Scholar] [CrossRef]
  9. Di Filippo, A.; Biondi, F.; Maugeri, M.; Schirone, B.; Piovesan, G. Bioclimate and growth history affect beech lifespan in the Italian Alps and Apennines. Glob. Chang. Biol. 2012, 18, 960–972. [Google Scholar] [CrossRef]
  10. Seidling, W.; Ziche, D.; Beck, W. Climate responses and interrelations of stem increment and crown transparency in Norway spruce, Scots pine, and common beech. For. Ecol. Manag. 2012, 284, 196–204. [Google Scholar] [CrossRef]
  11. Van der Maaten, E. Climate sensitivity of radial growth in European beech (Fagus sylvatica L.) at different aspects in southwestern Germany. Trees 2012, 26, 777–788. [Google Scholar] [CrossRef] [Green Version]
  12. Gessler, A.; Keitel, C.; Kreuzwieser, J.; Matyssek, R.; Seiler, W.; Rennenberg, H. Potential risks for European beech (Fagus sylvatica L.) in a changing climate. Trees 2007, 21, 1–11. [Google Scholar] [CrossRef]
  13. Latte, N.; Lebourgeois, F.; Claessens, H. Increased tree-growth synchronization of beech (Fagus sylvatica L.) in response to climate change in northwestern Europe. Dendrochronologia 2015, 33, 69–77. [Google Scholar]
  14. Müller-Haubold, H.; Hertel, D.; Seidel, D.; Knutzen, F.; Leuschner, C. Climate Responses of Aboveground Productivity and Allocation in Fagus sylvatica: A Transect Study in Mature Forests. Ecosystems 2013, 16, 1498–1516. [Google Scholar] [CrossRef]
  15. Pötzelsberger, E.; Wolfslehner, B.; Hasenauer, H. Climate change impacts on key forest functions of the Vienna Woods. Eur. J. For. Res. 2015, 134, 481–496. [Google Scholar] [CrossRef]
  16. Mette, T.; Dolos, K.; Meinardus, C.; Braüning, A.; Reineking, B.; Blaschke, M.; Pretzsch, H.; Beierkuhnlein, C.; Gohlke, A.; Wellstein, C. Climatic turning point for beech and oak under climate change in Central Europe. Ecosphere 2013, 4, 1–19. [Google Scholar] [CrossRef]
  17. Weber, P.; Bugmann, H.; Pluess, A.R.; Walthert, L.; Rigling, A. Drought response and changing mean sensitivity of European beech close to the dry distribution limit. Trees 2013, 27, 171–181. [Google Scholar] [CrossRef]
  18. Matović, B.; Koprivica, M.; Kišin, B.; Stojanović, D.; Kneginjić, I.; Stjepanovć, S. Comparison of stand structure in managed and virgin european beech forests in Serbia. Šumarski List 2018, 142, 47–57. [Google Scholar] [CrossRef]
  19. Lakatos, F.; Molnar, M. Mass mortality of beech (Fagus sylvatica L.) in Suuth- West Hungary. Acta Silv. Lign. Hung. 2009, 5, 75–82. [Google Scholar]
  20. Stojanović, D. Uticaj klimatskih promena na vezivanje ugljenika, rast i biodiverzitet bukovih šuma u Srbiji. Doktorska disertacija, Prirodno-Matematički fakultet, Departman za Biologiju i ekologiju, Univerzitet u Novom Sadu, Novi Sad, Serbia, 2014. [Google Scholar]
  21. Stojanović, D.B.; Kržič, A.; Matović, B.; Orlović, S.; Duputie, A.; Djurdjević, V.; Galić, Z.; Stojnić, S. Prediction of the European beech (Fagus sylvatica L.) xeric limit using a regional climate model: An example from southeast Europe. Agric. For. Meteorol. 2013, 176, 94–103. [Google Scholar] [CrossRef]
  22. Garamvoelgyi, A.; Hufnagel, L. Impacts of climate change on vegetation distribution no.1. Climate change induced vegetation shifts in the Palearctic region. Appl. Ecol. Environ. Res. 2013, 11, 79–122. [Google Scholar] [CrossRef]
  23. Saltré, F.; Duputié, A.; Gaucherel, C.; Chuine, I. How climate, migration ability and habitat fragmentation affect the projected future distribution of European beech. Glob. Chang. Biol. 2015, 21, 897–910. [Google Scholar] [CrossRef] [PubMed]
  24. Mina, M.; Bugmann, H.; Klopcic, M.; Cailleret, M. Accurate modelling of harvesting is key for projecting future forest dynamics: A case study in the Slovenian mountains. Reg. Environ. Chang. 2017, 17, 49–64. [Google Scholar] [CrossRef]
  25. Hlásny, T.; Barcza, Z.; Fabrika, M.; Balázs, B.; Churkina, G.; Pajtík, J.; Sedmak, H.; Turcani, M. Climate change impacts on growth and carbon balance of forests in Central Europe. Clim. Res. 2011, 47, 219–236. [Google Scholar] [CrossRef]
  26. Hartmann, H. Will a 385 million year-struggle for light become a struggle for water and for carbon? How trees may cope with more frequent climate change-type drought events. Glob. Chang. Biol. 2011, 17, 642–655. [Google Scholar] [CrossRef]
  27. Ciais, P.; Reichstein, M.; Viovy, N.; Granier, A.; Ogée, J.; Allard, V.; Aubinet, M.; Buchmann, N.; Bernhofer, C.; Carrara, A.; et al. Europe-wide reduction in primary productivity caused by the heat and drought in 2003. Nature 2005, 437, 529–533. [Google Scholar] [CrossRef] [PubMed]
  28. Dursky, J. Modellierung der Absterbeprozesse in Rein–und Mischbeständen aus Fichte und Buche. Allgemeine Forst und Jagtzeitung 1997, 168, 131–134. [Google Scholar]
  29. Pretzsch, H.; Biber, P.; Dursky, J.; von Gadow, K.; Hasenauer, H.; Kändler, G.; Kenk, K.; Kublin, E.; Nage, J.; Pukkala, T.; et al. Recommendations for Standardized Documentation and Further Development of Forest Growth Simulators. Forstwissenschaftliches Centralblatt 2002, 121, 138–151. [Google Scholar] [CrossRef]
  30. Bošela, M.; Štefančík, I.; Petráš, R.; Vacek, S. The effects of climate warming on the growth of European beech forests depend critically on thinning strategy and site productivity. Agric. For. Meteorol. 2016, 222, 21–31. [Google Scholar] [CrossRef]
  31. Machar, I.; Vlckova, V.; Bucek, A.; Vozenilek, V.; Salek, L.; Jerabkova, L. Modelling of Climate Conditions in Forest Vegetation Zones as a Support Tool for Forest Management Strategy in European Beech Dominated Forests. Forests 2017, 8, 82. [Google Scholar] [CrossRef]
  32. Lindner, M.; Fitzgerald, J.B.; Zimmermann, N.E.; Reyer, C.; Delzon, S.; van der Maaten, E.; Schelhaas, M.J.; Lasch, P.; Eggers, J.; van der Maaten-Theunissen, M.; et al. Climate change and European forests: What do we know, what are the uncertainties, and what are the implications for forest management? J. Environ. Manag. 2014, 146, 69–83. [Google Scholar] [CrossRef] [PubMed]
  33. De Boeck, H.J.; Verbeeck, H. Drought-associated changes in climate and their relevance for ecosystem experiments and models. Biogeosciences 2011, 8, 1121–1130. [Google Scholar] [CrossRef] [Green Version]
  34. Anderegg, L.D.L.; Anderegg, W.R.L.; Berry, J.A. Not all droughts are created equal: Translating meteorological drought into woody plant mortality. Tree Physiol. Rev. 2013, 33, 672–683. [Google Scholar] [CrossRef] [PubMed]
  35. Budeanu, M.; Petritan, A.M.; Popescu, F.; Vasile, D.; Tudose, N.C. The resistance of European beech (Fagus sylvatica) from the eastern natural limit of species to climate change. Notulae Botanicae Horti Agrobotanici Cluj-Napoca 2016, 44, 625–633. [Google Scholar] [CrossRef]
  36. Fritts, H.C. Tree Rings and Climate; Academic Press: New York, NY, USA, 1976; pp. 107–113. ISBN 012268450-8. [Google Scholar]
  37. Lebourgeois, F.; Bréda, N.; Ulrich, E.; nd Granier, A. Climate-tree-growth relationships of European beech (Fagus sylvatica L.) in the French Permanent Plot Network (RENECOFOR). Trees 2005, 19, 385–401. [Google Scholar] [CrossRef]
  38. Piovesan, G.; Biondi, F.; Bernabei, M.; Di Filippo, A.; Schirone, B. Spatial and altitudinal bioclimatic zones of the Italian Peninsula identified from a beech (Fagus sylvatica L.) tree-ring network. Acta Oecol. 2005, 27, 197–210. [Google Scholar] [CrossRef]
  39. DiFilippo, A.; Biondi, F.; Cufar, K.; deLuis, M.; Grabner, M.; Maugeri, M.; Saba, E.P.; Schirone, B.; Piovesan, G. Bioclimatology of beech (Fagus sylvatica L.) in the Eastern Alps: Spatial and altitudinal climatic signal sidentified through a tree-ring network. J. Biogeogr. 2007, 34, 1873–1892. [Google Scholar] [CrossRef]
  40. Biondi, F. Comparing tree-ring chronologies and repeated timber inventories as forest monitoring tools. Ecol. Appl. 1999, 9, 216–227. [Google Scholar] [CrossRef]
  41. Cook, E.R.; Glitzenstein, J.S.; Krusic, P.J.; Harcombe, P.A. Identifying functional groups of trees in west Gulf Coast forests (USA): A tree-ring approach. Ecol. Appl. 2001, 11, 883–903. [Google Scholar] [CrossRef]
  42. Jump, A.S.; Penuelas, J. Running to stand still: Adaptation and the response of plants to rapid climate change. Ecol. Lett. 2005, 8, 1010–1020. [Google Scholar] [CrossRef]
  43. Whittaker, R.J.; Araujo, M.B.; Jepson, P.; Ladle, R.J.; Watson, J.E.M.; Willis, K.J. Conservation biogeography: Assessment and prospect. Divers. Distrib. 2005, 11, 3–23. [Google Scholar] [CrossRef]
  44. Zimmermann, N.E.; Bolliger, J.; Gehrig-Fasel, J.; Guisan, A.; Kienast, F.; Lischeke, H.; Rickebusch, S.; Wohlgemuth, T. Wo wachsen die Baume in 100 Jahren? Wald und Klimalwandel. In Forum fur Wissen; Gassmann: Biel, Switzerland, 2006; pp. 63–71. [Google Scholar]
  45. Hacket-Pain, A.J.; Friend, A.D. Increased growth and reduced summer drought limitation at the southern limit of Fagus sylvatica L., despite regionally warmer and drier conditions. Dendrochronologia 2017, 44, 22–30. [Google Scholar] [CrossRef]
  46. Stojanović, B.D.; Levanic, T.; Matovic, B.; Stjepanovic, S.; Orlovic, S. Growth response of different tree species (oaks, beech and pine) from SE Europe to precipitation over time. Dendrobiology 2018, 79, 97–110. [Google Scholar] [CrossRef] [Green Version]
  47. Salamon-Albert, E.; Abaligeti, G.; Ortmann-Ajkai, A. Functional Response Trait Analysis Improves Climate Sensitivity Estimation in Beech Forests at a Trailing Edge. Forests 2017, 8, 324. [Google Scholar] [CrossRef]
  48. Cufar, K.; Prislan, P.; de Luis, M.; Gricar, J. Tree-ring variation, wood formation and phenology of beech (Fagus sylvatica L.) from a representative site in Slovenia, SE Central Europe. Trees-Struct. Funct. 2008, 22, 749–758. [Google Scholar] [CrossRef]
  49. Garamszegi, B.; Kern, Z. Climate influence on radial growth of Fagus sylvatica growing near the edge of its distribution in Bükk Mts., Hungary. Dendrobiology 2014, 72, 93–102. [Google Scholar] [CrossRef]
  50. Lloret, F.; Keeling, E.G.; Sala, A. Components of tree resilience: Effects of successive low-growth episodes in old ponderosa pine forests. Oikos 2011, 120, 1909–1920. [Google Scholar] [CrossRef]
  51. Peltier, D.M.P.; Fell, M.; Ogle, K. Legacy effects of drought in the southwestern United States: A multi-species synthesis. Ecol. Monogr. 2016, 86, 312–326. [Google Scholar] [CrossRef] [Green Version]
  52. Bhuyan, U.; Zang, C.; Menzel, A. Different responses of multispecies tree ring growth to various drought indices across Europe. Dendrochronologia 2017, 44, 1–8. [Google Scholar] [CrossRef]
  53. Fotelli, M.N.; Nahm, M.; Radoglou, K.; Rennenberg, H.; Halyvopoulos, G.; Matzarakis, A. Seasonal and interannual ecophysiological responses of beech (Fagus sylvatica) at its south-eastern distribution limit in Europe. For. Ecol. Manag. 2009, 257, 1157–1164. [Google Scholar] [CrossRef]
  54. Kramer, K.; Degen, B.; Buschbom, J.; Hickler, T.; Thuiller, W.; Sykes, M.T.; de Winter, W. Modelling exploration of the future of European beech (Fagus sylvatica L.) under climate change–range, abundance, genetic diversity and adaptive response. For. Ecol. Manag. 2010, 259, 2213–2222. [Google Scholar] [CrossRef]
  55. Czúcz, B.; Galhidy, L.; Matyas, C. Present and forecasted xeric climatic limits of beech and sessile oak distribution at low altitudes in Central Europe. Ann. For. Sci. 2011, 68, 99–108. [Google Scholar] [CrossRef] [Green Version]
  56. Dittmar, C.; Zech, W.; Elling, W. Growth variations of common beech (Fagus sylvatica L.) under different climatic and environmental conditions in Europe: A dendroecological study. For. Ecol. Manag. 2003, 173, 63–78. [Google Scholar] [CrossRef]
  57. Scharnweber, T.; Manthey, M.; Criegee, C.; Bauwe, A.; Schröder, C.; Wilmking, M. Droughtmatters–declining precipitation influences growth of Fagus sylvatica L. and Quercus robur L. in north-eastern Germany. For. Ecol. Manag. 2011, 262, 947–961. [Google Scholar] [CrossRef]
  58. Hacket-Pain, A.J.; Cavin, L.; Friend, A.D.; Jump, A.S. Consistent limitation of growth by high temperature and low precipitation from range core to southern edge of European beech indicates widespread vulnerability to changing climate. Eur. J. For. Res. 2016, 135, 897–909. [Google Scholar] [CrossRef] [Green Version]
  59. Tegel, W.; Seim, A.; Hakelberg, D.; Hoffmann, S.; Panev, M.; Westphal, T.; Büntgen, U. A recent growth increase of European beech (Fagus sylvatica L.) at its Mediterranean distribution limit contradicts drought stress. Eur. J. For. Res. 2014, 133, 61–71. [Google Scholar] [CrossRef]
  60. Michelot, A.; Simard, S.; Rathgeber, C.; Dufrne, E.; Damesin, C. Comparing the intra-annual wood formation of three European species (Fagus sylvatica, Quercus petraea and Pinus sylvestris) as related to leaf phenology and non-structural carbohydrate dynamics. Tree Physiol. 2012, 32, 1033–1045. [Google Scholar] [CrossRef] [PubMed]
  61. Oladi, R.; Pourtahmasi, R.; Eckstein, D.; Brauning, A. Seasonal dynamics of wood formation on Oriental beech (Fagus orientalis Lipsky) along an altitudinal gradient in the Hyrcanian forest, Iran. Trees 2011, 25, 425–433. [Google Scholar] [CrossRef]
  62. Radinovic, D.J. Weather and Climate of Yugoslavia; Civil Engineering Book: Belgrade, Serbia, 1979; pp. 1–283. [Google Scholar]
  63. European Climate Assessment Dataset. Available online: www.ecad.eu (accessed on 30 June 2018).
  64. Levanic, T. ATRICS—A new system for image acquisition in dendrochronology. Tree-Ring Res. 2007, 63, 117–122. [Google Scholar] [CrossRef]
  65. Larsson, L. CooRecorder and Cdendro programs of the CooRecorder/Cdendro package version 7.7. Available online: http://www.cybis.se/forfun/dendro (accessed on 3 January 2014).
  66. McDowell, N.; Pockman, W.T.; Allen, C.D.; Breshears, D.D.; Cobb, N.; Kolb, T.; Pault, J.; Sperry, J.; West, A.; Williams, D.G.; et al. Mechanisms of plant survival and mortality during drought: Why do some plants survive while others succumb to drought? New Phytol. 2008, 178, 719–739. [Google Scholar] [CrossRef] [PubMed]
  67. Allen, C.D.; Macalady, A.K.; Chenchouni, H.; Bachelet, D.; McDowell, N.; Vennetier, M.; Kitzberger, T.; Rigling, A.; Breshears, D.D.; (Ted)Hog, E.H.; et al. A global overview of drought and heat-induced tree mortality reveals emerging climate change risks for forests. For. Ecol. Manag. 2010, 259, 660–684. [Google Scholar] [CrossRef]
  68. Choat, B.; Jansen, S.; Brodribb, T.J.; Cochard, H.; Delzon, S.; Bhaskar, R.; Bucci, S.J.; Field, S.J.; Gleason, S.M.; Hacke, U.G.; et al. Global convergence in the vulnerability of forests to drought. Nature 2012, 491, 752–755. [Google Scholar] [CrossRef] [PubMed] [Green Version]
  69. Williams, A.P.; Allen, C.D.; Macalady, A.K.; Griffin, D.; Woodhouse, C.A.; Meko, D.M.; Swtenam, T.W.; Rauscher, S.A.; Seager, R.; Gryssino-Mayer, H.D.; et al. Temperature as a potent driver of regional forest drought stress and tree mortality. Nat. Clim. Chang. 2013, 3, 292–297. [Google Scholar] [CrossRef]
  70. O’Brien, M.J.; Engelbrecht, B.M.; Joswig, J.; Pereyra, G.; Schuldt, B.; Jansen, S.; Kattge, J.; Landhausser, S.M.; Levick, S.R.; Preisler, Y.; et al. A synthesis of tree functional traits related to drought-induced mortality in forests across climatic zones. J. Appl. Ecol. 2017, 54, 1669–1686. [Google Scholar] [CrossRef]
  71. Spiecker, H. Tree rings and forest management in Europe. Dendrochronologia 2002, 20, 191–202. [Google Scholar] [CrossRef]
  72. Cook, E.R.; Kairiukstis, L.A. Methods of Dendrochronology: Applications in the Environmental Sciences; Cook, E.R., Kairiukstis, L.A., Eds.; Springer-Science+Bussines Media, B.V.: Berlin/Heidelberg, Germany, 2013; pp. 289–339. ISBN 978-94-015-7879-0. (ebook). [Google Scholar]
  73. Beck, W. Growth patterns of forest stands-the response towards pollutants and climatic impact. iForest-Biogeosci. For. 2009, 2, 4–6. [Google Scholar] [CrossRef]
  74. Bolte, A.; Hilbrig, L.; Grundmann, B.; Kampf, F.; Brunet, J.; Roloff, A. Climate change impacts on stand structure and competitive interactions in a southern Swedish spruce–beech forest. Eur. J. For. Res. 2010, 129, 261–276. [Google Scholar] [CrossRef]
  75. Lalic, B.; Eitzinger, J.; Mihailovic, D.T.; Thaler, S.; Jancic, M. Climate change impacts on winter wheat yield change—which climatic parameters are crucial in Pannonian lowland? J. Agric. Sci. 2012, 151, 757–774. [Google Scholar] [CrossRef]
  76. Augustaitis, A.; Kliucius, A.; Marozas, V.; Pilkauskas, M.; Augustaitiene, I.; Vitas, A.; Staszewski, T.; Jansons, A.; Dreimanis, A. Sensitivity of European beech trees to unfavorable environmental factors on the edge and outside of their distribution range in north-eastern Europe. IForest 2015, 9, 259–269. [Google Scholar] [CrossRef]
  77. Casalegno, S.; Amatulli, G.; Bastrup-Birk, A.; Houston Durrant, T.; Pekkarinen, A. Modelling and mapping the suitability of European forest formations at 1-km resolution. Eur. J. For. Res. 2011, 130, 971–981. [Google Scholar] [CrossRef]
  78. Fang, J.; Lechowicz, M.L. Climatic limits for the present distribution of beech (Fagus L.) species in the world. J. Biogeography 2006, 33, 1804–1819. [Google Scholar] [CrossRef]
  79. Bouriaud, O.; Breda, N.; Le Moguedec, G.; Nepveu, G. Modelling variability of wood density in beech as affected by ring age, radial growth and climate. Trees 2004, 18, 264–276. [Google Scholar] [CrossRef]
  80. Čufar, K.; De Luis, M.; Eckstein, D.; Kajfez-Bogataj, L. Reconstructing dry and wet summers in SE Slovenia from oak tree rings series. Int. J. Biometeorol. 2008. [Google Scholar] [CrossRef] [PubMed]
  81. Metyger, M.J.; Bunce, R.G.H.; Jongman, R.H.G.; Mucher, C.A.; Watkins, J.W. A climatic stratification of Europe. Glob. Ecol. Biogeogr. 2005, 14, 549–563. [Google Scholar] [CrossRef]
  82. Trnka, M.; Olesen, J.E.; Kersebaum, K.C.; Skjelvåg, A.O.; Eitzinger, J.; Seguin, B.; Peltonen-Sainio, P.; Rötter, R.; Iglesias, A.; Orlandini, S.; et al. Agroclimatic conditions in Europe under climate change. Glob. Chang. Biol. 2011, 17, 2298–2318. [Google Scholar] [CrossRef] [Green Version]
Figure 1. Distribution and sampling sites of European beech (Fagus sylvatica L.) in the Republic of Serbia and Republic of Srpska.
Atmosphere 09 00451 g001
Figure 2. Chronology of beech trees at the lower limit of their vertical distribution.
Atmosphere 09 00451 g002
Figure 3. Chronology of beech trees at the optimum of their vertical distribution.
Atmosphere 09 00451 g003
Figure 4. Chronology of beech trees at the upper limit of their vertical distribution.
Atmosphere 09 00451 g004
Figure 5. Bootstrapped Pearson’s correlation between tree-ring width and temperature in the period 1951–2013 (2015) for the different elevations. Months marked by small letters are from the year prior to the growth and capital letters represents the year of the growth. Dark color represents significant correlation at p < 0.05.
Atmosphere 09 00451 g005
Figure 6. Bootstrapped Pearson’s correlation between tree-ring width and precipitation in the period 1951–2013 (2015) for the different elevations. Months marked by small letters are from the year prior to the growth and capital letters represents the year of the growth. Dark color represents significant correlation at p < 0.05.
Atmosphere 09 00451 g006
Figure 7. GS precipitation and temperature deviations in Kosmaj over the 1951–2013 period. Red line—GS temperature deviation; blue bars—GS precipitation deviation.
Atmosphere 09 00451 g007
Figure 8. GS precipitation and temperature deviations in Vrsacki Breg over the 1951–2013 period. Red line—GS temperature deviation; blue bar—GS precipitation deviation.
Atmosphere 09 00451 g008
Figure 9. GS precipitation and temperature deviations in Lopare over the 1951–2013 period.Red line—GS temperature deviation; blue bar—GS precipitation deviation.
Atmosphere 09 00451 g009
Figure 10. GS precipitation and temperature deviations in Kukavica over the 1951–2013 period. Red line—GS temperature deviation; blue bar—GS precipitation deviation.
Atmosphere 09 00451 g010
Figure 11. GS precipitation and temperature deviations in Istocna Boranja over the 1951–2013 period. Red line—GS temperature deviation; blue bar—GS precipitation deviation.
Atmosphere 09 00451 g011
Figure 12. GS precipitation and temperature deviations in Mrkonjic Grad over the 1951–2013 period. Red line—GS temperature deviation; blue bar—GS precipitation deviation.
Atmosphere 09 00451 g012
Table 1. Sampling sites in the Republic of Serbia and the Republic of Srpska.
SiteAltitude (m)Coordinates
Fruska Gora (FG)417N 45°08′09.0″
E 19°38′29.4″
LOW
Kosmaj (KO)600N 44°27′57.4″
E 20°34′00.5″
Vrsacki Breg (VB)583N 45°07′55.4″
E 21°24′52.3″
Lopare (LO)353N 44°41′35.2″
E 18°48′28.2″
Srbac (SR)252N 45°05′23.2″
E 17°37′55.2″
Istocna Boranja (IB)823N 44°21′26.4″
E 19°16′43.4″
OPT
Zeljin (ZE)1170N 43°30′00.2″
E 20°46′56.3″
Kukavica (KU)885N 42°48′35.1″
E 21°53′39.9″
Vlasenica (VL)1050N 44°10′06.0″
E 18°55′10.0″
Mrkonjic Grad (MG)1030N 44°23′53.5″
E 17°03′46.21″
Golija (GO)1580N 43°19′49.1″
E 20°14′29.0″
UPP
Vlasina (V)1600N 42°35′38.4″
E 22°15′57.5″
Stara Planina- Babin zub (BZ)1640N 43°22′23.0″
E 22°36′41.4″
Jahorina (JA)1335N 43°41′36.0″
E 18°38′30.0″
Istocni Drvar (ID)1569N 44°23′36.0″
E 16°37′30.0″
Table 2. Deviation of temperature (Dt) and precipitation (DH) for selected climatological periods in respect to 1951–1980 reference climatology (GS—growing season).
LocationDeviation for Clim2Deviation for Clim3Deviation for Clim4
YearGSYearGSYearGS
Dt (°C)DH (%)Dt (°C)DH (%)Dt (°C)DH (%)Dt (°C)DH (%)Dt (°C)DH (%)Dt (°C)DH (%)
FG0.0−4.50.1−3.20.2−3.70.21.30.51.00.75.6
KO0.0−2.30.0−3.80.2−1.70.10.20.6−2.50.7−3.3
VB−0.2−0.7−0.20.60.0−0.7−0.15.90.3−1.80.41.7
LO−0.1−0.40.00.70.1−2.10.10.40.42.70.64.5
SR−0.1−1.70.0−1.20.1−4.80.2−1.30.5−2.80.70.1
IB0.0−0.90.0−1.00.2−0.60.10.70.62.70.72.2
ZE−0.1−1.8−0.1−3.90.1−1.80.0−1.70.5−1.60.6−3.7
KU−0.2−2.8−0.3−5.0−0.2−3.5−0.3−1.60.2−1.50.2−2.8
VL−0.12.90.02.30.13.50.14.40.57.30.76.3
MG−0.22.6−0.13.00.10.60.13.90.41.80.71.6
GO0.00.80.00.30.25.80.17.10.67.60.74.6
VS−0.1−3.6−0.1−6.50.0−7.90.1−8.40.3−4.00.4−7.9
BZ0.0−5.80.0−7.80.1−6.90.1−5.80.4−6.20.6−7.2
JA−0.13.10.05.90.23.10.25.90.56.60.78.4
ID−0.23.0−0.13.30.12.70.15.40.53.90.72.5
Dark blue (lowest value) = -8.4, dark red (highest value) = 8.4.
Table 3. Coefficient of variation of temperature (Vt) and precipitation (VH) for the selected climatological periods (GS—growing season).
LocationClim1Clim2Clim3Clim4
YearGSYearGSYearGSYearGS
Vt (%)VH (%)Vt (%)VH (%)Vt (%)VH (%)Vt (%)VH (%)Vt (%)VH (%)Vt (%)VH (%)Vt (%)VH (%)Vt (%)VH (%)
FG6.218.24.326.85.016.63.724.66.319.14.824.46.823.84.128.0
KO5.915.84.823.64.516.84.025.16.317.75.423.16.818.54.422.7
VB5.917.64.927.54.618.73.827.26.022.05.026.56.723.94.429.0
LO6.415.24.622.54.913.23.921.96.615.05.321.87.218.74.524.3
SR5.916.14.223.54.915.33.623.66.216.04.823.96.419.54.024.0
IB6.614.44.720.55.012.64.119.87.013.85.718.57.616.54.719.9
ZE6.916.15.422.94.614.04.320.96.914.75.820.37.415.34.919.9
KU7.014.15.724.84.613.04.425.26.016.05.424.96.917.24.722.3
VL8.014.95.821.15.812.24.920.18.414.86.919.68.616.75.520.6
MG8.417.75.825.05.513.94.624.48.514.36.723.38.016.85.219.4
GO10.417.16.724.57.514.65.622.710.515.87.721.310.216.06.120.0
VS10.313.37.022.67.415.05.726.310.619.07.828.69.723.26.126.5
BZ6.513.14.521.14.912.03.822.06.415.84.922.87.517.64.521.8
JA8.016.46.021.75.813.35.219.28.815.67.520.68.316.65.822.2
ID10.218.06.625.57.014.25.425.210.814.37.923.39.815.66.018.9
Dark blue (lowest value) = 3.6, dark red (highest value) = 29.
Table 4. Coefficient of correlation between changes in TRW and temperature and precipitation during the GS.
LocalityPeriodTemperature (°C)Precipitation (mm)
Kosmaj1951–1980−0.40.4Lower limit
1961–1990−0.40.5
1971–2000−0.50.7
1981–2010−0.30.7
Vrsacki Breg1951–1980--
1961–1990−0.10.5
1971–2000−0.40.6
1981–2010−0.40.6
Lopare1951–1980−0.20.2
1961–1990−0.10.3
1971–2000−0.20.6
1981–2010−0.40.6
Kukavica1951–19800.20.2Optimum
1961–19900.20.5
1971–2000−0.20.6
1981–2010−0.40.6
Istocna Boranja1951–19800.10.3
1961–1990−0.10.5
1971–2000−0.40.7
1981–2010−0.40.7
Mrkonjic Grad1951–1980--
1961–1990--
1971–2000--
1981–2010--
Some years are removed in the correlation calculation to obtain a clear signal about the impact of GS average temperature and precipitation on TRW value (Table 4). However, for each location, these years are specifically analyzed.

