Interdecadal Shifts in the Winter Monsoon Rainfall of the Philippines
by
 ,
,
Lyndon Mark Olaguera
1,* ,
,
Jun Matsumoto
1,2,
Hisayuki Kubota
2,3,
Tomoshige Inoue
1,
Esperanza O. Cayanan
4 and
Flaviana D. Hilario
4 1
Department of Geography, Tokyo Metropolitan University, 1-1 Minami-Osawa, Hachioji-Shi, Tokyo 192-0397, Japan
2
Department of Coupled-Ocean-Atmosphere-Land Processes Research, Japan Agency for Marine Earth Science and Technology, Yokosuka, Kanagawa 237-0061, Japan
3
Faculty of Science, Department of Earth and Planetary Sciences, Hokkaido University, Kita-10 Nishi-8, Kita-ku, Sapporo, Hokkaido 060-0810, Japan
4
Philippine Atmospheric, Geophysical and Astronomical Services Administration, Quezon City 1100, Philippines
*
Author to whom correspondence should be addressed.
Atmosphere 2018, 9(12), 464; https://doi.org/10.3390/atmos9120464
Submission received: 30 September 2018
/
Revised: 9 November 2018
/
Accepted: 21 November 2018
/
Published: 26 November 2018
(This article belongs to the Special Issue Monsoons)
Abstract
:This study investigates the interdecadal shifts in the winter monsoon (November to March) rainfall of the Philippines from 1961 to 2008. Monthly analysis of the winter monsoon rainfall shows that the shifts are most remarkable during December. In particular, two interdecadal shifts are identified in the December rainfall time series around 1976/1977 and 1992/1993. To facilitate the examination of the possible mechanisms leading to these shifts, the analysis period is divided into three epochs: 1961–1976 (E1), 1977–1992 (E2), and 1993–2008 (E3). The mean and interannual variability of rainfall during E2 are suppressed compared with the two adjoining epochs. The shift around 1976/1977 is related to the phase shift of the Pacific Decadal Oscillation (PDO) from a negative phase to a positive phase and features an El Niño-like sea surface temperature (SST) change over the Pacific basin, while that around 1992/1993 is related to a La Niña-like SST change. Further analysis of the largescale circulation features shows that the decrease in the mean rainfall during E2 can be attributed to the weakening of the low-level easterly winds, decrease in moisture transport, and decrease in tropical cyclone activity. In addition, the suppressed interannual variability of rainfall during E2 can be partly attributed to the El Niño-like SST change and the weakening of the East Asian winter monsoon.
1. Introduction
It is undeniable that rainfall is of paramount importance to agricultural countries such as the Philippines. The country’s cropping calendar, for example, relies heavily on the availability of water resources and the timing of the rainy season. However, it is known that rainfall exhibits multi-scale spatio-temporal variabilities that can have devastating impacts on agriculture, food security, and the economy of the country.
In recent decades, a lot of research has been devoted to understanding the decadal-to-interdecadal variabilities of rainfall [1,2,3,4,5,6,7,8]. Variabilities at these time scales can modulate atmospheric circulations at higher frequencies (e.g., interannual) that have important ramifications for the predictability of rainfall [9,10]. Sen Roy et al. [10], for example, showed that the positive (negative) phase of the Pacific Decadal Oscillation (PDO), which is a well-known decadal climate variability, reduces (enhances) the monsoon rainfall over India by modulating the effects of the El Niño-Southern Oscillation (ENSO). In addition, Wang et al. [11] showed that the relationship between ENSO and the East Asian winter monsoon (EAWM) is stronger and significant during the negative phase of PDO. Using a combination of long-term records of tropical cyclone (TC) tracks from the Philippine Weather Bureau and the Joint Typhoon Warning Center (JTWC), Kubota and Chan [12] found that the annual number of landfalling TCs over the Philippines decreases (increases) during the negative phase of PDO and El Niño (La Niña) years. The phase shift (i.e., from positive to negative or vice versa) of these decadal-to-interdecadal climate variabilities often leads to remarkable shifts in the rainfall time series.
Over the Asia-Pacific monsoon region, many studies have documented significant decadal-to-interdecadal shifts in rainfall. One such prominent shift occurred in the late 1970s, which has been associated with the phase shift of the PDO from a negative phase to a positive phase [1,2,3,4]. Numerical simulations of Wang and An [4] showed that the properties (i.e., period, amplitude, or spatio-temporal structure) of the ENSO remarkably changed following this shift. They further suggested that the decadal changes in the surface winds and ocean surface layer dynamics altered the ENSO properties. In addition, another interdecadal shift in the Asian summer monsoon has been detected around the mid-1990s, which features a La Niña-like sea surface temperature (SST) change over the Pacific basin [5,6,7]. It has been suggested that this SST change in the mid-1990s can partially explain the advanced Asian summer monsoon onset [5,7] and delayed withdrawal of the autumn rainy season in Vietnam [6]. Several studies also found interdecadal shifts in the autumn and winter rainfall in the recent decades over East Asia and Vietnam [6,13,14,15,16]. For example, Zhou and Wu [16] found a significant shift in the winter rainfall in northwest China around 1986/1987. They suggested that this shift is associated with the increase in SST over the North Atlantic Ocean after 1987. Meanwhile, Wang and He [17] reported a weakening of the EAWM-ENSO relationship after the 1970s. They suggested that the Indo-Pacific SST variability was suppressed after the 1970s. Nguyen-Le and Matsumoto [6] found a significant interdecadal shift in the rainfall of Vietnam during December around 1992/1993, which led to the delayed withdrawal of its autumn rainy season.
The Philippines, which is located on the western periphery of the Pacific Ocean, is part of the Asia-Pacific monsoon region. The rainfall of the country has a strong seasonality and spatial contrast due to its heterogeneous topography. In particular, the rainy season over the western coast occurs from May to September (summer monsoon) and followed by a dry season, while the eastern coast experiences its rainy season from November to March (winter monsoon) [18,19,20,21]. Recently, a number of studies found long-term changes in the rainfall and temperature of the Philippines [19,22,23,24,25,26,27,28]. For example, Cruz et al. [25] found decreasing rainfall trends during the summer monsoon season (June to September) in stations located over the western coast of the country from 1961–2010. A similar drying tendency was reported by Villafuerte et al. [26] but for the January to March season, while Cinco et al. [24] found a warming tendency in the annual mean and daily minimum temperatures across the country. Bagtasa [27] found increasing annual trends in the tropical cyclone (TC)-induced rainfall since the year 2000. Olaguera et al. [29] found a significant interdecadal shift in the summer monsoon rainfall over the western coast of the Philippines during its mature phase (i.e., early August to early September) after the mid-1990s. They suggested that the further westward extension of the western North Pacific Subtropical High (WNPSH) during 1994–2008 promotes lower level divergence in the vicinity of the country, which is unfavorable for synoptic-scale disturbances.
In this study, we addressed the following issues:
- (1)
- While there are many studies that have investigated the variability (i.e., long-term trends and interdecadal shift) of the summer monsoon rainfall of the Philippines [19,22,23,24,25,26,27,28,29], the variability of the winter monsoon rainfall has received less attention. According to Assuncion and Jose [30], the winter monsoon accounts for 38% of the total annual rainfall in the Philippines, while the summer monsoon accounts for about 43%, suggesting that the rainfall contribution of the winter monsoon is equally important with that from the summer monsoon. Thus, this study is part of our ongoing endeavor to fill this research gap.
- (2)
- Previous studies such as Cruz et al. [24] and Villafuerte et al. [25] focused on the changes in the annual and seasonal mean of rainfall and temperature. However, it is known that rainfall also exhibits strong subseasonal variabilities [8,29]. For example, Olaguera et al. [29] found a robust interdecadal shift in the summer monsoon rainfall of the Philippines from early August to early September. They further noted that this interdecadal shift is not robust in other summer monsoon months (i.e., May to July). In this study, we found that the significant interdecadal shifts are most remarkable during December compared with the other winter monsoon months. This month corresponds to the peak of the winter rainy season in stations located above 10° N (see Figure 3d of Kubota et al. [31]) on the eastern coast of the country. This month is also the peak planting season of rice and maize that are major agricultural products in the Philippines [32,33]. Because of the potential vulnerability of these agriculture products to the interdecadal shifts in rainfall, it is thus necessary to investigate the mechanisms leading to these shifts. This is critical for agricultural planning and management of water resources.
The rest of the paper is organized as follows. The datasets and methodology used in this study are presented in Section 2. Section 3 presents the interdecadal variability of the winter monsoon rainfall in the Philippines and the possible mechanisms leading to such variability. Summary and discussions are presented in Section 4.
2. Data Sources and Methodology
2.1. Data Sources
In this study, we utilized the following datasets:
- (1)
- Daily rainfall data from the period 1961 to 2008 and from the 32 stations of the Philippine Atmospheric, Geophysical, and Astronomical Services Administration (PAGASA) across the Philippines. These stations are illustrated in Figure 1. Because of the heterogeneous topography and strong monsoon influence, the climate of the Philippines has been originally divided into four climate types [34,35]. The first climate classification of the country was done by Coronas [34] based on the average monthly rainfall distribution of different stations across the country from 1903 to 1918. He grouped the rainfall distributions into four types: two types under the prevalence of the summer and winter monsoons and two intermediate types. He considered a dry month as a month with less than 50 mm of rainfall, although a month with more than 100 mm can still be considered as a dry month if it comes after three or more very dry months. Kintanar [35] adapted the same criteria for climate classification for the period 1951 to 1980 and instead of using the average monthly rainfall, he used the modal of the yearly climate types. That is, the rainfall distribution type for each year is determined and the most frequent type during the 30-year period is considered as the final climate type. He was able to identify four climate types similar to those of Coronas [34]. However, these studies used old datasets and their results may no longer be applicable for the present climate of the Philippines. Recently, Villafuerte et al. [36] performed a climate classification based on hierarchical clustering of the climatological pentad-mean rainfall time series from 1971 to 2013. They found three dominant climate types as shown in Figure 1. We adapted this climate classification because it is more updated. The average monthly rainfall amounts from 1961 to 2008 in each station and climate type are shown in Figure 2. Stations that belong to climate Type I (red circles) have a pronounced dry season from November to April and a wet season for the rest of the year, as shown in Figure 2a. The rainy season of stations that belong to climate Type II (blue circles) starts around October and lasts until February, as shown in Figure 2b, while stations that belong to climate Type III (yellow circles) have no pronounced maximum rainfall periods and rainfall is more or less distributed throughout the year, as shown in Figure 2c. Based on this three-climate type classification, Tacloban station belongs to climate Type II. However, based on the Kintanar’s [35] climate classification, this station belongs to climate Type IV (i.e., stations with no pronounced rainfall peak and rainfall is or less evenly distributed throughout the year). We also checked the climatological monthly rainfall distribution of this station from 1961 to 2008 and found that it has a similar rainfall distribution with climate Type II stations. These inconsistencies further motivated us to use the classification by Villafuerte et al. [36] instead of the Kintanar’s [35] classification.
- (2)
- Daily Zonal (U) and meridional (V) components of the winds, vertical velocity, relative humidity (RHUM), geopotential height (HGT), and specific humidity (Q) at multiple levels from the Japan Meteorological Agency (JMA) 55-year reanalysis with 1.25° × 1.25° grid resolution (JRA55) [37].
- (3)
- TC best track data from the Joint Typhoon Warning Center (JTWC) [38]. We only considered the TC that entered the Philippine Area of Responsibility (PAR; 115° to 135° E and 5° N to 25° N) and above the tropical storm categories (TS; maximum wind speed above 17.5 m s−1).
- (4)
- Monthly SST with 1° × 1° grid resolution from the Hadley Center Global Sea Ice Sea Surface Temperature data version 1.1 (HadISST1) [39].
2.2. Methodology
In this study, we used the moving t-test [13,40,41] with varying time windows (i.e., 9, 10, 12, and 15 years) in detecting the shifts. A significant shift corresponds to the year in which the largest absolute t-statistic exceeding the 95% confidence level occurs and should be consistent with the different time windows. We also used the Energy Divisive (E-Divisive) method proposed by Matteson and James [42] to supplement this test. This E-Divisive method is based on hierarchical clustering or hierarchical divisive estimation and detects any distributional changes in a given time series. Multiple change points are estimated by iteratively applying a single detection algorithm in each of the clusters. The distributions of the clusters are compared using a divergence measure based on Euclidian distances, which can determine whether two independent samples are identically distributed. The significance of an estimated change point is determined through a permutation test. The data within each cluster are permuted to construct a new sequence of observations. In this study, we resampled the data by 1000 times for the permutation test. The null hypothesis for the permutation test is that there are no more additional change points. Additional details about this test can be found in Matteson and James [42]. The change points detected by these two tests are the same, suggesting that the detected shifts are robust. Since rainfall does not follow a normal distribution and the data contains missing values, we used a bootstrapped t-test [43] in estimating the significance of the difference in the rainfall means. For the other variables, we used an ordinary t-test.
In generating the TC frequency plot in each epoch, we counted the same TC (i.e., similar identification number) in each 5° × 5° grid box only once and divided it by the total number of years (16 years). In addition, the genesis point indicates the location where the TC first attained a TS category.
3. Results
3.1. Shifts in Rainfall
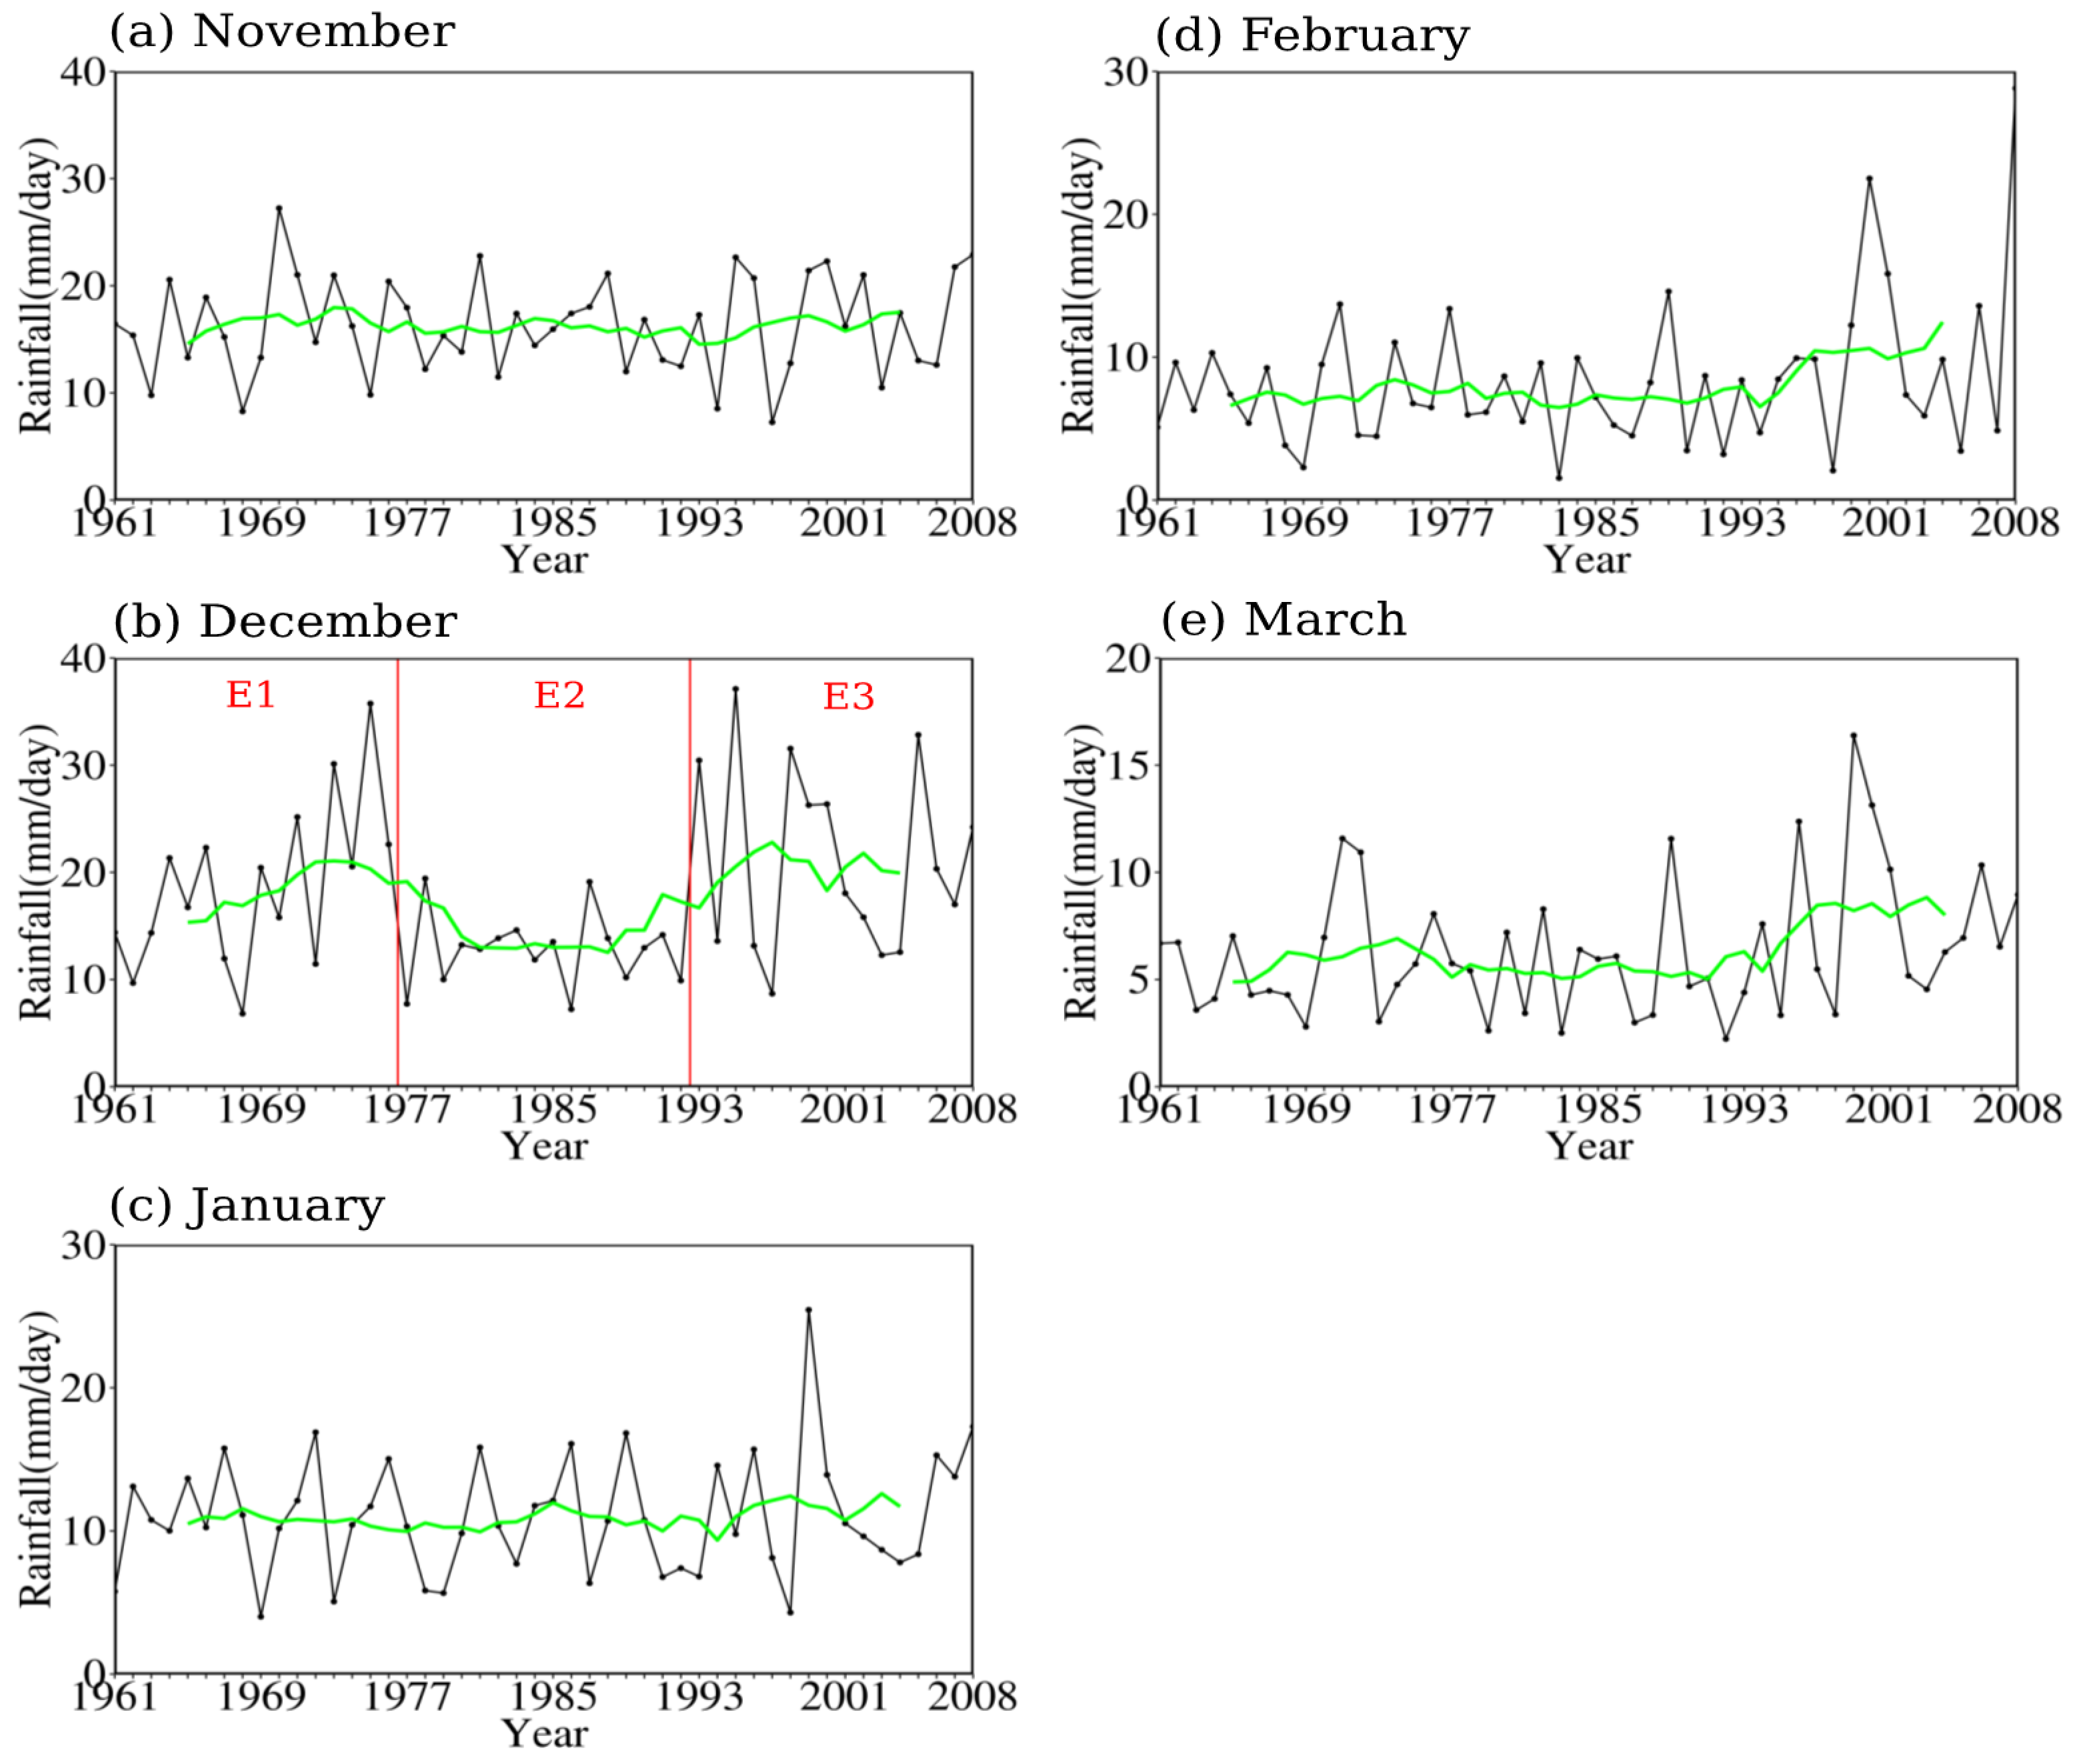
Figure 3 shows the average monthly rainfall time series of climate Type II stations, as shown in Figure 1, from the period 1961 to 2008 during the winter monsoon season (i.e., November to March). These stations are currently used by PAGASA in monitoring the winter monsoon over the Philippines [31] because of their geographical location or exposure to the prevailing easterly/northeasterly winds during this season. Remarkable interdecadal shifts can be seen during December, as shown in Figure 3b, with suppressed rainfall and decreased interannual variation from the late 1970s to the mid-1990s. In particular, we found that the interdecadal shifts occurred around 1976/1977 and 1992/1993. These shifts are significant above the 95% confidence level, as shown in Figure S1. In contrast, the shift around 1976/1977 is not remarkable in other winter monsoon months, as shown in Figure 3a,c–e. To confirm this, we also performed the running t-test in these months and the results are illustrated in Figure S2. There are no significant change points detected during November, January, and February. During March, however, a change point exceeding the 90% confidence level occurred around 1996/1997. Note that in this manuscript, we defined a more stringent criterion for the change point detection (i.e., it should exceed the 95% confidence limit) and this month does not satisfy this condition. These results highlight the importance of sub-seasonal variabilities of rainfall in decadal-to-interdecadal climate studies. In the succeeding sections, we focus our analysis on December since the interdecadal shifts are most remarkable during this month and divide the time series into three epochs: 1961–1976, (hereafter, E1), 1977–1992 (hereafter, E2), and 1993–2008 (hereafter, E3). To confirm the robustness of these shifts, we also examined the epochal differences in other stations across the country.
Figure 4 shows the interpolated epochal difference in rainfall from E1 to E2 (E2 minus E1) as shown in Figure 4a, and from E2 to E3 (E3 minus E2) as shown in Figure 4b. A decrease in rainfall can be depicted over the Philippines except in central Mindanao Island from E1 to E2, as shown in Figure 4a, and the significant rainfall difference can be depicted in 13 stations (40% of the total number of stations). On the other hand, all stations show an increase in rainfall from E2 and E3 and the significant difference can be depicted in 23 stations, as shown in Figure 4b. Interestingly, the differences in rainfall over Catarman and Hinatuan stations (climate Type II stations) are not significant. The large interannual variability of their respective time series (figure not shown) is probably the reason why the shifts are not significant. The geographical location of the station can also affect the significance of the differences in rainfall. In particular, most of the stations on the western coast of the country do not show significant difference in rainfall. The stations such as Laoag, Dagupan, and Iba are located on the leeward side during the winter monsoon season and have very little rainfall (the average monthly rainfall in these stations from 1961 to 2008 is less than 1 mm day−1). Baguio station, on the other hand, shows a robust signal since it is in an elevated location (~1500 m). All of the 13 stations with a significant decrease in rainfall from E1 to E2 show a significant increase in rainfall from E2 to E3, as shown by the stars with red outlines in Figure 3. We confirmed that the time series of December rainfall in each of the 13 stations including their regional average and change points are similar to that in Figure 3b, as shown in Figure S3. Thus, in the succeeding sections, we only use these 13 stations in the regional analysis. The average rainfall amounts across these stations during E1, E2, and E3 are 10.7, 6.2, and 11.8 mm day−1, respectively. The corresponding variances are 27.5, 4.1, and 35.4 mm2 day−2 during E1, E2, and E3, respectively. The difference in rainfall between E1 and E2 (E2 and E3) is significant at the 95% (99%) confidence level by bootstrapping, while the differences in the variances between E1 and E2 as well as E2 and E3 are both significant at the 99% confidence level by F-test.
3.2. Possible Influencing Factors
In this section, we examine the similarities and differences in the mean circulations between the three epochs and the possible mechanisms leading to the interdecadal shifts in rainfall.
3.2.1. Changes in the Low-Level Winds
In the climatological mean sense, northeasterly to easterly winds (trades) are apparent between 5–20° N during December [44,45,46]. Thus, we first compare the epochal means of 850-hPa winds (WINDS850hPa) and HGT850hPa in Figure 5. During E1, as shown in Figure 5a, strong low-level easterlies (~12 m s−1) can be seen east of 125° E (along 10–20° N). During E2, as shown in Figure 5b, however, the low-level easterlies weaken (~8 m s−1). In addition, northeasterlies appear to dominate over the eastern coast of the Philippines in E2 compared with E1. This is partly induced by the eastward extension of the 1530-m HGT850hPa near 135° E. Another important feature is the weakening of the equatorial trough as indicated by the 1500-m HGT850hPa, which is located further south below 10° N in the same epoch. During E3, as shown in Figure 5c, on the other hand, the low-level easterlies intensify and reach some parts of Luzon Island, which is consistent with Nguyen-Le and Matsumoto [6]. The northeasterlies over the South China Sea (SCS) also intensify and extend from the northern tip of Luzon Island to the southern Indochina Peninsula. The changes in the zonal winds appear to be a manifestation of the changes in the SST over the Pacific basin. For instance, it is known that the trade winds weaken (intensify) during El Niño (La Niña) conditions. A similar weakening of zonal winds during the summer monsoon was reported by Xiang and Wang [7] (see their Figure 12), which they suggested to be related to the PDO shift after the late 1970s. These points will be further discussed later.
3.2.2. Changes in Moisture Transport
Previous studies have shown that the changes in rainfall are directly associated with the changes in moisture transport [29,45,47]. Thus, in this section, we examine the possible role of the changes in the vertically integrated moisture flux (VMF) and moisture flux divergence (VMFD).
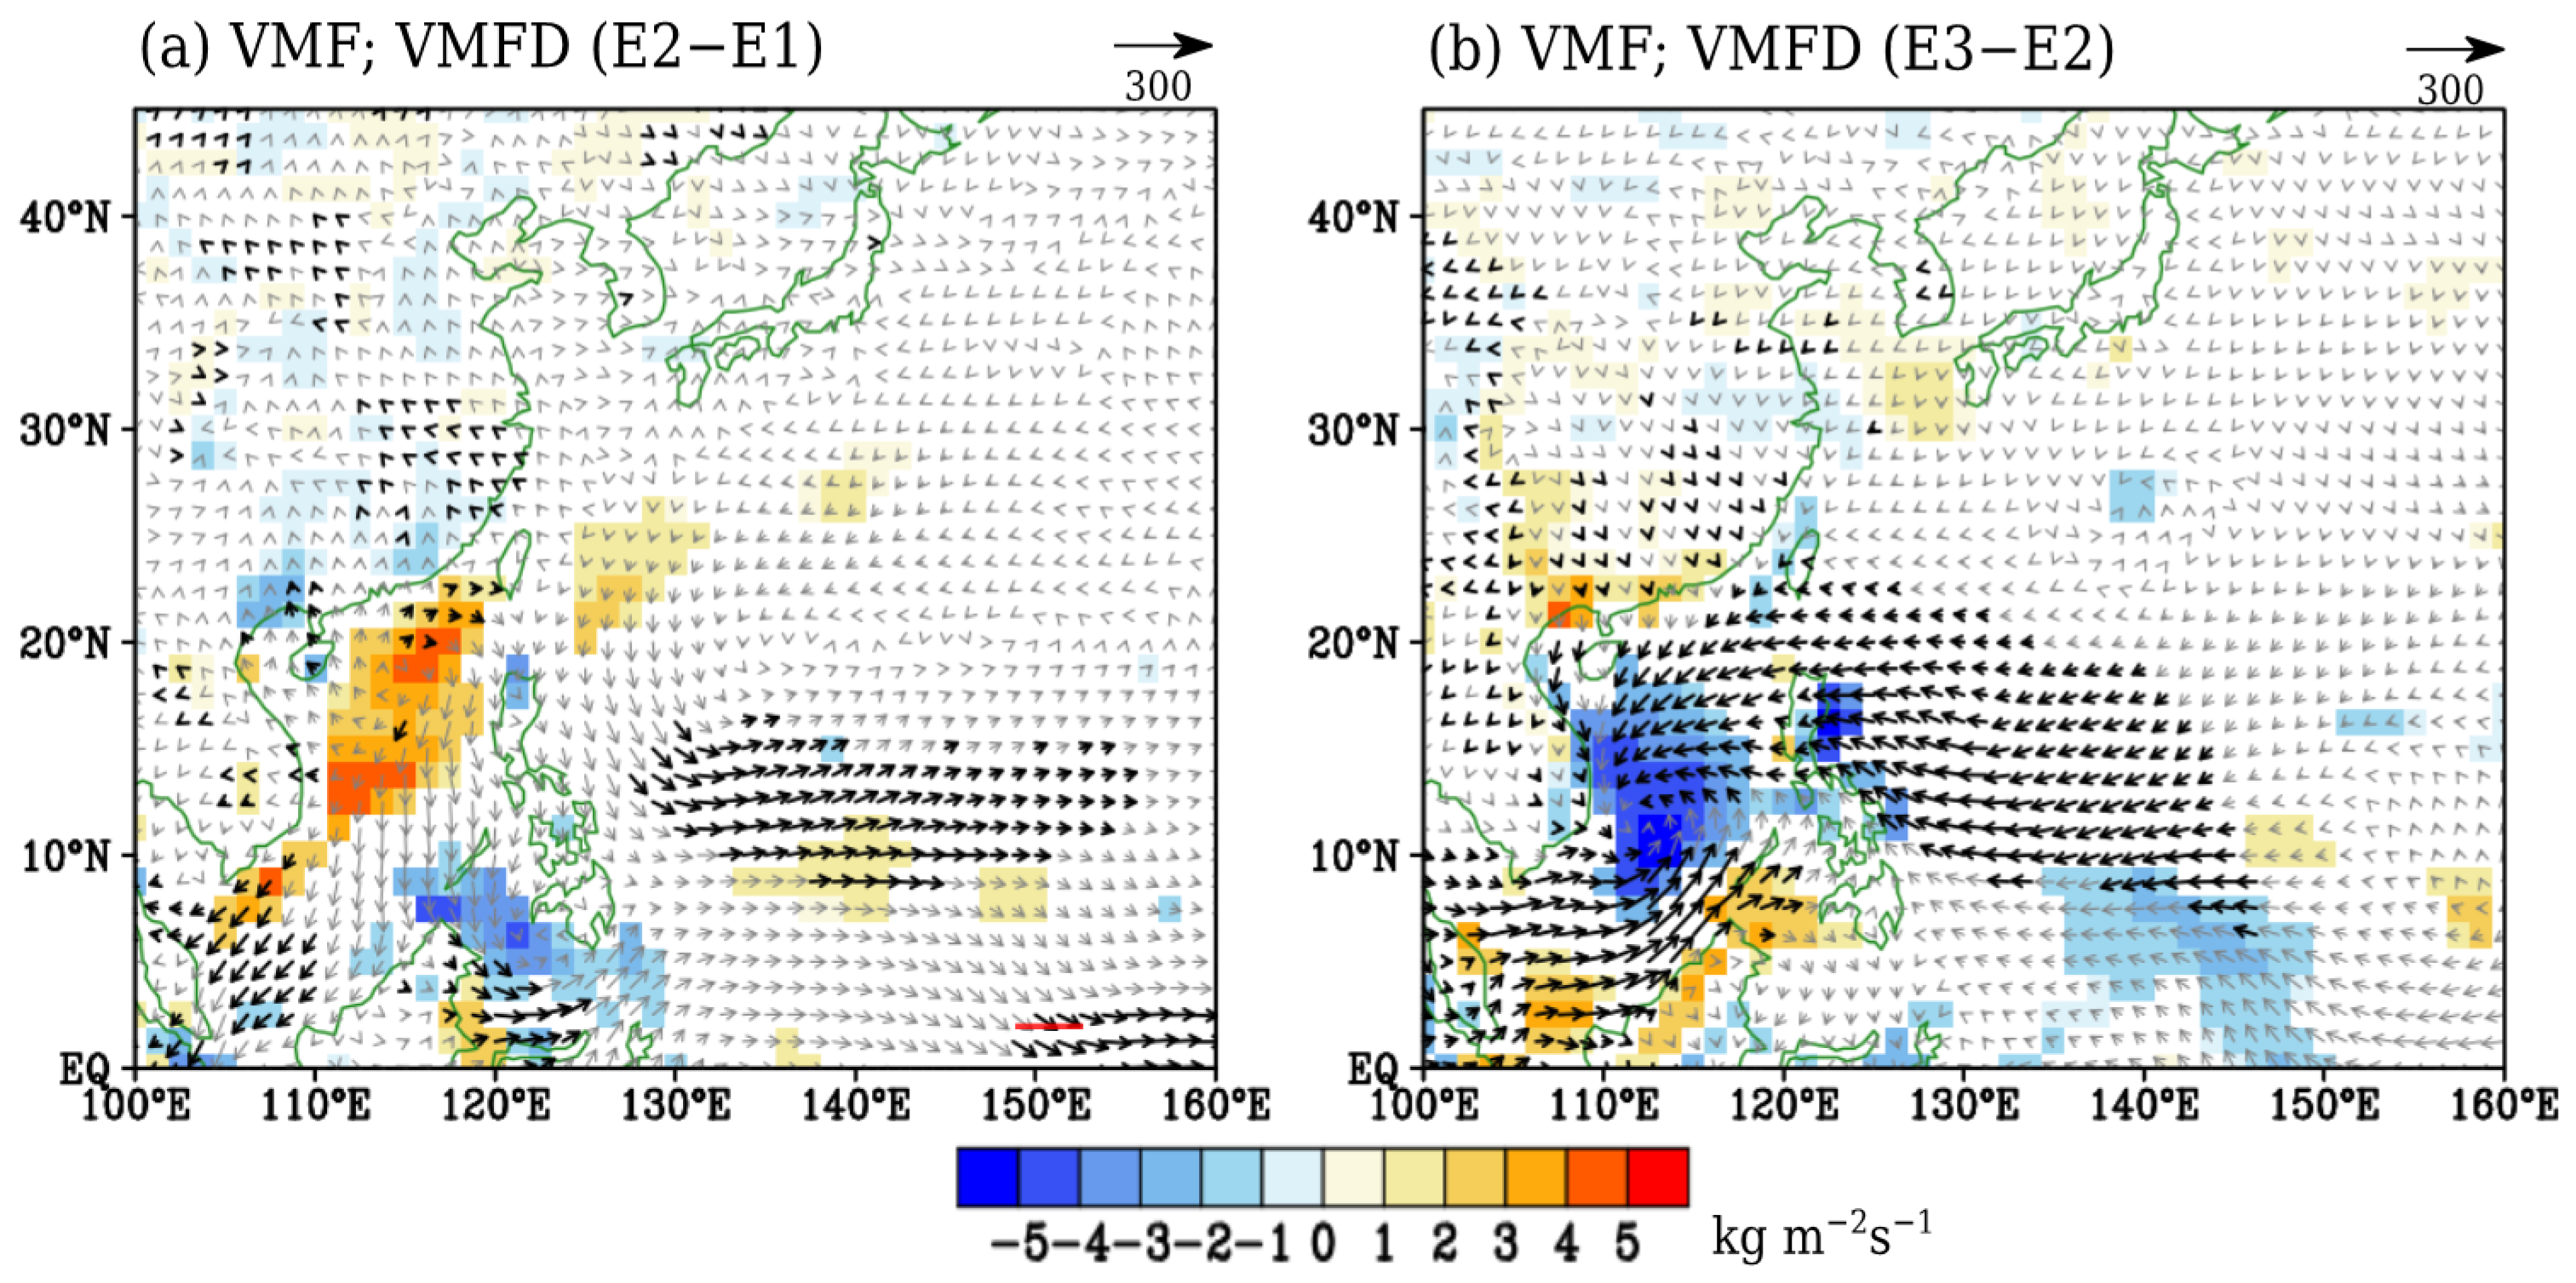
Figure 6 shows the epochal difference in VMF and VMFD integrated from 1000 hPa to 300 hPa. The difference in VMF between E1 and E2 (E2 minus E1) as shown in Figure 6a, features an anticyclonic circulation and enhanced divergence over the SCS along 18° N that can be associated with the increase in HGT850hPa there, as shown in Figure 4a,b, and a cyclonic circulation change centered around 135° E, 20° N to the east of the Philippines. The Philippines is located just between these two opposing circulation changes, which resulted in less moisture transport. An anticyclonic circulation over the SCS may inhibit synoptic-scale disturbances and meander the TC tracks from the western North Pacific (WNP) [29,48,49]. Another remarkable feature in Figure 6a is the enhanced cyclonic circulation centered around 122° E, 5° N. This cyclonic circulation is part of the monsoon trough that progressed southwards during the winter monsoon season [50,51]. It enhanced the divergent winds (i.e., the northerly component of the moisture flux) of the anticyclone over the SCS. In contrast, the epochal difference of VMF between E2 and E3 features a cyclonic circulation and enhanced convergence (i.e., negative VMFD) over the SCS and eastern coast of the Philippines above 10° N, which is consistent with Nguyen-Le and Matsumoto [6], as shown in Figure 6b. Nguyen-Le and Matsumoto [6] further suggested that the background conditions might have been favorable for the enhancement of moisture convergence over this area.
3.2.3. Changes in TC Activity
Tropical cyclone activity also contributes to the variability of the winter rainfall over the Philippines [27,48]. In general, TCs contribute about 20% to 50% to the total mean annual rainfall over the eastern coast of the country [27,48]. Cinco et al. [28] examined the annual trends in the number of TCs that entered the PAR from the period 1951 to 2013 and found decreasing trends in the number of landfalling TCs over the Philippines. Based on their monthly TC frequency analysis, they also showed that, on the average, the number of landfalling TCs during December is larger than that from January to May. Recently, Nguyen-Le and Matsumoto [6] found that the number of TCs passing through the southern SCS increased during December from 1993 to 2006. Motivated by these findings, we examined the possible role of the changes in the TC activity and determine the possible factors inducing the said changes in this section.
The TC frequency and tracks in each epoch are shown in Figure 7. The total number of TCs that entered the PAR are 15, 21, and 25 during E1, E2, and E3, respectively. During E1, as shown in Figure 7a, the number of TCs that made landfall over the Philippines is around 0.2 to 0.3 per year. During E2, as shown in Figure 7b, the number of TCs increased over the eastern coast of the Philippines (0.3 per year) and along 130° E (0.9 per year). On the other hand, the number of TCs that made landfall in E3, as shown in Figure 7c, increased to about 0.4 to 0.7 per year. The TCs during E2 appear to be short-lived and less TCs reach the Indochina Peninsula compared with E1, as shown in Figure 7e, and E3, as shown in Figure 7f. The genesis location of TCs in E1 mostly occurs near 130° E while that in E2 and E3 occurs further east near the dateline. This is probably related to the differences in the location of the warm SST in the equatorial Pacific. We compared the mean SST between the three epochs, as shown in Figure S4, and found that the warm SST extends further eastward near 120° W in both E2 and E3. In addition, during E1, four TCs are generated over the SCS, while only one is generated during E2. The TCs during E2 recurves more along 130° E compared with E1 and E3. Also, more TCs cross the Philippines and SCS between 10–15° N during E3.
These changes in the TC tracks might be related to the changes in the steering flow. Takahashi and Yasunari [52] noted that the steering flow is best depicted at 4–5 km (600–500 hPa level). Following their study, we also use the circulations at 600 hPa (WINDS600hPa and HGT600hPa) to depict the TC steering flow in Figure 7d to f. The magnitude of the HGT600hPa during E1 is lower by about 10 m compared with the other epochs. This strengthening of the WNPSH after the late 1970s has been noted in previous studies [53]. We used the 4405-m contour line to represent the WNPSH during E1, while using the 4415-m contour line for E2 and E3. During E1, as shown in Figure 7d, the western ridge of the WNPSH is located along 120° E. During E2, as shown in Figure 7e, however, it appears to split into two cells along 120° E. According to Wu et al. [54] (see their Figure 3), such splitting of the WNPSH allows TCs to recurve more towards Japan and the Korean Peninsula and consequently, less TC landfall over the Philippines. During E3, as shown in Figure 7f, the western ridge of WNPSH further extends westward along 115° E, which resulted in more TCs making landfall over the Philippines.
Moreover, synoptic-scale disturbances that are weaker than TCs, such as tropical depressions and extra-tropical cyclones, can also bring rainfall [29,52,55]. In this study, we used the perturbation kinetic energy (PKE) of the low-level winds (850 hPa) to represent these disturbances. This also supplements the changes in the TC activity since TCs may be underestimated during the pre-satellite period. The PKE is defined as: , where u′ and v′ are the perturbations obtained by subtracting an 11-day running mean from the daily U850hPa and V850hPa, respectively, while the overbar indicates the monthly average of the daily PKE values. Generally, synoptic scale disturbances do not last longer than 11 days. Thus, the 11-day running mean can represent the low-frequency component of the kinetic energy equation [56]. The synoptic-scale disturbances can be expressed as the deviation from this low-frequency component, although there are other ways of representing these disturbances, such as the deviation from a bandpass filtered anomaly with periodicities of about 2 to 8 days [57].
Figure 8 shows the average PKE in each epoch and the corresponding epochal differences. During E1, as shown in Figure 8a, the PKE over the western coast of the Philippines including the SCS is around 10–14 m2 s−2, while that over the eastern coast is between 16–20 m2 s−2. However, during E2, as shown in Figure 8b, the PKE over the western coast decreased, while the PKE over the eastern coast increased. The decrease in PKE between E1 and E2 is significant above the 90% confidence level, as shown in Figure 8d. The changes in PKE are also consistent with the TC frequency change in Figure 7. On the other hand, during E3, as shown in Figure 8c, the PKE increased over the western coast and decreased over the eastern coast, as shown in Figure 8e. These changes in the PKE over the SCS is consistent with Nguyen-Le and Matsumoto [6], who reported an increase in the intraseasonal oscillations at different frequencies (e.g., 5, 12–24, and 30–60 day) during 1993–2006.
To further elaborate what induced the observed changes in the synoptic-scale disturbances including the TC activity in the vicinity of the Philippines, we examined the changes in the dynamic and thermodynamic parameters that are essential for TC activity [29]. Figure 9 shows the epochal difference in 500-hPa vertical velocity, 700-hPa RHUM, and vertical zonal wind shear, which is defined as the difference between the zonal winds at a 200-hPa (U200hPa) and 850-hPa level (U850hPa). An anomalous descent, as shown in Figure 9a, in the vicinity of the Philippines is accompanied by a decrease in RHUM, as shown in Figure 9b, with the significant change located along a southwest-northeast tilted region from the SCS to Luzon Island and mainland Japan. The difference in the vertical zonal wind shear between E1 and E2, as shown in Figure 9c, shows a significant increase over the Philippines including the SCS and the Indochina Peninsula. In other words, the background conditions became unfavorable for synoptic-scale disturbances during E2. In contrast, there is an increase in RHUM between E2 and E3 over the SCS and the Philippines, as shown in Figure 9e, which is accompanied by a mid-tropospheric ascent over the same area, as shown in Figure 9d, and a decrease in vertical zonal wind shear, as shown in Figure 9f, west of 120° E. These results suggest favorable background conditions for synoptic-scale disturbances during E3 [29].
3.2.4. Impact of SST
It is known that ENSO modulates the interannual variability of rainfall over the Philippines [25,48,58,59,60]. For example, Villafuerte et al. [25] found that El Niño (La Niña) events are associated with drier (wetter) conditions over the country especially in seasons close to the mature stage of ENSO. Thus, in this section, we determine the possible role of the changes in SST to the interdecadal shifts in rainfall.
Figure 10a,b show the epochal differences in SST and 10-m winds (WINDS10m). The SST change between E1 and E2, as shown in Figure 10a, shows an El Niño-like pattern or a positive phase of the PDO, which is consistent with Nitta and Yamada [2]. Warmer SST can be depicted over the equatorial central Pacific and the Indian Ocean, while cooler SST appears over the northern Pacific. This SST change tends to weaken the trade winds as indicated by the enhanced westerlies east of the Philippines, as shown in Figure 4. On the other hand, the SST change between E2 and E3, as shown in Figure 10b, shows a La Niña-like pattern, with cooler SST over the equatorial central Pacific and warmer SST over the western Pacific similar to previous studies [6,7]. The SST change over the Indian Ocean shows warming but the change is not as significantly uniform as that between E1 and E2. Easterlies can be depicted from the equatorial central and eastern Pacific to the western Pacific including the Philippines. Westerlies strengthen over the equatorial Indian Ocean, which is probably induced by the descending branch of the strengthened Walker circulation over the western Pacific [61] (see their Figure 14).
The El Niño-like SST change over the Pacific basin may also affect TC landfalls. For instance, Wu et al. [54] found that fewer TCs follow a west-northwestward track and consequently, a smaller number of TC landfalls over the Philippines during the late season of El Niño years. They suggested that the southeastward shift of the genesis location over the WNP and a break in the WNPSH around 130° E during El Niño years are favorable for more recurving TCs. As we have noted earlier, we also found a similar splitting tendency of the WNPSH along 120° E in Figure 7e. Thus, the El Niño-like SST change over the equatorial Pacific in E2 can partly explain the observed changes in the steering flow and TC tracks.
We have also noted that the interannual variability of rainfall during December decreased remarkably during E2, as shown in Figure 3b. To address this issue, we compare the time series of rainfall and SST anomaly (SSTA) over the Niño 3.4 region (170° W–120° W, 5° S–5° N) in Figure 9c. The anomalies are the deviations from the long-term mean (1961–2008). One remarkable feature in the time series of SSTA is that there are fewer occurrences of cold years (i.e., SSTA < 0) and more warm years (SSTA > 0) during E2 compared with the other epochs. The correlation between the December rainfall and the Niño 3.4 SSTA is high and significant above the 99% confidence level (r = −0.5, p = 0.0008). This result suggests that the El Niño-like SST change (i.e., more occurrence of warm years) over the Pacific basin partly contributed in suppressing the interannual variability of December rainfall over the Philippines. This is also consistent with the results of Lyon and Camargo [58], who reported a significant reduction in rainfall over the entire Philippines during the October to December season (OND) and El Niño years. They further noted that an anticyclonic circulation anomaly develops over the SCS, which is accompanied by a weaker monsoon trough.
4. Summary and Discussion
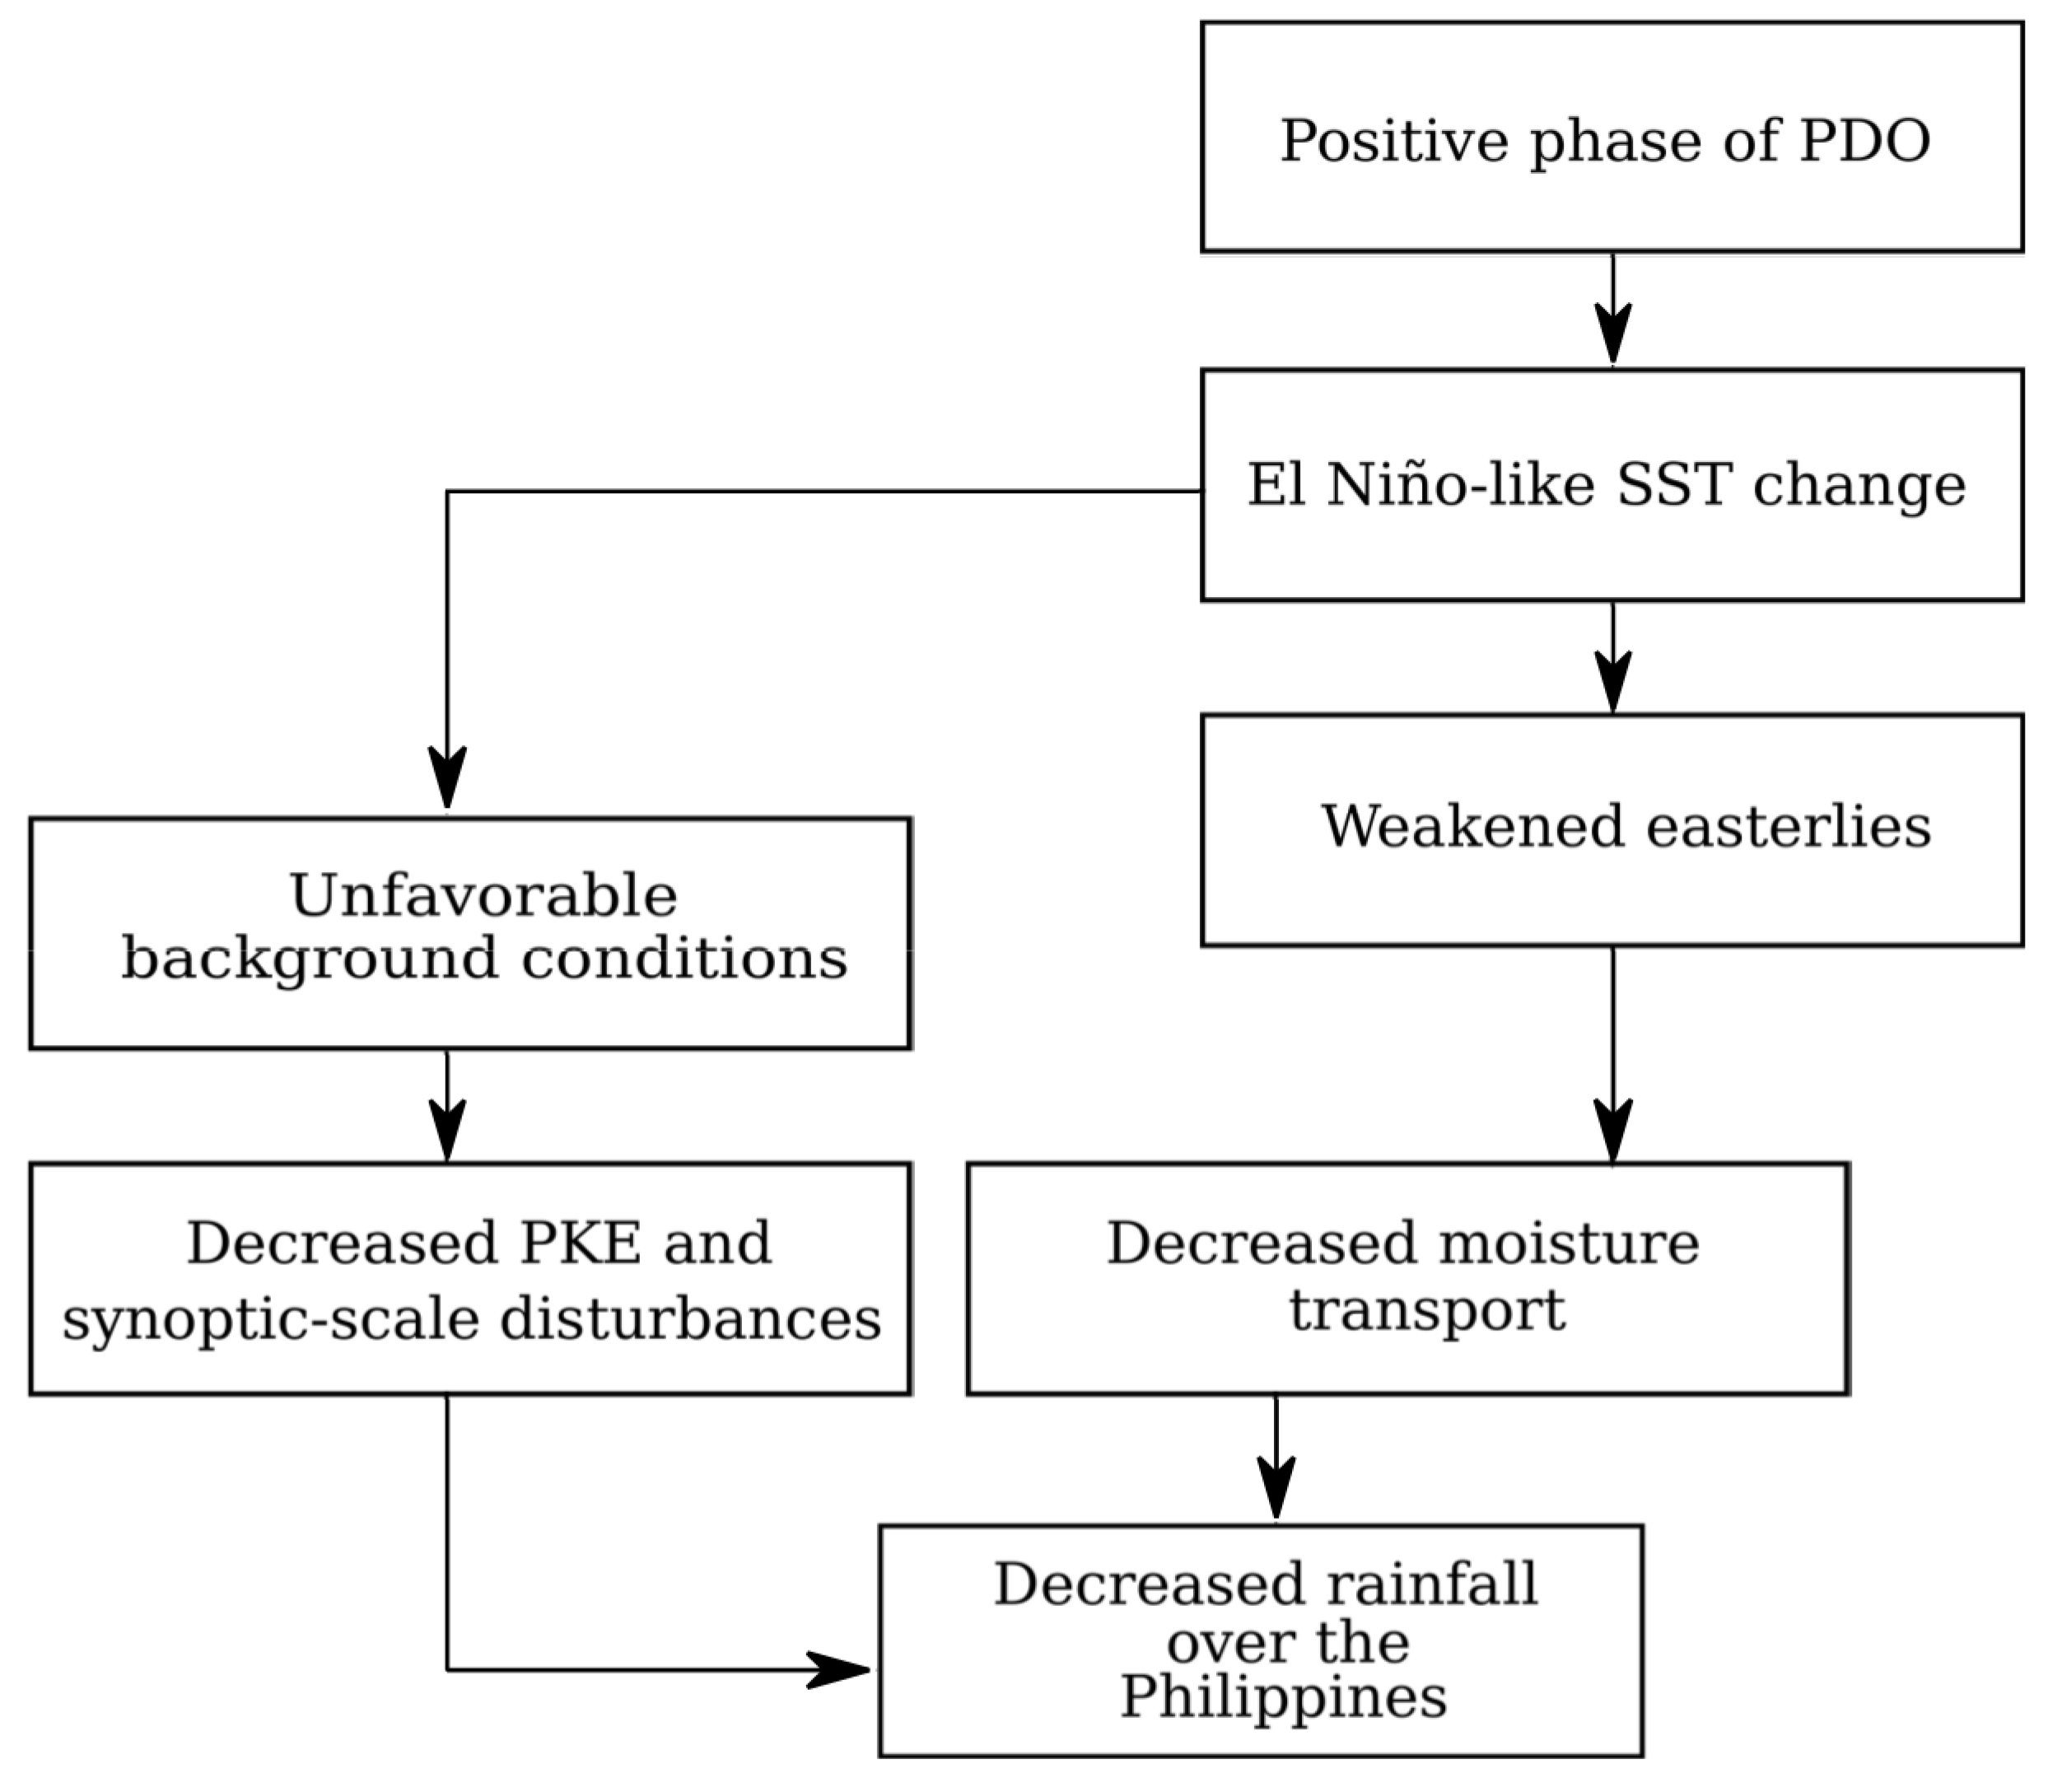
In this study, we investigated the interdecadal shifts in the winter monsoon (November to March) rainfall of the Philippines from 1961 to 2008. Monthly analysis of the winter monsoon rainfall showed that the interdecadal shifts are only robust and significant during December. This month actually coincides with the peak planting season in most parts of the country. Therefore, an understanding of the mechanisms leading to these interdecadal shifts in December rainfall are crucial for agriculture. Furthermore, the significant interdecadal shifts in the December rainfall time series occurred around 1976/1977 and 1992/1993. These shifts are very clear in 40% of the total stations used in this study. To facilitate the examination of the possible mechanisms leading to these rainfall shifts, we divided the analysis period into three epochs: 1961–1976 (E1), 1977–1992 (E2), and 1993–2008 (E3). The average rainfall and its interannual variability are significantly suppressed (enhanced) during E2 (E3). The schematic diagrams summarizing the possible mechanisms leading to the suppressed rainfall during E2 and enhanced rainfall during E3 are shown in Figure 11 and Figure 12, respectively.
The shift around 1976/1977 is probably related to the shifting of the PDO from a negative phase to a positive phase [62,63,64,65]. The time series of the PDO index [66] for December is shown in Figure 13, where the shift from negative to positive in the late 1970s is clear. However, the shift in PDO around 1993/1994 is not remarkable, which suggests that a different mechanism induces the shift in the mid-1990s. The positive phase of PDO is characterized by an El Niño-like SST change over the equatorial central Pacific [2]. As we have previously noted, the low-level easterlies (i.e., the surface branch of the Walker circulation) are weaker during El Niño conditions resulting in less moisture transport over the Philippines.
Moreover, the TC frequency has decreased over the SCS in E2 compared with E1 and E3. Liu and Chan [67] examined the annual TC frequency over the WNP with at least a TS category from the period 1960 to 2011 and found an inactive period during 1975–1988 (see their Figure 1). Thus, the suppressed TC activity identified by Liu and Chan [67] may be related to the suppressed TC activity found in this study. Their study also showed a remarkable increase in the vertical zonal wind shear during the period 1975–1988, which corroborated the enhanced vertical zonal wind shear during E2 found in this study. The SST warming over the Indian Ocean can induce a lower-level divergence (anticyclonic circulation) over the SCS, which is also unfavorable for TC formation [49]. However, the SST warming over the Indian Ocean appears in both of the difference plots in Figure 10, suggesting that the decrease in TC activity over the SCS cannot be solely explained by the SST warming over the Indian Ocean. To further clarify this issue, we examined the changes in the vertical velocity, RHUM, and vertical zonal wind shear that influences TC activity. In particular, a mid-tropospheric descent, decrease in RHUM, and an enhanced vertical zonal wind shear over the SCS and the Philippines occurred during E2. These changes are unfavorable for synoptic-scale disturbances, which is substantiated by the decrease in the perturbation kinetic energy (PKE).
What induced these unfavorable background conditions during E2? The decrease in RHUM can be partly attributed to the weakening of the low-level easterly winds. We also checked the changes in the U200hPa and found significant enhancement (weakening) of the upper-level westerlies between the equator and 30° N between E1 and E2 (figure not shown; E2 and E3). It should be noted that during El Niño conditions, the Walker circulation is weakened over the western Pacific; that is, an upper-level convergence and lower-level divergence appears over the western Pacific. Thus, the weakened low-level easterlies and enhanced upper-level westerlies can partly explain the enhanced vertical zonal wind shear during E2. In general, the unfavorable background conditions leading to decreased synoptic-scale disturbances over the Philippines are induced by the El Niño-like SST change during the positive phase of PDO. Moreover, the changes in the TC tracks show fewer TCs reaching the SCS and the Indochina Peninsula and more recurving TCs over the eastern coast of the country in E2. We found that this is due to the changes in the steering flow, where the WNPSH tended to split into two cells around the Philippines, which is favorable for more recurving TCs towards East Asia.
The shift in rainfall around 1992/1993 is probably a response to the La Niña-like SST change over the Pacific basin, which enhanced the low-level easterly winds and consequently, led to enhanced moisture transport over the eastern coast of the Philippines during E3 [6,68]. Using numerical simulations, Zhang and Karnauskas [68] further noted that the prominent warming contrast between the Pacific, Indian, and Atlantic Oceans play a major role in enhancing the low-level easterly winds. During La Niña conditions, the Walker circulation is enhanced over the western Pacific. We also checked the epochal difference in the U200hPa between E2 and E3 and found significant upper-level easterlies (i.e., divergence), which can explain the weakened vertical zonal wind shear during E3 (not shown). The TC activity also increased during E3. In particular, more TC made landfall over the Philippines due to the westward extension of the WNPSH. Wu et al. [54] noted that the monsoon trough and the WNPSH shifts westward during La Niña years leading to more westward/northwestward moving TCs. In other words, the La Niña-like SST change during 1992/1993 induced favorable background conditions for increased synoptic-scale disturbances over the Philippines.
Aside from the decrease in the mean rainfall in December, its interannual variability was significantly reduced in E2 compared with the other epochs. It is well known that ENSO significantly contributes to the interannual variability of rainfall over the Philippines. The epochal difference in SST features an El Niño-like SST change between E1 and E2 (E2 minus E1) and a La Niña-like SST change between E2 and E3 (E3 minus E2). Further examination of the time series of SSTA averaged over the Niño 3.4 region from the period 1961 to 2008 showed more occurrence of warm years (i.e., positive SSTA) during E2. We also found that the December rainfall is significantly correlated with the Niño 3.4 SSTA, which suggests that the El Niño-like SST change over the Pacific basin partly contributed to the decreased interannual variability of rainfall during E2.
Wang and He [17] found a decreasing trend in the interannual variability of the EAWM during the December to February (DJF) season after the mid-1970s. They further noted a northward propagation of the EAWM-surface air temperature relationship from the tropics to the mid-latitudes, which is favorable for the weakening of the EAWM-ENSO relationship. Wang et al. [11] suggested that this weakening of the EAWM-ENSO relationship is also associated with the phase shift of PDO through the modification of the Pacific-East Asian teleconnection at the low latitudes and the response of the HGT anomalies to ENSO. Over the Philippines, Villafuerte et al. [25] found decreasing trends in extreme rainfall events during the January to February (JFM) season and they suggested that this is partly due to the weakening of the EAWM. Thus, the weakening of the interannual variability of the December rainfall found in this study might be related to these aforementioned studies.
To quantify the possible role of the EAWM on the changes in rainfall, we adapted the index proposed by Wang and Chen [69] (hereafter EAWMI), which is based on the difference between the normalized area-averaged mean sea level pressure (MSLP) over Siberia (70°–120° E, 40°–60° N), North Pacific (140° E–170° W, 30°–50° N), and the maritime continent (110°–160° E, 20° S–10° N). Positive (negative) EAWMI values indicate strong (weak) EAWM. This index can be decomposed further into the north-south (i.e., Siberian high-Maritime Continent low relationship) and east-west (i.e., Siberian high-Aleutian low relationship) components. In this study, we only used the north-south component since the circulation anomalies below 30° N were found to be stronger when using this index compared to its east-west counterpart [69]. In addition, we checked the epochal difference in the MSLP and only found significant changes over Siberia and the Maritime continent, as shown in Figure S5. Thus, using the north-south index is reasonable.
Figure 14 shows the monthly EAWMI from November to March. The correlation of the rainfall and the EAWMI during December is significant above the 99% confidence level using t-test (r = 0.5, p-value = 0.00047). This result further reveals that the EAWM also contributes to the interannual variability of the winter monsoon rainfall over the Philippines. The time series of the EAWMI during December, as shown in Figure 14b, shows remarkable and strong negative values from the period 1977 to 1992, while it only became clearer after 1987 during January, as shown in Figure 14c. These results suggest that the clear weakening of the EAWM during December in the late 1970s can partly explain why the decrease in rainfall is apparent during this month.
How did the weakening of the EAWM contribute to the decrease in rainfall over the Philippines during E2? It is worth mentioning that the interaction of the northeasterly winds or cold surges from Siberia with the topography of the Philippines partially contributes to the total winter rainfall of the country [44]. Endo et al. [70] found a significant increasing trend in the annual maximum number of consecutive dry days (CDD) from the 1950s to the mid-2000s, especially over the eastern coast of the Philippines (see their Figure 6). They suggested that this might be due to the weakening of the EAWM and a subsequent decrease in the cold surge activity from Siberia. In fact, we found a significant decrease in the MSLP between E1 and E2 over Siberia in Figure S5, suggesting a weaker Siberian High. In addition, Wang et al. [71] noted that an anomalous anticyclonic circulation (i.e., the western North Pacific anticyclone or WNPAC) develops over the Philippines during the positive phase of PDO (see their Figure 3a). This WNPAC, in turn, weakens the northeast monsoon over the Philippines.
Why are the climate shifts only remarkable during December? Some studies suggested that the PDO can modulate the climate anomalies resulting from ENSO [72]. In particular, Gershunov and Barnett [72] found that El Niño signals are stronger and more consistent during the positive phase of PDO, while the La Niña signals are only stronger and consistent during the negative phase of PDO. On the other hand, ENSO (either El Niño or La Niña) usually peaks in December [73,74]. Hence, the impact of PDO is more pronounced during this month. We also compared the MSLP and the WINDS850hPa anomalies relative to their long-term means (1961–2008) from November to March to further elaborate why the observed decrease in the mean rainfall are not remarkable in other winter monsoon months during E2, as shown in Figure 15. During November, as shown in Figure 15a, anomalous northerly winds can be seen in the vicinity of the Philippines emanating from the mid-latitude anticyclone centered around 115° E and 40° N (i.e., the Siberian High). These anomalous northerlies cool the sea surface of the SCS, which is favorable for the increase in the pressure there and a subsequent development of an anticyclone during December (i.e., the WNPAC) as shown in Figure 15b [71,75,76]. Wu et al. [75,76] suggested that these anomalous northerlies are induced by the heating anomaly over the central equatorial Pacific (i.e., a Rossby wave response) and advect negative moist enthalpy (dry air; see their Figure 13). Note that the Philippines is also under the influence of a cyclonic circulation anomaly to its east during November. Concurrent with the development of the WNPAC during December is the eastward retreat of this cyclonic circulation anomaly [75,76]. According to Wu et al. [75,76], this eastward retreat of the cyclonic anomaly is modulated by the sign reversal (from positive to negative) of the background relative vorticity gradient. Southerlies/southwesterlies can also be seen above 20° N along 115° E, which substantiates the weakening of the Siberian High and less cold surge activities reaching the Philippines. It is worth mentioning that the MSLP change in the vicinity of the Philippines is largest during December compared with the other winter monsoon months. During January, as shown in Figure 15c, there is little change in the MSLP and a cyclonic circulation can be seen over the Philippines. The anticyclone initially located over the SCS moved northeastward around 35° N and expands eastward along 160° W. Another remarkable feature in January is the cyclonic circulation centered around 170° W and 55° N, which expands and moves southeastward over the northern Pacific in February, as shown in Figure 15d. This, in turn, forces the anticyclonic circulation that is initially located northeast of the Philippines to move southwards. During March, as shown in Figure 15e, an anomalous anticyclone is prominent over the WNP.
Another interesting feature worthy of note is that the shift in December rainfall around 1976/1977 is almost symmetric (i.e., appears reversed) to the shift around 1992/1993. In fact, the average rainfall between E1 (10.7 mm day−1) and E3 (11.8 mm day−1) are not significantly different. However, we found notable differences in the circulation patterns between these epochs. For example, the epochal difference in December SST in Figure 10a is not exactly the reverse of Figure 10b, where warming is both observed west of 160° E. In addition, the mean December SST during E2 and E3 are both warmer than in E1 especially over the eastern equatorial Pacific, as shown in Figure S4. The warm SST (i.e., the 28 °C contour line) also expands further eastward near 120° W in the same epochs compared with E1. As previously noted, the WNPSH as well as the zonal winds, are stronger during E3 compared with E1.
Aside from ENSO, TCs, and the orographic rainfall, the winter monsoon rainfall variability of the country is influenced by other large-scale systems. For example, Pullen et al. [77] reported that the Madden–Julian Oscillation (MJO; intraseasonal) and an intense cold surge (synoptic) contributed to the extreme rainfall event over the Philippines during 2007–2008. Therefore, it would be interesting to examine the interdecadal variations in intraseasonal oscillations and cold surge activities and how they contributed to the shifts in rainfall in future studies. Moreover, several interesting issues still remain unresolved. For instance, are the observed interdecadal changes due to the climate’s natural decadal variability or anthropogenically induced? Another important issue is that whether these shifts will be permanent or will still change in the future. In addition, the precise impact of PDO-ENSO interaction on the rainfall of the Philippines needs further investigation; that is, the response of rainfall to the different phases of PDO during El Niño and La Niña years. Longer and homogenous datasets are needed to address this issue in future studies.
Supplementary Materials
The following are available online at https://www.mdpi.com/2073-4433/9/12/464/s1, Figure S1: Time series of: (a) average rainfall during December in stations located over the eastern coast of the Philippines with relatively complete data from period 1961–2008 (see text for the list of stations); and (b) tau statistics from the moving t-test with varying time windows. The green line in (a) indicates the 9-year running average. The vertical lines in (a,b) indicates the robust change points around 1976/1977 and 1992/1993. The horizontal lines in (a,b) indicate the statistical significance at the 95% confidence level for each time window: green (9-y; 2.120), grey (10-y; 2.101), blue (12-y; 2.074), and black (15-y; 2.048); Figure S2: Time series of tau statistics from the moving t-test with varying time windows for: (a) November; (b) January; (c) February; and (d) March. The horizontal lines from (a) to (d) indicate the statistical significance at the 90% and 95% confidence level for each time window; Figure S3: As in Figure S1 but only for the 13 stations across the Philippines with significant shifts around 1976/1977 and 1992/1993; Figure S4: Epochal mean of December SST above 26 °C during (a) E1 (1961–1972); (b) E2 (1977–1992); and (c) E3 (1993–2008). The contour interval is 1 °C; Figure S5: Epochal difference in mean sea level pressure (hPa) during December between (a) E1 (1961–1976) and E2 (1977–1992) (E2 minus E1); and (b) E2 and E3 (1993–2008) (E3 minus E2). Stippled areas indicate statistical significance above the 90% confidence level using the t-test. The boxes indicate the area averaging location for the East Asian winter monsoon index: Siberian high (SH), Aleutian low (AL), and Maritime Continent (MC) low.
Author Contributions
L.M.O. proposed the topic, conceived, designed, and carried out the experimental study. J.M., H.K., T.I., E.O.C., and F.D.H. helped in the analysis and interpretation of the data provided through E.O.C. of PAGASA. All authors read and approved the final manuscript.
Funding
Lyndon Mark Olaguera and Jun Matsumoto were supported by the Tokyo Human Resources Fund at Tokyo Metropolitan University from the Tokyo Metropolitan Government. Jun Matsumoto and Hisayuki Kubota were supported by Grant-in-Aid for Scientific Research No. (25282085,15KK0030,18H05307; PI HK), No. (26220202; PI JM), No. 18058043, No. 16H04053, No. 16H03116 and Young Scientific Research No. (21684028; PI HK) funded by the Japan Society for the Promotion of Science (JSPS). This research was also supported by the Science and Technology Research Partnership for Sustainable Development (SATREPS) funded by the Japan Science and Technology Agency (JST) and Japan International Cooperation Agency (JICA), and the e-ASIA Joint Research Program, funded by JST.
Acknowledgments
We would like to thank Marcelino Q. Villafuerte II and Vivien Esquivel of PAGASA for the useful discussion regarding the climate classification and winter monsoon of the Philippines. The authors are also grateful to Loryjean Canillo and Rex Abdon Jr. of PAGASA for providing copies of the climate report by Assuncion and Jose (1980) and shapefiles of the modified Coronas’ climate classification. The authors are also grateful to Emilio Gozo of the Manila Observatory for the assistance in generating the tropical cyclone density plot. Finally, we are very grateful to our anonymous reviewers for their insightful comments and suggestions that helped improve the manuscript.
Conflicts of Interest
The authors declare no conflict of interest.
References
- Mantua, N.J.; Hare, S.R.; Zhang, Y.; Wallace, J.M.; Francis, R.C. A pacific interdecadal climate oscillation with impacts on salmon production. Bull. Am. Meteorol. Soc. 1997, 78, 1069–1079. [Google Scholar] [CrossRef]
- Nitta, T.; Yamada, S. Recent warming of tropical sea surface temperature and its relationship to the northern hemisphere circulation. J. Meteorol. Soc. Jpn. 1989, 67, 375–383. [Google Scholar] [CrossRef]
- Trenberth, K.E. Recent observed interdecadal climate changes in the northern hemisphere. Bull. Am. Meteorol. Soc. 1990, 71, 988–993. [Google Scholar] [CrossRef]
- Wang, B.; An, S.I. Why the properties of El Niño changed during the late 1970s. Geophys. Res. Lett. 2001, 28, 3709–3712. [Google Scholar] [CrossRef] [Green Version]
- Kajikawa, Y.; Wang, B. Interdecadal change of the South China Sea summer monsoon onset. J. Clim. 2012, 25, 3207–3218. [Google Scholar] [CrossRef]
- Nguyen-Le, D.; Matsumoto, J. Delayed withdrawal of the autumn rainy season over central Vietnam in recent decades. Int. J. Climatol. 2016, 36, 3002–3019. [Google Scholar] [CrossRef]
- Xiang, B.; Wang, B. Mechanisms for the advanced Asian summer monsoon onset since the mid-to-late 1990s. J. Clim. 2013, 26, 1993–2009. [Google Scholar] [CrossRef]
- Inoue, T.; Matsumoto, J. Abrupt climate changes observed in late August over central Japan between 1983 and 1984. J. Clim. 2007, 20, 4957–4967. [Google Scholar] [CrossRef]
- Goswami, B.N. The Asian monsoon: Interdecadal variability. In The Asian Monsoon; Springer: Berlin/Heidelberg, Germany, 2006; pp. 295–327. ISBN 978-3-540-40610-5. [Google Scholar]
- Sen Roy, S.; Goodrich, G.B.; Balling, R.C., Jr. Influence of El Niño/southern oscillation, Pacific decadal oscillation, and local sea-surface temperature anomalies on peak season monsoon precipitation in India. Clim. Res. 2003, 25, 171–178. [Google Scholar] [CrossRef]
- Wang, L.; Chen, W.; Huang, R. Interdecadal modulation of PDO on the impact of ENSO on the East Asian winter monsoon. Geophys. Res. Lett. 2008, 35, L20702. [Google Scholar] [CrossRef]
- Kubota, H.; Chan, J.C.L. Interdecadal variability of tropical cyclone landfall in the Philippines from 1902 to 2005. Geophys. Res. Lett. 2009, 36, L12802. [Google Scholar] [CrossRef]
- Choi, J.W.; Lee, S.W.; Lim, B.H.; Kim, B.J. Interdecadal change of winter precipitation over southern China in late 1990s. J. Meteorol. Soc. Jpn. 2016, 94, 197–213. [Google Scholar] [CrossRef]
- Hung, C.W.; Kao, P.K. Weakening of the winter monsoon and abrupt increase of winter rainfalls over northern Taiwan and southern China in the early 1980s. J. Clim. 2010, 23, 2357–2367. [Google Scholar] [CrossRef]
- Jia, X.; Ge, J. Interdecadal changes in the relationship between ENSO, EAWM, and the winter precipitation over China at the end of the twentieth century. J. Clim. 2017, 30, 1923–1937. [Google Scholar] [CrossRef]
- Zhou, L.T.; Wu, R. Interdecadal variability of winter precipitation in northwest China and its association with the north Atlantic SST change. Int. J. Climatol. 2015, 35, 1172–1179. [Google Scholar] [CrossRef]
- Wang, H.; He, S. Weakening relationship between East Asian winter monsoon and ENSO after mid-1970s. Chin. Sci. Bull. 2012, 57, 3535–3540. [Google Scholar] [CrossRef] [Green Version]
- Akasaka, I.; Morishima, W.; Mikami, T. Seasonal march and its spatial difference of rainfall in the Philippines. Int. J. Climatol. 2007, 27, 715–725. [Google Scholar] [CrossRef] [Green Version]
- Akasaka, I. Interannual variations in seasonal march of rainfall in the Philippines. Int. J. Climatol. 2010, 30, 1301–1314. [Google Scholar] [CrossRef]
- Moron, V.; Lucero, A.; Hilario, F.; Lyon, B.; Robertson, A.W.; DeWitt, D. Spatio-temporal variability and predictability of summer monsoon onset over the Philippines. Clim. Dyn. 2009, 33, 1159. [Google Scholar] [CrossRef]
- Chen, T.C.; Tsay, J.D.; Matsumoto, J.; Alpert, J. Impact of summer monsoon westerlies in the South China Sea tropical cyclone genesis in May. Weather Forecast. 2017, 32, 925–947. [Google Scholar] [CrossRef]
- Akasaka, I.; Kubota, H.; Matsumoto, J.; Cayanan, E.O.; de Guzman, R.G.; Hilario, F.D. Seasonal march patterns of the summer rainy season in the Philippines and their long-term variability since the late twentieth century. Prog. Earth Planet. Sci. 2018, 5, 20. [Google Scholar] [CrossRef] [Green Version]
- Cinco, T.A.; de Guzman, R.G.; Hilario, F.D.; Wilson, D.M. Long-term trends and extremes in observed daily precipitation and near surface air temperature in the Philippines for the period 1951–2010. Atmos. Res. 2014, 145, 12–26. [Google Scholar] [CrossRef]
- Cruz, F.T.; Narisma, G.T.; Villafuerte, M.Q., II; Chua, K.U.; Olaguera, L.M. A climatological analysis of the southwest monsoon rainfall of the Philippines. Atmos. Res. 2013, 122, 609–616. [Google Scholar] [CrossRef]
- Villafuerte, M.Q., II; Matsumoto, J.; Akasaka, I.; Takahashi, H.; Kubota, H.; Cinco, T.A. Long-term trends and variability of rainfall extremes in the Philippines. Atmos. Res. 2014, 137, 1–13. [Google Scholar] [CrossRef]
- Villafuerte, M.Q., II; Matsumoto, J.; Kubota, H. Changes in extreme rainfall in the Philippines (1911–2010) linked to global mean temperature and ENSO. Int. J. Climatol. 2015, 35, 2033–2044. [Google Scholar] [CrossRef]
- Bagtasa, G. Contribution of tropical cyclones to rainfall in the Philippines. J. Clim. 2017, 30, 3621–3633. [Google Scholar] [CrossRef]
- Cinco, T.A.; de Guzman, R.; Ortiz, A.M.; Delfina, R.J.; Lasco, R.D.; Hilario, F.D.; Juanillo, E.L.; Barba, R.; Ares, E.D. Observed trends and impacts of tropical cyclones in the Philippines. Int. J. Climatol. 2016, 36, 4638–4650. [Google Scholar] [CrossRef]
- Olaguera, L.M.; Matsumoto, J.; Kubota, H.; Inoue, T.; Cayanan, E.O.; Hilario, F.D. Abrupt climate shift in the mature rainy season of the Philippines in the mid-1990s. Atmosphere 2018, 9, 350. [Google Scholar] [CrossRef]
- Assuncion, J.F.; Jose, A.M. A Study of the Characteristics of the Northeast and Southwest Monsoons in the Philippines; PAGASA: Quezon City, Philippines, 1980; p. 29.
- Kubota, H.; Shirooka, R.; Matsumoto, J.; Cayanan, E.O.; Hilario, F.D. Tropical cyclone influence on the long-term variability of the Philippines summer monsoon onset. Prog. Earth Planet. Sci. 2017, 4, 27. [Google Scholar] [CrossRef]
- Gerpacio, R.V.; Labios, J.D.; Labios, R.V.; Diangkinay, E.I. Maize in the Philippines: Production Systems, Constraints, and Research Priorities; CIMMYT: Texcoco, Mexico, 2004; pp. 1–38. ISBN 970–648–123–0. [Google Scholar]
- Mapping Rice in the Philippines-When. Available online: http://www.webcitation.org/73TjcjIj7 (accessed on 27 September 2018).
- Coronas, J. The Climate and Weather of the Philippines, 1903 to 1918; Weather Bureau, Bureau of Printing: Manila, Philippines, 1920; pp. 1–195.
- Kintanar, R.L. Climate of the Philippines; PAGASA: Quezon City, Philippines, 1984.
- Villafuerte, M.Q., II; Juanillo, E.L.; Hilario, F.D. Climatic insights on academic calendar shift in the Philippines. Philipp. J. Sci. 2017, 146, 267–276. [Google Scholar]
- Kobayashi, S.; Ota, Y.; Harada, Y.; Ebita, A.; Moriya, M.; Onoda, H.; Onogi, K.; Kamahori, H.; Kobayashi, C.; Endo, H.; et al. The JRA-55 Reanalysis: General specifications and basic characteristics. J. Meteorol. Soc. Jpn. 2015, 93, 5–48. [Google Scholar] [CrossRef]
- Western North Pacific Ocean best track archive of the Joint Typhoon Warning Center. Available online: http://www.webcitation.org/748KVyx0l (accessed on 23 September 2018).
- Rayner, N.A.; Parker, D.E.; Horton, E.B.; Folland, C.K.; Alexander, L.V.; Rowell, D.P.; Kent, E.C.; Kaplan, A. Global analysis of sea surface temperature, sea ice, and night marine air temperature since the late nineteenth century. J. Geophys. Res. 2003, 108, 4407. [Google Scholar] [CrossRef]
- Wang, T.; Yang, H.; Yang, D.; Wang, Y. Quantifying the streamflow response to frozen ground degradation in the source region of the Yellow River within the Budyko framework. J. Hydrol. 2018, 558, 301–313. [Google Scholar] [CrossRef]
- Yin, Y.; Liu, H.; Yi, H.; Liu, W. Spatiotemporal variation and abrupt change analysis of temperature from 1960 to 2012 in the Huang-Huai-Hai Plain, China. Adv. Meteorol. 2015, 2015, 643493. [Google Scholar] [CrossRef]
- Mattesson, D.S.; James, N.A. A nonparametric approach for multiple change point analysis of multivariate data. J. Am. Stat. Assoc. 2014, 109, 334–345. [Google Scholar] [CrossRef]
- Efron, B.; Tibshirani, R.J. An Introduction to the Bootstrap; Chapman and Hall: New York, NY, USA, 1993; pp. 220–234. ISBN 0-412-04231-2. [Google Scholar]
- Chang, C.P.; Wang, Z.; McBride, J.; Liu, C.H. Annual cycle of southeast Asia-maritime continent rainfall and the asymmetric monsoon transition. J. Clim. 2005, 18, 287–301. [Google Scholar] [CrossRef]
- Hattori, M.; Mori, S.; Matsumoto, J. The cross-equatorial northerly surge over the maritime continent and its relationship to precipitation patterns. J. Meteorol. Soc. Jpn. 2011, 89, 27–47. [Google Scholar] [CrossRef]
- Matsumoto, J. The seasonal changes in the Asian and Australian monsoon regions. J. Meteorol. Soc. Jpn. 1992, 70, 257–273. [Google Scholar] [CrossRef]
- Li, H.Y.; Lin, Z.H.; Chen, H. Interdecadal variability of spring precipitation over south China and its associated atmospheric water vapor transport. Atmos. Ocean. Sci. Lett. 2009, 2, 113–118. [Google Scholar] [CrossRef]
- Kubota, H.; Wang, B. How much do tropical cyclones affect seasonal and interannual rainfall variability over the western North Pacific? J. Clim. 2009, 22, 5495–5510. [Google Scholar] [CrossRef]
- Wang, L.; Huang, R.; Wu, R. Interdecadal variability in tropical cyclone frequency over the South China Sea and its association with the Indian Ocean sea surface temperature. Geophys. Res. Lett. 2013, 40, 768–771. [Google Scholar] [CrossRef] [Green Version]
- Chen, T.C.; Tsay, J.D.; Yen, M.C.; Matsumoto, J. The winter rainfall of Malaysia. J. Clim. 2013, 26, 936–958. [Google Scholar] [CrossRef]
- Chen, T.C.; Tsay, J.D.; Matsumoto, J.; Alpert, J. Development and formation mechanism of the Southeast Asian winter heavy rainfall events around the South China Sea. Part I: Formation and propagation of cold surge vortex. J. Clim. 2015, 28, 1417–1443. [Google Scholar] [CrossRef]
- Takahashi, H.; Yasunari, T. Decreasing trend in rainfall over Indochina Peninsula during the late summer monsoon: Impact of tropical cyclones. J. Meteorol. Soc. Jpn. 2008, 86, 429–438. [Google Scholar] [CrossRef]
- Yun, K.S.; Seo, K.H.; Ha, K.J. Interdecadal change in the relationship between the ENSO and the intraseasonal oscillation in East Asia. J. Clim. 2010, 23, 3599–3612. [Google Scholar] [CrossRef]
- Wu, M.C.; Chang, W.L.; Leung, W.M. Impacts of El Niño-Southern Oscillation events on tropical cyclone landfalling activity in the western North Pacific. J. Clim. 2004, 17, 1419–1428. [Google Scholar] [CrossRef]
- Cayanan, E.O.; Chen, T.C.; Argete, J.C.; Yen, M.C.; Nilo, P.D. The effect of tropical cyclones on southwest monsoon rainfall in the Philippines. J. Meteorol. Soc. Jpn. 2011, 89, 123–139. [Google Scholar] [CrossRef]
- Seiki, A.; Takayabu, Y.N. Westerly wind bursts and their relationship with intraseasonal variations and ENSO. Part II: Energetics over the western and central Pacific. Mon. Weather Rev. 2007, 135, 3346–3361. [Google Scholar] [CrossRef]
- Wu, L.; Zhiping, W.; Ronghui, H.; Renguang, W. Possible linkage between the monsoon trough variability and the tropical cyclone activity over the western North Pacific. Mon. Weather Rev. 2012, 140, 140–150. [Google Scholar] [CrossRef]
- Lyon, B.; Camargo, S.J. The seasonally varying influence of ENSO on rainfall and tropical cyclone activity in the Philippines. Clim. Dyn. 2009, 32, 125–141. [Google Scholar] [CrossRef]
- Lyon, B.; Cristi, H.; Verceles, E.R.; Hilario, F.D.; Abastillas, R. Seasonal reversal of the ENSO rainfall signal in the Philippines. Geophys. Res. Lett. 2006, 33, L24710. [Google Scholar] [CrossRef]
- Ropelewski, C.F.; Halpert, M.S. Global and regional scale precipitation patterns associated with the El Niño/Southern Oscillation. Mon. Weather Rev. 1987, 115, 1606–1626. [Google Scholar] [CrossRef]
- Yamaura, T.; Kajikawa, Y. Decadal change in the boreal summer intraseasonal oscillation. Clim. Dyn. 2016, 45, 3003–3014. [Google Scholar] [CrossRef]
- Hartmann, B.; Wendler, G. The significance of the 1976 Pacific climate shift in the climatology of Alaska. J. Clim. 2005, 18, 4824–4839. [Google Scholar] [CrossRef]
- Jacques-Coper, M.; Garreaud, R.D. Characterization of the 1970s climate shift in South America. Int. J. Climatol. 2015, 35, 2164–2179. [Google Scholar] [CrossRef]
- Kubota, H.; Kosaka, Y.; Xie, S.P. A 117-year long index of the Pacific-Japan pattern with application to interdecadal variability. Int. J. Climatol. 2016, 36, 1575–1589. [Google Scholar] [CrossRef]
- Mantua, N.J.; Hare, S.R. The Pacific decadal oscillation. J. Oceanogr. 2002, 58, 35–44. [Google Scholar] [CrossRef]
- The Pacific Decadal Oscillation Index from the Joint Institute for the Study of the Atmosphere and Ocean. Available online: http://www.webcitation.org/748MhiPTg (accessed on 23 September 2018).
- Liu, K.S.; Chan, J.C.L. Inactive period of western North Pacific tropical cyclone activity in 1998–2011. J. Clim. 2012, 26, 2614–2630. [Google Scholar] [CrossRef]
- Zhang, L.; Karnauskas, K.B. The role of tropical interbasin SST gradients in forcing Walker circulation trends. J. Clim. 2017, 30, 499–508. [Google Scholar] [CrossRef]
- Wang, L.; Chen, W. An intensity index for the East Asian winter monsoon. J. Clim. 2015, 27, 2361–2374. [Google Scholar] [CrossRef]
- Endo, N.; Matsumoto, J.; Lwin, T. Trends in precipitation extremes over southeast Asia. SOLA 2009, 5, 168–171. [Google Scholar] [CrossRef]
- Wang, B.; Zhang, Q. Pacific-East Asian teleconnection. Part II: How the Philippine Sea anomalous anticyclone is established during El Niño development. J. Clim. 2002, 15, 3252–3265. [Google Scholar] [CrossRef]
- Gershunov, A.; Barnett, T.P. Interdecadal modulation of ENSO teleconnections. Bull. Am. Meteorol. Soc. 1998, 79, 2715–2726. [Google Scholar] [CrossRef]
- Ballester, J.; Petrova, D.; Bordoni, S.; Cash, B.; García-Díez, M.; Rodó, X. Sensitivity of El Niño intensity and timing to preceding subsurface heat magnitude. Sci. Rep. 2016, 6, 36344. [Google Scholar] [CrossRef] [PubMed] [Green Version]
- Tziperman, E.; Cane, M.A.; Zebiak, S.E.; Xue, Y.; Blumenthal, B. Locking of El Nino’s peak time to the end of the calendar year in the delayed oscillator picture of ENSO. J. Clim. 1998, 11, 2191–2199. [Google Scholar] [CrossRef]
- Wu, B.; Zhou, T.; Li, T. Atmospheric dynamic and thermodynamic processes driving the western North Pacific anomalous anticyclone during El Niño. Part I: Maintenance mechanisms. J. Clim. 2017, 30, 9621–9635. [Google Scholar] [CrossRef]
- Wu, B.; Zhou, T.; Li, T. Atmospheric dynamic and thermodynamic processes driving the western North Pacific anomalous anticyclone during El Niño. Part II: Formation Processes. J. Clim. 2017, 30, 9637–9650. [Google Scholar] [CrossRef]
- Pullen, J.; Gordon, A.L.; Flatau, M.; Doyle, J.D.; Villanoy, C.; Cabrera, O. Multiscale influences on extreme winter rainfall in the Philippines. J. Geophys. Res.-Atmos. 2015, 120, 3292–3309. [Google Scholar] [CrossRef] [Green Version]
Figure 1.
The location of the 32 stations from the Philippine Atmospheric, Geophysical and Astronomical Serviced Station (PAGASA) and the topography of the Philippines (shading; m). The colors of the circles indicate the climate types based on Villafuerte et al. [36].
Figure 1.
The location of the 32 stations from the Philippine Atmospheric, Geophysical and Astronomical Serviced Station (PAGASA) and the topography of the Philippines (shading; m). The colors of the circles indicate the climate types based on Villafuerte et al. [36].

Figure 2.
Average monthly rainfall (mm day−1) distribution of the stations that belong to (a) Climate Type I; (b) Climate Type II; and (c) Climate Type III from the period 1961 to 2008. The black solid line in each figure represents the mean rainfall time series of the different stations in each climate type.

Figure 3.
Time series of average monthly rainfall (mm day−1) of climate Type II stations from 1961 to 2008 for (a) November; (b) December; (c) January; (d) February; and (e) March. The red vertical lines in (b) indicate the significant change points around 1976/1977 and 1992/1993 that divides the time series into three epochs: E1 (1961–1976); E2 (1977–1992); and E3 (1993–2008). The green line indicates the 9-year running average.

Figure 4.
Differences in interpolated rainfall (contours) during December between: (a) E1 (1961–1976) and E2 (1977–1992) (E2 minus E1); and (b) E2 and E3 (1993–2008) (E3 minus E2) across the 32 PAGASA stations (stars). Negative (positive) contours are indicated by dashed (solid) lines. The contour interval is 2 mm day−1. Yellow shaded stars indicate a significant difference above the 90% confidence level by bootstrapping. The stars with red outlines indicate the 13 stations with significant difference in both (a,b).

Figure 5.
The epochal means of 850-hPa winds (WINDS850hPa; streamlines; m s−1), 850-hPa zonal winds (U850hPa; shades; m s−1), and 850-hPa geopotential height (HGT850hPa; contours; m) during December for: (a) E1 (1961–1976); (b) E2 (1977–1992); and (c) E3 (1993–2008). The contour interval is 10 m.
Figure 5.
The epochal means of 850-hPa winds (WINDS850hPa; streamlines; m s−1), 850-hPa zonal winds (U850hPa; shades; m s−1), and 850-hPa geopotential height (HGT850hPa; contours; m) during December for: (a) E1 (1961–1976); (b) E2 (1977–1992); and (c) E3 (1993–2008). The contour interval is 10 m.

Figure 6.
The epochal difference in the vertically integrated moisture flux (VMF; vectors; kg m−1 s−1) and moisture flux divergence (VMFD; shading; kg m−2 s−1) during December between: (a) E1 (1961–1976) and E2 (1977–1992) (E2 minus E1); and (b) E2 and E3 (1993–2008) (E3 minus E2). Shaded areas and black vectors indicate statistical significance above the 90% confidence level by t-test. The scale of the wind vectors is indicated on the upper right corner in each plot.

Figure 7.
Tropical cyclone (TC) track frequency (y−1) interpolated onto a 5° × 5° grid during December, TC tracks (black lines), 600-hPa winds (WINDS600hPa; grey streamlines; m s−1), and 600-hPa geopotential height (HGT600hPa; blue contours; m) for: E1 (1961–1976; a,d); E2 (1977–1992; b,e); and E3 (1993–2008; c,f) based on the Joint Typhoon Warning Center (JTWC) track dataset. Dashed boxes from (a) to (c) indicates the Philippine Area of Responsibility (PAR; 115° to 135° E and 5° to 25° N). The TC genesis locations from (d) and (f) are indicated by the red markings.

Figure 8.
Spatial distribution of the mean 850-hPa perturbation kinetic energy (PKE; m2 s−2) during December for: (a) E1 (1961–1976); (b) E2 (1977–1992); and (c) E3 (1993–2008). Epochal difference in PKE between (d) E1 and E2 (E2 minus E1); and (e) E2 and E3 (E3 minus E2). The contour interval from (a) to (c) is 2 m. Cross markings in (d,e) indicate a significant difference above the 90% confidence level using the t-test.

Figure 9.
Epochal difference in 500-hPa vertical velocity (×10−2 Pa s−1; a,d), 700-hPa relative humidity (RHUM; %; b,e); and vertical zonal wind shear (U200hPa minus U850hPa; m s−1; c,f) during December. Figure 9a–c are the differences between E1 (1961–1976) and E2 (1977–1992) (E2 minus E1). Figure 9d–f are the differences between E2 and E3 (1993–2008) (E3 minus E2). Cross markings indicate statistical significance above the 90% confidence level using the t-test.

Figure 10.
Epochal difference in sea surface temperature (SST; °C) and 10-m winds (WINDS10m; m s−1) in December between: (a) E1 (1961–1976) and E2 (1977–1992) (E2 minus E1); and (b) E2 and E3 (1993–2008) (E3 minus E2). (c) Time series of December SST anomaly (SSTA) over the Niño 3.4 region (5° S–5° N, 170° E–120° W). Stippled areas and vectors in (a,b) indicate significant difference above the 90% confidence level using the t-test. The scale of the arrows is indicated on the upper right corner of (a,b). The red vertical lines in (c) indicate the change points around 1976/1976 and 1992/1993 based on the December rainfall time series for reference discussion. The green line in (c) indicates the 9-year running average.

Figure 11.
Schematic diagram showing the possible mechanisms leading to the decrease in rainfall during December during E2 (1977–1992) over the Philippines. PDO: Pacific Decadal Oscillation.
Figure 11.
Schematic diagram showing the possible mechanisms leading to the decrease in rainfall during December during E2 (1977–1992) over the Philippines. PDO: Pacific Decadal Oscillation.

Figure 12.
As in Figure 11 but for the increase in rainfall during E3 (1993–2008). WNPSH: western North Pacific Subtropical High.
Figure 12.
As in Figure 11 but for the increase in rainfall during E3 (1993–2008). WNPSH: western North Pacific Subtropical High.

Figure 13.
Time series of the December Pacific Decadal Oscillation (PDO) from the period 1961 to 2008. The green line indicates the 9-year running average. The red vertical lines indicate the change points around 1976/1976 and 1992/1993 based on the December rainfall time series for reference discussion.

Figure 14.
Time series of the East Asian winter monsoon index (EAWMI) (see text for details for the derivation of the index) from 1961 to 2008 for (a) November; (b) December; (c) January; (d) February; and (e) March. The red vertical lines indicate the change points around 1976/1977 and 1992/1993 based on the December rainfall time series for reference discussion. The green line indicates the 9-yr running average.

Figure 15.
Composite anomalies of the mean sea level pressure (MSLP; shading; hPa) and 850-hPa winds (WINDS850hPa; streamlines; m s−1) during E2 for (a) November; (b) December; (c) January; (d) February; and (e) March. The anomalies are the deviations from the long-term means (1961–2008).
Figure 15.
Composite anomalies of the mean sea level pressure (MSLP; shading; hPa) and 850-hPa winds (WINDS850hPa; streamlines; m s−1) during E2 for (a) November; (b) December; (c) January; (d) February; and (e) March. The anomalies are the deviations from the long-term means (1961–2008).

© 2018 by the authors. Licensee MDPI, Basel, Switzerland. This article is an open access article distributed under the terms and conditions of the Creative Commons Attribution (CC BY) license (http://creativecommons.org/licenses/by/4.0/).
Share and Cite
MDPI and ACS Style
Olaguera, L.M.; Matsumoto, J.; Kubota, H.; Inoue, T.; Cayanan, E.O.; Hilario, F.D. Interdecadal Shifts in the Winter Monsoon Rainfall of the Philippines. Atmosphere 2018, 9, 464. https://doi.org/10.3390/atmos9120464
AMA Style
Olaguera LM, Matsumoto J, Kubota H, Inoue T, Cayanan EO, Hilario FD. Interdecadal Shifts in the Winter Monsoon Rainfall of the Philippines. Atmosphere. 2018; 9(12):464. https://doi.org/10.3390/atmos9120464
Chicago/Turabian StyleOlaguera, Lyndon Mark, Jun Matsumoto, Hisayuki Kubota, Tomoshige Inoue, Esperanza O. Cayanan, and Flaviana D. Hilario. 2018. "Interdecadal Shifts in the Winter Monsoon Rainfall of the Philippines" Atmosphere 9, no. 12: 464. https://doi.org/10.3390/atmos9120464
Note that from the first issue of 2016, this journal uses article numbers instead of page numbers. See further details here.