Enhanced Stratosphere/Troposphere Coupling During Extreme Warm Stratospheric Events with Strong Polar-Night Jet Oscillation

1
Leibniz-Institute for Atmospheric Physics, University of Rostock, Ostseebad Kühlungsborn, D-18225 Mecklenburg, Germany
2
Finnish Meteorological Institute, Arctic Research, PL 503, 00101 Helsinki, Finland
*
Author to whom correspondence should be addressed.
Atmosphere 2018, 9(12), 467; https://doi.org/10.3390/atmos9120467
Submission received: 31 August 2018
/
Revised: 25 November 2018
/
Accepted: 26 November 2018
/
Published: 29 November 2018
(This article belongs to the Special Issue Stratosphere–Troposphere Exchanges)
Abstract
:Extreme warm stratospheric events during polar winters from ERA-Interim reanalysis and CMIP5-ESM-LR runs were separated by duration and strength of the polar-night jet oscillation (PJO) using a high statistical confidence level of three standard deviations (strong-PJO events). With a composite analysis, we demonstrate that strong-PJO events show a significantly stronger downward propagating signal in both, northern annular mode (NAM) and zonal mean zonal wind anomaly in the stratosphere in comparison with non-PJO events. The lower stratospheric EP-flux-divergence difference in ERA-Interim was stronger in comparison to long-term CMIP5-ESM-LR runs (by a factor of four). This suggests that stratosphere–troposphere coupling is stronger in ERA-Interim than in CMIP5-ESM-LR. During the 60 days following the central date (CD), the Arctic oscillation signal was more intense during strong-PJO events than during non-PJO events in ERA-Interim data in comparison to CMIP5-ESM-LR runs. During the 15-day phase after CD, strong PJO events had a significant increase in stratospheric ozone, upper tropospheric zonally asymmetric impact, and a regional surface impact in ERA-Interim. Finally, we conclude that the applied high statistical threshold gives a clearer separation of extreme warm stratospheric events into strong-PJO events and non-PJO events including their different downward propagating NAM signal and tropospheric impacts.
1. Introduction
During winter, the boreal stratosphere couples with the underlying troposphere in two pathways: bottom-up and top-down. Often it undergoes different extreme circulation states: cold events with a strong polar vortex and zonal mean westerlies (polar-night jet); and warm events with a weakening or a breakdown of the polar vortex and zonal mean easterlies. Warm events are caused by increased upward wave activity fluxes associated with ultra-long planetary waves as demonstrated by Polvani and Waugh [1]. This observation is in agreement with the wave-mean flow interaction theory (e.g., [2]). In fact, Polvani and Waugh [1] showed that zonal-mean eddy heat flux, which is a proxy for the upward wave activity flux, averaged over prior 40 days, was highly (−0.8) anti-correlated with the northern annular mode (NAM) index at 10 hPa, suggesting a physical link. The authors of Reference [1] also showed a downward propagation of a NAM signal for warm and cold cases of stratospheric events with a high correlation to the evolution for weak and strong polar vortices found by Baldwin and Dunkerton [3]. Note, that Baldwin and Dunkerton [4] demonstrated that during weak vortex regimes (warm events), mean surface pressure anomalies are in the negative phases of Arctic oscillation (AO) and of North Atlantic oscillation (NAO), with the strongest effect on the location of storm tracks over the North Atlantic European region. Recently, Reference [5] confirmed these results based on the Japanese JRA-55 reanalysis [6], which does not assimilate satellite observations in the stratosphere. In addition, they showed that averaged Arctic ozone in the stratosphere is greatly enhanced after the onset of warm events. Furthermore, Polvani and Waugh [1] showed that stratospheric events with integrated (40 days before) anomalously strong eddy heat fluxes at 100 hPa are also followed by larger surface pressure anomalies for up to 60 days in agreement with Reference [3].
The long-range forecast skill at the surface following stratospheric warm or cold events seems to be enhanced (e.g., [7,8,9,10,11,12]). The influence of stratospheric oscillation regimes [13] during warm events, on the coupling of the stratosphere and the troposphere, has been considered in many studies, e.g., [7,11,12,14,15,16,17,18].
Nevertheless, the main question remains: under which specific oscillation behavior during such warm events is the stratosphere more strongly coupled with the troposphere? In this study we focus on extreme warm events with a major sudden stratospheric warming (MSSW) followed by a strong downward propagating NAM signal, and accompanied by a pronounced polar-night jet oscillation (PJO) event, which have the potential for forecasting improvements [11]. Note, this strong polar-night jet oscillation of the stratosphere can be seen in the temporal evolution of the zonal mean zonal wind (ZMZW) anomaly at about 60° N (an example is also shown in Figure 2a, composite over some MSSW events of ERA-Interim). The oscillation starts with strong westerlies, followed by strong easterlies, and then by strong westerlies over a period of more than 90 days.
Also, Figure S1 (Supplementary Materials) shows the main subjects of this study, the cross-section of the climatological zonal mean zonal wind with the polar-night jet and subtropical jet, and the mean zonal mean temperature for boreal winters, as well as relevant dynamical processes.
Based on previous studies, we expect that extreme warm events, which result in a breakdown of the polar vortex, and accompanied by strong planetary wave activity, are stronger coupled with the troposphere. The coupling depends on the status of the wave-mean flow regime itself in the stratosphere and troposphere. For example, if in a strong wave-mean flow interacting regime with a strongly interacting planetary wave triad (wave–wave interaction), and there is an additional tropospheric wave forcing, then an MSSW event may suddenly occur with a tropospheric ZMZW change [19,20]. On the other hand, warm events with a weak wave-mean flow interacting regime and a weakly interacting triad may show weaker tropospheric influence. These regime differences during warm events have been demonstrated by References [19,20], with the help of a simple conceptual two-layer model. In particular, Peters [19,20] showed the onset of strong oscillation as a function of wave-mean flow and wave–wave interaction (planetary wave triad) under the additional action of wave-1-forcing. In a more realistic quasi-geostrophic model, Palmer and Hsu [21] showed the important role of a high nonlinear interactive wave-mean flow regime including wave–wave interaction for the pre-conditioning of the sudden stratospheric warming in February 1979. Perlwitz and Harnik [22] and Kodera et al. [23] discussed the different roles of planetary wave propagation and zonal mean processes on the downward coupling of the stratosphere and troposphere. They found two dominant states of wave-mean flow interaction: one with a higher wave absorption and the other with increased reflection of planetary wave. Furthermore, it was shown that all ultra-long waves 1, 2, and 3 were required in the initial set up of the phasing of the austral major warming in 2002 [24].
In this study, we use an updated approach to differentiate between a regime of extreme warm events and a regime of weaker warm events by taking into account the specific duration and dominant strength of the PJO during the winter [14,15,25]. To differentiate between such events, we use a more stringent definition of the PJO then was used in previous studies. As mentioned above, we focus on those extreme warm events with a strong downward propagating NAM signal, which have the potential for forecasting improvements [11,12], as these events are expected to have stronger influences on the troposphere.
Kuroda and Kodera [25] first described PJO as a poleward and downward moving ZMZW anomaly in the stratosphere with an oscillation period of several winter months. Similarly, Christiansen [26] showed the downward propagating signal of a ZMZW anomaly, from the upper to the lowermost stratosphere in free running simulations. Later, the definition of PJO given in Reference [14] was used to separate between warm events (i.e., MSSWs) with and without PJO events. The day of ZMZW reversal at 10 hPa layer at 60° N marks the central day (CD) of an MSSW event [27]. It has been shown, that following CD, PJO events are characterized by extended ZMZW recoveries in the lower stratosphere, reduced planetary wave activity flux, as well as a reemergence of strong westerlies in the upper stratosphere [28,29].
Furthermore, simulations to quantify eddy feedbacks and forcings in the troposphere in response to MSSWs were carried out by Reference [30]. They simulated the equatorward shift of the ZMZW jet in mid-latitudes after CD, and showed that the adjustment process happens mainly due to the tropospheric planetary waves in direct response to stratospheric circulation changes. They also pointed to the indirect role of tropospheric synoptic eddies linked to zonally asymmetric Rossby wave breaking events, [9,31].
Another study showed, that the response on the troposphere does not depend on the strength but on the persistence of the stratospheric warming [18], in agreement with former studies, [3,15].
Using ERA-Interim data [32], we investigate different regimes of stratosphere/troposphere coupling of MSSWs with or without PJO events. We apply in this study a more stringent definition of the so-called strong-PJO event in order to select only those events, which exceed a significant 99.73% confidence level (three standard deviations). This is in contrast to Reference [15], who used only 95% (two standard deviations). Thereby we exclude some intermediate events, which may produce inconclusive results. We demonstrate a clearer difference in tropospheric responses to extreme warm events accompanied by strong-PJO events in the upper stratosphere and those warm events which are not followed by PJO (non-PJO events). This allows us to better examine the NAM-composites evolution as well as the differential absorption of planetary wave activity. Furthermore, we increase the size of the sampling by using 168 years of CMIP5 simulations with the MPI-ESM-LR model to demonstrate the usefulness of the applied methodology [33], and to confirm the main stratospheric results. Section 2 describes the ERA-Interim data set [32], setup of CMIP5-MPI-ESM-LR simulations [33], and the applied methodology. Section 3 compares the evolution of zonally symmetric stratospheric results of strong-PJO events and non-PJO events for both data sets. We also discuss the zonally asymmetric composites of tropospheric impacts during 15-day post phase after CD for ERA-Interim. Discussion and Conclusions are given in Section 4 and Section 5, respectively.
2. Data Sets and Methodology
Daily averaged selected meteorological fields (geopotential, temperature, horizontal winds, total ozone, surface pressure, 10 m zonal wind, and 2 m temperature) of the ECMWF re-analysis called ERA-Interim [32] were used for the 1979–2013 period. The 29th February leap years were excluded. The selected horizontal resolution was based on a longitude × latitude grid of approximately 0.7 degrees × 0.7 degrees. Fields were interpolated onto 21 levels from the surface up to 1 hPa.
Meteorological fields from the MPI-ESM-LR-CMIP5 model [33] (Max-Planck-Institute Earth System Model; Low Resolution; Coupled Model Intercomparison Project phase 5) were downloaded from the CERA data bank of DKRZ Hamburg for three realizations of LR-T63/L47 runs capturing the years 1950–2005, summing up 168 years of simulations (3 times 56 years). The used longitude × latitude grid points were approximately 1.8 degrees × 1.8 degrees with selected 15 levels from 1000 to 0.1 hPa. Note that MPI-ESM-LR-CMIP5 used prescribed monthly mean zonal mean ozone in the stratosphere.
Climate Diagnostic Operator (CDO) software from DKRZ was used in order to calculate means, anomalies, and composites [34]. An anomaly was defined as a deviation from a daily climatology calculated over the whole 1979–2013 period for ERA-Interim or over the period of 1950–2005 for each realization separately in the case of CMIP5 runs.
The NAM index was calculated following Reference [35] using de-trended geopotential height fields integrated over a polar cap north of 60° N and multiplied by −1. The daily mean climatology was subtracted to calculate anomalies. These anomalies were normalized by the mean standard deviation. The MSSW events were defined as events when the NAM index at 10 hPa level exceeded a threshold value of −2.3 during winter (December–March). The day when the threshold was exceeded determined the so-called central day (i.e., CD) of a warm stratospheric event (i.e., MSSW). This threshold value was chosen in order to identify nearly the same CD of wind reversal day as defined by Reference [27]. Two events must be separated from each other by a period of two months. Events with a CD after the first week of March were not considered in order to distinguish from final warmings. Note, there was a strong similarity between a NAM index based on integrated polar geopotential anomalies and a NAM series using empirical orthogonal functions (EOFs), as was done by Reference [36].
To investigate the polar vortex evolution, the definition of the PJO index was applied [14,15]. Principal component series based on the projection of the integrated polar cap temperature anomalies north of 70° N on the two leading EOFs were calculated. The two leading principal components, PC1 and PC2 explain about 90% of temperature’s total variance. Note that temperature and wind were linked by the thermal wind equation. In a phase space of (PC1, PC2), the amplitude was defined as r = (PC12 + PC22)1/2 with σ as mean standard deviation of r. The phase angle is defined as ϴ = arctan (−PC2/PC1). In a phase space of (PC1, PC2) a typical event shows an anticlockwise rotation. We modified the definition of Reference [15] for so-called strong-PJO events by using a threshold value of r ≥ 3 σ with ∆ϴ ≥ 100°. Intermediate-PJO events were defined as episodes with 2 σ ≤ r < 3 σ and with ∆ϴ ≥ 100°. Our definition of strong-PJO events was motivated by the rule of three standard deviations which corresponds to 99.73% confidence level [37]. The remaining warm events, which do not satisfy the criteria for intermediate-PJO or strong-PJO were called events without a PJO (non-PJO). Composite analysis was calculated using CDO [34], and the significance of composite differences was tested by two-sided student’s t-test, (e.g., [37]). The standard TEM (transformed Eulerian mean, [2]) diagnostics based on quasi-geostrophic approximation was calculated according to References [2,38]. A 5-day running mean was applied to PC1 and PC2 series, as well as to quantities used for TEM eddy flux calculations in order to exclude high-frequency variability.
3. Results
For the ERA-Interim period, 1979–2013, we identified 21 MSSWs, corresponding to approximately six events per decade, which was comparable to the finding of References [5,15]. Furthermore, with our PJO definition, nine strong-PJO events, four intermediate-PJO events, and eight non-PJO events were identified. The dates of CD and identified PJO-types for ERA-Interim are given in Table ST1 in the Supplementary Materials.
The 168 years of CMIP5-ESM-LR runs had 79 MSSWs, corresponding to about five events per decade, which is in reasonable agreement with observations and other models [9,15,27]. In the model runs 24 out of 79 events were classified as strong PJO events and 34 events were classified as non-PJO events. An overview of seasons, CDs and PJO-type events for three MPI-ESM-LR are given in Tables ST2, ST3, and ST4 in the Supplementary Materials.
3.1. Zonally Symmetric Structure: Evolution
Figure 1 shows the evolution of composite NAM anomalies. Strong-PJO events show pronounced downward propagating signals after the CD in comparison to non-PJO events for both ERA-Interim and for CMIP5-ESM-LR.
The NAM difference between strong-PJOs and non-PJOs was significant in three regions (Figure 1e,f): (i) in the stratosphere after CD for about 30 days in ERA-Interim and 50 days in CMIP5-ESM-LR at about 150 hPa level (NAM150); (ii) at the stratopause between day 30 and day 45 after CD in both datasets (longer in ERA-Interim); and (iii) in the upper troposphere after approximately 20 days in ERA-Interim and about 40 days in CMIP5-ESM-LR.
In the CMIP5-ESM-LR, the NAM difference in the stratosphere was more intense; it lasted longer and reached the troposphere 20 days later in comparison to the ERA-Interim. On the other hand, the reemerging positive NAM anomaly in the stratosphere was much weaker in the CMIP5-ESM-LR in comparison to the ERA-Interim.
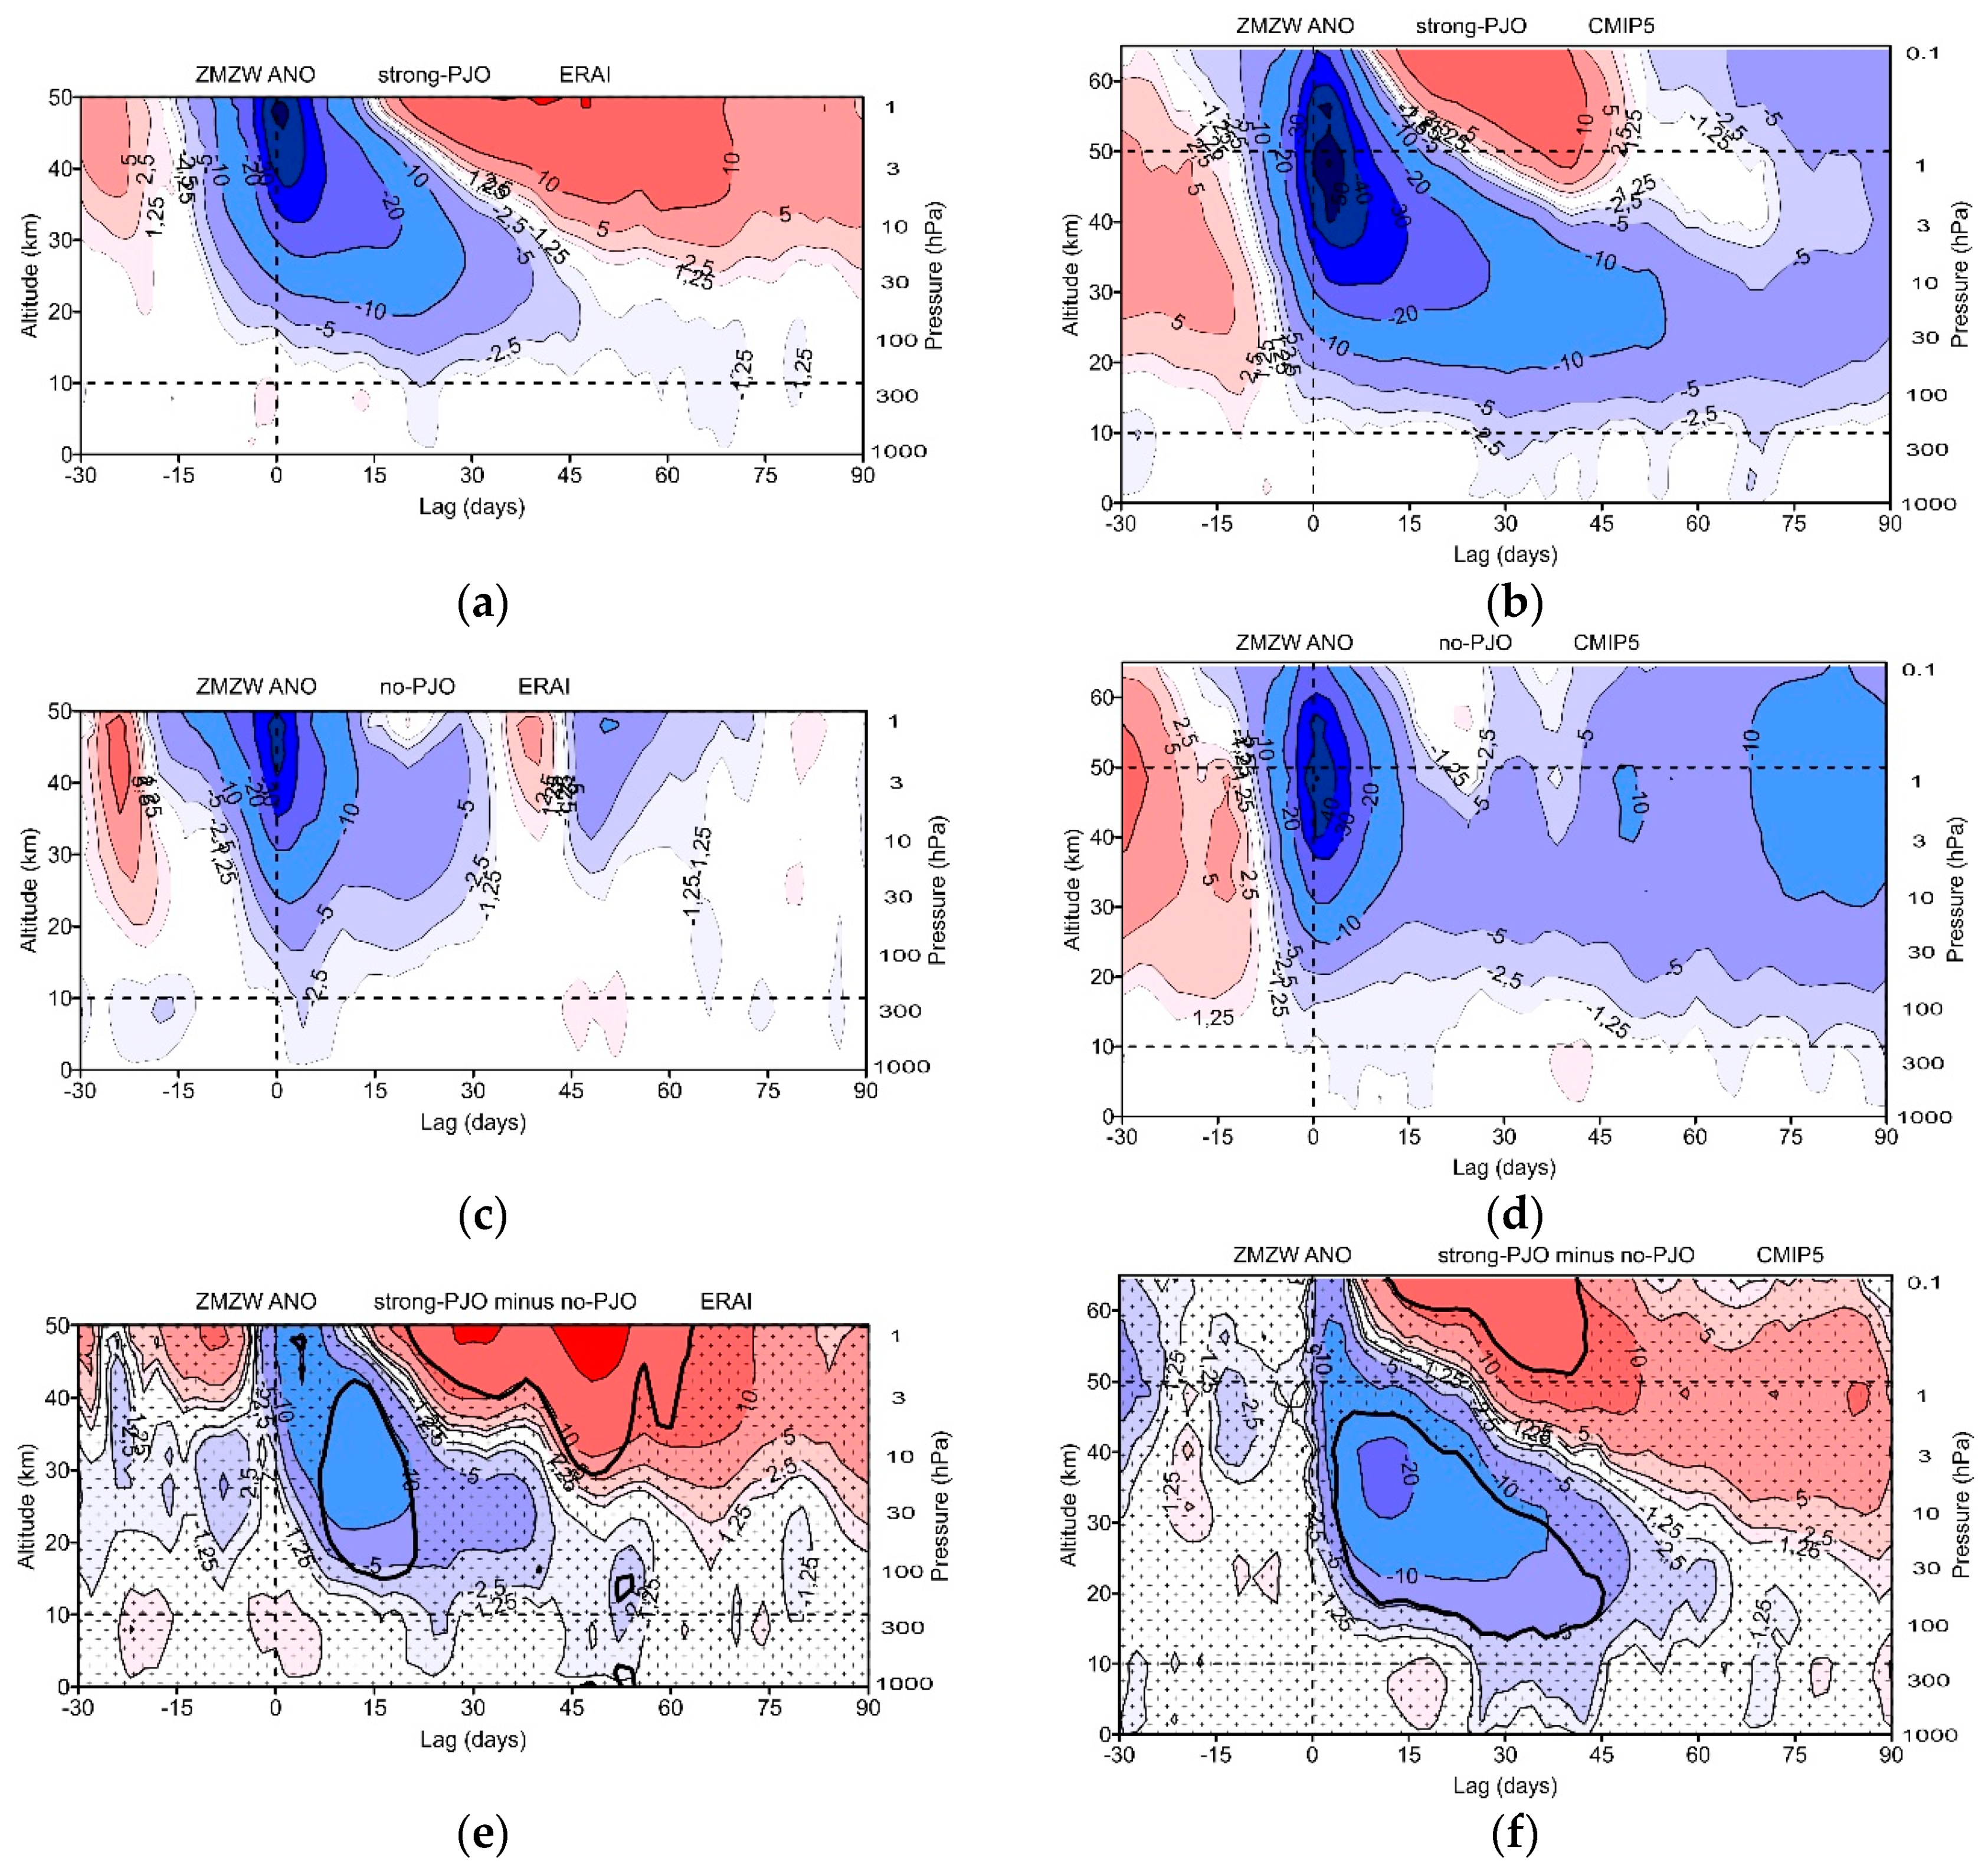
The difference of the ZMZW anomaly in the stratosphere between strong-PJO and non-PJO was significant until day 20 in ERA-Interim and until about 45 days in CMIP5-ESM-LR (Figure 2e,f). In the upper stratosphere, the negative ZMZW anomaly lasted for about 2–3 weeks, whereas in the lower stratosphere, it lasts for 5–7 weeks. Anomalous westerlies reappearing in the upper stratosphere after CD were much stronger in the strong-PJO events in ERA-Interim than in CMIP5-ESM-LR.
In general, the NAM index and ZMZW evolved significantly differently in the whole stratosphere between strong-PJO events and non-PJO events for about two months after CD. The results for our definition of PJO events agree well with previous results (e.g., [11,15]) and show significant differences.
In order to demonstrate the main characteristics of the stratospheric NAM oscillation, Figure 3a,b shows the evolution of NAM at 10 hPa level for both data sets. Before the CD, all events revealed similar behavior when passing the −2.3 threshold used here to define warm events (Section 2). In ERA-Interim, the strong-PJO NAM (red line) shows a significantly stronger decrease after CD lasting for about five days before it starts to increase again (Figure 3a). Between day 55 and 70 the strong-PJO NAM index became positive again, indicating a complete period of oscillation around the mean state during MSSWs. The non-PJO NAM index (blue line) recovered faster after CD in comparison to that of strong-PJO, but it decreased again after a lag of 40 days staying negative until day 90. The intermediate-PJO NAM index (dashed green line) evolved intermediately between the two extreme cases.
For CMIP5-ESM-LR (Figure 3b), the behavior of the different PJO events after CD was largely similar to that in ERA-Interim with a somewhat faster increase of NAM for non-PJO events which becomes positive already at about day 22. The evolution of the NAM in CMIP5-ESM-LR was smoother because a larger number of events was considered.
The NAM anomaly at 1000 hPa (Figure 3c), which is close to the surface, was significantly larger after CD for strong-PJO (red line) than for the non-PJO curve (blue line) in ERA-Interim. For strong-PJO events, the NAM index (NAM1000 equals Arctic oscillation, AO) started a significant decrease after CD until day 15, which was followed by a weak oscillation. Furthermore, for the strong-PJO the integrated polar surface pressure anomaly showed a change of sign and anti-correlates with the AO index, as expected. An increase of about 3 hPa occured in the first 15 days after CD followed by a weak oscillation with an amplitude of 1 hPa. The non-PJO AO following CD showed much weaker anomalies and stays around zero.
For CMIP5-ESM-LR (Figure 3d), the mean AO anomalies during both strong-PJO events (red line) and non-PJO events (blue line) were weak and the indexes evolved similarly to each other during the first three weeks after CD. For strong-PJO, the AO index started to decrease after day 25 while it increased for non-PJO events. The integrated polar surface pressure anomaly showed a change of sign and remained positive after CD, as in ERA-Interim. The surface pressure grew quasi-linearly by about 2 hPa during the first 15 days after CD. Note the AO of strong-PJO and that of non-PJO were not statistically different during the first 15 days after CD in the CMIP5-ESM-LR in comparison to the behavior of AOs of ERA-Interim. Since there was no difference between the two sub-samples of CMIP5-ESM-LR model in the polar troposphere, which may indicate a biased behavior of the model, we did not analyze the tropospheric coupling in ESM-LR.
Furthermore, we examined the quasi-geostrophic TEM balance after Reference [38]. The mean eddy heat flux and Eliassen–Palm (EP)-flux divergence are shown in Figure 4a–d. For ERA-Interim, the evolution of these quantities differ significantly between strong-PJO and non-PJO events in the middle and lower stratosphere during the first ten days after CD and also around day 40 (Figure 4e,f). For strong-PJO events, the zonal mean eddy heat flux was insignificantly larger than that of non-PJO events during 20 days prior to CD, and it increased in the upper stratosphere before CD. The eddy heat flux of non-PJO events decayed faster after CD, although there were two weak pulses of heat flux around day 15 and day 45 corresponding to two pulses of EP-flux convergence around the same times (Figure 4c,d) in the lower and upper stratosphere which decelerated the ZMZW (Figure 2c). In the upper stratosphere above 40 km, EP-flux divergence occurred quasi-continuously between days 5 and 40 after CD (Figure 4b) which accelerated the ZMZW for strong-PJO events (Figure 2a) as expected from the wave-mean flow interaction theory.
For CMIP5-ESM-LR, the mean eddy heat flux and EP-flux divergence are shown in Figure 5. The heat flux evolution of strong-PJO and of non-PJO events differ significantly in the upper, middle, and lower stratosphere during ten days before and after CD. In strong-PJO events, it was (i) stronger in the upper stratosphere before CD, (ii) stronger in the lower stratosphere after CD, and (iii) weaker in the mid and upper stratosphere after CD between days 20–40 (Figure 5a,c,e). Similar differences were also found for the EP-flux divergence (Figure 5b,d,f). The eddy heat flux during non-PJO events decayed strongly after CD, but it showed two pulses around day 25 and day 50 resulting in two pulses of EP-flux convergence (Figure 5c,d) in the lower and upper stratosphere, although a corresponding weakening of the ZMZW only occurred around day 25 (Figure 2d). In the mesosphere, EP-flux convergence occurs quasi-continuously (Figure 5b,d) and there was no period of anomalous divergence as in ERA-Interim (Figure 4b). Anomalous EP-flux convergence decelerated the ZMZW for PJO events in the mesosphere, which was, however, not seen in the anomaly of ZMZW (Figure 2b,c) because the mean climatological deceleration was excluded. On the other hand, the difference of EP-flux divergence between strong-PJO events and non-PJO events was positive (Figure 5f) resulting in a faster recovery of ZMZW and establishment of anomalous westerlies during strong-PJO events (Figure 2f).
In summary, both ERA-Interim (Figure 4e,f) and CMIP5-ESM-LR (Figure 5e,f) showed similar stratospheric behavior during strong PJO events with a strong and significant downward propagating signal around CD for eddy heat flux and EP-flux divergence. This signal started about one week before CD in the upper stratosphere and ended about two weeks after CD in the lower stratosphere. The upper stratospheric anomalous acceleration started about five days after CD and showed a downward propagating signal. In CMIP5-ESM-LR, the lower stratospheric difference of EP-flux divergence between strong PJO events and weak PJO events was weaker approximately by a factor of two in comparison to that in ERA-Interim suggesting a weaker coupling between the stratosphere and the troposphere in the model. This difference between the reanalysis and the model is consistent with a weaker AO difference between strong-PJO and non-PJO events after CD in CMIP5-ESM-LR as demonstrated above (Figure 3c,d).
3.2. Zonally Asymmetric Structure—Era-Interim
Because the first two weeks after the CD were characterized by the strongest significant differences of NAM, ZMZW as well as stratospheric eddy heat fluxes and EP-flux divergence between strong-PJO and non-PJO events, the tropospheric response was analyzed with a special focus on this period. Our hypothesis is that during the first two weeks after the CD the changes in lower stratosphere and upper troposphere and surface response are strongly linked. This link is better captured by a 3 σ threshold of the two leading EOF used for the definition of strong-PJO events.
In fact, during the first two-weeks after CD, the AO signal (or polar cap integrated surface pressure) was drastically changed and well separated between the two PJO types (Figure 3c). In CMIP5-ESM-LR, this difference was much weaker and occured one month after CD (Figure 3d), for which reason the tropospheric response in the model will not be further investigated. Thus, in the following we will focus on the 15-day period after CD when the AO evolution was clearly different between strong-PJO and non-PJO events in ERA-Interim. We will focus on zonally asymmetric changes of total ozone (TO3), 300 hPa geopotential height (GH), 300 hPa zonal wind anomalies, and Rossby wave breaking (RWB) events in the upper troposphere in order to diagnose the planetary wave structure on the one hand and associated changes in synoptic eddies (i.e., RWB events) on the other hand. We also examine 10 m zonal wind and 2 m temperature anomalies in order to describe changes in the near-surface climate.
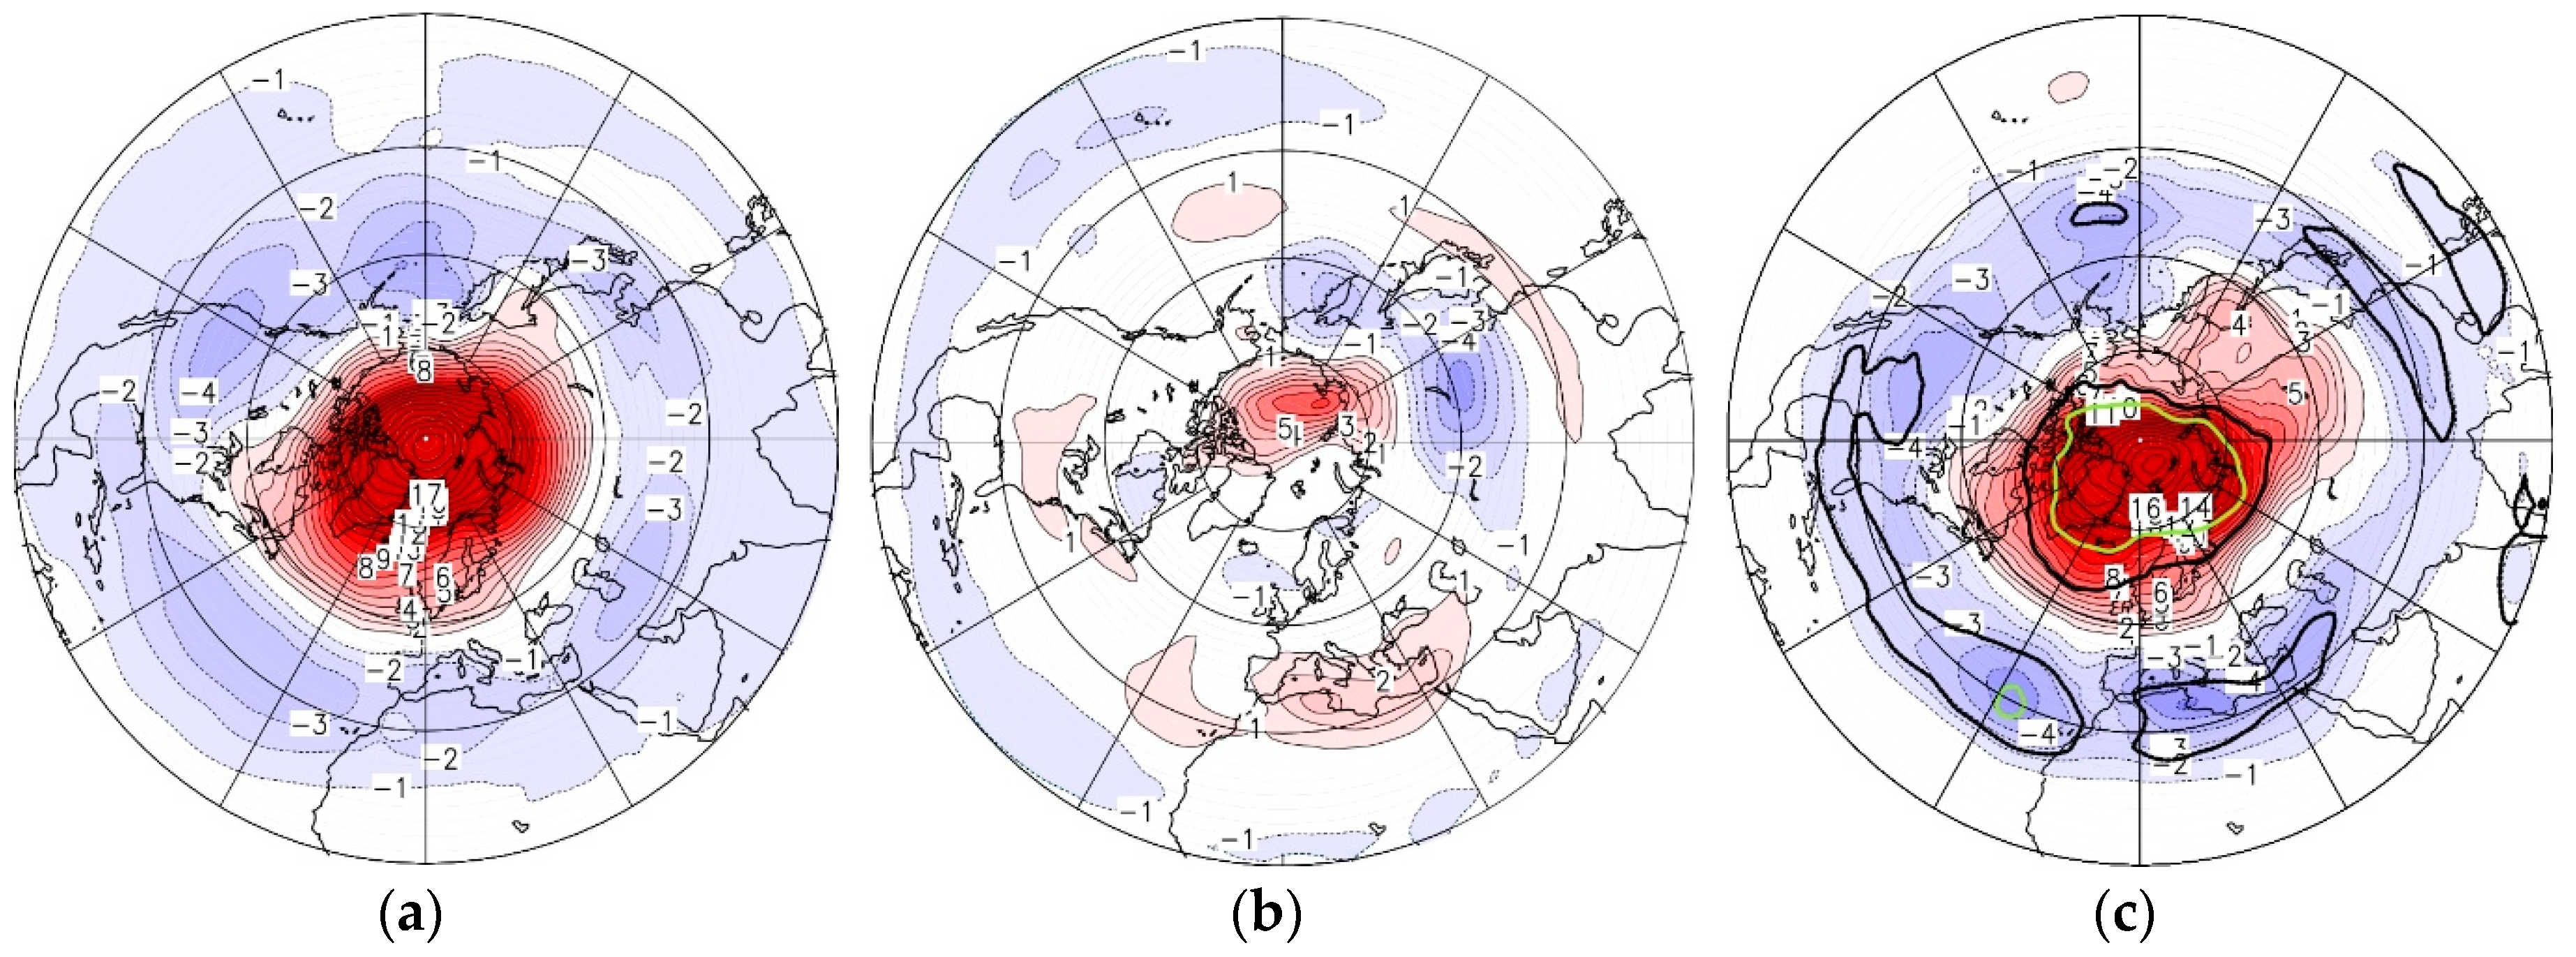
Figure 6 shows the TO3 anomaly change during the post phase for strong-PJO (Figure 6a) and non-PJO (Figure 6b) based on ERA-Interim data in agreement with Reference [5]. The TO3 anomaly over the polar region was significantly larger during strong-PJO events than during non-PJO events. Focusing on the 50°–60° N latitude band one can see that an increase of TO3 occurs mostly over the North Atlantic European region while there was a decrease over the North Pacific indicating a planetary wave 1 anomaly in this latitude range (Figure 6c). South of 45° N, TO3 anomaly decreased everywhere during strong-PJO events, but the anomalies were weak during non-PJO events. The main cause of the strong polar zonally symmetric TO3 increase and the wavenumber 1 signature in TO3 in sub-polar region was the transport change by the residual circulation, as well as the transport changes by planetary waves and transient eddies for strong-PJO during the first two weeks after CD [39]. From previous studies, e.g., [9,40,41], we expect that this strong ozone anomaly also had an impact on the tropospheric circulation including changes of the planetary wave structure.
During the post phase of strong-PJO events, the coupling between stratosphere and troposphere was well demonstrated by geopotential height anomaly (GH) changes at 300 hPa level (tropopause region, Figure 7a–c). For instance, while the NAO signal in the Atlantic sector was pronounced during the strong-PJO events (Figure 7a), the dipole pattern over the North Pacific with negative anomalies in mid-latitudes and positive anomalies in the polar region was enhanced only during non-PJO events (Figure 7b). The related southward shift of zonal wind was shown in Figure 7d–f, respectively. Similar structure changes have also been found for GH anomaly at 1000 hPa (Figure 7f,g), and for surface pressure anomalies shown in the Supplementary Materials (Figure S2).
During the following 16–75-lag-day period, the NAO anomaly at 300 hPa was half as large for strong-PJO events (not shown), but a stronger positive annular structure occurs in the Arctic region for NAM1000 (Supplementary Materials: Figure S3) as known from literature, e.g., [3].
The results reveal different action centers of stratosphere/troposphere coupling: over the North Atlantic European region associated with NAO during strong-PJO events and over the North Pacific during the non-PJO events.
Furthermore, this structural change of GH anomalies during MSSW events with strong-PJO corresponds to a change in the quasi-geostrophic background winds with latitudinal and longitudinal shifts of the jets in the upper troposphere (Figure 7d–f). In particular, over the North Atlantic European region, the subtropical jet was shifted southward during strong-PJO events and there were anomalous easterlies south of Iceland. During non-PJO events, there was an equatorward shift of the subtropical jet over the North Pacific Ocean and a westward wind anomaly over mid-latitudinal North Pacific Ocean.
The intensity and position of poleward RWB events depends on the background flow as shown by many studies, e.g., [9,31]. The changes in RWB also indicate a change of transient tropospheric eddies [31]. As suggested by Peters and Waugh [31] poleward and equatorward RWB events are distinguishable from each other due to their evolution in different planetary background flows. The cyclonic poleward RWB event, P1-RWB, as well as the anticyclonic poleward RWB event, P2-RWB, exhibit a strengthening of an anticyclone just close to the region of Rossby wave breaking. The algorithm used here to detect different types of RWB is described in Reference [42]. The algorithm of Reference [42] was used in order to capture the RWB events with localized, enhanced momentum wave flux, which is a signature of RWB activity. This algorithm uses the wave-activity flux definition for quasi-stationary waves according to Reference [43]. The RWB events were identified as extreme cases of Ertel’s potential vorticity (PV) overturning in the planetary background field [2]. The direction of Ertel’s PV overturning is determined by the large-scale field [31]. Only the cyclonic (P1) and anticyclonic (P2) poleward Rossby wave breaking events were analyzed.
Figure 8 shows these poleward RWB events during strong-PJO events and non-PJO events. We identify significant (using student’s t-test) momentum fluxes corresponding to poleward downstream P2-RWB events over southern Europe for non-PJO events (Figure 8b), as well as similar events over Azores and California. For strong-PJO events (Figure 8a), momentum fluxes corresponding to P2-RWB events shift to northern Europe and intensify over California and East Asia. The upstream P1-RWB events occurred over northern North Atlantic, south of Iceland, for non-PJO events but they are observed further upstream, over Labrador, during strong-PJO events. There were also P1-RWB events detected over Aleutian Islands during strong-PJO events, but not during non-PJO events. Note, these significant changes of transient eddy behavior in the upper troposphere are directly linked via tropospheric planetary waves with the enhanced coupling regime during strong-PJO events [9,31].
The influence of different PJO events on the near-surface zonal wind anomaly (10m U, Figure 9) and mean temperature anomaly (2m T, Figure 10) were examined for strong-PJO events (Figure 9a and Figure 10a) and non-PJO events (Figure 9b and Figure 10b), respectively. A positive wind anomaly (about 2m/s) can be seen over the middle North Atlantic and a negative was located over the northern North Atlantic (about −m/s) for strong-PJO events. Both anomalies shifted southward and weakened during non-PJO events. Over the North Pacific, the anomalies were weaker for strong-PJO events. Non-PJO events were characterized by an eastward wind anomaly (about 2 m/s) over the mid-latitudes, with westward wind further north over the Aleutian Islands. These wind changes were highly correlated with the GH anomalies (Figure 7g–i) and surface pressure anomalies (Figure S2, Supplementary Materials), and reflect mainly the quasi-geostrophic relation.
The 2 m temperature anomaly for non-PJO events showed a warming up to 5 K over the Arctic, a moderate warming over Siberia, western North America, and Eastern Europe; and a cooling up to 3 K over eastern US. For strong-PJO events, the cooling occurred mainly in a band over the Kara Sea and the Eastern Arctic, and there was warming further equatorward as well as further poleward (over Canada) during the first 15 days after CD.
4. Discussion
Using ERA-Interim data for the period 1979–2013 we identified 21 MSSW events of which nine events are identified as strong-PJO, and eight events as non-PJO events. The differences of the NAM and ZMZW anomalies between strong-PJO and non-PJO events were statistically significant in the stratosphere and these differences are in a good agreement with the physical interpretation based on the zonal mean-wave interactions as supported by differences in eddy heat flux and EP-flux divergence (Figure 1, Figure 2, Figure 3 and Figure 4). Although a more stringent criteria to identify strong-PJO events was applied in our study when compared to previous studies [15,27], our findings are in fundamental agreement with those from previous studies.
In order to overcome the small sampling size of ERA-Interim (35 years), we examined 168 years of simulations with the MPI-ESM-LR model where the number of MSSWs increased by a factor of four. In the model, we identify 24 strong-PJO cases and 34 non-PJO cases out of 79 MSSWs. In the stratosphere, NAM and ZMZW anomalies showed similar significant differences between the two PJO types in the model as in the ERA-Interim data. Also, the diagnostics used to describe wave-mean flow interactions (eddy heat flux and EP-flux divergence) showed similar statistically significant differences in the stratosphere and are in agreement with former studies (including CMAM results of References [11,15]). It follows that the stratospheric results are robust between the models and observations, and they are not sensitive to the threshold used to identify PJO events, which is the main and novel result of this study.
Furthermore, four out of 21 MSSW events for ERA-Interim, and 21 out of 79 MSSW events for CMIP5-ESM-LR belong to intermediate-PJO events. On average, intermediate-PJO events seem to be present the mean of all MSSW events, as shown in Figure 3a,b. The exclusion of those events reveals a clearer separation of extreme warm events with strong-PJO and non-PJO events on the one hand. On the other hand, if the intermediate-PJO cases are included the NAM elongation (red curves of strong-PJO events) would be reduced, and the separation from the NAM evolution (blue curves) of non-PJO events would be smaller (Figure 3a,b).
Because the first two weeks after the CD were characterized by the strongest significant changes of NAM, the ZMZW anomaly, and strongly significant changes of physical quantities in the stratosphere, the surface response was analyzed with a special focus on this period. Our hypothesis is that during the first two weeks after the CD the changes in lower stratosphere and upper troposphere and surface response are strongly linked.
Unfortunately, there is not such a strong surface response in CMIP5-ESM-LR during the first two weeks. The reason may be the insufficient vertical resolution or the prescribed monthly mean zonal mean ozone in the stratosphere, which implies difficulties in assessing changes on a sub-monthly scale. That is also a disadvantage of the ECHAM5 general circulation model as shown by Reference [9], because the use of observed, daily, and zonally asymmetric ozone distribution increases stratospheric NAM variability during midwinter, and also increases the number of MSSWs. It was also found in Reference [9] that these ozone-induced stratospheric changes induced significant changes in RWB events over the North Atlantic European region.
The surface NAM signal (AO) decreases significantly during the 15-day phase after CD for strong-PJO in comparison to non-PJO events for ERA-Interim (Figure 3c). For CMIP5-ESM-LR, the surface NAM anomalies for strong-PJO and for non-PJO are weak and indistinguishable during the first three weeks after CD. That indicates a possible biased response of the CMIP5-ESM-LR version in the polar troposphere. If the tropospheric NAM responses are averaged over days 9–54 after CD, the difference between strong-PJO and non-PJO composites in the CMIP5-ESM-LR becomes significant, with more negative NAM signal corresponding to strong-PJO composite, in agreement with previous studies [3,11].
As was mentioned above, the NAM difference between strong-PJO events and non-PJO events is significant in the stratosphere in both ERA-Interim and CMIP5-ESM-LR, in agreement with results of other studies [5,16,17,18]. Both datasets show significant downward propagating signals during strong-PJO events around CD for EP-flux divergence, starting about one week before CD in the upper stratosphere and ending about two weeks after CD in the lower stratosphere. The lower stratospheric EP-flux-divergence difference in CMIP5-ESM-LR is apparently weaker by a factor of two when compared to EP-flux-divergence difference of ERA-Interim indicating a weaker coupling regime of the lower stratosphere with the troposphere.
The difference in the lower stratospheric EP-flux divergence agrees with the previously mentioned weaker AO difference between the two PJO types after CD for CMIP5-ESM-LR in comparison to ERA-Interim, which was additional motivation for us not to analyze the tropospheric response differences in CMIP5-ESM-LR. A possible future extension of this study would be to use CMIP5-ESM-MR runs (T63/L95) with 95 vertical levels in comparison to 47 levels used in the analyzed LR-T63/L47 runs. Such examination is outside the scope of this study.
We further found that the total ozone anomaly decreases strongly for strong-PJO events in comparison to non-PJO events in subtropics. There is also a pronounced wavenumber 1 signature of TO3 in mid-latitudes, and a significant increase of zonally symmetric polar TO3 content during strong-PJO. The Arctic ozone increase in the stratosphere is in agreement with Reference [5]. The cause for this increase is the transport change by the residual circulation, and change of transport by planetary waves and transient eddies for PJO events during the first two weeks after CD [39]. From previous studies, e.g., [9,40,41], we expect that this strong ozone anomaly change also has an impact on the tropospheric circulation, for instance by changing the upper tropospheric planetary wave structure. The feedbacks from the ozone increase in the extra-tropics after CD during strong-PJO events should be the subject of a future study in order to examine details of flow changes due to an additional heating.
The enhanced coupling between stratosphere and troposphere, in extra-tropics, during strong-PJO events in comparison to non-PJO events in the 15-day post phase after CD causes an upper tropospheric planetary zonal wind anomaly, which is directly linked to different poleward Rossby wave breaking events. This result reveals physically different action centers of stratosphere/troposphere coupling: over the North Atlantic European region (linked with NAO) for strong-PJO events, and over the North Pacific (linked to a dipole pattern) for non-PJO events. This interpretation is in agreement with an earlier study showing the statistical contribution of both regions to the mean annular oscillation signal [44]. In a future study, the physical mechanism behind RWB changes should be investigated in more details.
For strong-PJO events, the surface response during the 15-day post phase after CD reveals negative AO and enhanced negative NAO pattern, which is weaker during non-PJO events. Instead there is a dipole response pattern in geopotential field over the North Pacific. The difference of surface pressure anomalies (Figure S2c) and the one of 2-m temperature anomalies (Figure 10c) agree well with the response found by Reference [10] during week 2 of their so-called “WEAK” events for the observation (ERA-Interim) as well as for ECMWF forecasts model results.
For strong-PJO events, the NAO became strongly negative as mentioned above and the surface jet shifted southwards and brings less warm air into the northern European region and Eastern Arctic. At the same time, it anomalously warms the near surface temperatures on its westerly (over Canada) and easterly flanks (over southern Asia) during the 15-day post phase after CD. The cooling response during the post phase of strong-PJO events is confined within a band extending from northern Europe towards Kara Sea, and Eastern Arctic. This three-band structure of the difference plot looks very similar to the regression pattern of warm events found by Thompson and Wallace [45]. Extending their result, we show that this warming-cooling-warming band is mostly associated with stratospheric warm events corresponding to strong-PJO type but not to non-PJO events showing Arctic warming.
5. Conclusions
We demonstrated that warm stratospheric events (MSSWs) in polar winters can be separated according to duration and strength of the polar-night jet oscillation (PJO). We used a high statistical confidence level of three standard deviations (strong-PJO events) instead of working with two as in previous studies. With a composite analysis, we showed that strong-PJO events show a significantly stronger downward propagating signal for northern annular mode and for the zonal mean zonal wind anomaly in the stratosphere in comparison to non-PJO events, in agreement with previous studies. The lower stratospheric difference of EP-flux-divergence between the two PJO types is found to be stronger in ERA-Interim data than in CMIP5-ESM-LR runs. The CMIP5-ESM-LR runs also indicate a significantly stronger downward propagating NAM signal in the stratosphere. We found that the response of the Arctic Oscillation to strong-PJO and non-PJO events is different in ERA-Interim but not in CMIP5-ESM-LR during the 15-day post phase after CD. During this post phase, for strong-PJO events of ERA-Interim, we identify a positive polar total ozone anomaly and a wavenumber 1 structure in mid-latitudes. Furthermore, we found a significant upper tropospheric zonally asymmetric impact for different poleward RWB events, and a regional extra-tropical surface impact, indicating a different physical action over the North Atlantic for strong-PJO events and over the North Pacific for non-PJO events. For strong-PJO events, the NAO index becomes negative and the surface jet shifts southwards, which brings less warm air to the northern European region and Eastern Arctic, causing a cooling there.
Finally, we conclude that the applied high statistical threshold to identify PJO events gives a clear separation of warm stratospheric events into strong-PJO events and non-PJO events and highlights different downward propagating NAM signal and tropospheric impacts. Furthermore, this study emphasizes some open questions outlined in the Discussion section, which may be examined in future studies.
Supplementary Materials
The following are available online at https://www.mdpi.com/2073-4433/9/12/467/s1, Table ST1: ERA-Interim, period 1979–2017, event numbers of NAM, CD and PJO diagnose, Table ST2: CMIP5-ESM-LR, period 1950–2005, LR-1 run, event numbers of NAM, CD and PJO diagnose, Table ST3: CMIP5-ESM-LR, period 1950–2005, LR-2 run, event numbers of NAM, CD and PJO diagnose, Table ST4: CMIP5-ESM-LR, period 1950–2005, LR-3 run, event numbers of NAM, CD and PJO diagnose; Figure S1. The scheme shows the main subjects of this study, the cross-section of the climatological zonal mean zonal wind (ZMZW, blue contours) with the polar-night jet (m/s; PNJ(U)) and subtropical jet (m/s; SJ(U)), and the mean zonal mean temperature (K; T, red contours) for boreal winters.; Figure S2. Mean composites of surface pressure anomaly (Pa) for strong-PJO (a), non-PJO (b), and difference of strong-PJO minus non-PJO (c) for ERA-Interim during 1–15 days after CD. Thick black (green) line in (c) includes area of significant differences with student t-test of 80 % (90 %) confidence.; Figure S3. Same as Figure S2 for mean composites of geopotential height anomaly (m) at 1000 hPa during 16–75 days after CD.
Author Contributions
Conceptualization, D.H.W.P. and A.Y.K.; Methodology, D.H.W.P. and A.Y.K.; Software, D.H.W.P. and A.S.; Validation, D.H.W.P., A.S. and A.Y.K.; Writing-Original Draft Preparation, D.H.W.P.; Writing-Review & Editing, A.S. and A.Y.K.
Funding
This research was funded by the German Science Foundation (DFG, under Grand PE 474/7-1/2). The publication of this article was funded by the Open Access Fund of the Leibniz Association.
Acknowledgments
We thank the Deutscher Wetterdienst for providing access to the ERA-Interim data at ECMWF and the MPI for Meteorology, Hamburg for providing access to CMIP5 outputs of MPI-ESM-LR runs. MPI-ESM has been used in the context of the CMIP5 process and is currently employed for the MPI-M contributions to CMIP6. MPI-ESM is freely available to the scientific community and can be accessed with a license on the MPI-M Model distribution website and downloaded from CERA data bank, which is the DKRZ’s long-term archive system for data and metadata. We thank Christoph Zülicke, Jorge Chau, Jerry Czarnecki, and three anonymous reviewers for their comments and suggestions that helped us to improve our manuscript. Thanks to B. Wecke for data processing and for the production of stereographic plots. Thanks are given to the Max Planck Institute for Meteorology for hospitality of AS, and to Klaus Fraedrich, where AS is a guest in his fellow group.
Conflicts of Interest
The authors declare no conflict of interest. The funders had no role in the design of the study; in the collection, analyses, or interpretation of data, in the writing of the manuscript, and in the decision to publish the results.
References
- Polvani, L.M.; Waugh, D.W. Upward wave activity flux as a precursor to extreme stratospheric events and subsequent anomalous surface weather regimes. J. Clim. 2004, 17, 3548–3554. [Google Scholar] [CrossRef]
- Andrews, D.G.; Holton, J.R.; Leovy, C.B. Middle Atmosphere Dynamics, 1st ed.; Academic Press: New York, NY, USA, 1987; Volume 40, ISBN 9780120585762. [Google Scholar]
- Baldwin, M.P.; Dunkerton, T.J. Propagation of the Arctic oscillation from the stratosphere to the troposphere. J. Geophys. Res. 1999, 104, 30937–30946. [Google Scholar] [CrossRef]
- Baldwin, M.P.; Dunkerton, T.J. Stratospheric harbingers of anomalous weather regimes. Science 2001, 294, 581–584. [Google Scholar] [CrossRef] [PubMed]
- Butler, A.H.; Sjoberg, J.P.; Seidel, D.J.; Rosenlof, K.H. A sudden stratospheric warming compendium. Earth Syst. Sci. Data 2017, 9, 63–76. [Google Scholar] [CrossRef] [Green Version]
- Kobayashi, S.; Ota, Y.; Harada, Y.; Ebita, A.; Moriya, M.; Onoda, H.; Onogi, K.; Kamahori, H.; Kobayashi, C.; Endo, H.; et al. The JRA-55 Reanalysis: General Specifications and Basic Characteristics. JMSJ 2015, 93, 5–48. [Google Scholar] [CrossRef] [Green Version]
- Baldwin, M.P.; Stephenson, D.B.; Thompson, D.W.J.; Dunkerton, T.J.; Charlton, A.J.; O’Neill, A. Stratospheric memory and skill of extended-range weather forecasts. Science 2003, 301, 636–640. [Google Scholar] [CrossRef] [PubMed]
- Sigmond, M.; Scinocca, J.F.; Kharin, V.V.; Shepherd, T.G. Enhanced seasonal forecast skill following stratospheric sudden warmings. Nat. Geosci. 2013, 6, 98–102. [Google Scholar] [CrossRef]
- Peters, D.H.W.; Schneidereit, A.; Bügelmayer, M.; Zülicke, C.; Kirchner, I. Atmospheric circulation changes in response to an observed stratospheric zonal ozone anomaly. Atmos. Ocean 2015, 53, 74–88. [Google Scholar] [CrossRef]
- Tripathi, O.P.; Charlton-Perez, A.; Sigmond, M.; Vitaret, F. Enhanced long-range forecast skill in boreal winter following stratospheric strong vortex conditions. Environ. Res. Lett. 2015, 10, 104007. [Google Scholar] [CrossRef] [Green Version]
- Karpechko, A.Y.; Hitchcock, P.; Peters, D.H.W.; Schneidereit, A. Predictability of downward propagation of major sudden stratospheric warmings. Q. J. R. Meteorol. Soc. 2017, 143, 1459–1470. [Google Scholar] [CrossRef]
- White, I.; Garfinkel, C.; Gerber, E.; Jucker, M.; Aquila, V.; Oman, L. The Downward Influence of Sudden Stratospheric Warmings: Association with Tropospheric Precursors. J. Clim. 2018. [Google Scholar] [CrossRef]
- Holton, J.R.; Mass, C. Stratospheric vacillation cycles. J. Atmos. Sci. 1976, 33, 2218–2225. [Google Scholar] [CrossRef]
- Kuroda, Y.; Kodera, K. Role of the Polar-night Jet Oscillation on the formation of the Arctic Oscillation in the Northern Hemisphere in winter. J. Geophys. Res. 2004, 109, D11112. [Google Scholar] [CrossRef]
- Hitchcock, P.; Shepherd, T.G.; Manney, G.L. Statistical characterization of Arctic polar-night jet oscillation events. J. Clim. 2013, 26, 2096–2116. [Google Scholar] [CrossRef]
- Hitchcock, P.; Simpson, I.R. The downward influence of stratospheric sudden warmings. J. Atmos. Sci. 2014, 71, 3856–3876. [Google Scholar] [CrossRef]
- Maycock, A.C.; Hitchcock, P. Do split and displacement sudden stratospheric warmings have different annular mode signatures? Geophys. Res. Lett. 2015, 42, 10910–943951. [Google Scholar] [CrossRef]
- Runde, T.; Dameris, M.; Garny, H.; Kinnison, D.E. Classification of stratospheric extreme events according to their downward propagation to the troposphere. Geophys. Res. Lett. 2016, 43, 6665–6672. [Google Scholar] [CrossRef]
- Peters, D. Zur resonanten Wechselwirkung von planetaren Wellen in einem Zweischichtenmodell unter Berücksichtigung der externen Anregung einer Welle; Teil 1: Der Amplitudenverlauf. Z. Meteorol. 1985, 35, 239–251. [Google Scholar]
- Peters, D. Zur resonanten Wechselwirkung von planetaren Wellen in einem Zweischichtenmodell unter Berücksichtigung der externen Anregung einer Welle; Teil 2: Die zonal gemittelte Bewegung. Z. Meteorol. 1985, 35, 252–256. [Google Scholar]
- Palmer, T.N.; Hsu, C.-P.F. Stratospheric sudden coolings and the role of nonlinear wave interactions in preconditioning the circumpolar flow. J. Atmos. Sci. 1983, 40, 909–928. [Google Scholar] [CrossRef]
- Perlwitz, J.; Harnik, N. Downward coupling between the stratosphere and troposphere: The relative roles of wave and zonal mean processes. J. Clim. 2004, 17, 4902–4909. [Google Scholar] [CrossRef]
- Kodera, K.; Mukougawa, H.; Maury, P.; Ueda, M.; Claud, C. Absorbing and reflecting sudden stratospheric warming events and their relationship with tropospheric circulation. J. Geophys. Res. Atmos. 2016, 121, 80–94. [Google Scholar] [CrossRef] [Green Version]
- Manney, G.L.; Sabutis, J.L.; Allen, D.R.; Lahoz, W.A.; Scaife, A.A.; Randall, C.E.; Pawson, S.; Naujokat, B.; Swinbank, R. Simulations of dynamics and transport during the September 2002 Antarctic major warming. J. Atmos. Sci. 2005, 62, 690–707. [Google Scholar] [CrossRef]
- Kuroda, Y.; Kodera, K. Variability of the polar-night jet in the Northern and Southern Hemispheres. J. Geophys. Res. 2001, 106, 20703–20713. [Google Scholar] [CrossRef]
- Christiansen, B. Downward propagation of zonal mean zonal wind anomalies from the stratosphere to the troposphere: Model and reanalysis. J. Geophys. Res. 2001, 106, 27307–27322. [Google Scholar] [CrossRef] [Green Version]
- Charlton, A.J.; Polvani, L.M. A new look at stratospheric sudden warmings. Part I: Climatology and modeling benchmarks. J. Clim. 2007, 20, 449–469. [Google Scholar] [CrossRef]
- Hitchcock, P.; Shepherd, T.G. Zonal mean dynamics of extended recoveries from stratospheric sudden warmings. J. Atmos. Sci. 2013, 70, 688–707. [Google Scholar] [CrossRef]
- Simpson, I.R.; Hitchcock, P.; Seager, R.; Wu, Y.; Callaghan, P. The downward influence of uncertainty in the Northern Hemisphere stratospheric polar vortex response to climate change. J. Clim 2018, 31, 6371–6391. [Google Scholar] [CrossRef]
- Hitchcock, P.; Simpson, I.R. Quantifying eddy feedbacks and forcings in the tropospheric response to stratospheric sudden warmings. J. Atmos. Sci. 2016, 73, 3641–3657. [Google Scholar] [CrossRef]
- Peters, D.H.W.; Waugh, D.W. Influence of barotropic shear on the poleward advection of upper-tropospheric air. J. Atmos. Sci. 1996, 53, 3013–3031. [Google Scholar] [CrossRef]
- Dee, D.P.; Uppala, S.M.; Simmons, A.J.; Berrisford, P.; Poli, P.; Kobayashi, S.; Andrae, U.; Balmaseda, M.A.; Balsamo, G.; Bauer, P.; et al. The ERA-Interim reanalysis: Configuration and performance of the data assimilation system. Q. J. R. Meteorol. Soc. 2011, 137, 553–597. [Google Scholar] [CrossRef]
- Giorgetta, M.A.; Jungclaus, J.; Reick, C.H.; Legutke, S.; Bader, J.; Böttinger, M.; Brovkin, V.; Crueger, T.; Esch, M.; Fieg, K.; et al. Climate and carbon cycle changes from 1850 to 2100 in MPI-ESM simulations for the Coupled Model Intercomparison Project phase 5. J. Adv. Model. Earth Syst. 2013, 5, 572–597. [Google Scholar] [CrossRef] [Green Version]
- Schulzweida, U. Climate Data Operators (CDO) User Guide, Version 1.9.3; Max Planck Institute for Meteorology: Hamburg, Germany, 2018; Available online: https://code.mpimet.mpg.de/projects/cdo/embedded/cdo.pdf (accessed on 1 February 2018).
- Siegmund, P. Stratospheric polar cap mean height and temperature as extended-range weather predictors. Mon. Weather Rev. 2005, 133, 2436–2448. [Google Scholar] [CrossRef]
- Baldwin, M.P.; Thompson, D.W.J. A critical comparison of stratosphere -troposphere coupling indices. Q. J. R. Meteorol. Soc. 2009, 135, 1661–1672. [Google Scholar] [CrossRef]
- Taubenheim, J. Statistische Auswertung Geophysikalischer und Meteorologischer Daten; [Statistical Analysis of Geophysical and Meteorological Data]; Geest & Portig: Leipzig, Germany, 1969. [Google Scholar]
- Dunkerton, T.; Hsu, C.-P.F.; McIntyre, M.E. Some Eulerian and Langrangian diagnostics for a model stratospheric warmings. J. Atmos. Sci. 1981, 38, 819–844. [Google Scholar] [CrossRef]
- de la Càamara, A.; Abalos, M.; Hitchcock, P. Changes in stratospheric transport and mixing during sudden stratospheric warmings. J. Geophys. Res. 2018, 123, 3356–3373. [Google Scholar] [CrossRef]
- Calvo, N.; Polvani, L.M.; Solomon, S. On the surface impact of Arctic stratospheric ozone extremes. Environ. Res. Lett. 2015, 10, 094003. [Google Scholar] [CrossRef] [Green Version]
- Ivy, D.J.; Solomon, S.; Calvo, N.; Thompson, D.W.J. Observed connections of Arctic stratospheric ozone extremes to Northern Hemisphere surface climate. Environ. Res. Lett. 2017, 12, 024004. [Google Scholar] [CrossRef] [Green Version]
- Gabriel, A.; Peters, D. A diagnostic study of Rossby wave breaking events in the northern extra-tropics. JMSJ 2008, 86, 613–631. [Google Scholar] [CrossRef]
- Takaya, K.; Nakamura, H. A formulation of a wave-activity flux for stationary Rossby waves on a zonally varying basic flow. Geophys. Res. Lett. 1997, 24, 2985–2988. [Google Scholar] [CrossRef] [Green Version]
- Ambaum, M.H.P.; Hoskins, B.J.; Stephenson, D.B. Arctic oscillation or North Atlantic oscillation? J. Clim. 2001, 14, 3495–3507. [Google Scholar] [CrossRef]
- Thompson, D.W.J.; Wallace, J.M. Annular modes in the extratropical circulation. Part I: Month-to-month variability. J. Clim. 2000, 13, 1000–1016. [Google Scholar] [CrossRef]
Figure 1.
Evolution of northern annular mode (NAM) for ERA-Interim (left column) and CMIP5-ESM-LR (right column) for strong-PJO (a,b) and non-PJO (c,d). Panels (e,f) show the difference between strong-PJO and non-PJO composites, respectively; hatched areas are where the difference is statistically insignificant. Areas enclosed by thick black lines are statistically significant (95% confidence level). Vertical dashed lines mark CD, and horizontal dashed lines approximately show the tropopause and the stratopause. NAM, at each pressure level, is defined as the polar cap integrated geopotential height anomaly normalized by its mean standard deviation. ERA is the abbreviation for ECMWF re-analysis. CMIP5 stands for Coupled Model Intercomparison Project phase 5. ESM means Max-Planck-Institute Earth System Model, and LR stands for Low Resolution. PJO is the polar-night jet oscillation.

Figure 2.
Same as Figure 1 but for the evolution of zonal mean zonal wind (ZMZW) anomaly (m/s) averaged between 50° and 70° N.
Figure 2.
Same as Figure 1 but for the evolution of zonal mean zonal wind (ZMZW) anomaly (m/s) averaged between 50° and 70° N.

Figure 3.
Evolution of northern annular mode (NAM) for ERA-Interim (a,c) and for CMIP5-ESM-LR (b,d) at 10 hPa (a,b) and 1000 hPa (c,d) for strong-PJO (red) and non-PJO (blue). Black line in (a,b) indicates mean MSSW event behavior and green dashed line indicates intermediate-PJO events. The black line in (c,d) shows the polar surface pressure anomaly (SFPA) for strong-PJO. All quantities in panels (c,d) show a 21-days running mean. Thick lines indicate statistically significant differences of 95% confidence between strong-PJO and non-PJO events. Triangles indicate statistically significant differences from climate mean with a confidence of 95%. NAM, at each pressure level, is the polar cap integrated geopotential height anomaly normalized by its mean standard deviation.

Figure 4.
ERA-Interim: Altitude-time cross-sections of zonal mean eddy heat flux (a,c; K m/s), and of mean EP-flux divergence (b,d; 1/day) for strong-PJO (a,c) and non-PJO (b,d); panel (e) for heat flux and (f) for EP-flux divergence show the difference of strong-PJO minus non-PJO composite, respectively. The mean is taken over a latitudinal belt from 50°–70° N. Heat flux values are divided by (p/ 1000 hPa). Hatched areas (e,f) are statistically insignificant. Area enclosed by thick black lines are statistically significant (95% confidence level). Dashed lines mark CD (vertical) and approximated tropopause (horizontal). The standard transformed Eulerian mean diagnostics based on quasi-geostrophic approximation is calculated according to References [2,38].

Figure 5.
CMIP5-ESM-LR: Same as Figure 4.
Figure 5.
CMIP5-ESM-LR: Same as Figure 4.
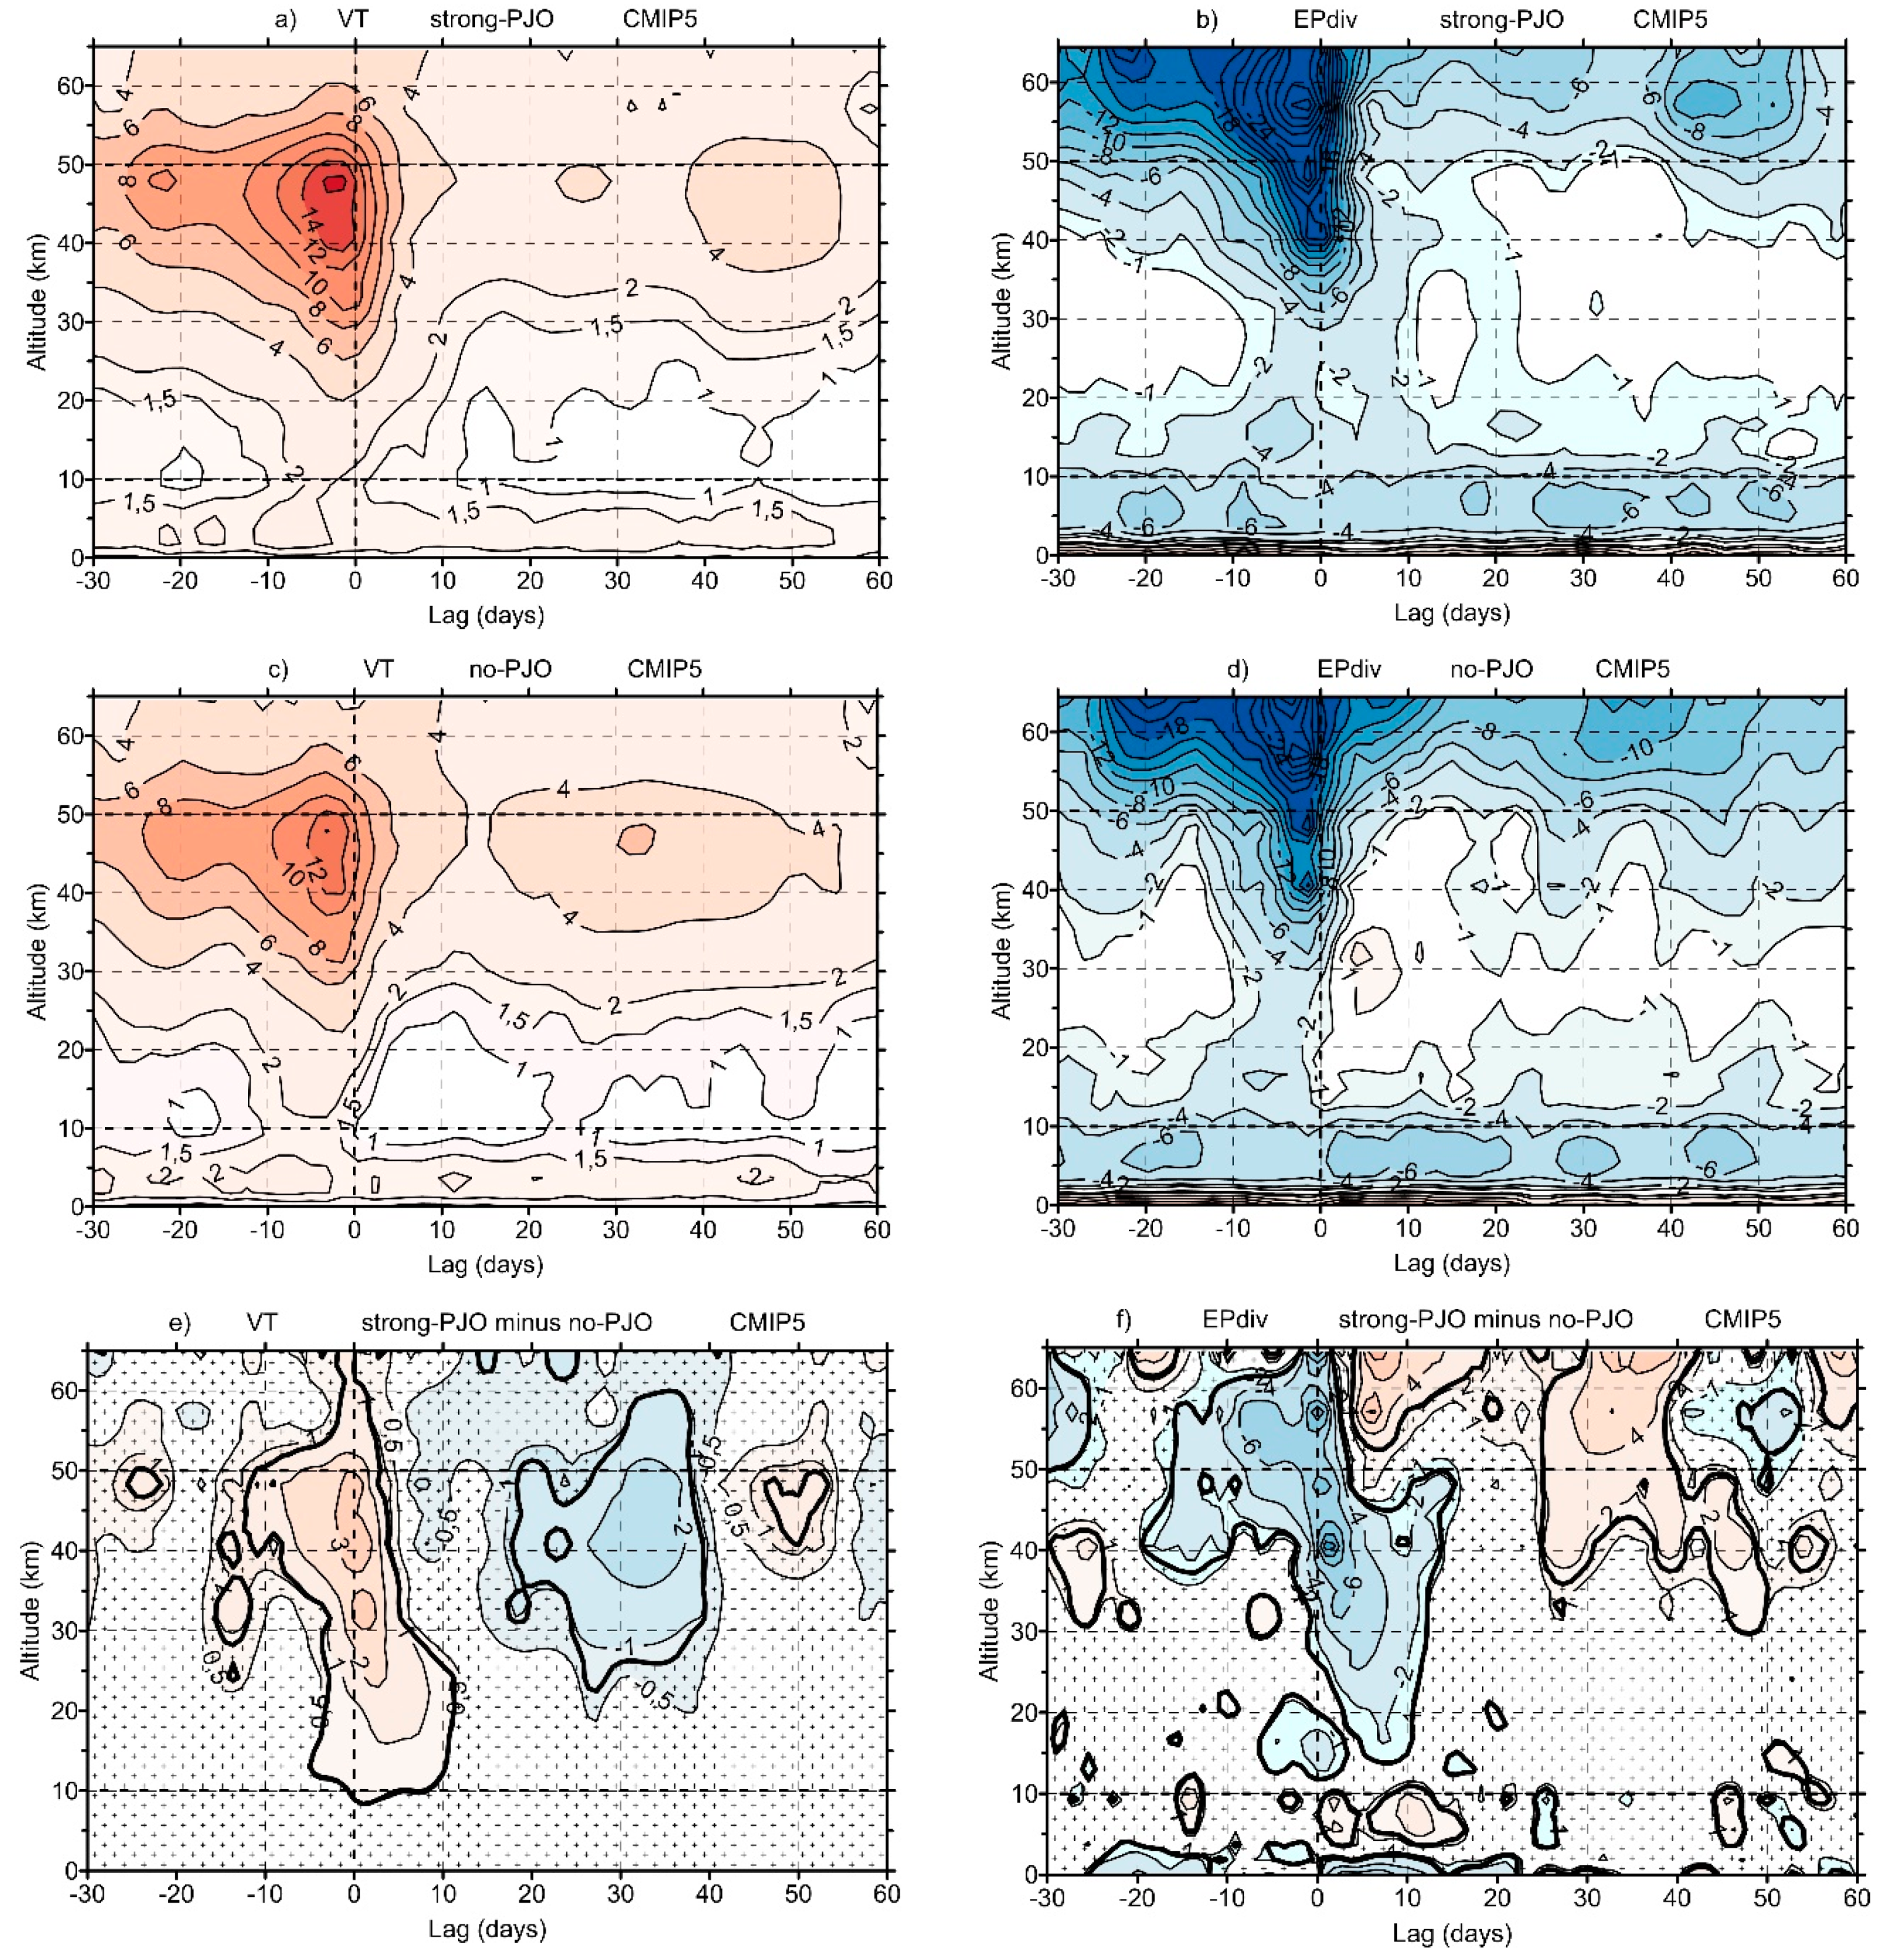
Figure 6.
Stereographic maps of mean total ozone (TO3) anomaly (10−4 kg/m2) for strong-PJO events (a), non-PJO events (b), and difference of strong-PJO minus non-PJO events (c) for ERA-Interim averaged over 15 days after CD. Thick black (green) line in (c) includes significant areas with differences of 80% (95%) confidence. Total ozone means column integrated ozone.

Figure 7.
Mean composites of geopotential height (GH) anomaly (m) (a–c,g–i) and zonal wind anomaly (m/s) (d–f) for strong-PJO (left column), for non-PJO (middle column), and difference of strong-PJO minus non-PJO (right column) for ERA-Interim at 300 hPa (a–f) and 1000 hPa (g–i) during 15 days after CD. Thick black (green) line in (c) includes areas of significant differences with student t-test of 80% (90%) confidence.


Figure 8.
Mean composites of poleward Rossby wave breaking (i.e., RWB) events (m2/s2) for strong-PJO (a,c) and non-PJO (c,d) events as a function of downstream (a,b) and upstream (c,d) breaking at upper troposphere for ERA-Interim. The mean was taken over 15 days after CD post phase. Shown are only significant patterns with 95% confidence. Details of the used RWB algorithm can be found in Reference [42].

Figure 9.
Mean 10 m (above surface) zonal wind anomaly (m/s) for strong-PJO events (a), non-PJO events (b), and difference of strong-PJO minus non-PJO events (c) for ERA-Interim during 15 days after CD. Thick black (green) line in (c) includes areas of significant differences with student’s t-test of 80% (90%) confidence.
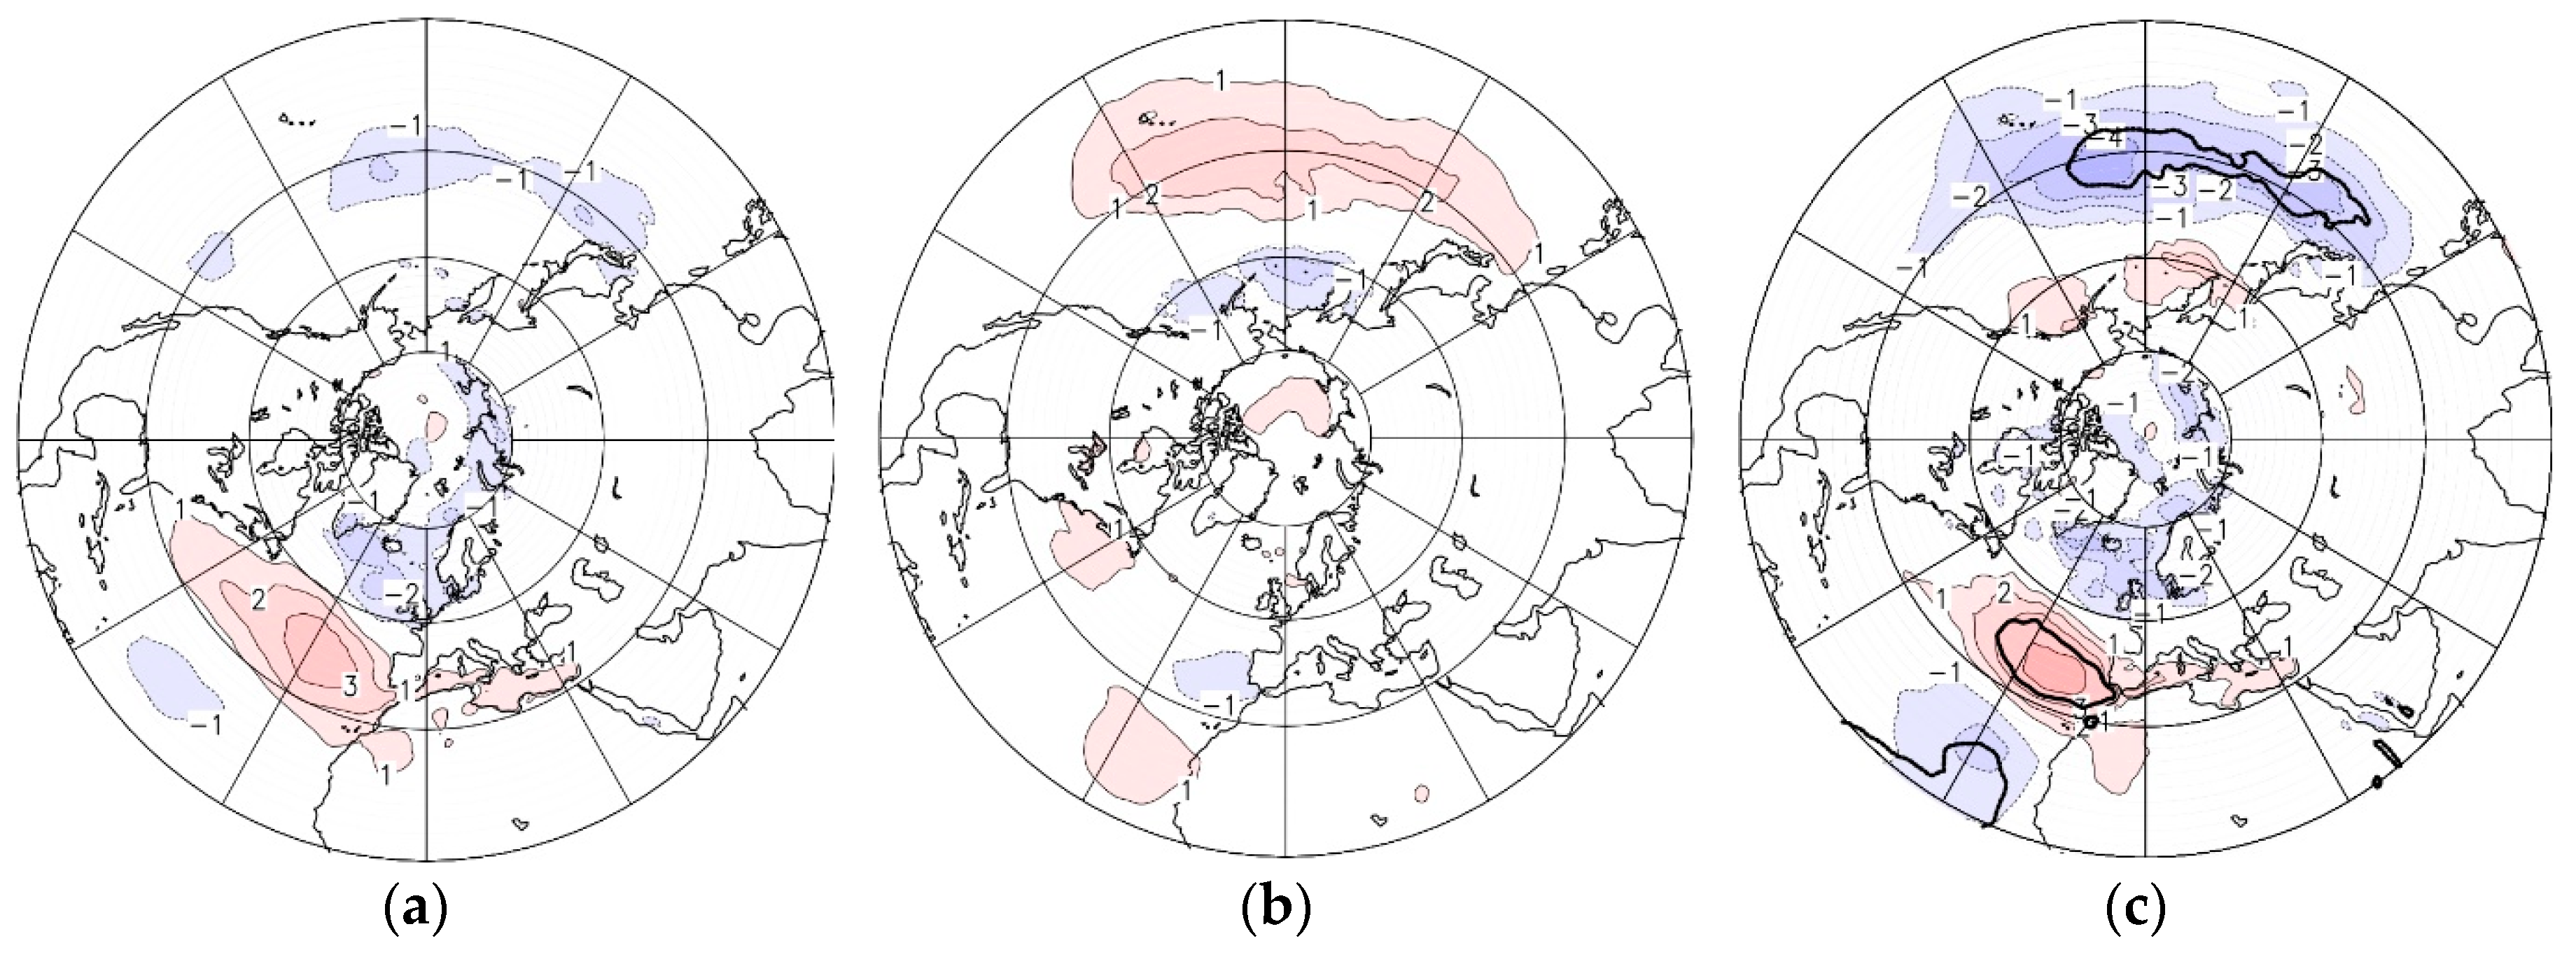
Figure 10.
Same as Figure 9 for mean 2 m (above surface) temperature anomaly (K).
Figure 10.
Same as Figure 9 for mean 2 m (above surface) temperature anomaly (K).

© 2018 by the authors. Licensee MDPI, Basel, Switzerland. This article is an open access article distributed under the terms and conditions of the Creative Commons Attribution (CC BY) license (http://creativecommons.org/licenses/by/4.0/).
Share and Cite
MDPI and ACS Style
Peters, D.H.W.; Schneidereit, A.; Karpechko, A.Y. Enhanced Stratosphere/Troposphere Coupling During Extreme Warm Stratospheric Events with Strong Polar-Night Jet Oscillation. Atmosphere 2018, 9, 467. https://doi.org/10.3390/atmos9120467
AMA Style
Peters DHW, Schneidereit A, Karpechko AY. Enhanced Stratosphere/Troposphere Coupling During Extreme Warm Stratospheric Events with Strong Polar-Night Jet Oscillation. Atmosphere. 2018; 9(12):467. https://doi.org/10.3390/atmos9120467
Chicago/Turabian StylePeters, Dieter H.W., Andrea Schneidereit, and Alexey Y. Karpechko. 2018. "Enhanced Stratosphere/Troposphere Coupling During Extreme Warm Stratospheric Events with Strong Polar-Night Jet Oscillation" Atmosphere 9, no. 12: 467. https://doi.org/10.3390/atmos9120467
Note that from the first issue of 2016, this journal uses article numbers instead of page numbers. See further details here.