Oasis Irrigation-Induced Hydro-Climatic Effects: A Case Study in the Hyper-Arid Region of Northwest China


1
Jiangsu Provincial Key Laboratory of Geographic Information Science and Technology, International Institute for Earth System Sciences, Nanjing University, Nanjing 210023, China
2
Institute of Desertification Studies, Chinese Academy of Forestry, Beijing 100091, China
3
Research Institute of Forestry Policy and Information, Chinese Academy of Forestry, Beijing 100091, China
*
Authors to whom correspondence should be addressed.
Atmosphere 2018, 9(4), 142; https://doi.org/10.3390/atmos9040142
Submission received: 7 February 2018
/
Revised: 29 March 2018
/
Accepted: 3 April 2018
/
Published: 10 April 2018
(This article belongs to the Section Biosphere/Hydrosphere/Land–Atmosphere Interactions)
Abstract
:The response of potential evapotranspiration (ET0) to widespread irrigation is important to fully understand future regional climate changes and to infer adaptive management of agricultural water resources. The quantitative impact of irrigation on ET0 from 1960 to 2013 was evaluated using historical time series data of daily meteorological observations in the hyper-arid region of northwest China. The decreasing trends in ET0 were accelerated for meteorological stations in regions with oasis agriculture, especially in the summer and during the growing season. Irrigation led to a cooling effect on temperature, increased relative humidity and precipitation. All of these changes contributed to a larger decrease of ET0 trend. The findings of this study advance our insight into the effects of irrigation on dynamics in ET0 and meteorological factors. Further investigations to understand how ET0 responds to climate change and agricultural irrigation could provide guidance for determining effective measures of water resources for adapting to global change.
1. Introduction
Over the last 50 years, human activities have dramatically altered the physical properties of the land surface by modifying the natural vegetation coverage [1,2]. Land use changes have a strong influence on local hydrological processes and affect regional and global climate change [3,4,5]. There has been growing interest to understand how climatic variables are affected by external forces such as agricultural activities [6,7,8]. Irrigation and climate change are altering the exchange of energy and heat, as well as moisture transportation, with subsequent impacts on air temperature patterns, the hydrological cycle and changes of CO2 concentrations between the atmosphere and the land surface [9,10].
ET0, as the theoretical upper limit of evapotranspiration (ET), is a vital component of water and energy budgets [11]. It is the water transferred from land to the atmosphere and reflects the interactions of the two surfaces. ET0 is mostly affected by climatic factors and is considered to be a significant indicator to reflect the effect of climate change on the water cycle [12]. In addition, irrigation is one important anthropogenic process that can affect local to regional climate and hydrology [13,14]. The impact of agricultural irrigation practices has been highlighted in both observational and model studies [15,16]. Bonfiles and Lobell has shown that irrigation expansion has led to a net cooling effect of −0.06 °C to −0.19 °C in California [17]. The suppression of human-induced greenhouse warming by increase irrigation is likely to slow in the future and changes induced by irrigation are not expected to influence broad-scale temperatures [17]. The responses of radiative and hydrological fluxes to land cover changes were also evaluated, the estimation of shortwave radiation resulted from land cover changes ranged −0.08 to −0.33 W/m2 [18,19]. However, information available to evaluate the influence of agricultural irrigation on variation of potential evapotranspiration (ET0), as one of the most important hydrological processes, in the hyper-arid region of northwest China is lacking. Currently, the extent of irrigated agriculture and irrigation water withdrawal in arid and semi-arid regions has expanded globally [20,21]. Irrigation has increased by such an extent that in Xinjiang and Qinghai, the oasis area has increased from 4.3% in 1950 to 9.7% in 2015 of Xinjiang district [22]. Generally, high irrigation density always develops along large rivers [23]. However, in inner Asia, glacial meltwater is the water source for oasis growth in which desert is the primary landscape, this is termed “desert oasis.” Desert oases are essential to agricultural production and ecosystem stability and, because of extremely low precipitation, irrigation plays an important role for oasis development [24], which in turn affects the regional hydrological cycle and climate. These areas are characterized by extremely hot and dry conditions and they are one of the most threatened environments by climate change [25]. In dry land areas investigations have shown that 90% of precipitation is taken up by evapotranspiration [26]; water availability is the primary limiting factor to plant growth and local agriculture. Accurate assessment of regional ET0 trends may improve agricultural water management and crop arrangement. ET0 can provide an effective indicator to predict drought conditions which may have an important impact on vegetation growth and therefore on land degradation. A deeper understanding of ET0 changes and its driving mechanisms is fundamental to water resource management, agricultural production and ecosystem stability in this hyper-arid region. Although meteorological factors are the main driving force for variations in ET0, agricultural activities such as changes in irrigation may also influence the regional-scale climate [17]. Changing soil moisture content by irrigation can affect ground surface albedo, air temperature and rainfall variations [27]. With increasing irrigation, more water is available for evapotranspiration and latent heat transfer; this was highlighted by Dai et al. [28] to influence regional ET0. ET0 was also found to be significantly altered by large-scale irrigation in arid or semi-arid regions of China [29], where oases agriculture has undergone rapid expansion over the last 50 years [30]. Several theoretical and observational studies have focused on local and regional climatic impacts of irrigation; the quantification of changes in driving factors of ET0 induced by irrigation in the hyper-arid region is limited.
The key objectives of this study are to evaluate differences in the response of irrigation to ET0 and meteorological factors. Agricultural irrigation influences were estimated by comparing observed ET0 and the trends of meteorological factors were also evaluated with or without the effect of irrigation. These include: (1) exploring the trends of temporal ET0 and meteorological factors in different stations from 1960 to 2013; (2) assessing the different effects of agricultural irrigation and climate change on ET0 change.
2. Materials and Methods
2.1. Study Area and Data
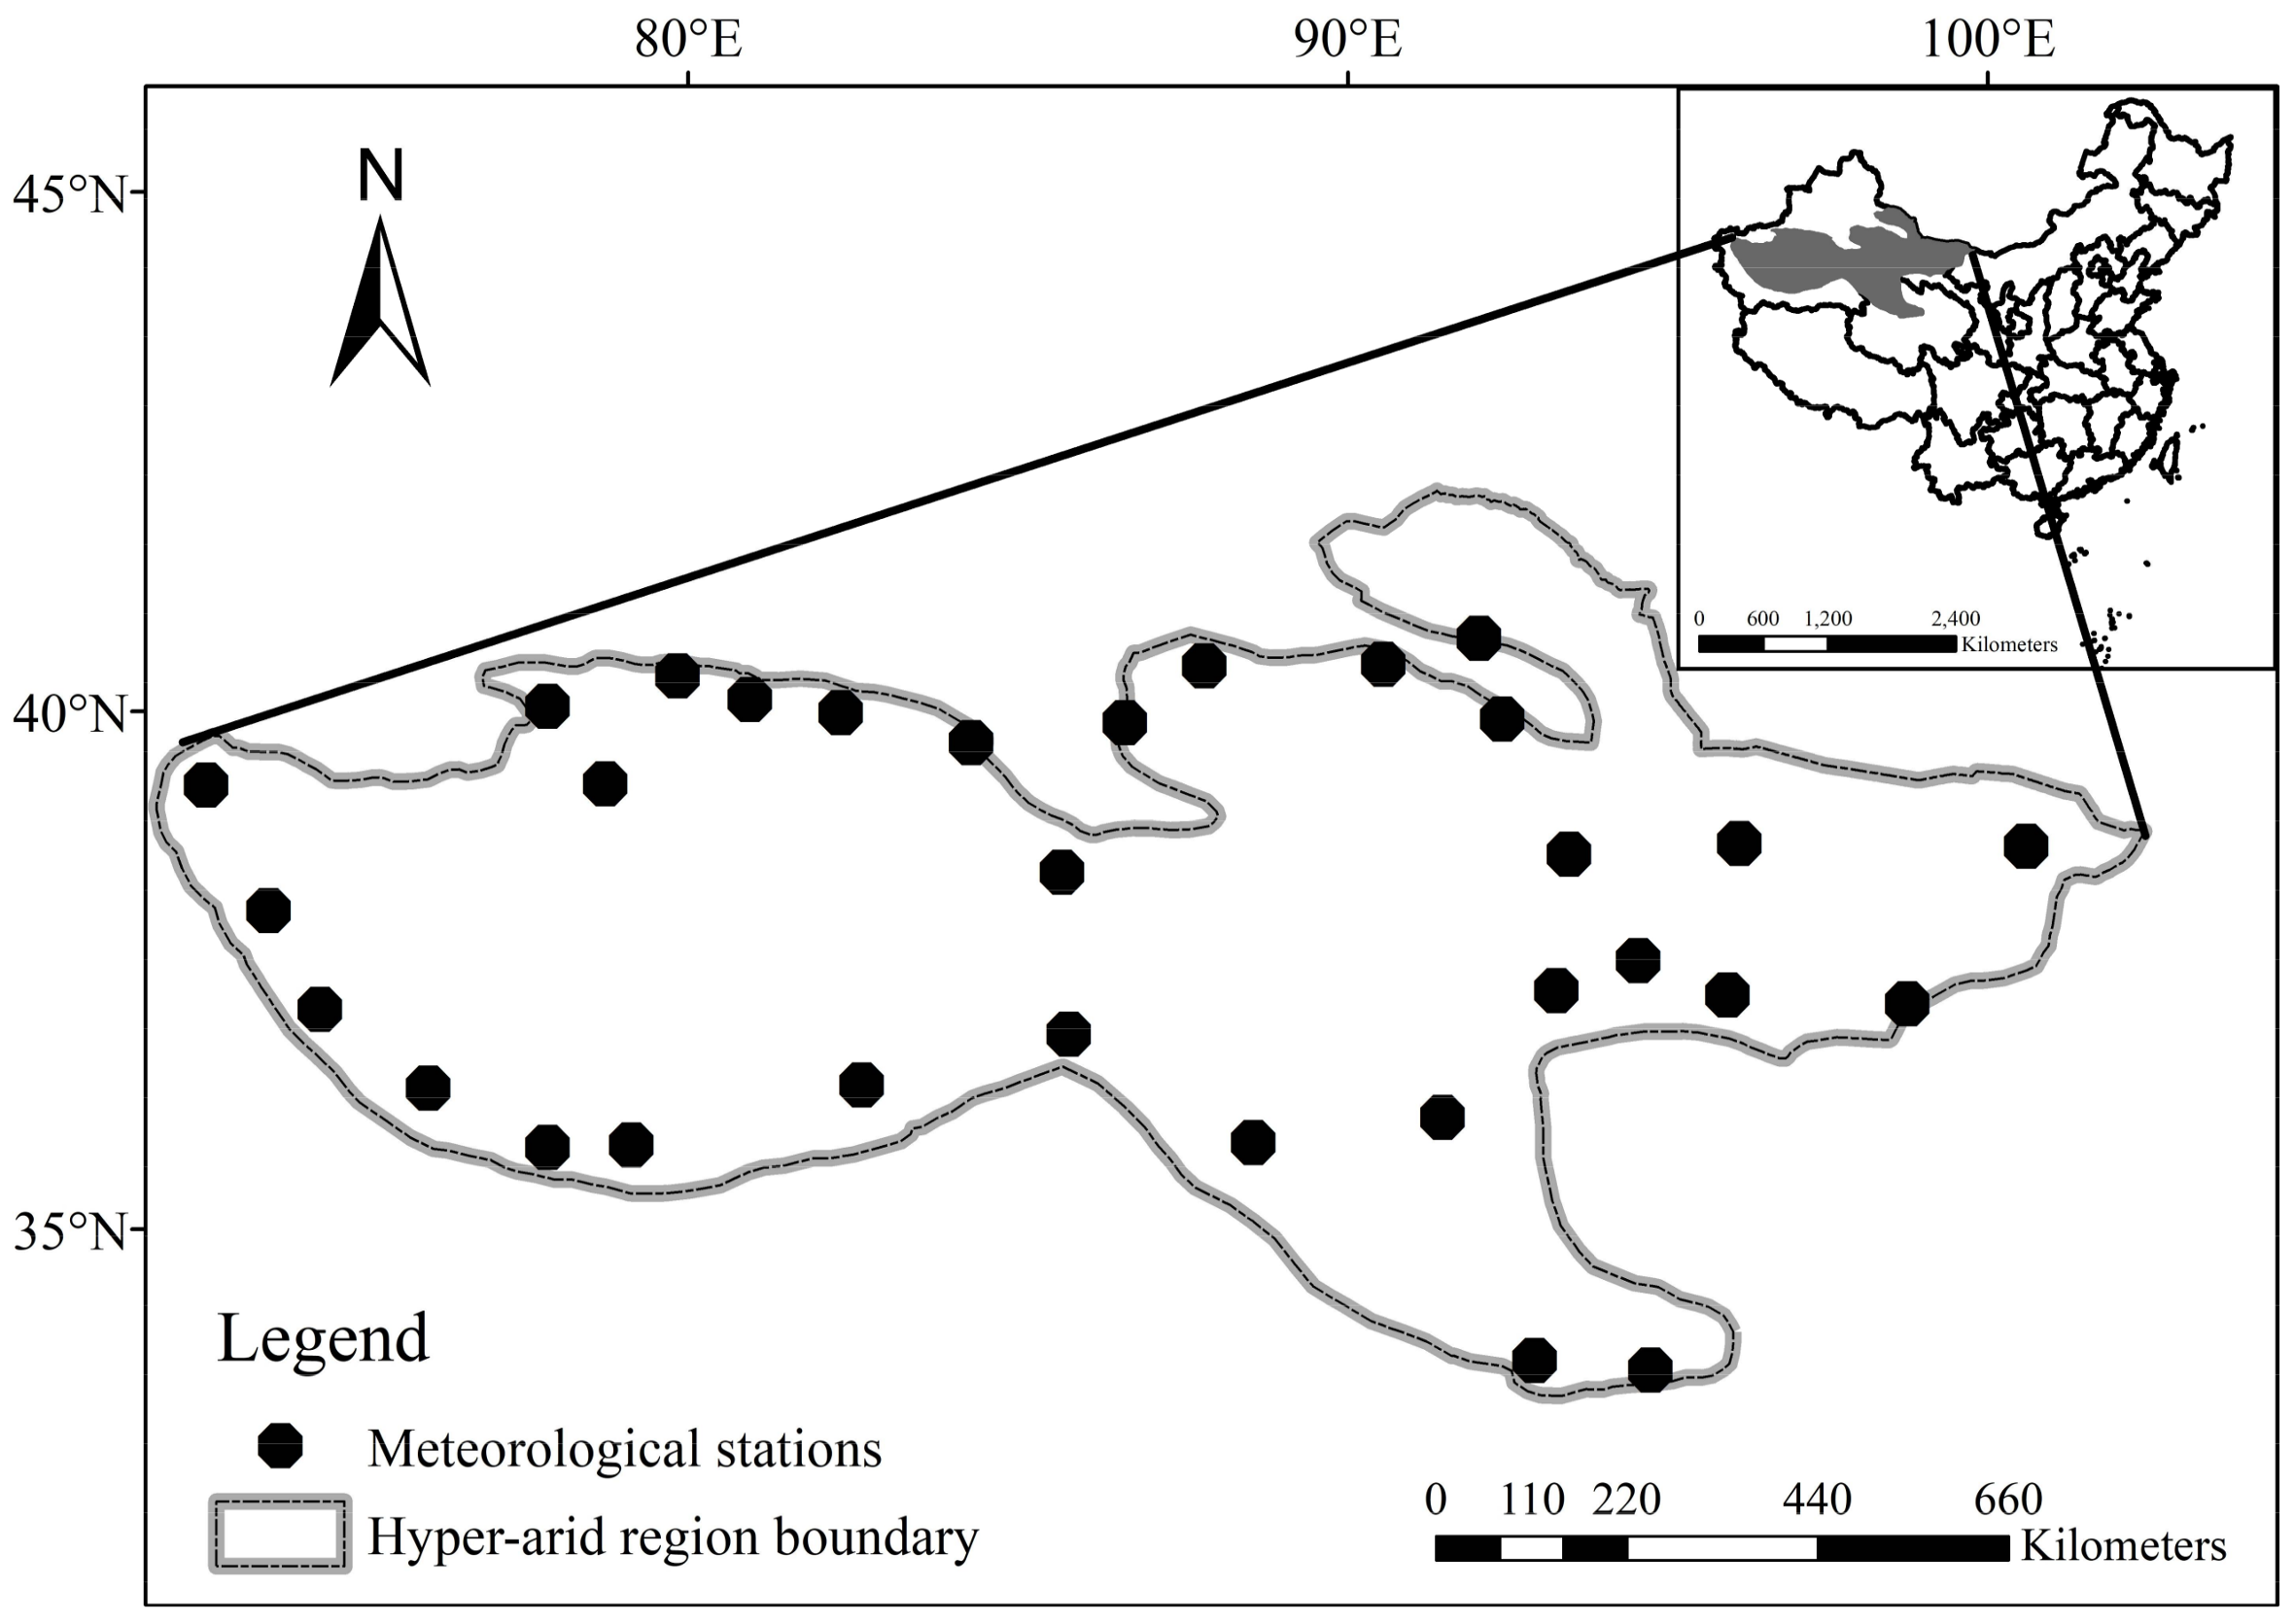
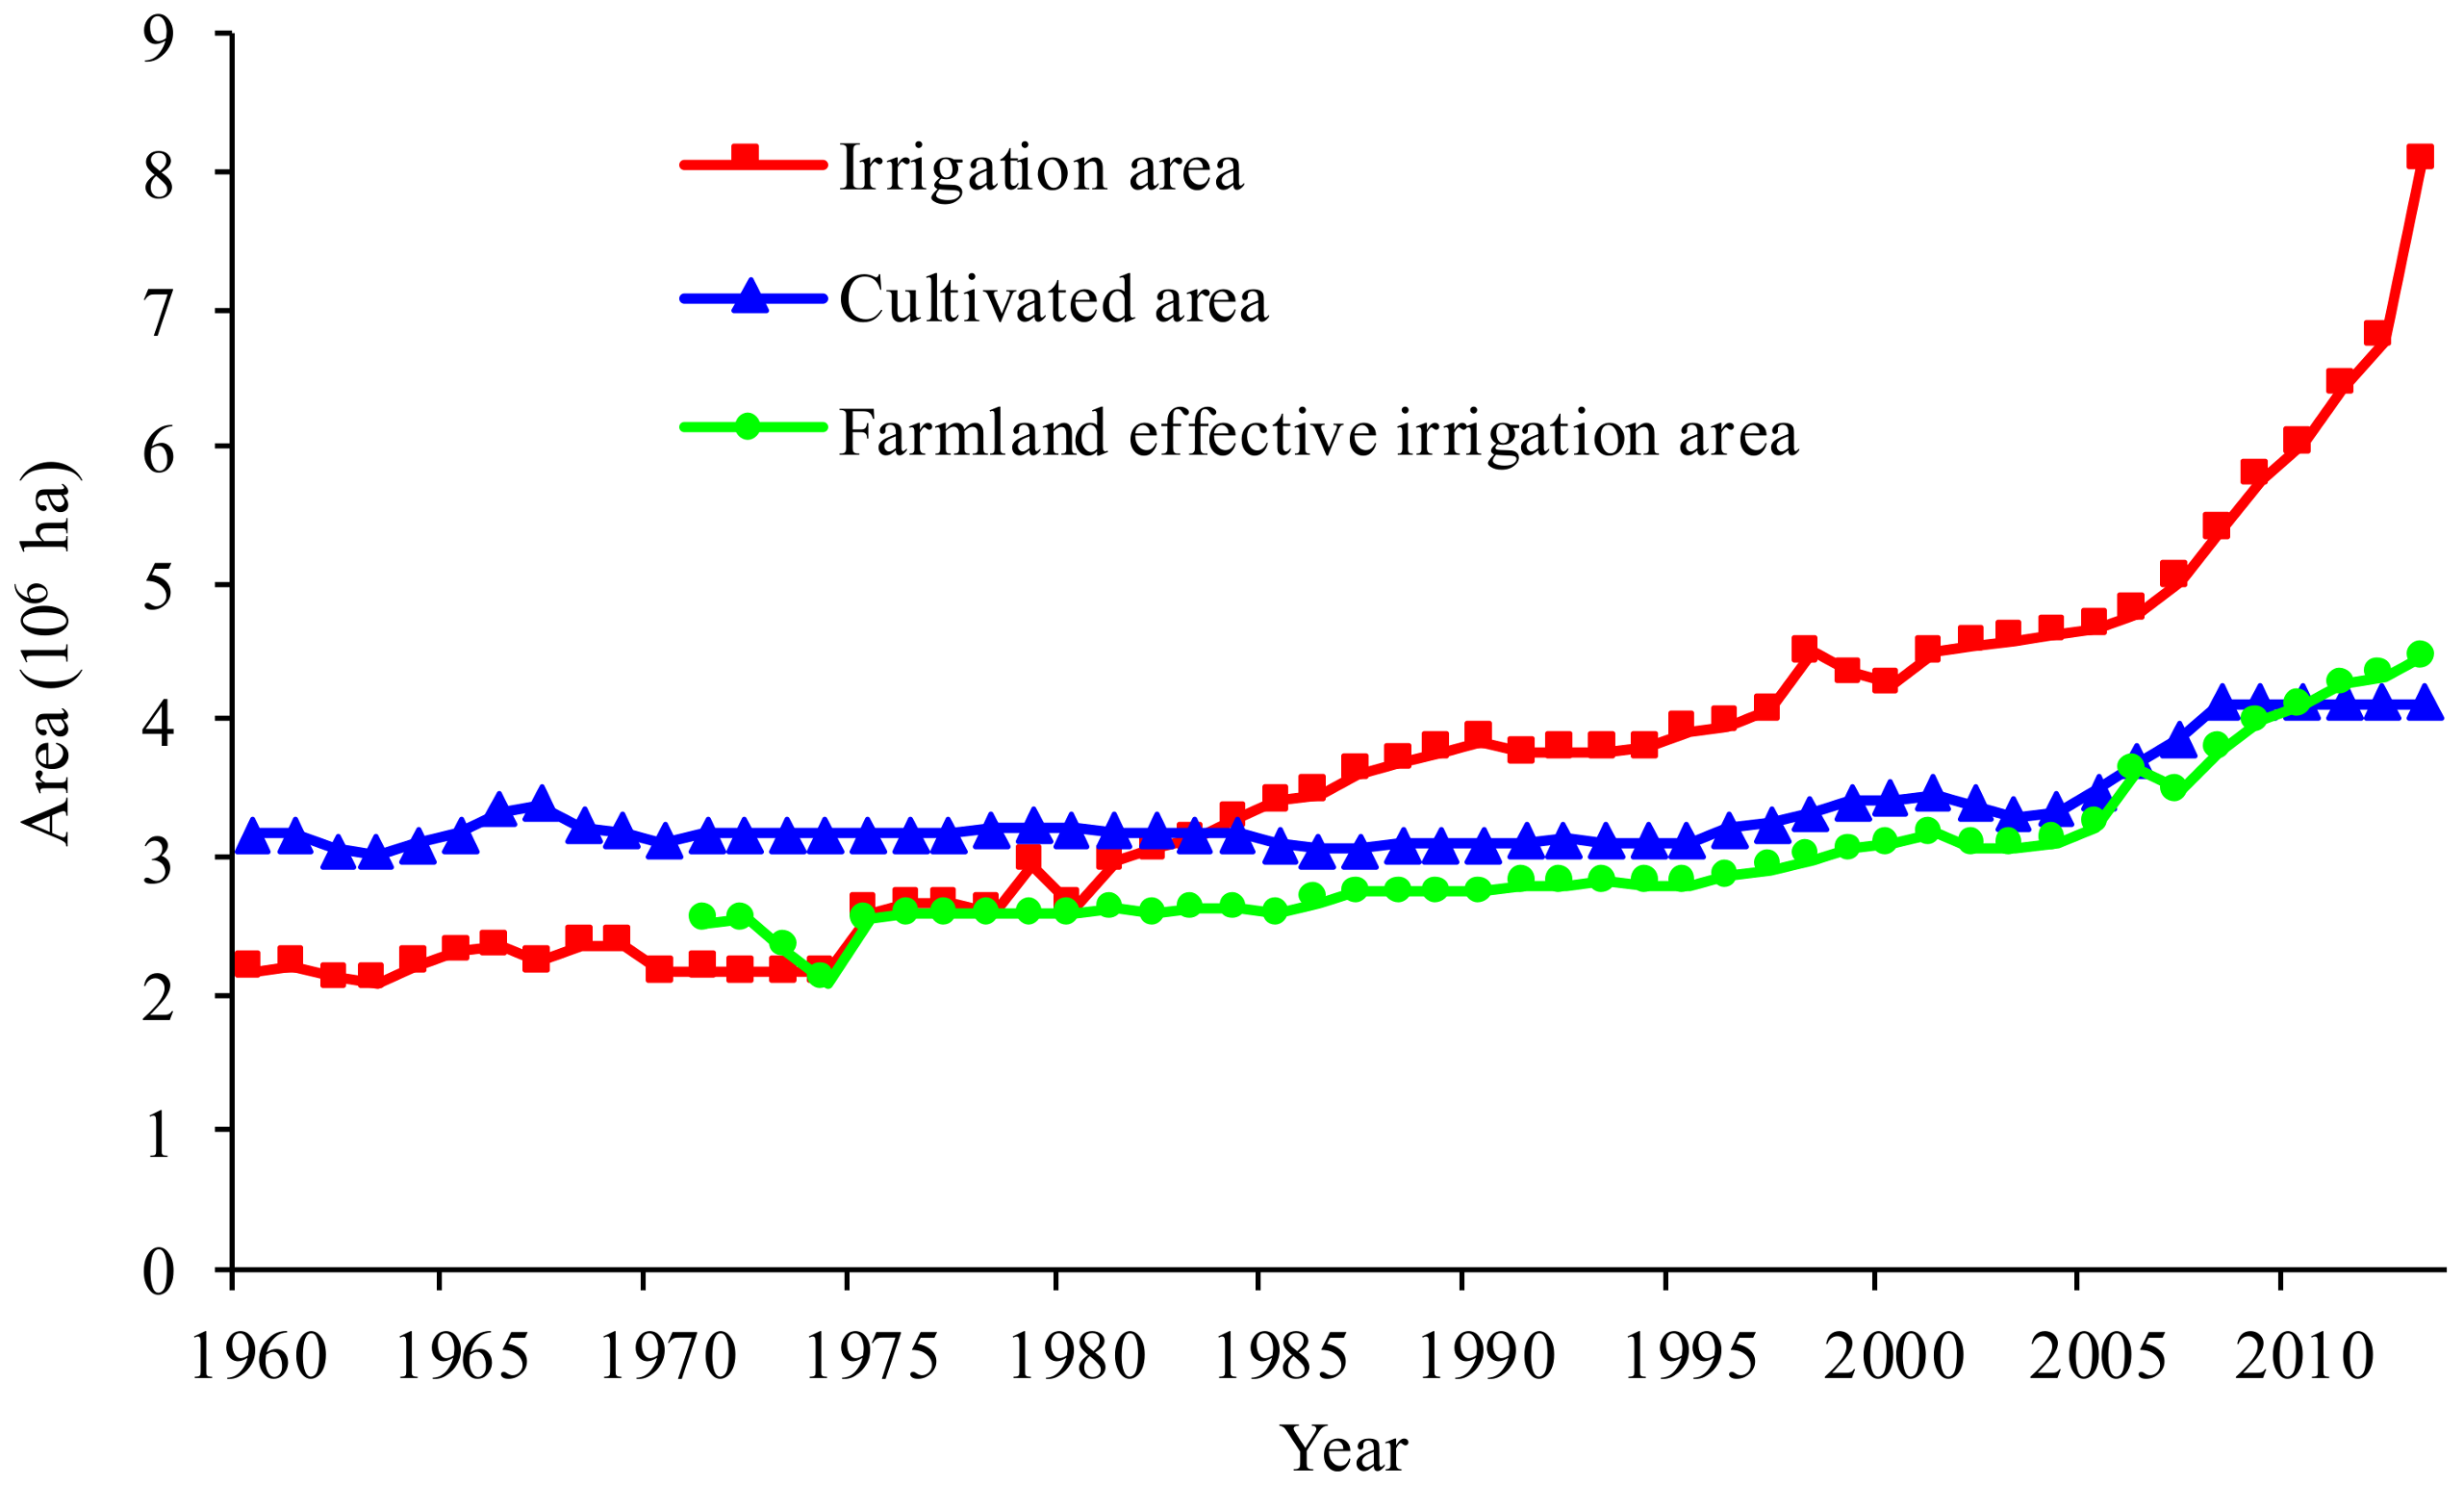
The hyper-arid region of northwest China, covering an area of 109.5 × 10⁴ km2, is located in the central area of Eurasia; it includes the southern part of Xinjiang and a small area of Qinghai, Gansu and Inner Mongolia (Figure 1). This region accounts for 11.4% of China’s total land area surface. The region exhibits extreme arid climatic features: it has annual precipitation levels of 55 mm and annual reference evapotranspiration of 1246 mm. The land surface is predominantly barren or sparsely vegetated. Due to glacial meltwater, many oases are present in this region (Egina, Hotan and Ruoqiang for example); the majority of cultivated areas are located in oases with irrigation. The irrigation area of Xinjiang has increased from 2.17 × 10⁶ ha to 8.08 × 10⁶ ha from 1960 to 2013 [31], cultivated land has increased from 3.15 × 10⁶ ha to 4.12 × 10⁶ ha from 1960 to 2013 (Figure 2). Since China began a new era of reform and opening up during the 1980s, agricultural development has increased, most notably after the year 2000, which has resulted in a significant increase in area of irrigation. During the period of 1980s and 1990s, the development and expansion of artificial oasis and artificial afforestation have changed the original landscape greatly and large areas of desert near to oasis have been converted to cropland and shelter-forest [32]. However, increasing agricultural irrigation has placed severe pressure on water resource utilization with agriculture becoming the biggest water user in this region. Rapid population growth and intense cultivation has exacerbated land degradation and water depletion.
In this study, daily meteorological data from 1960 to 2013 were obtained from 31 weather stations in the hyper-arid region of northwest China. The data has been provided and quality-tested by the National Climatic Centre of the China Meteorological Administration. Six daily meteorological variables were recorded: (1) minimum air temperature (Tmin, °C); (2) maximum air temperature (Tmax, °C); (3) mean relative humidity (RH, %); (4) mean wind speed at 10 m (WS, m/s); (5) sunshine hours (N, h); and (6) precipitation (P, mm). Wind speed at a height of 2 m was calculated from the data for its inclusion in the Penman-Montieth FAO 56 formula [33]. The missing data only account for 0.07%, any data missing from the information were substituted with average data calculated between the previous and the following year. The seasons were divided into: spring (March to May); summer (June to August); autumn (September to November); winter (December to February); and the growing season (April to September).
Land use data with 1 km resolution provided by the Environmental and Ecological Science Data Centre for West China was used to identify the effect of human activities on ET0 and meteorological variables [30]. In addition, we also collected the land use maps of 1992, 1995, 2000, 2005 and 2010, with higher spatial resolution of 300 m, for further analyze the changes of land use in our study (http://maps.elie.ucl.ac.be/CCI/viewer/download.php). In this paper, agricultural area refers to cropland and desert area refers to predominantly barren or sparsely vegetated land. The average percentages of cultivated land, bare land within a 1–30 km radius of each weather station were calculated to reflect the effects of agricultural activities [34].
2.2. Categorization of Meteorological Stations
In order to determine the influence of agricultural irrigation on ET0 trend, agricultural station and no-agricultural station needed to separate, which was the basis of further study of hydro-climatic effect induced by irrigation. The effects of irrigation on ET0 trends largely depend on how the land use around the meteorological stations are classified; the classification criterion (agricultural vs. non-agricultural land use) being based on the percentage of the dominant land use type within a certain radius. In previous studies by Rim [35] and Lobell and Bonfils [36], different radii were used to evaluate the effect of irrigation on ET0 and climatic trends. To determine the most suitable radius, the relationships between the ET0 trends and different land use ratios within the different radii of each station were evaluated using a linear regression method. As seen in Table 1, annual ET0 trends and trends during the growing season were negatively correlated with cultivated land ratio; the correlations were most significant at a radius of 3–4 km. However, annual and growing season ET0 trends were positively correlated with the proportion of bare land and the correlation was highly significant at a radius of 3–7 km. With an increase in radius, the correlation coefficients between ET0 and the ratios of cultivated and bare land initially indicated an increasing trend before decreasing. The 4 km radius was therefore selected to evaluate the irrigation influence on each meteorological station in the hyper-arid region.
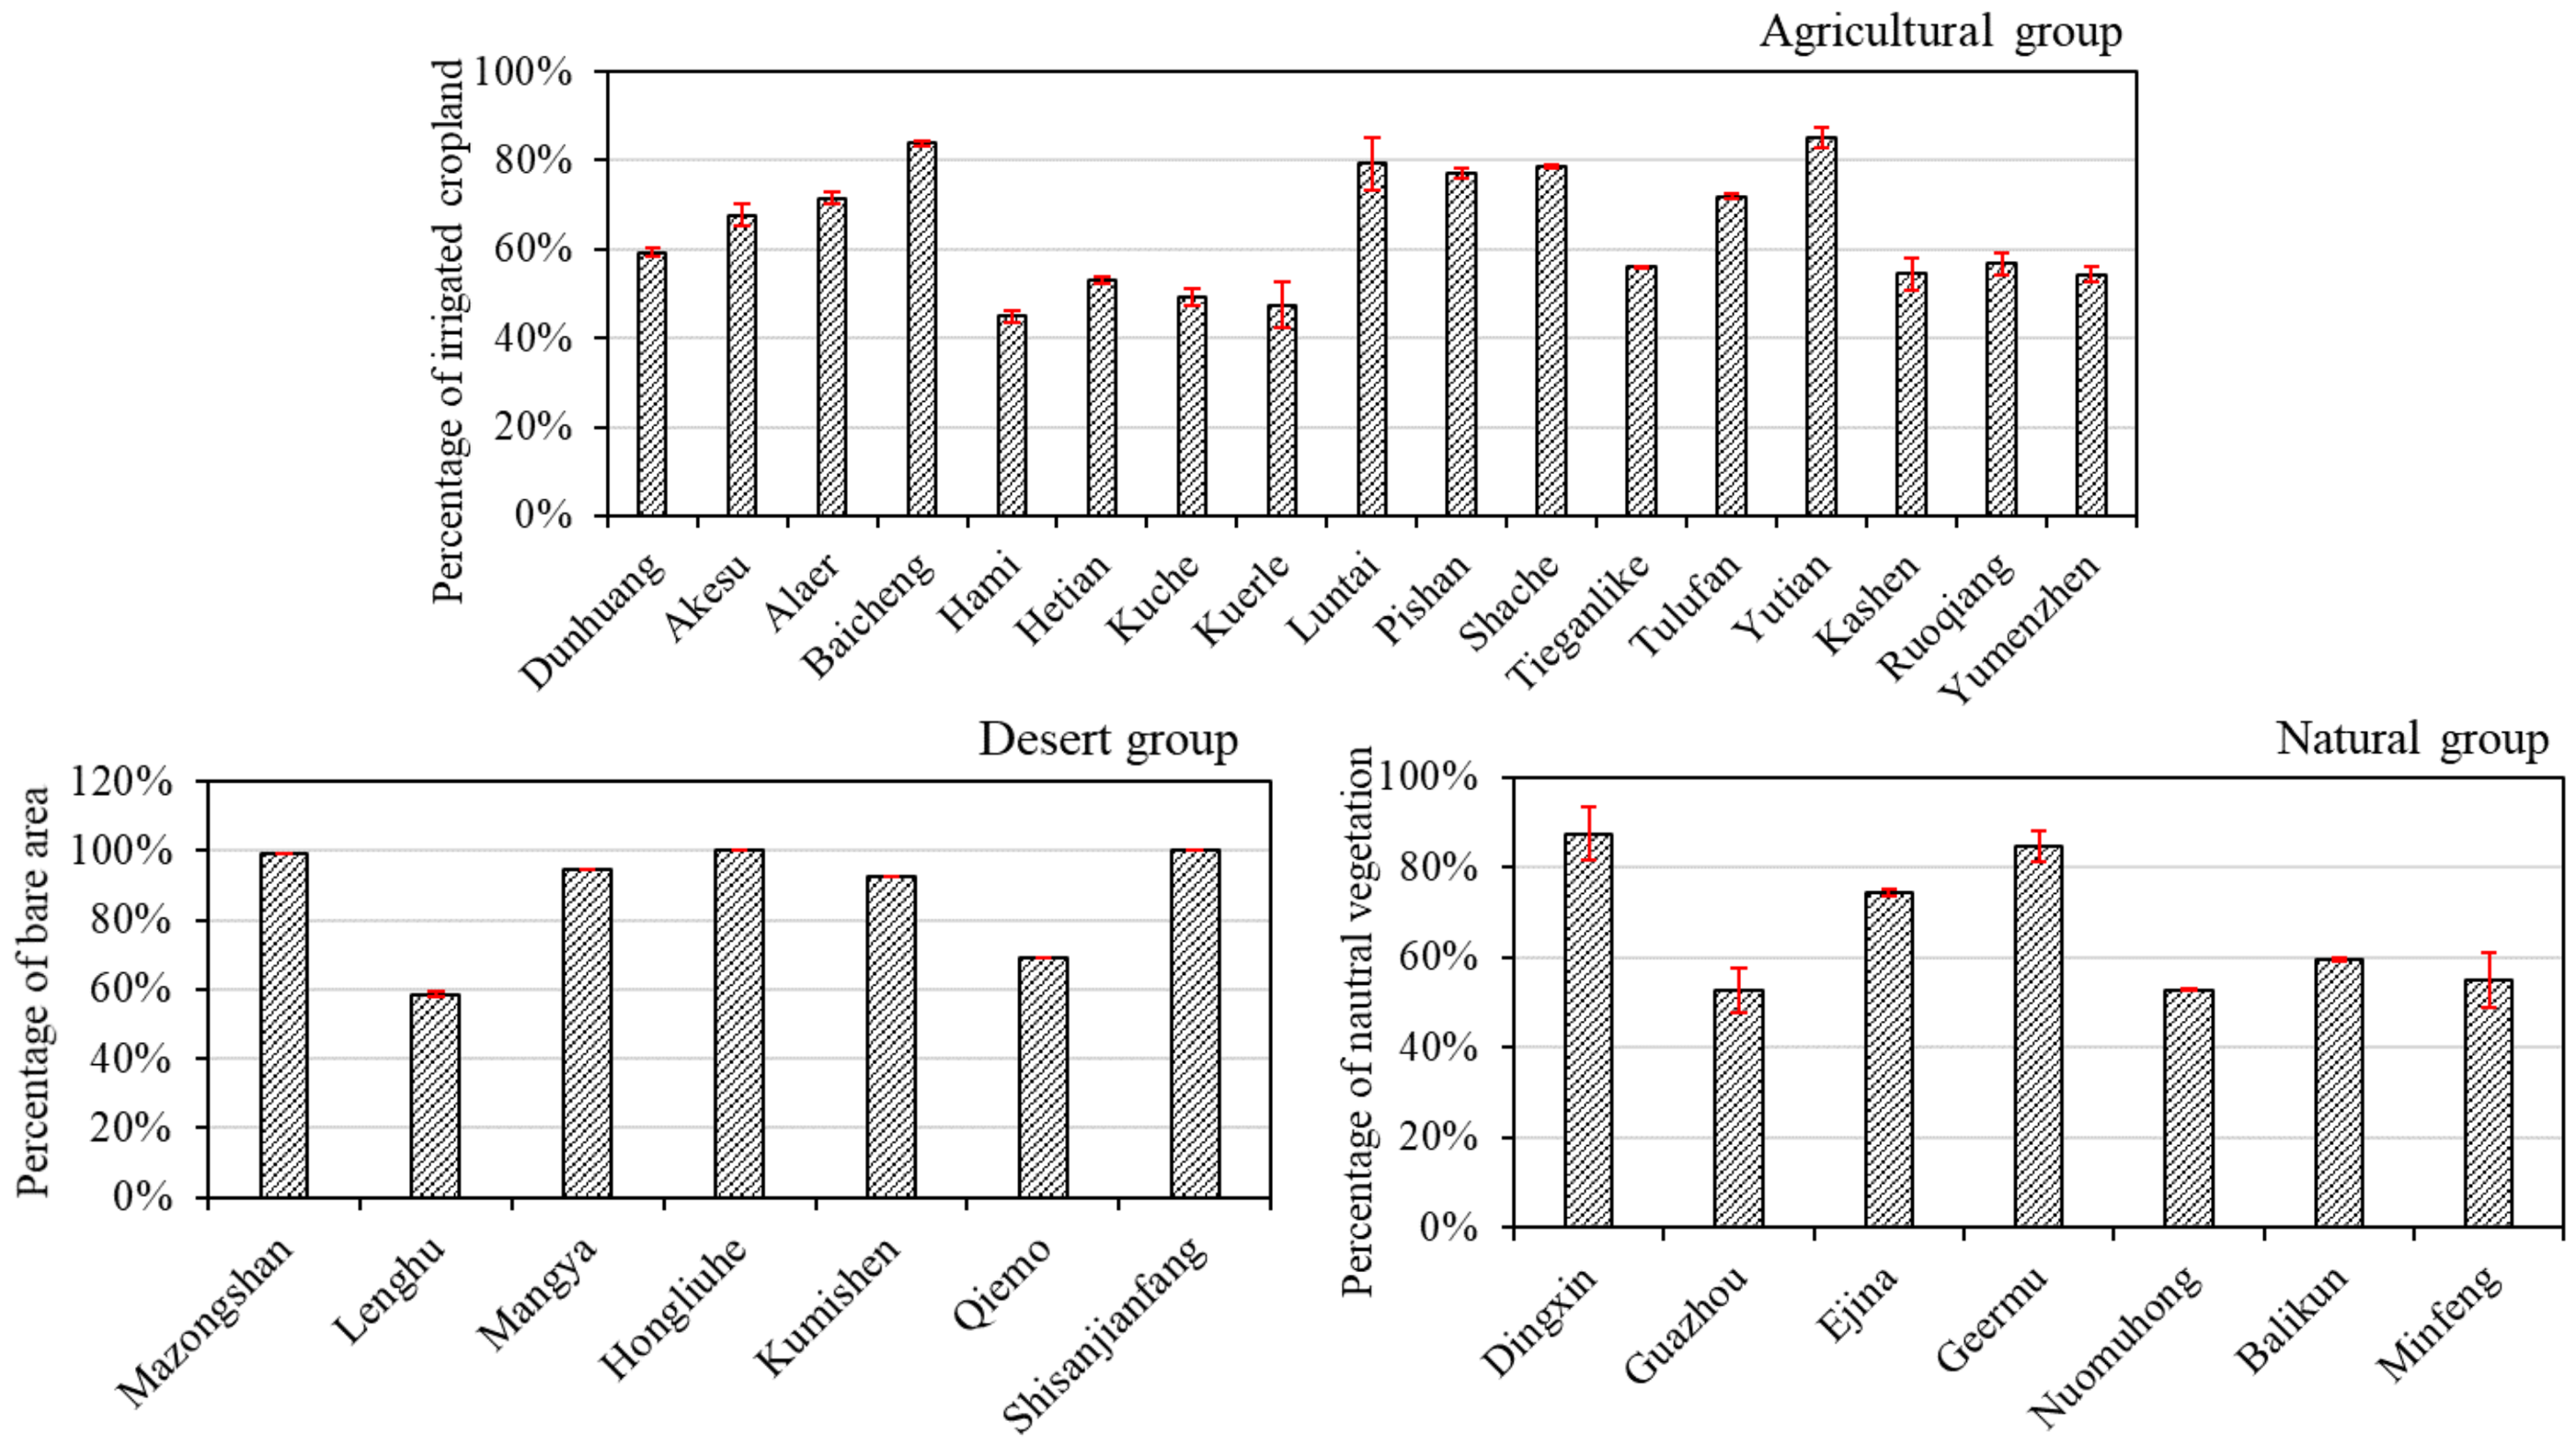
Based on the percentage of the dominant land use type within the designated 4 km radius around each meteorological station, the stations were classified into three groups: (1) agricultural group with irrigation if the cultivated land ratio is larger than 50% (2) desert group without irrigation if the sparse vegetation and bare land ratio is larger than 50%; and (3) natural group without irrigation and with natural vegetation larger than 50%. The results indicated that 17 stations were classified into the agricultural group, 7 stations into the desert group and 7 stations into the natural group. Due to the distinctive irrigation feature described in Section 2.1, the prominent characteristics of desert oasis and irrigation agriculture made the dominant land cover around meteorological station relative stable. In order to verify this hypothesis to a certain extent, the average percentages of cultivated land, bare land and natural vegetation within 4 km radius of each weather station were extracted based on the land use map of 1992, 1995, 2000, 2005 and 2010. The annual mean values and standard deviation were calculated and shown in Figure 3. The percentages of irrigated cropland were different, ranging between 45% at Hami and 85% at Yutian station. The majority of stations showed only small changes and larger changes were detected at Luntai station. For the desert group, the percentage of bare area was relative high with little changes. More than 80% was found at five stations, accounting for 71.4%. For the natural group, the percentage of natural vegetation ranged between 53% at Guazhou station and 87% at Dingxin station. So, the result of station categorization in our study was acceptable and feasible.
2.3. Estimation of ET0
The modified Penman-Monteith method of Allen et al. [37] used to calculate ET0 was:
where ET0 is the reference evapotranspiration (mm d−1); ∆ is the slope of the vapor pressure curve (kPa °C−1); and γ is the psychometric constant (kPa °C−1). Rn is the net radiation at ground surface (MJ m−2 d−1); G is the soil heat flux (MJ m−2 d−1); T is the mean daily air temperature (°C); U2 is the daily average wind speed at 2 m height (m s−1); and es − ea is the saturation vapor pressure deficit (kPa). G is usually small compared with Rn and it was assumed to be zero over the daily period or longer [33]. Radiation is a key term to calculate ET0 and it is often estimated from sunshine data using the Angstrom formula in which the Angstrom coefficients are a = 0.25, b = 0.5. When sunshine duration data were missing, radiation was estimated from Tmax and Tmin using the Hargreaves radiation equation [38], in which the empirically adjusted coefficient is usually 0.16 for inland regions [33].
2.4. Statistical Analysis
The nonparametric Mann–Kendall test was used to estimate the significance of long-term time series in ET0 and meteorological variables [39,40] and the method by Sen was used to estimate the slope [41]. The two methods do not require the assumption of normality or the assumption of homogeneity of variance, while single data errors or outliers do not significantly affect trend detection [42]. However, serial correlations may increase the probability of significant trends and they should be removed [43,44]. The trend-free pre-whitening method was used to eliminate the effect of serial correlation on the Mann-Kendall test [45]. The relationship between the trends in ET0 and the sum of cultivated land and urban land, barren or sparsely vegetated lands within a certain radius were obtained using linear regression. The statistical significance of the correlation coefficient was evaluated using the t-test.
3. Results
3.1. Hydro-Climatic Characteristics
General hydro-climatic characteristics of the three groups are shown in Table 2. The average value of ET0 in the desert group was 1405.4 mm, this being larger than the average values in the other groups. The average values of Tmax, Tmin and RH in the desert group were the smallest in three groups and those in the agricultural group were the largest. However, the desert group had higher wind speeds and sunshine hours than the other groups, with average values of 3.8 m/s and 3230.6 h/a, respectively.
3.2. Spatial Distribution of ET0 Trends
Most meteorological stations (22 out of 31 stations) recorded a decreasing trend (Figure 4) and more than half of stations showed a significant level of ET0 decline at the 95% confidence level. In the study area, the ET0 trends mainly ranged from −40 mm/decade to 40 mm/decade; higher values were located in the northeastern area of the semi-arid region, where significant increasing trends were recorded at three stations (accounting for less than 10%).
The annual and seasonal magnitude of difference for the ET0 trends in the different station groups from 1960 to 2013 are shown in Table 3. The decreasing ET0 trends identified in our results could clearly be seen for all groups. The average annual decrease in ET0 in the agricultural group was greater than that in the natural group, while the annual ET0 in the desert group showed an increasing trend. Irrigation-induced decrease in annual ET0 was −33.65 mm/decade. For the majority of seasonal ET0 results, ET0 decreased the fastest in the agricultural group whilst the desert group recorded the fastest ET0 increase. Note that all annual trends represent cumulative seasonal trends but that seasonal values do not exactly sum to the annual value due to non-normal data distributions.
Due to the effects of agricultural activities the trend of annual ET0 changes was different for each type of land use. Figure 5 shows the percentage of stations with different trends for annual ET0. There were more stations with negative trends than positive trends in the three groups, especially for the agricultural group with irrigation. More than 60% of stations in this group recorded significant decreasing ET0 trends. However, three stations in the desert group recorded significant increasing ET0 trends; this increase being the most significant of the three groups. In the natural group, the decreasing ET0 trends were significant and the increasing ET0 trends were insignificant. With more irrigation and oasis expansion, the significant decreasing trend in ET0 might be more obvious.
3.3. Irrigation-Induced ET0 Effect
To evaluate variations in annual ET0 from 1960 to 2013, the station-average ET0 anomalies in the different station groups were calculated (Figure 6). Differences in annual ET0 time series between the agricultural group and the desert group were also calculated to eliminate the climatic effect from those of the agricultural group influenced by irrigation. The greater difference implied more significant irrigation effects. Prior to 1980s, ET0 in the agricultural group was larger than that in the desert group. However, the decreasing trend in ET0 in the agricultural group and the increasing trend in the desert group led to the ET0 differences between these two groups to decrease. From 1980s to 1996, ET0 in the desert group decreased and the trend in ET0 was lower than that in the agricultural group. After 1996, ET0 in both the agricultural and desert groups indicated an increasing trend, though the level of ET0 increase in the agricultural group was lower than the level of increase in the desert group. The trend in ET0 anomaly differences indicated a significant decreasing trend, an occurrence which maybe a result of increased irrigation.
A comparison of ET0 trends was undertaken between the weather station groups across different time periods, results of which are shown in Table 4. For this comparison, the study periods were separated into three stages: 1960–1970; 1970–1992; 1992–2013. From 1960 to 1970 ET0 showed an increasing trend. The lowest and largest magnitude of ET0 during this period was evident in the agricultural group and desert group, with a slope of 10.90 mm/decade and 92.85 mm/decade, respectively. From 1970 to 1992, ET0 decreased with a magnitude of −80.38 mm/decade for the agricultural group; this decreasing trend was faster than the decreasing trends for the other two groups (−34.46 and −64.21 for the desert group and natural group, respectively). After 1992 ET0 increased again; the magnitude of change was 59.53 mm/decade in the agricultural group and the increasing trend was largest in the desert group with slopes of 103.72 mm/decade. The differences in ET0 trends through the three time periods may be linked to irrigation which significantly affected ET0 trends.
To further understand the effects irrigation had on ET0 changes, time series analysis of irrigation during the growing season and in the summer months at the different station groups was undertaken, ET0 trends are shown in Figure 7. Variations in the station-average ET0 for the different groups during the summer and growing seasons were similar to those in the annual trend with the variability of ET0 trend in desert group larger than that in agricultural group (Figure 6). ET0 trends for the summer months showed an increase before 1970, with a slope of 5.85 mm/decade for the agricultural group and a 31.78 mm/decade increase for the desert group. From 1970 to 1992 a decreasing ET0 trend was recorded for all groups; the agricultural group recorded a greater decrease then the desert group, the difference between the two groups was −17.14 mm/decade. After 1992, an increasing ET0 trend was again recorded. The increase for the agricultural group (23.04 mm/decade) was smaller than the increase for the desert group (44.83 mm/decade). Results for the growing season showed a greater magnitude of variation. ET0 increases were larger than those in the summer months before 1970 and after 1992 and the ET0 decrease was also greater from 1970 to 1992. The decreasing trend in ET0 was −58.85 mm/decade for the agricultural group and −24.11 mm/decade for the desert group.
3.4. Irrigation-Induced Climatic Effect
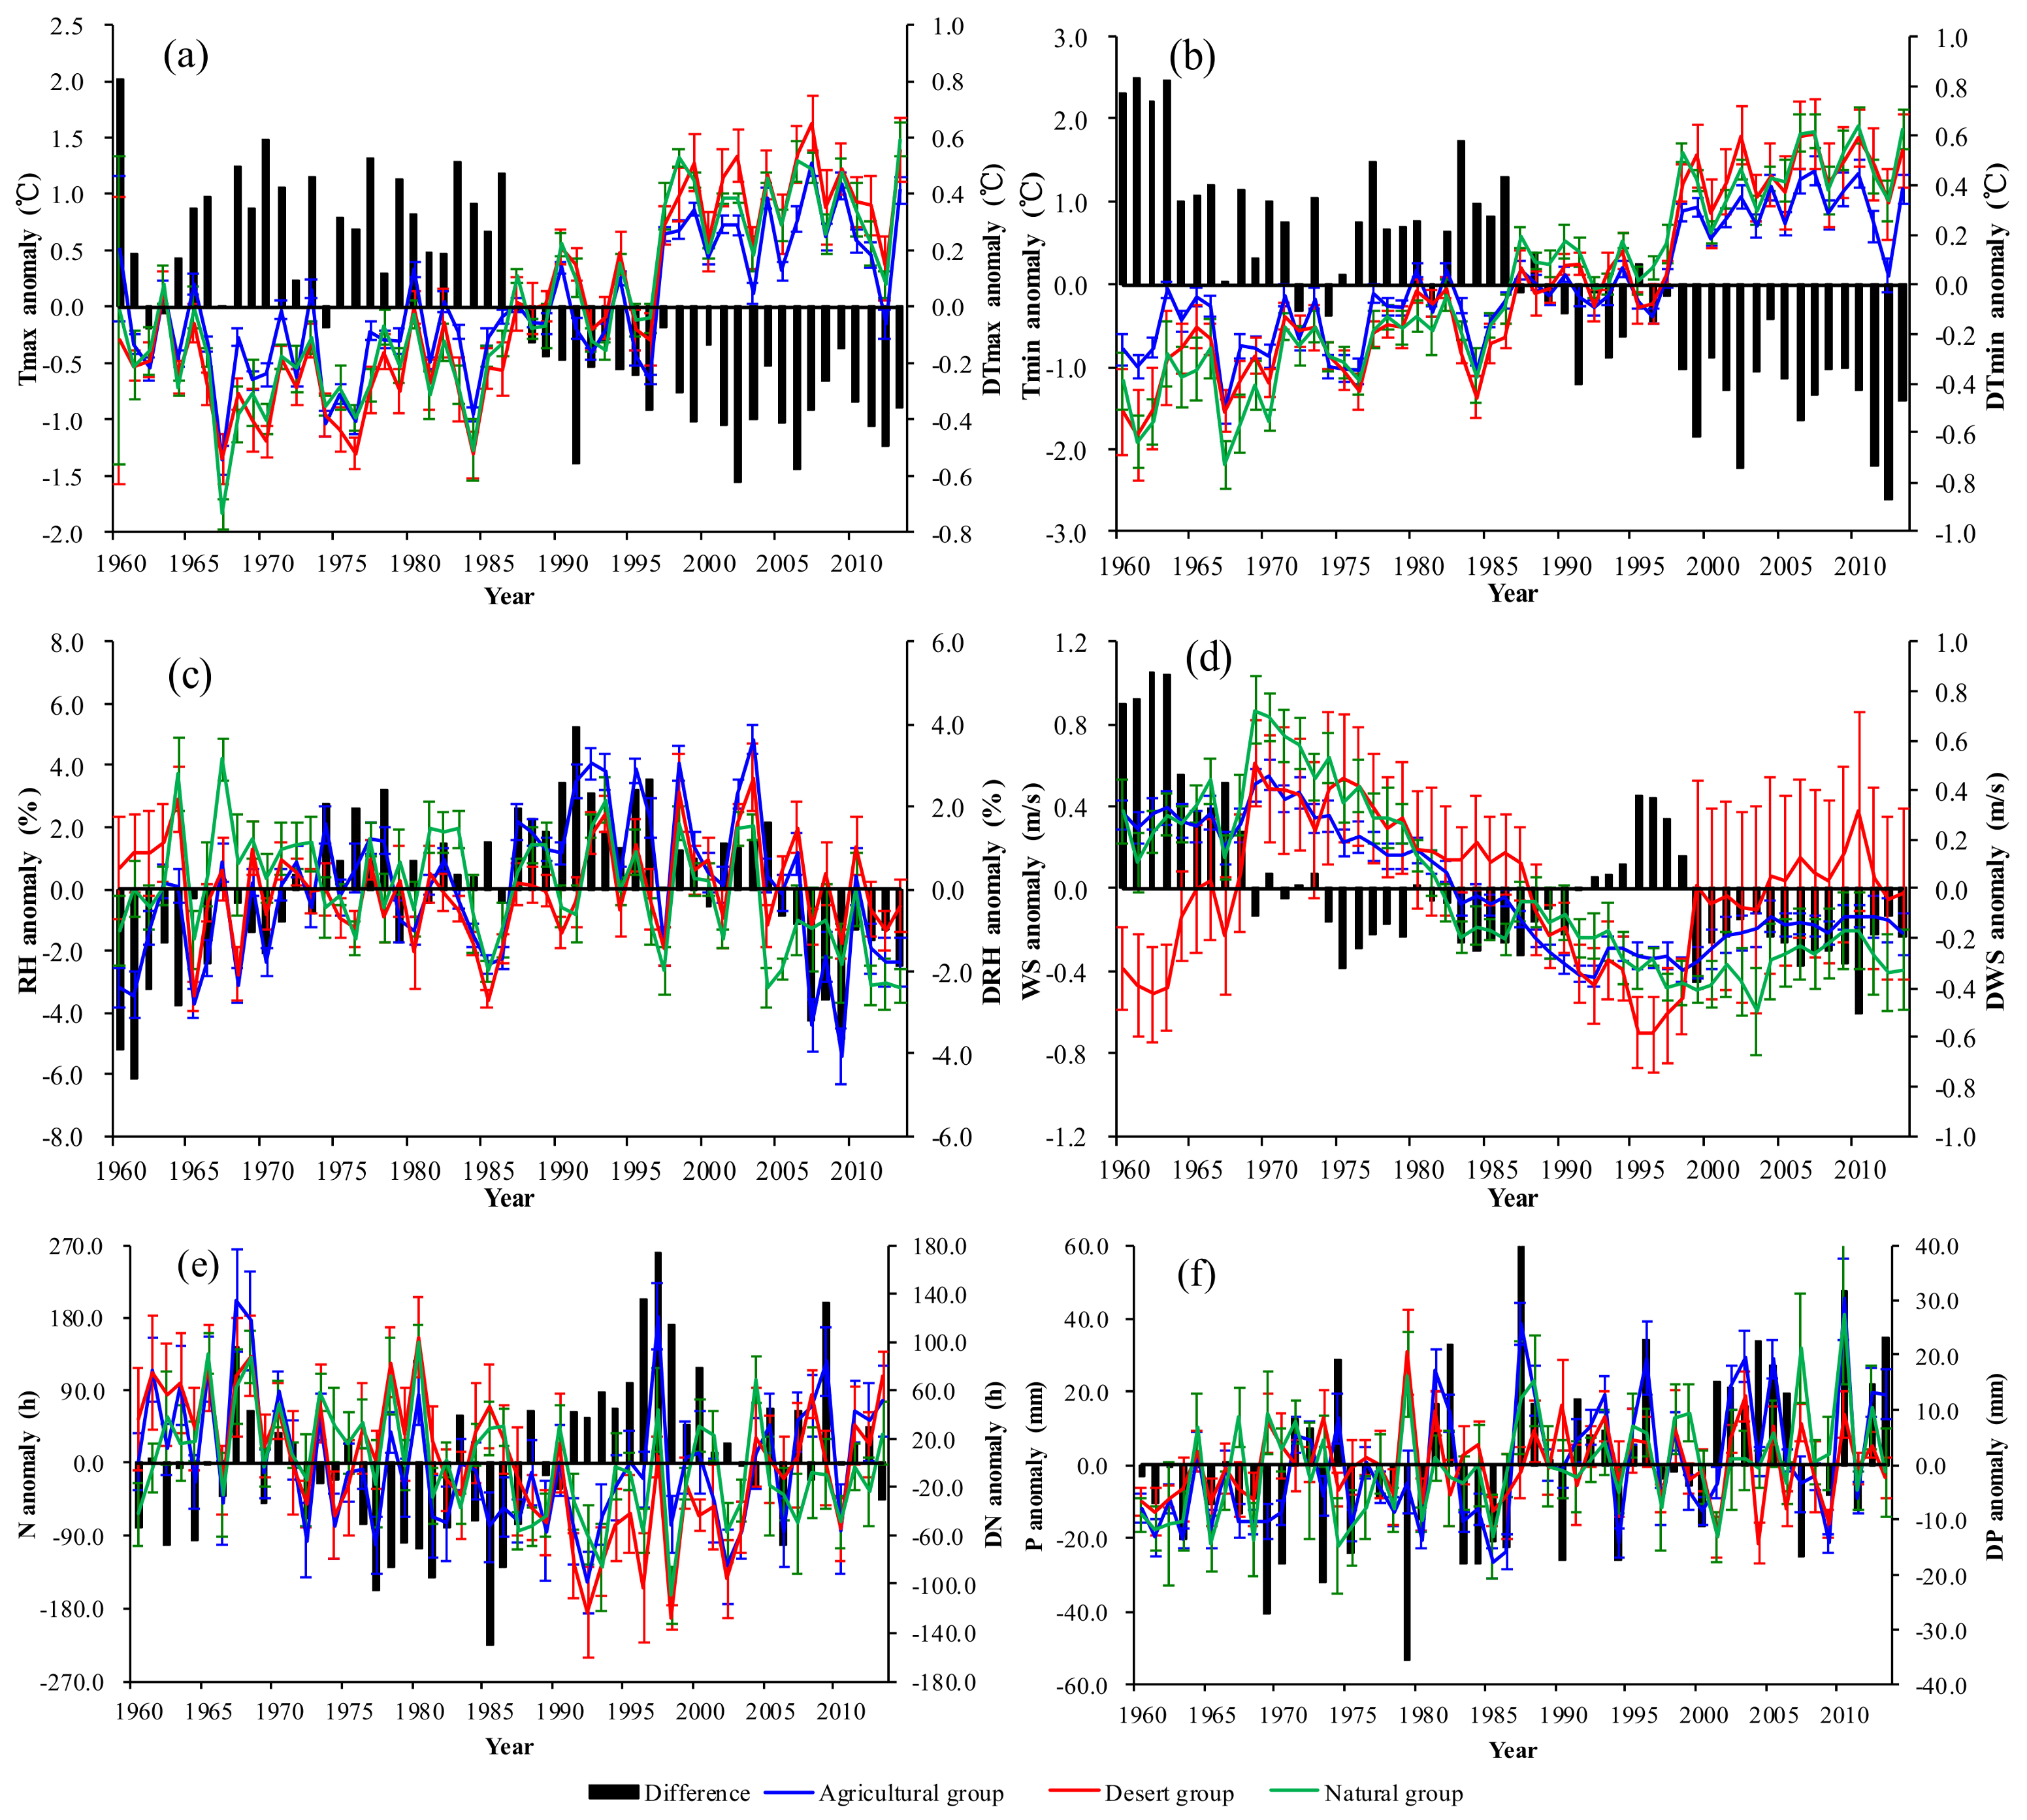
The station-average anomalies of Tmax, Tmin, RH, WS, N and P in the different station groups are shown in Figure 8. Variations of the station-average Tmax in the different station groups were similar from 1960 to 2013. Before the mid-1960s Tmax was recorded as decreasing. After 1967 Tmax increased until 2007, after which a slight decrease was recorded. Irrigation activities maybe weaken the decrease of Tmax before 1986 and then reduced the Tmax increase. Variations of the station-average Tmin in the different station groups were similar to that in Tmax. The Tmax and Tmin changed slower for the agricultural group than that for the desert group, with mean differences of 0.30 °C and 0.32 °C, respectively. All RH time series results for the three station groups increased before 2003, before decreasing. From the mid-1970s to the mid-2000s, irrigation activity led to an increase in RH. From 2003 the overall station-average RH results decreased; the decrease for the agricultural group, however, was less than the decrease for the desert group, with a mean difference of 1.20%. For WS, variation of the station-average was more obvious in the desert group than in the agricultural group. WS increased before 1970, after which is significantly decreased until the mid-1990s, before increasing again. WS in the agricultural group increased at a faster rate than WS in the desert group before 1970 and then with a slower rate of increase after 1999. However, the difference of WS trend among meteorological station in desert group was more significant than that in agricultural group, especially after 2000. From the late 1960s to the early 1990s, N in all groups significantly decreased. After1998 N then increased. Variations of the station-average P in the agricultural group were more obvious with a significant increasing trend during the study period.
For the different station groups, the magnitudes of trends in annual and seasonal meteorological factors differed (Table 5). The cooling effects of irrigation on Tmax and Tmin are evident with differences of 0.16 and 0.18 °C/decade between the agricultural group and the desert group, respectively. Increases in Tmax and Tmin were lower in the agricultural group than in the desert group; these differences being significant in the summer and autumn months and during the growing season.
RH increased in the agricultural group for most of the seasons whilst RH in the desert group decreased in spring, summer and during the growing season; RH only increased in the autumn and winter months. The magnitude of increasing trend in annual RH was 0.30%/decade for the agricultural group, 0.06%/decade for the desert group. WS had a greater decrease in the agricultural group than in the desert group; differences were more obvious in the summer and during the growing season when irrigation was employed, both with a value of 0.13 m/s/decade. Trends in N generally decreased, except during the growing season and spring. The decreasing trend of N in the desert group was greater than the decrease for the agricultural group, with the effect of −13.68 h/a/decade. An increasing trend in P was more evident in the agricultural group than in the desert group from 1960 to 2013. P generally increased throughout the year in the agricultural group whilst for the desert group P increased in the spring and winter months and during the growing season, though it decreased in the summer and autumn months. Differences in the meteorological factors were more evident during the summer months and during the growing season which suggests irrigation had a significant effect on regional climate.
4. Discussion
Most meteorological stations (22 out of 31) recorded a decreasing trend (Figure 4) and more than half of stations showed a significant level of ET0 decline at the 95% confidence level. This widespread decrease in ET0 was similar to results from other areas of China, such as in northwest of China [8], the Tibetan Plateau [46] and some basins [47,48]. For the majority of seasonal ET0 results, ET0 decreased the fastest in the agricultural group whilst the desert group recorded the fastest ET0 increase both in summer. Due to more water for crop growing, irrigation usually take place during these periods, which directly increase the surface air humidity [49] as well as soil moisture and having a cooling effect on the ground surface temperature [29]. Crop and oasis vegetation, such as the shelter forests, also increase surface roughness further reduce wind speeds [50]. All of these factors combined to result in larger ET0 decreases for the agricultural group than for the desert group.
The general increases of Tmax and Tmin were found in three groups, consistent with the global warming but much higher than the average increases reported for the China [51], especially for the desert group in summer, autumn and growing season. The trend magnitude was lower for the agricultural group than the desert group in whole year. It seems that the cooling effect caused by the agricultural irrigation may partly compensate for the warming effect induced by anthropogenic greenhouse gas and aerosols [52,53,54]. The cooling effect linked to irrigation has previously been identified in observational studies and model experiments in different regions [55,56]. Lobell et al. [57] used global modelling to simulate irrigation effects and indicated cooling effects were apparent for all agricultural regions regardless of their climatic regime and Mahmood et al. [56] reported that Tmax trends were significantly reduced for meteorological stations located at irrigation sites (relative to dry land sites) in Nebraska, USA. The elevation may have impacts on local climatic conditions. In our study area, the average elevation of stations in agricultural group was lower than that in the other groups, however, the trend of air temperature decreased more quickly, which may be partly induced by irrigation. Irrigation increases soil moisture which results in higher latent energy flux and this is a potential modulator to reduce temperature [58].
With irrigation, more water vapor is added to the local atmosphere which leads to higher RH; this is consistent with results from our study recording a larger increase in RH values for the agricultural group than for the desert group. In spring, RH for the agricultural group decreased larger than for the desert group. This maybe the cased by drought occurred frequently in spring and the high water need of sustaining crop growth. Agricultural activities and farmland shelter-forest jointly increased land surface roughness which resulted in lower WS in oases areas than in the desert areas [59]. The trends of decrease in WS for the agricultural group and the desert group varied with the seasonal growth of crop, significant difference was found in summer and growing season. As for N, the decreasing trend in the desert group was greater than the decrease for the agricultural group. Dust aerosol abundance in the desert group contributed to an obvious decrease in N [60], which was the results that aerosol reduced the transparency and the optical properties of atmosphere, causing the decrease in surface solar radiation [61]. In general, irrigation led to ET0 a greater decrease when ET0 decrease, less increase when ET0 increase for the agricultural group than the desert group.
Agricultural activities intensify the interactions between the surface and atmospheric boundary layer, which significantly affect the local water budget and energy balance [62]. Irrigation causes a decrease in sensible heat fluxes and an increase in latent heat fluxes, which could accelerate soil moisture evaporation and plant transpiration. With more water being evaporated, surface temperature decreases and RH increases. The effect of land use change on climatic variables and ET0 have drawn attentions [29,63]. In the hyper-arid region of northwest China, irrigation agriculture is the most common cultivate mode. Due to the lack of water resource, irrigation is implemented for keeping a relative higher crop yield. The more rapid decrease of ET0 in the agricultural group means a lower evapotranspiration demand. With the expansion of crop area, more irrigation water was needed, which could reduce the nearby runoff [63,64,65,66]. The increasing CO2 concentration in atmosphere will lead to global warming and intensify the global hydrology cycle [67]. However, human activities such as irrigation and afforestation can alter the local meteorological variables, affecting hydrological cycle [68]. In Oasis area, irrigation reduced climate warming and led to higher air moisture levels [24], contributing to cloud formation and local precipitation [69], besides crop shelter accelerated the decrease in wind speed [54]. All these accelerated the more rapid ET0 decrease for the agricultural group than the desert group. The expansion of arable land may alter existing water distribution and stresses by changing local meteorological variables. How the mechanism of climate change and human activities affect the water cycle and their interaction law in different temporal scales will be essential to predicting potential impacts of future changes on hydrology resource and ecological security.
5. Conclusions and Uncertainty
This study evaluated the trends in ET0 and the main meteorological factors under different irrigation activity levels (1960–2013) in the hyper-arid region of northwest China. Results showed 22 out of 31 meteorological stations recorded decreasing ET0 trends. The average ET0 results for the agricultural group decreased faster than those of the desert and natural groups. Irrigation enhanced a decrease in ET0 variation from 1960 to 1992 and suppressed an increase in ET0 since then. In the agricultural group, lower decreases in air temperature and wind speed and higher increases in relative humidity and precipitation contributed to larger decreases in ET0.
Land use changes such as urbanization, agricultural irrigation and storm water management can have an impact on ET0 trends. In this study, ET0 trends of stations in desert zones were used as the reference as they had less agricultural activities. The effect of irrigation on ET0 at the weather station scale was quantitatively examined using a comparative method. However, this work is limited on a spatial scale and due to the data sample size. It should also be noted that the effects of irrigation activities and climate could, to some extent, be interrelated. Besides, the uncertainty and limitations of data-driven analysis were not negligible, even though the observation data was freely accessible. Irrigation can exert impacts on biophysical and biogeochemical processes, such as the phenology, surface energy and water balances, which influence regional climate through land-atmosphere interactions [70,71,72,73]. The Earth system models are effective tools for examining the interaction and feedback among the Earth system processes in the past and future [70]. However, how to define and parameterize the realistic irrigation water demand is still the limitations in numerical models [74,75]. Future investigations to examine the impacts of meteorological factors and irrigation on ET0 should not only use observational data, they should also be coupled with dynamic land use and regional climate models to investigate the detailed physical processes.
Despite the uncertainties and deficiency of this study, this investigation has provided information on the effect of agricultural irrigation on regional hydrology dynamics. Our results emphasize the need to investigate the impact of irrigation and they could provide guidance for effectively determining adaptation and mitigation strategies to environmental changes induced by future climate change and agricultural irrigation.
Acknowledgments
This research is supported by Fundamental Research Funds of CAF (CAFYBB2017ZA006), the International Science &Technology Cooperation Program of China (2015DFR31130), National key research and development program of China (2016YFC0500908; 2016YFC0500801; 2016YFC0500804) and the National Natural Science Foundation of China (31670715; 41471029; 41371500). We also thank the ESA CCI Land Cover project for data supporting.
Author Contributions
Nan Shan and Zhongjie Shi conceived and designed the research content; Xiao Zhang and Zhiyong Zhang collected the data; Nan Shan analysed the data; Zhongjie Shi, Xiaohui Yang and Hao Guo contributed to the discussion of data analysis; Nan Shan wrote the paper, Zhongjie Shi revised the paper.
Conflicts of Interest
The authors declare that there is no conflict of interests regarding the publication of this paper.
References
- Foley, J.A.; DeFries, R.; Asner, G.P.; Barford, C.; Bonan, G.; Carpenter, S.R.; Chapin, F.S.; Coe, M.T.; Daily, G.C.; Gibbs, H.K.; et al. Global consequences of land use. Science 2005, 309, 570–573. [Google Scholar] [CrossRef] [PubMed]
- Ellis, E.C.; Goldewijk, K.K.; Siebert, S.; Lightman, D.; Ramankutty, N. Anthropogenic transformation of the biomes, 1700 to 2000. Glob. Ecol. Biogeogr. 2010, 19, 589–606. [Google Scholar] [CrossRef]
- Kuchment, L.S. The hydrological cycle and human impact on it. In Water Resour. Manag(EOLSS), Developed under the Auspices of the UNESCO; Hoekstra, A.Y., Savenije, H.H.G., Eds.; Eolss Publishers: Oxford, UK, 2004. [Google Scholar]
- Christidis, N.; Stott, P.A.; Hegerl, G.C.; Betts, R.A. The role of land use change in the recent warming of daily extreme temperatures. Geophys. Res. Lett. 2013, 40, 589–594. [Google Scholar] [CrossRef] [Green Version]
- Ahn, K.H.; Merwade, V. Quantifying the relative impact of climate and human activities on streamflow. J. Hydrol. 2014, 515, 257–266. [Google Scholar] [CrossRef]
- Oliveraguerra, L.; Mattar, C.; Merlin, O.; Durán-Alarcón, C.; Santamaría-Artigas, A.; Fuster, R. An operational method for the disaggregation of land surface temperature to estimate actual evapotranspiration in the arid region of Chile. ISPRS J. Photogramm. Remote Sens. 2017, 128, 170–181. [Google Scholar] [CrossRef]
- Santos, C.A.G.; Silva, R.M.D.; Silva, A.M.; Neto, R.M.B. Estimation of evapotranspiration for different land covers in a Brazilian semi-arid region: A case study of the Brígida River basin, Brazil. J. S. Am. Earth Sci. 2017, 74, 54–66. [Google Scholar] [CrossRef]
- Huo, Z.; Dai, X.; Feng, S.; Kang, S.; Huang, G. Effect of climate change on reference evapotranspiration and aridity index in arid region of China. J. Hydrol. 2013, 492, 24–34. [Google Scholar] [CrossRef]
- Diffenbaugh, N.S. Influence of modern land cover on the climate of the United States. Clim. Dyn. 2009, 33, 945–958. [Google Scholar] [CrossRef]
- Mahmood, R.; Sr, R.A.P.; Hubbard, K.G.; Niyogi, D.; Dirmeyer, P.A.; McAlpine, C.; Carleton, A.M.; Hale, R.; Gameda, S. Land cover changes and their biogeophysical effects on climate. Int. J. Climatol. 2014, 34, 929–953. [Google Scholar] [CrossRef]
- Wang, K.; Dickinson, R.E. A review of global terrestrial evapotranspiration: Observation, modeling, climatology and climatic variability. Rev. Geophys. 2012, 50, RG2005. [Google Scholar] [CrossRef]
- Cannarozzo, M.; Noto, L.V.; Viola, F. Spatial distribution of rainfall trends in Sicily (1921–2000). Phys. Chem. Earth 2006, 31, 1201–1211. [Google Scholar] [CrossRef]
- Boucher, O.; Myhre, G.; Myhre, A. Direct human influence of irrigation on atmospheric water vapor and climate. Clim. Dyn. 2004, 22, 597–603. [Google Scholar] [CrossRef]
- Lobell, D.; Bala, G.; Mirin, A.; Phillips, T.; Maxwell, R.; Rotman, D. Regional differences in the influence of irrigation on climate. J. Clim. 2009, 22, 2248–2255. [Google Scholar] [CrossRef]
- Sr, R.A.P.; Pitman, A.; Niyogi, D.; Mahmood, R.; McAlpine, C.; Hossain, H.; Goldewijk, K.K.; Nair, U.; Betts, R.; Fall, S.; et al. Land use/land cover changes and climate: Modeling analysis and observational evidence. Wiley Interdiscip. Rev. Clim. Chang. 2011, 2, 828–850. [Google Scholar]
- Lei, H.M.; Yang, D.W.; Yang, H.B.; Yuan, Z.J.; Lv, H.F. Simulated impacts of irrigation on evapotranspiration in a strongly exploited region: A case study of the Haihe River basin, China. Hydrol. Process. 2014, 29, 2704–2719. [Google Scholar] [CrossRef]
- Bonfils, C.; Lobell, D. Empirical evidence for a recent slowdown in irrigation-induced cooling. Proc. Natl. Acad. Sci. USA 2007, 104, 13582–13587. [Google Scholar] [CrossRef] [PubMed]
- Matthews, H.D.; Weaver, A.J.; Eby, M.; Meissner, K.J. Radiative forcing of climate by historical land cover change. Geophys. Res. Lett. 2003, 30, 1055. [Google Scholar] [CrossRef]
- Matthews, H.D.; Weaver, A.J.; Meissner, K.J.; Gillett, N.P.; Eby, M. Natural and anthropogenic climate change: Incorporating historical land cover change, vegetation dynamics and the global carbon cycle. Clim. Dyn. 2004, 22, 461–479. [Google Scholar] [CrossRef]
- Kijne, J.W.; Barker, R.; Molden, D. Water Productivity in Agriculture: Limits and Opportunities for Improvement; CABI Publishing: Wallingford, UK, 2003; pp. 390–391. [Google Scholar]
- Wu, P.; Zhao, X. Impact of climate change on agricultural water use and grain production in China. Trans. Chin. Soc. Agric. Eng. 2010, 26, 1–6. [Google Scholar]
- Zhong, R.S.; Dong, X.G.; Ma, Y.J. Sustainable water saving: New concept of modern agricultural water saving, starting from development of Xinjiang’s agricultural irrigation over the last 50 years. Irrig. Drain. 2009, 58, 383–392. [Google Scholar]
- Siebert, S.; Doll, P.; Hoogeveen, J.; Faures, J.-M.; Frenken, K.; Feick, S. Development and validation of the global map of irrigation areas. Hydrol. Earth Syst. Sci. 2005, 9, 535–547. [Google Scholar] [CrossRef]
- Tong, L.; Kang, S.; Zhang, L. Temporal and spatial variations of evapotranspiration for spring wheat in the Shiyang River basin in Northwest China. Agric. Water Manag. 2007, 87, 241–250. [Google Scholar] [CrossRef]
- Wang, X.M.; Dong, Z.B.; Zhang, J.W.; Lium, L.C. Modern dust storms in China: An overview. J. Arid Environ. 2004, 58, 559–574. [Google Scholar] [CrossRef]
- Beringer, J. Ecological Climatology: Concepts and Applications, 2nd ed.; Bonan, G.B., Ed.; Cambridge University Press: New York, NY, USA, 2010; Volume 48, pp. 221–222. [Google Scholar]
- Koster, R.D.; Dirmeyer, P.A.; Guo, Z.C.; Bonan, G.; Chan, R.; Cox, P.; Gordon, C.T.; Kanae, S.; Kowalczyk, E.; Lawrence, D.; et al. Regions of strong coupling between soil moisture and precipitation. Science 2004, 305, 1138–1140. [Google Scholar] [CrossRef] [PubMed]
- Dai, A.; Trenberth, K.E.; Karl, T.R. Effects of clouds, soil moisture, precipitation and water vapor on diurnal temperature range. J. Clim. 1999, 12, 2451–2473. [Google Scholar] [CrossRef]
- Han, S.J.; Xu, D.; Wang, S.L. Decreasing potential evaporation trends in China from 1956 to 2005: Accelerated in regions with significant agricultural influence? Agric. For. Meteorol. 2012, 154–155, 44–56. [Google Scholar] [CrossRef]
- Feng, Z.; Liu, B.; Yang, Y. A study of the changing trend of Chinese cultivated land amount and data reconstructing: 1949–2003. J. Nat. Resour. 2005, 20, 35–43. [Google Scholar]
- Deng, M.J.; Wang, S.J.; Dong, X.G.; Zhang, S.M. Water Resources and Sustainable Utilization in Xinjiang Uygur Autonomous Region; China Water Power Press: Beijing, China, 2005. [Google Scholar]
- Dai, X.; Pu, L.; Rao, F. Assessing the Effect of a Crop-Tree Intercropping Program on Smallholders’ Incomes in Rural Xinjiang, China. Sustainability 2017, 9, 1542. [Google Scholar] [CrossRef]
- Allen, R.G. Evaluation of Procedures for Estimating Mean Monthly Solar Radiation from Air Temperature; United Nations Food and Agricultural Organization (FAO): Rome, Italy, 1995. [Google Scholar]
- Belward, A.S. The IGBP-DIS Global 1 km Land Cover Data Set ‘DISCover’ Proposal and Implementation Plans; Report of the Land Cover Working Group of IGBP-DIS; IGBP-DIS Working Paper #13; IGBP Data and Information System Office: Toulouse, France, 1996; pp. 11–19. [Google Scholar]
- Rim, C.S. The effects of urbanization, geographical and topographical conditions on reference evapotranspiration. Clim. Chang. 2009, 97, 483–514. [Google Scholar] [CrossRef]
- Lobell, D.B.; Bonfils, C. The effect of irrigation on regional temperatures: A spatial and temporal analysis of trends in California, 1934–2002. J. Clim. 2008, 21, 2063–2071. [Google Scholar] [CrossRef]
- Allen, R.G.; Periera, L.S.; Raes, D.; Smith, M. Crop Evapotranspiration: Guideline for Computing Crop Water Requirement; FAO Irrigation and Drainage Paper No. 56; United Nations Food and Agricultural Organization (FAO): Rome, Italy, 1998. [Google Scholar]
- Hargreaves, G.H.; Samani, Z.A. Estimating potential evapotranspiration. J. Irrig. Drain. Div. 1982, 108, 223–230. [Google Scholar]
- Mann, H.B. Non-parametric tests against trend. Econometrica 1945, 13, 245–259. [Google Scholar] [CrossRef]
- Kendall, M.G. Rank Correlation Method, 4th ed.; Charles Griffin: London, UK, 1975. [Google Scholar]
- Sen, P.K. Estimates of the regression coefficients based on Kendall’s tau. J. Am. Stat. Assoc. 1968, 63, 1379–1389. [Google Scholar] [CrossRef]
- Salmi, T.; Maatta, A.; Anttila, P.; Ruoho-Airola, T.; Amnell, T. Detecting Trends of Annual Values of Atmospheric Pollutants by the Mann-Kendall Test and Sen’s Slope Estimates—The Excel Template Application MAKESENS; Finnish Meteorological Institute: Helsinki, Finland, 2002. [Google Scholar]
- Dinpashoh, Y.; Jhajharia, D.; Fakheri-Fard, A.; Singh, V.P.; Kahya, E. Trends in reference crop evapotranspiration over Iran. J. Hydrol. 2011, 399, 422–433. [Google Scholar] [CrossRef]
- Jhajharia, D.; Dinpahoh, Y.; Kahya, E.; Singh, V.P.; Fakheri-Fard, A. Trends in reference evapotranspiration in the humid region of North East India. Hydrol. Process. 2011, 26, 421–435. [Google Scholar] [CrossRef]
- Yue, S.; Pilon, P.; Phinney, B.; Cavadias, G. The influence of autocorrelation on the ability to detect trend in hydrological series. Hydrol. Process. 2002, 16, 1807–1829. [Google Scholar] [CrossRef]
- Zhang, Y.; Liu, C.; Tang, Y.; Yang, Y. Trends in pan evaporation and reference and actual evapotranspiration across the Tibetan Plateau. J. Geophys. Res. Atmos. 2007, 112, 113–120. [Google Scholar] [CrossRef]
- Liu, Q.; Yang, Z.; Cui, B.; Sun, T. The temporal trends of reference evapotranspiration and its sensitivity to key meteorological variables in the Yellow River basin, China. Hydrol. Process. 2010, 24, 2171–2181. [Google Scholar] [CrossRef]
- Xing, W.; Wang, W.G.; Shao, Q.X.; Peng, S.X.; Yu, Z.B.; Yong, B.; Taylor, J. Changes of reference evapotranspiration in the Haihe River Basin: Present observations and future projection from climatic variables through multi-model ensemble. Glob. Planet. Chang. 2014, 115, 1–15. [Google Scholar] [CrossRef]
- Zhang, X.; Tang, Q.; Zheng, J.; Ge, Q. Warming/cooling effects of cropland greenness changes during 1982–2006 in the North China Plain. Environ. Res. Lett. 2013, 8, 24–38. [Google Scholar] [CrossRef]
- Ozdogan, M.; Salvucci, G.D.; Anderson, B.T. Examination of the Bouchet Morton complementary relationship using a mesoscale climate model and observations under a progressive irrigation scenario. J. Hydrometeorol. 2006, 7, 235–251. [Google Scholar] [CrossRef]
- Intergovernmental Panel on Climate Change, Summary for Policymakers. Climate Change 2007: The Physical Science Basis; Contribution of Working Group I to the Fourth Assessment Report of the Intergovernmental Panel on Climate Change; Cambridge University Press: New York, NY, USA, 2007. [Google Scholar]
- Cook, B.I.; Puma, M.J.; Krakauer, N.Y. Irrigation induced surface cooling in the context of modern and increased greenhouse gas forcing. Clim. Dyn. 2011, 37, 1587–1600. [Google Scholar] [CrossRef]
- Najafi, M.R.; Zwiers, F.W.; Gillett, N.P. Attribution of Arctic temperature change to greenhouse-gas and aerosol influences. Nat. Clim. Chang. 2015, 5, 246–249. [Google Scholar] [CrossRef]
- Xu, L.H.; Shi, Z.J.; Wang, Y.H.; Zhang, D.L.; Chu, X.Z.; Yu, P.T.; Xiong, W.; Zuo, H.J.; Wang, Y.N. Spatiotemporal variation and driving forces of reference evapotranspiration in Jing River Basin, northwest China. Hydrol. Process. 2015, 29, 4846–4862. [Google Scholar] [CrossRef]
- Adegoke, J.O.; Pielke, R.A.; Eastman, J.; Mahmood, R.; Hubbard, K.G. Impact of irrigation on midsummer surface fluxes and temperature under dry synoptic conditions: A regional atmospheric model study of the U.S. high plains. Mon. Weather Rev. 2003, 131, 556–564. [Google Scholar] [CrossRef]
- Mahmood, R.; Hubbard, K.G.; Carlson, C. Modification of growing-season surface temperature records in the northern Great Plains due to land-use transformation: Verification of modelling results and implication for global climate change. Int. J. Climatol. 2004, 24, 311–327. [Google Scholar] [CrossRef]
- Lobell, D.B.; Bala, G.; Duffy, P.B. Biogeophysical impacts of cropland management changes on climate. Geophys. Res. Lett. 2006, 33, L06708. [Google Scholar] [CrossRef]
- Williams, K.R.S. Correlation between Palmer drought indices and various measures of air temperature in the climatic zones of the United States. Phys. Geogr. 1992, 13, 349–367. [Google Scholar]
- Vautard, R.; Cattiaux, J.; Yiou, P.; Thepau, J.N.; Ciais, P. Northern Hemisphere atmospheric stilling partly attributed to an increase in surface roughness. Nat. Geosci. 2010, 3, 756–761. [Google Scholar] [CrossRef]
- Roderick, M.L.; Farquhar, G.D. The cause of decreased pan evaporation over the past 50 years. Science 2002, 298, 1410–1411. [Google Scholar] [PubMed]
- Stanhill, G.; Cohen, S. Global dimming: A review of the evidence for a widespread and significant reduction in global radiation with discussion of its probable causes and possible agricultural consequences. Agric. For. Meteorol. 2001, 107, 255–278. [Google Scholar] [CrossRef]
- Han, S.J.; Tang, Q.H.; Xu, D.; Wang, S.L. Irrigation-induced changes in potential evaporation: More attention is needed. Hydrol. Process. 2014, 28, 2717–2720. [Google Scholar] [CrossRef]
- Wang, S.D.; Wang, Y.G.; Wang, J.; Mao, W.Y.; Shen, Y.P. Change of climate and hydrology in the Tarim River Basin during past 40 years and their impact. J. Glaciol. Geocryol. 2003, 25, 315–320. [Google Scholar]
- Wang, Y.B.; Chen, Y.N. Impact of population growth and land-use change on water resources and ecosystems of the arid Tarim River Basin in Western China. Int. J. Sustain. Dev. World Ecol. 2006, 13, 295–305. [Google Scholar]
- Bai, Y.; Xu, H.L.; Ling, H.B. Drought-flood variation and its correlation with runoff in three headstreams of Tarim River, Xingjiang, China. Environ. Earth Sci. 2014, 71, 1297–1309. [Google Scholar] [CrossRef]
- Ye, Z.X.; Chen, Y.N.; Zhang, X. Dynamics of runoff, river sediments and climate change in the upper reaches of the Tarim River, China. Quat. Int. 2014, 26, 13–19. [Google Scholar] [CrossRef]
- Brutsaert&Amp, W.; Parlange, M.B. Hydrologic cycle explains the evaporation paradox. Nature 1998, 396, 30. [Google Scholar]
- Brown, A.E.; Zhang, L.; McMahon, T.A.; Western, A.W.; Vertessy, R.A. A review of paired catchment studies for determining changes in water yield resulting from alterations in vegetation. J. Hydrol. 2005, 310, 28–61. [Google Scholar] [CrossRef]
- Li, H.Y.; Liu, X.H.; Kejia, D.; Zhou, Q.; Ma, T.; Gao, Y. Ecological restoration and its effects on a regional Climate: The Source Region of the Yellow River, China. Environ. Sci. Technol. 2015, 49, 5897–5904. [Google Scholar] [CrossRef] [PubMed]
- Gordon, L.J.; Steffen, W.; Jonsson, B.F.; Folke, C.; Falkenmark, M.; Johannessen, Å. Human modification of global water vapor € flows from the land surface. Proc. Natl. Acad. Sci. USA 2005, 102, 7612–7617. [Google Scholar] [CrossRef] [PubMed]
- Sorooshian, S.; Li, J.; Hsu, K.L.; Guo, X.G. Influence of irrigation schemes used in regional climate models on evapotranspiration estimation: Results and comparative studies from California’s Central Valley agricultural regions. J. Geophys. Res. 2012, 117, 6107. [Google Scholar] [CrossRef]
- Lo, M.H.; Famiglietti, J.S. Irrigation in California’s Central Valley strengthens the southwestern US water cycle. Geophys. Res. Lett. 2013, 40, 301–306. [Google Scholar] [CrossRef]
- Leng, G.; Huang, M.; Tang, Q.; Leung, L.R. A modeling study of irrigation effects on global surface water and groundwater resources under a changing climate. J. Adv. Model. Earth Syst. 2015, 7, 1285–1304. [Google Scholar] [CrossRef]
- Nazemi, A.; Wheater, H.S. On inclusion of water resource management in Earth system models—Part 1: Problem definition and representation of water demand. Hydrol. Earth Syst. Sci. 2015, 19, 63–90. [Google Scholar] [CrossRef]
- Leng, G.; Leung, L.R.; Huang, M. Significant impacts of irrigation water sources and methods on modeling irrigation effects in the ACME Land Model. J. Adv. Model. Earth Syst. 2017. [Google Scholar] [CrossRef]
Figure 1.
The location of the meteorological stations in the study area. Gray area indicate the location of hyper-arid region in China.
Figure 1.
The location of the meteorological stations in the study area. Gray area indicate the location of hyper-arid region in China.

Figure 2.
Irrigation area increase in Xinjiang, 1960–2013.

Figure 3.
Annual mean values and standard deviations of percentage of dominant land cover at stations in different groups from 1992 to 2010.
Figure 3.
Annual mean values and standard deviations of percentage of dominant land cover at stations in different groups from 1992 to 2010.

Figure 4.
Spatial distribution of annual ET0 trends (mm/decade) from 1960 to 2013.
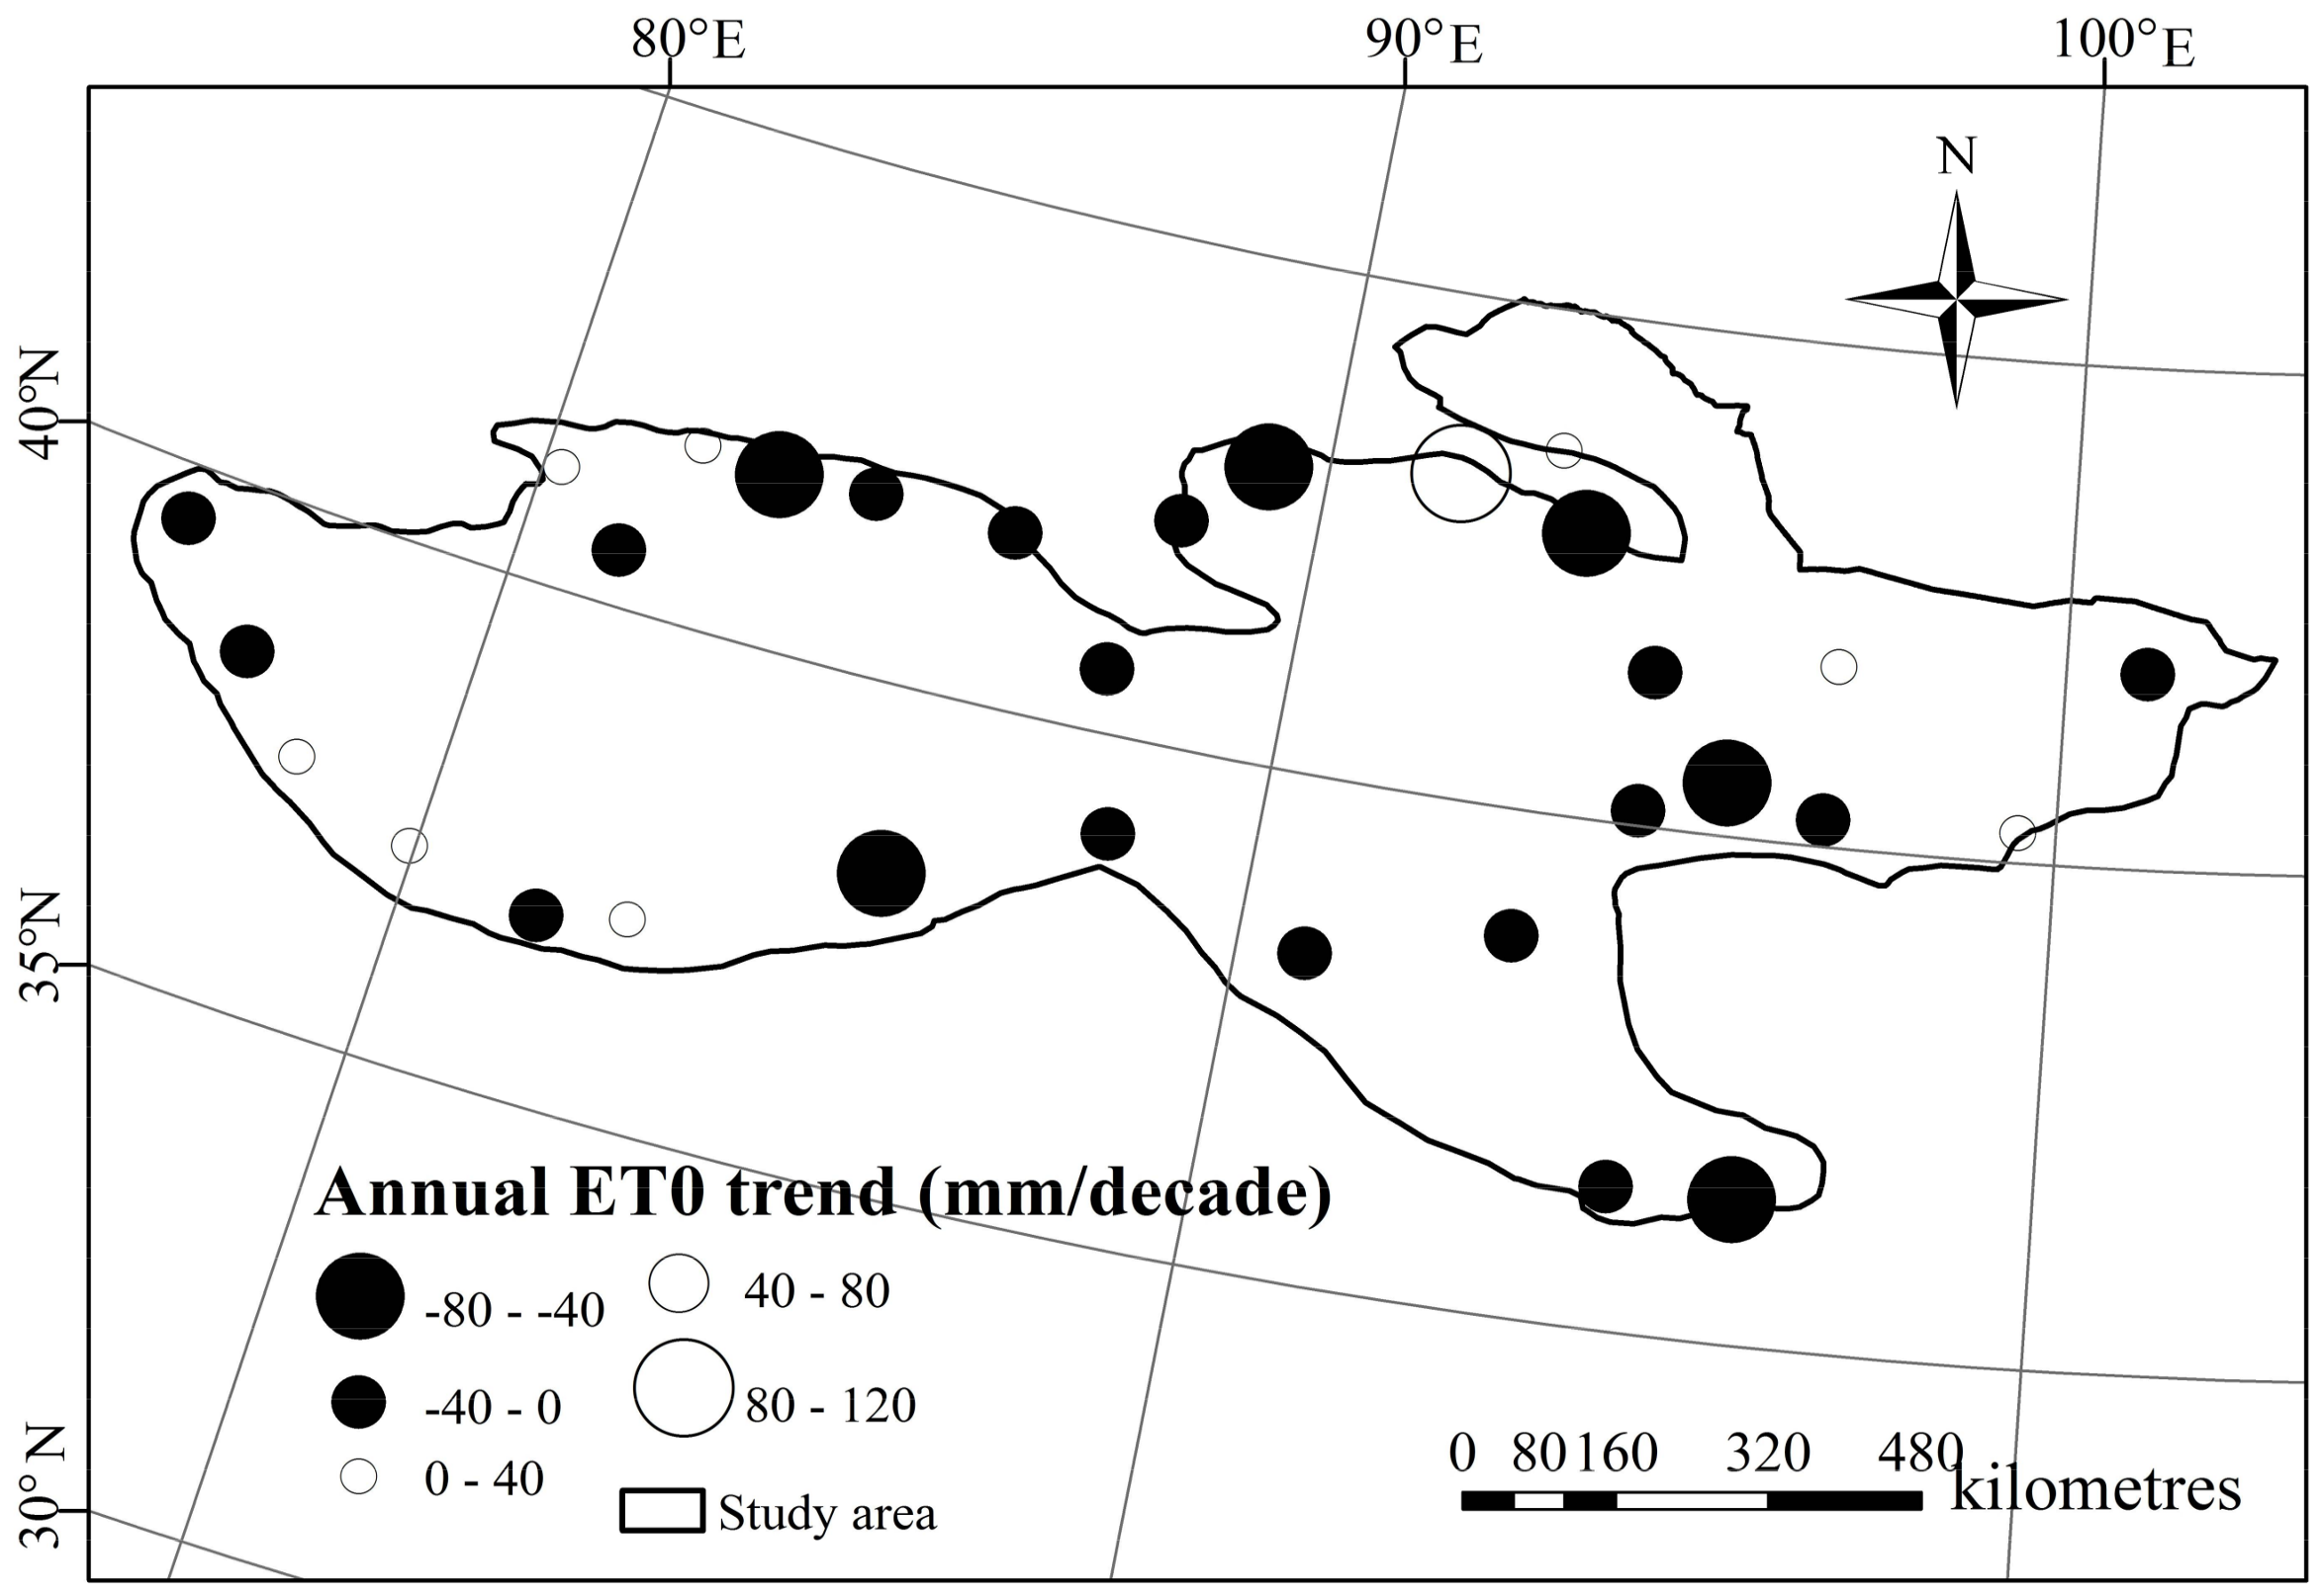
Figure 5.
Percentage of stations with different annual ET0 trends.
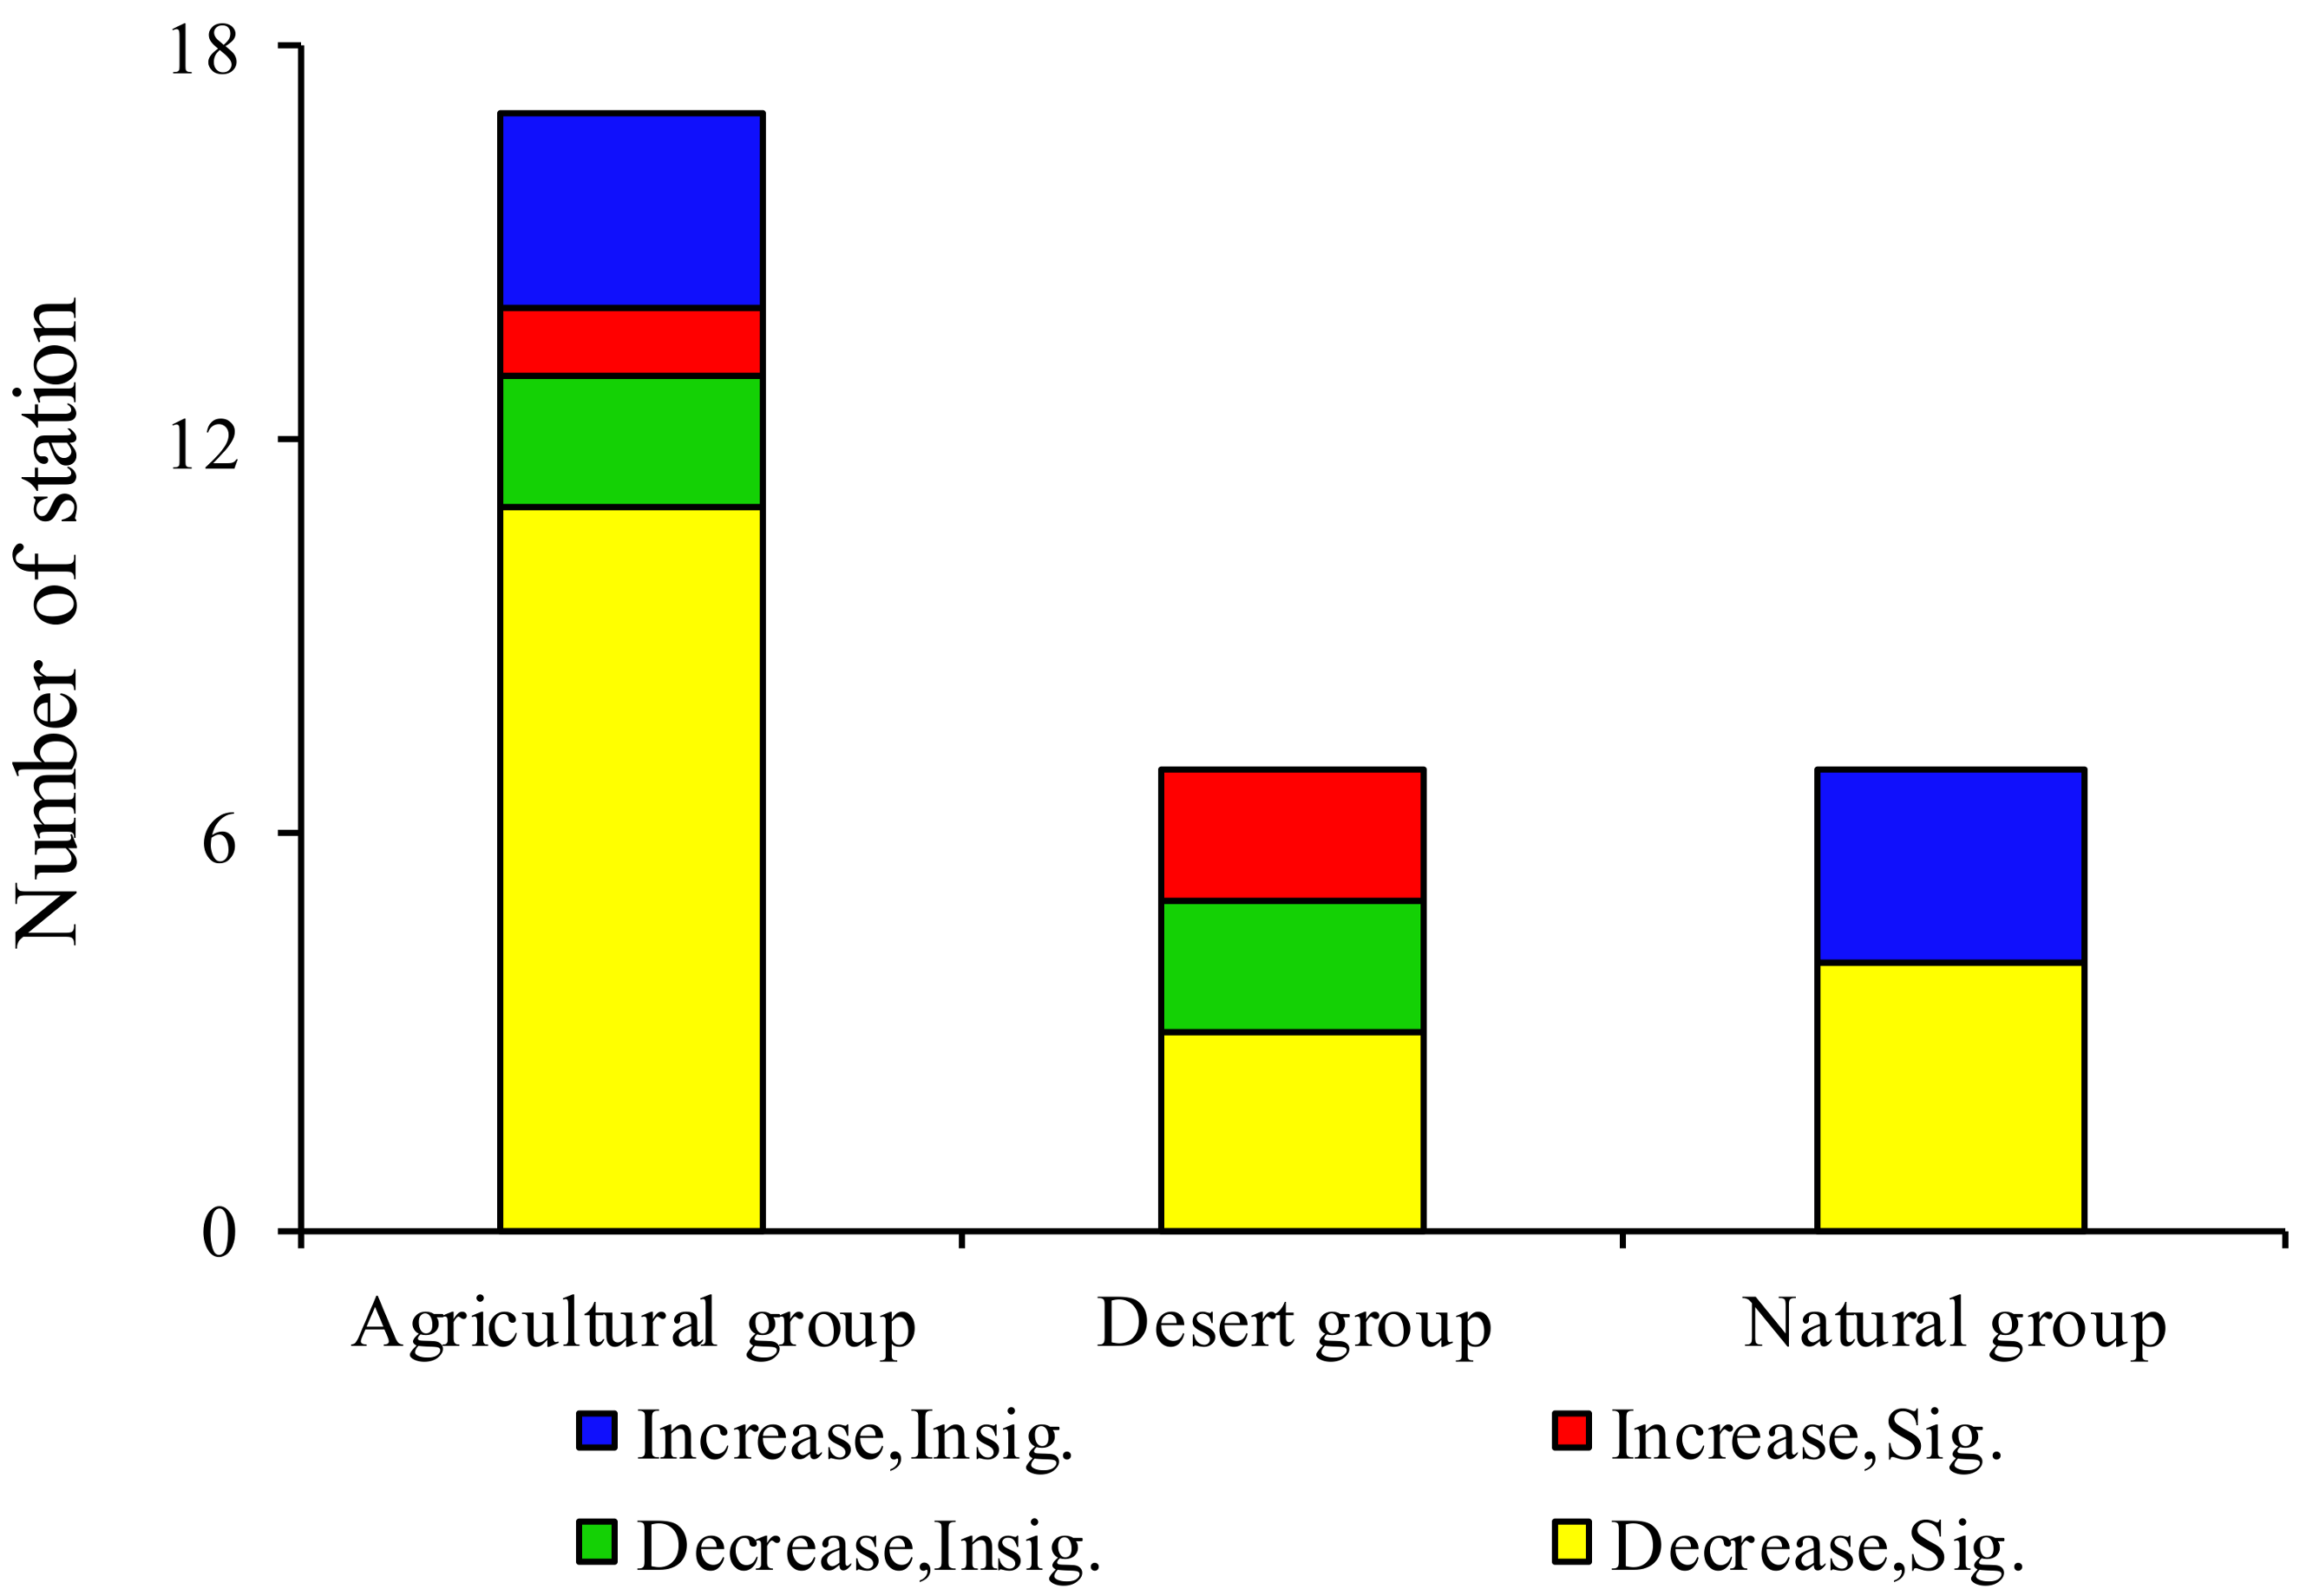
Figure 6.
Time series of average annual ET0 anomalies for the different station groups, 1960–2013. The difference indicates the ET0 anomaly differences between the agricultural group and the desert group.
Figure 6.
Time series of average annual ET0 anomalies for the different station groups, 1960–2013. The difference indicates the ET0 anomaly differences between the agricultural group and the desert group.
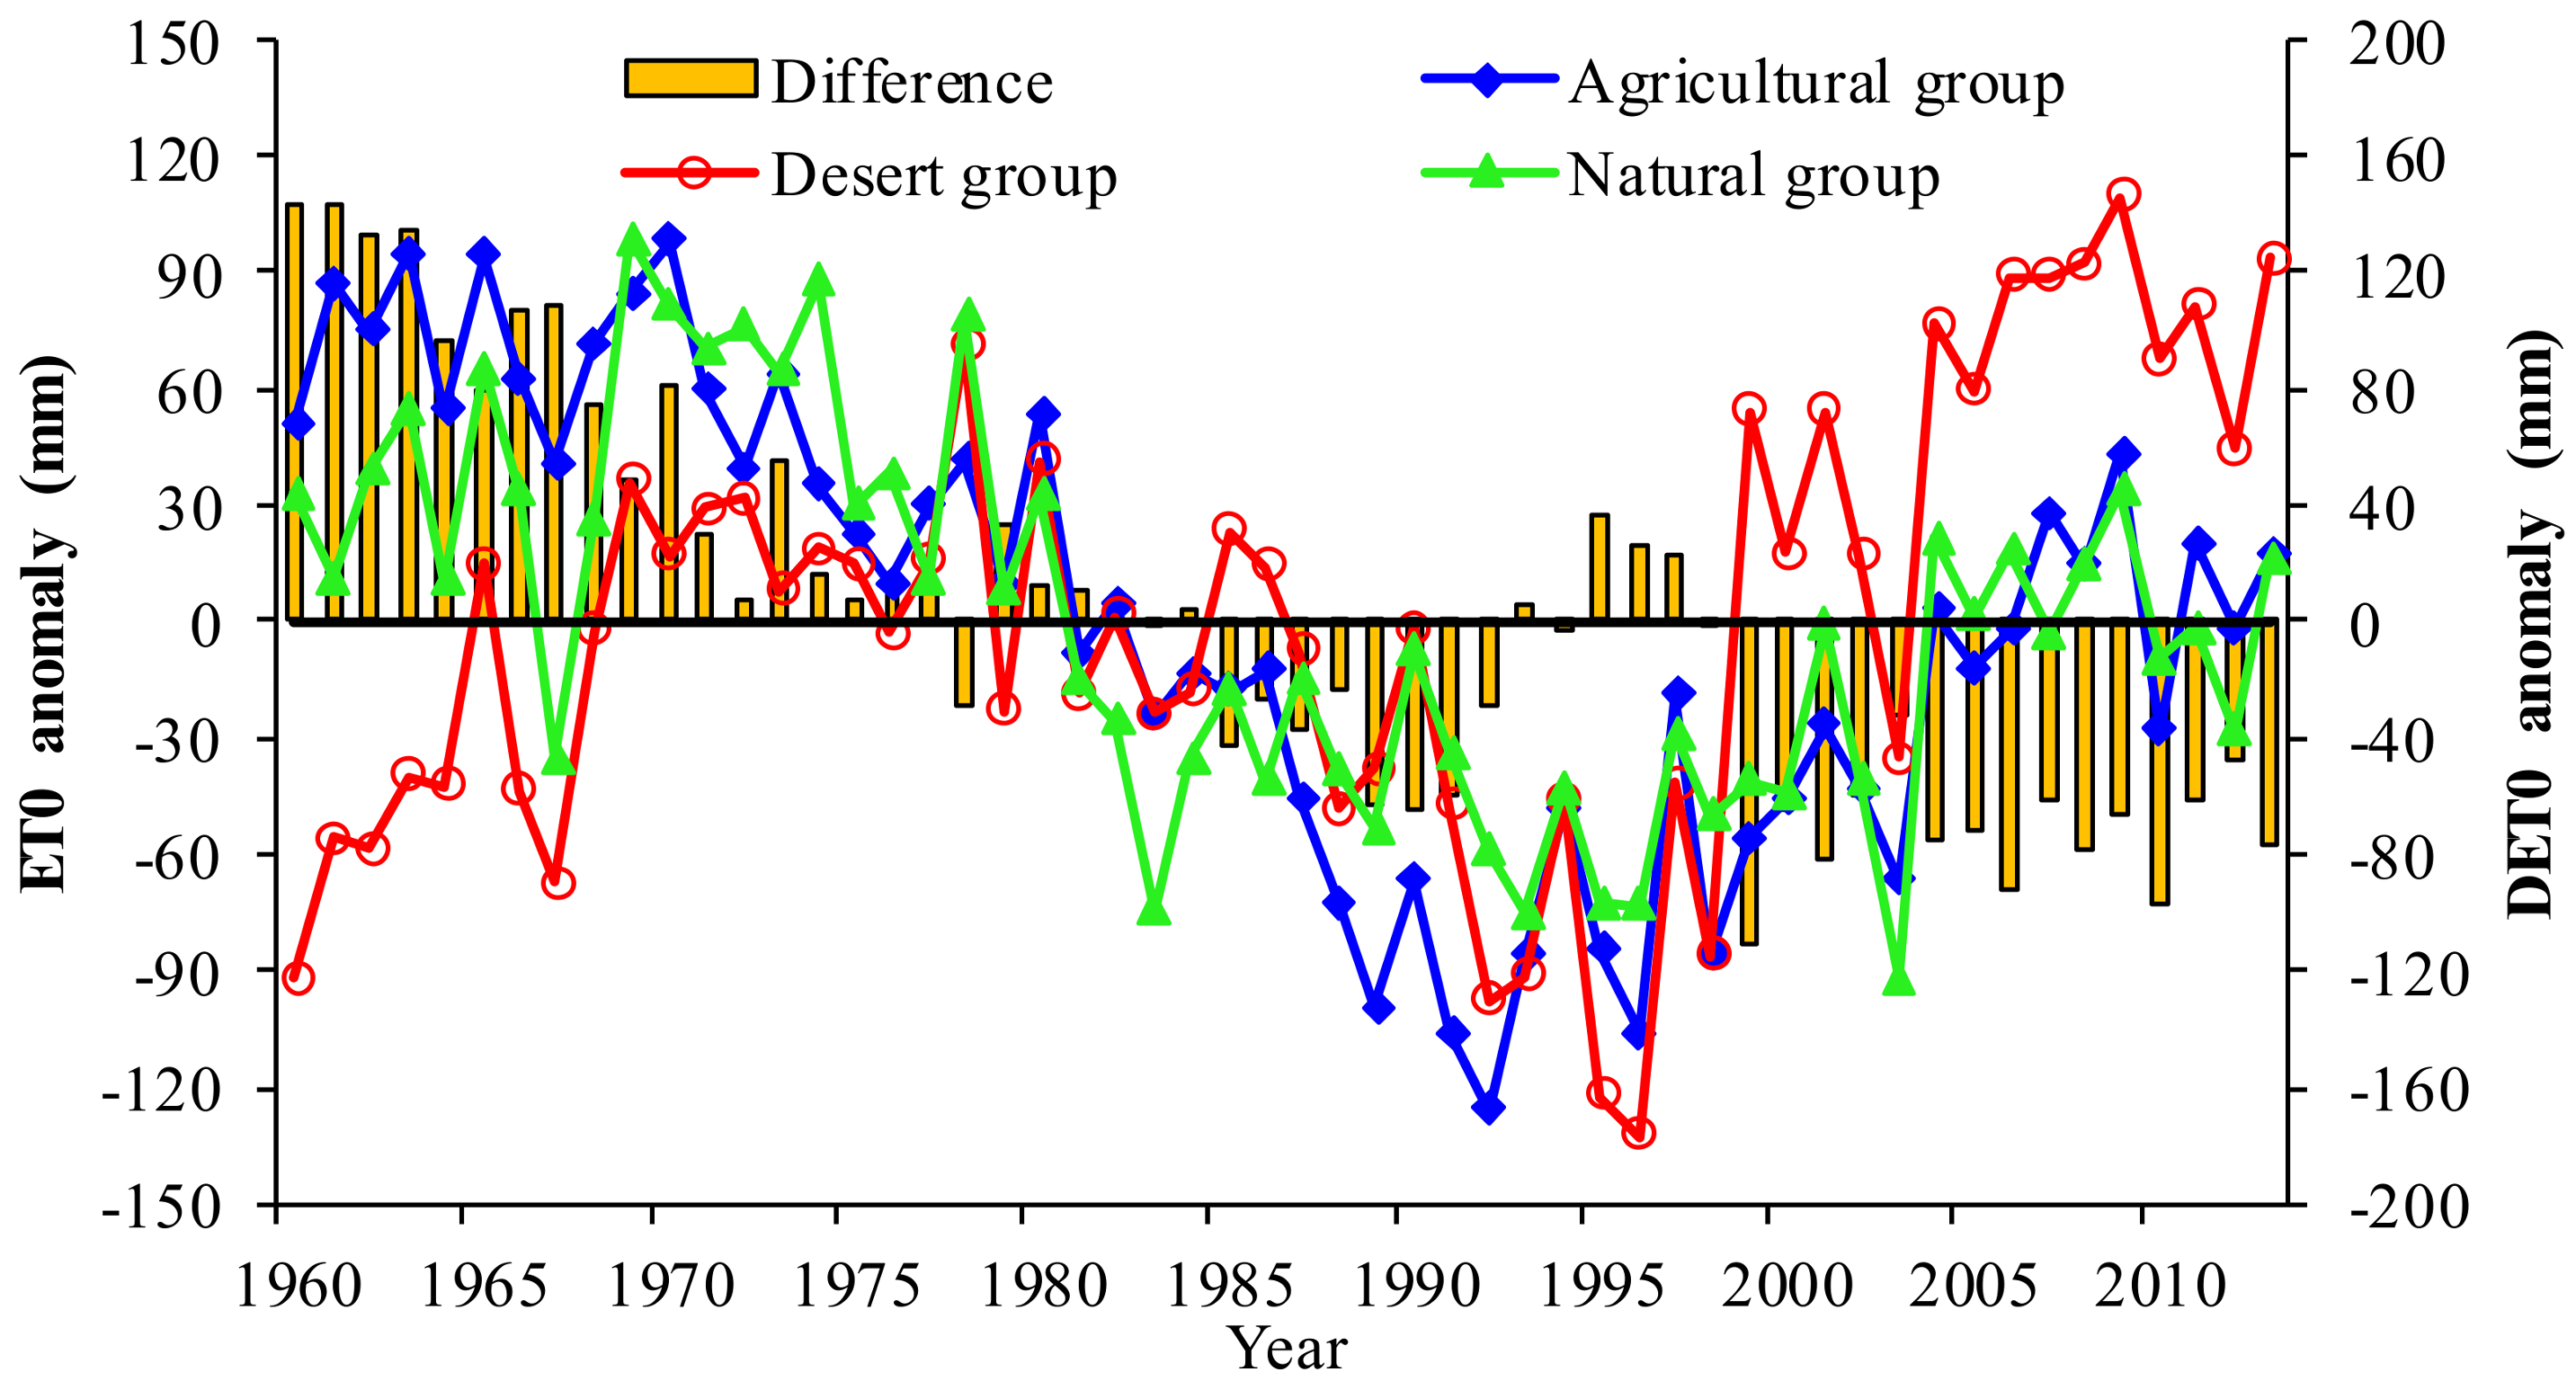
Figure 7.
Time series of average ET0 anomalies for the different station groups. (a) summer and (b) growing season. The difference indicates the ET0 anomaly differences between the agricultural group and the desert group. The error bar indicates standard deviation of mean summer and growing ET0 anomalies.
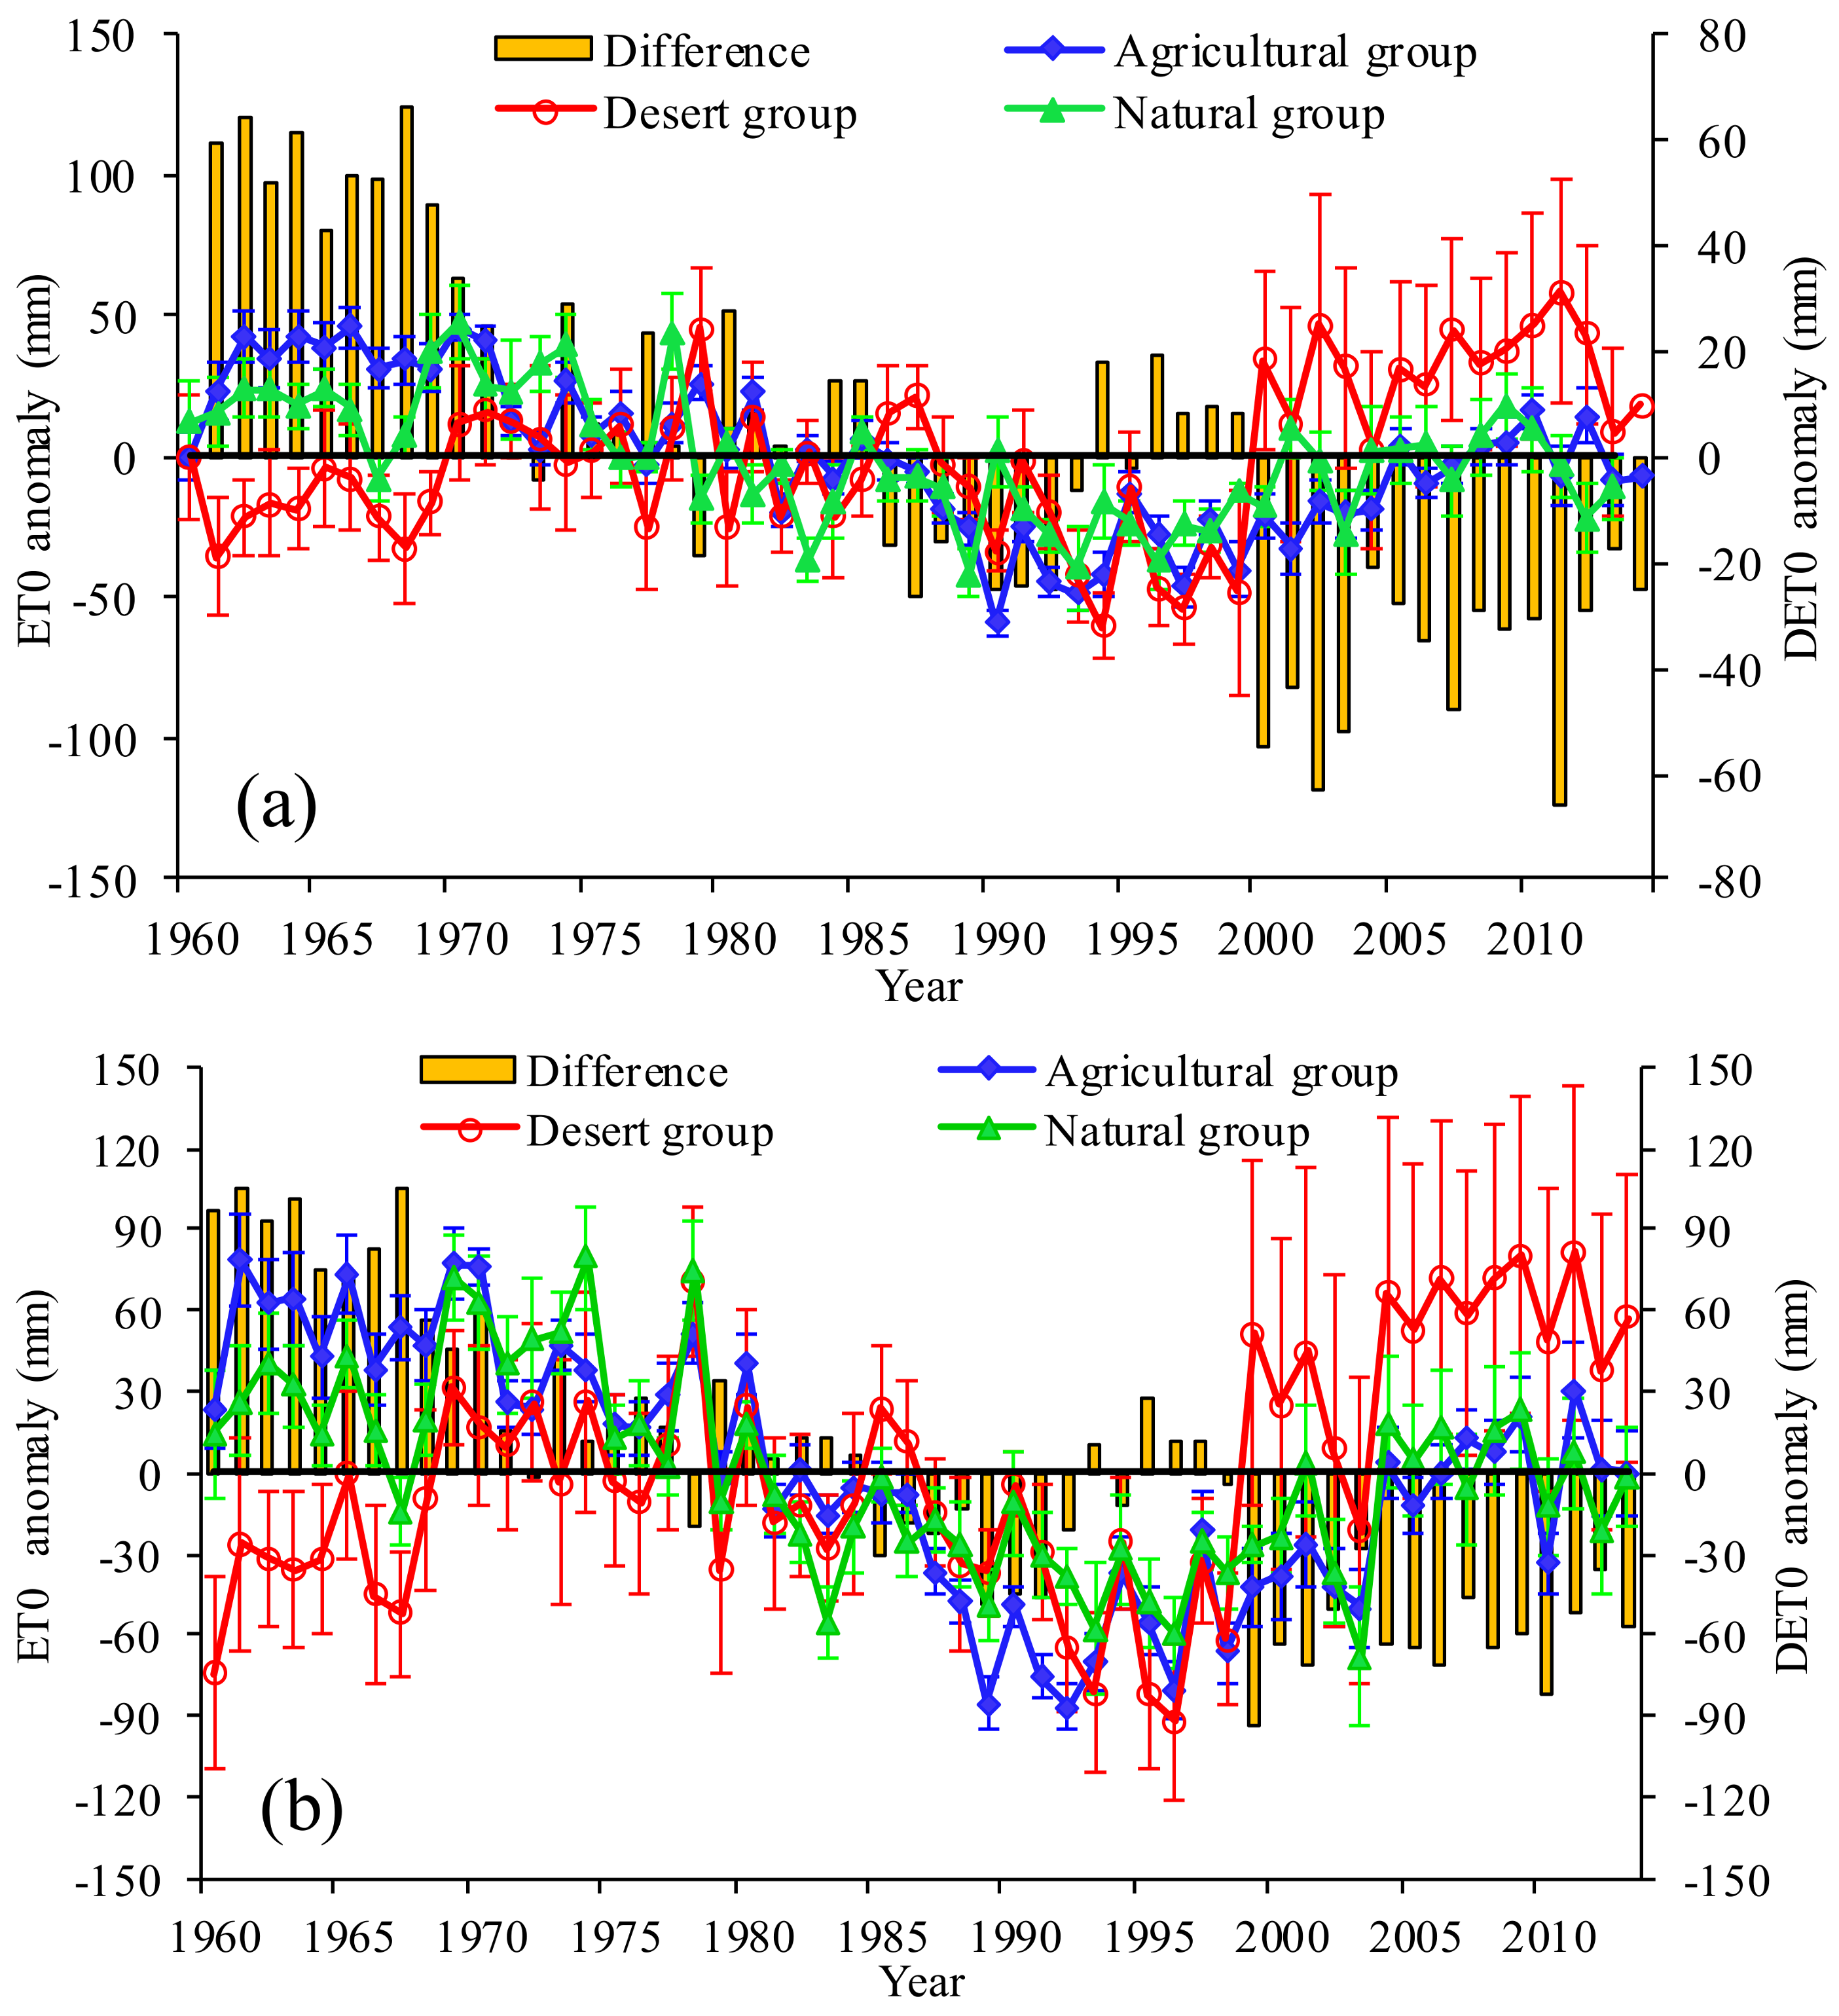
Figure 8.
Time series of station-average annual meteorological factor anomalies for the different station groups, 1960–2013. The error bar indicates standard deviation of mean meteorological factor anomalies. The difference indicates the meteorological factor anomaly differences between the agricultural group and the desert group, (a) Maximum air temperature; (b) Minimum air temperature; (c) Relative humidity; (d) Wind speed; (e) Sunshine hours; (f) Precipitation.

Table 1.
The relationship between trends in ET0 and the different land use ratios with a certain radius centered around a station.
Table 1.
The relationship between trends in ET0 and the different land use ratios with a certain radius centered around a station.
| Radius (km) | Cultivated Land | Bare Land | ||
|---|---|---|---|---|
| Annual | Growing Season | Annual | Growing Season | |
| 1 | −0.35 * | −0.36 * | 0 | 0 |
| 2 | −0.33 * | −0.35 * | 0 | 0 |
| 3 | −0.35 * | −0.37 ** | 0.36 ** | 0.37 ** |
| 4 | −0.36 ** | −0.37 ** | 0.38 ** | 0.39 ** |
| 5 | −0.31 * | −0.32 * | 0.35 * | 0.35 * |
| 6 | −0.31 * | −0.32 * | 0.33 * | 0.34 * |
| 7 | −0.31 * | −0.32 * | 0.33 * | 0.33 * |
| 8 | −0.28 | −0.30 | 0.31 * | 0.32 * |
| 9 | −0.27 | −0.29 | 0.31 * | 0.31 * |
| 10 | −0.26 | −0.27 | 0.31 * | 0.31 * |
| 15 | −0.21 | −0.23 | 0.30 | 0.30 * |
| 20 | −0.17 | −0.19 | 0.28 | 0.29 |
| 25 | −0.14 | −0.16 | 0.27 | 0.27 |
| 30 | −0.12 | −0.14 | 0.27 | 0.27 |
* p < 0.1; ** p < 0.05.
Table 2.
General characteristics of the stations in different station groups.
| Group | Number of Stations | Land Use Ratio | ET0 (mm) | Tmax (°C) | Tmin (°C) | RH (%) | WS (m/s) | N (h/a) | P (mm) | Altitude (m) | ||
|---|---|---|---|---|---|---|---|---|---|---|---|---|
| Bare Land | Cropland | Natural Vegetation | ||||||||||
| Agricultural group | 17 | 0.07 | 0.60 | 0.33 | 1180.9 | 12.6 | 4.4 | 47.2 | 1.9 | 2922.2 | 54.6 | 1070.50 |
| Desert group | 7 | 0.94 | 0.04 | 0.02 | 1405.4 | 10.2 | −0.8 | 36.3 | 3.8 | 3230.6 | 42.3 | 1244.04 |
| Natural group | 7 | 0.21 | 0.15 | 0.64 | 1246.4 | 13.0 | 0.1 | 40.2 | 2.7 | 3167.6 | 69.6 | 1275.10 |
Table 3.
ET0 trend magnitudes of different station groups, 1960–2013.
| Type | Average Trend Magnitude (mm/Decade) | |||||
|---|---|---|---|---|---|---|
| Annual | Growing Season | Spring | Summer | Autumn | Winter | |
| Agricultural group | −24.55 ± 2.51 | −18.50 ± 1.95 | −5.91 ± 0.77 | −10.81 ± 1.11 | −5.40 ± 0.55 | −0.80 ± 0.23 |
| Desert group | 9.10 ± 6.62 | 7.06 ± 4.55 | 3.56 ± 1.75 | 4.58 ± 2.63 | 1.17 ± 1.54 | 0.12 ± 0.43 |
| Natural group | −16.25 ± 2.34 | −12.00 ± 1.81 | −3.04 ± 0.63 | −7.24 ± 1.10 | −4.30 ± 0.57 | −0.80 ± 0.16 |
| All stations | −20.06 ± 2.53 | −14.78 ± 1.95 | −4.51 ± 0.76 | −8.70 ± 1.12 | −4.87 ± 0.58 | −0.89 ± 0.22 |
| Difference | −33.65 | −25.56 | −9.47 | −15.39 | −6.57 | −0.92 |
Note: ± indicated the standard deviation, difference is equal to the value for agricultural group minus that for desert group.
Table 4.
A comparison of ET0 trends (mm/decade) between the station groups in different time periods.
Table 4.
A comparison of ET0 trends (mm/decade) between the station groups in different time periods.
| Period | Agricultural Group | Desert Group | Natural Group | Difference |
|---|---|---|---|---|
| 1960–1970 | 10.90 | 92.85 | 36.15 | −81.95 |
| 1970–1992 | −80.38 | −34.46 | −64.21 | −45.92 |
| 1992–2013 | 59.53 | 103.72 | 39.85 | −44.19 |
| 1960–2013 | −21.88 | 14.92 | −15.02 | −36.80 |
Table 5.
Trend magnitudes in annual and seasonal meteorological factors in the different station groups, 1960–2013.
Table 5.
Trend magnitudes in annual and seasonal meteorological factors in the different station groups, 1960–2013.
| Timescale | Station Groups | Tmax (°C/Decade) | Tmin (°C/Decade) | RH (%/Decade) | WS (m/s/Decade) | N (h/a/Decade) | P (mm/Decade) |
|---|---|---|---|---|---|---|---|
| Annual | Agricultural group | 0.25 ± 0.01 | 0.38 ± 0.03 | 0.30 ± 0.09 | −0.16 ± 0.01 | −6.27 ± 4.89 | 3.76 ± 0.30 |
| Desert group | 0.41 ± 0.02 | 0.56 ± 0.03 | 0.06 ± 0.07 | −0.09 ± 0.03 | −19.95 ± 4.99 | 0.76 ± 0.28 | |
| Natural group | 0.38 ± 0.01 | 0.64 ± 0.03 | −0.4 ± 0.08 | −0.21 ± 0.02 | −14.79 ± 2.53 | 3.22 ± 0.26 | |
| Difference | −0.16 | −0.18 | 0.24 | −0.07 | 13.68 | 3.00 | |
| Growing season | Agricultural group | 0.19 ± 0.02 | 0.33 ± 0.03 | 0.37 ± 0.11 | −0.19 ± 0.01 | 6.16 ± 2.75 | 2.87 ± 0.29 |
| Desert group | 0.40 ± 0.02 | 0.57 ± 0.03 | −0.10 ± 0.09 | −0.06 ± 0.03 | −11.39 ± 2.99 | 0.16 ± 0.31 | |
| Natural group | 0.36 ± 0.02 | 0.59 ± 0.03 | −0.59 ± 0.08 | −0.23 ± 0.02 | −10.20 ± 2.33 | 2.54 ± 0.26 | |
| Difference | −0.21 | −0.24 | 0.47 | −0.13 | 17.55 | 2.71 | |
| Spring | Agricultural group | 0.22 ± 0.01 | 0.39 ± 0.03 | −0.37 ± 0.08 | −0.20 ± 0.01 | 10.31 ± 1.53 | 0.31 ± 0.04 |
| Desert group | 0.31 ± 0.02 | 0.50 ± 0.03 | −0.23 ± 0.07 | −0.06 ± 0.03 | 3.46 ± 14.59 | 0.25 ± 0.49 | |
| Natural group | 0.30 ± 0.02 | 0.54 ± 0.03 | −0.76 ± 0.08 | −0.23 ± 0.03 | 2.67 ± 10.63 | 0.84 ± 0.09 | |
| Difference | −0.09 | −0.11 | 0.14 | −0.07 | 6.85 | 0.06 | |
| Summer | Agricultural group | 0.15 ± 0.02 | 0.31 ± 0.03 | 0.53 ± 0.12 | −0.18 ± 0.01 | −2.59 ± 1.43 | 2.02 ± 0.18 |
| Desert group | 0.40 ± 0.02 | 0.62 ± 0.03 | −0.19 ± 0.09 | −0.05 ± 0.03 | −11.93 ± 1.65 | −0.39 ± 0.19 | |
| Natural group | 0.36 ± 0.02 | 0.62 ± 0.03 | −0.54 ± 0.09 | −0.22 ± 0.03 | −8.97 ± 1.34 | 1.66 ± 0.19 | |
| Difference | −0.25 | −0.31 | 0.72 | −0.13 | 9.34 | 2.41 | |
| Autumn | Agricultural group | 0.23 ± 0.02 | 0.32 ± 0.03 | 0.61 ± 0.14 | −0.13 ± 0.01 | −3.65 ± 0.96 | 0.69 ± 0.10 |
| Desert group | 0.45 ± 0.02 | 0.62 ± 0.03 | 0.31 ± 0.10 | −0.07 ± 0.02 | −5.47 ± 1.13 | −0.07 ± 0.10 | |
| Natural group | 0.41 ± 0.02 | 0.65 ± 0.03 | −0.31 ± 0.10 | −0.20 ± 0.03 | −3.98 ± 0.86 | 0.35 ± 0.09 | |
| Difference | −0.22 | −0.30 | 0.30 | −0.06 | 1.82 | 0.76 | |
| Winter | Agricultural group | 0.31 ± 0.02 | 0.49 ± 0.03 | 0.47 ± 0.09 | −0.11 ± 0.01 | −7.33 ± 1.45 | 0.67 ± 0.07 |
| Desert group | 0.40 ± 0.02 | 0.58 ± 0.04 | 0.35 ± 0.07 | −0.11 ± 0.03 | −4.22 ± 1.55 | 1.14 ± 0.15 | |
| Natural group | 0.35 ± 0.02 | 0.76 ± 0.04 | 0.05 ± 0.08 | −0.19 ± 0.02 | −3.67 ± 1.10 | 0.23 ± 0.15 | |
| Difference | −0.09 | −0.09 | 0.12 | 0.00 | −3.11 | −0.47 |
Note: Difference is equal to the value of agricultural group minus that of desert group.
© 2018 by the authors. Licensee MDPI, Basel, Switzerland. This article is an open access article distributed under the terms and conditions of the Creative Commons Attribution (CC BY) license (http://creativecommons.org/licenses/by/4.0/).
Share and Cite
MDPI and ACS Style
Shan, N.; Shi, Z.; Yang, X.; Guo, H.; Zhang, X.; Zhang, Z. Oasis Irrigation-Induced Hydro-Climatic Effects: A Case Study in the Hyper-Arid Region of Northwest China. Atmosphere 2018, 9, 142. https://doi.org/10.3390/atmos9040142
AMA Style
Shan N, Shi Z, Yang X, Guo H, Zhang X, Zhang Z. Oasis Irrigation-Induced Hydro-Climatic Effects: A Case Study in the Hyper-Arid Region of Northwest China. Atmosphere. 2018; 9(4):142. https://doi.org/10.3390/atmos9040142
Chicago/Turabian StyleShan, Nan, Zhongjie Shi, Xiaohui Yang, Hao Guo, Xiao Zhang, and Zhiyong Zhang. 2018. "Oasis Irrigation-Induced Hydro-Climatic Effects: A Case Study in the Hyper-Arid Region of Northwest China" Atmosphere 9, no. 4: 142. https://doi.org/10.3390/atmos9040142
Note that from the first issue of 2016, this journal uses article numbers instead of page numbers. See further details here.