1. Introduction
A typhoon is a natural phenomenon that often affects tropical and subtropical coastal countries, and they occur most frequently in the northwestern Pacific Ocean [
1,
2]. Because of its location east of Eurasia and in the western Pacific Ocean, Taiwan sees frequent typhoons; consequently, typhoons are a major cause of disasters in Taiwan. For example, Typhoon Nari, in 2001, Typhoon Mindulle in 2004, and Typhoon Morakot in 2009 all caused great casualties and financial losses. The Central Mountain Range (CMR) running from northern to southern Taiwan with an average height of over 2000 m creates vastly varied terrain, as well as having a substantial effect on the strength of the typhoons that are invading Taiwan. When typhoons pass the island, they are often affected by the CMR, which substantially affects their wind strength and makes wind speed prediction difficult. According to statistics, typhoons are mainly developed in the northwest Pacific, and they move along the edge of the North Pacific High from east to west. When they arrive at Taiwan, they often hit the east of the island first. Because these typhoons have not been affected by topographic factors, their strength can be predicted more easily. However, after typhoons pass the CMR, their effect on western Taiwan becomes difficult to predict because of the CMR’s sheltering effects of western Taiwan. Currently, Taiwan’s Central Weather Bureau (CWB) employs an ensemble forecasting method that is both dynamic and flow dependent to quantify and communicate forecast uncertainty. As indicated in Wei [
3], because of high climatological uncertainty, the rainfall and wind predictions that are provided by the CWB are provided as ranges; however, the ranges are not always accurate, and even now, casts often have high prediction errors. These errors can primarily be attributed to the effect of the island’s CMR.
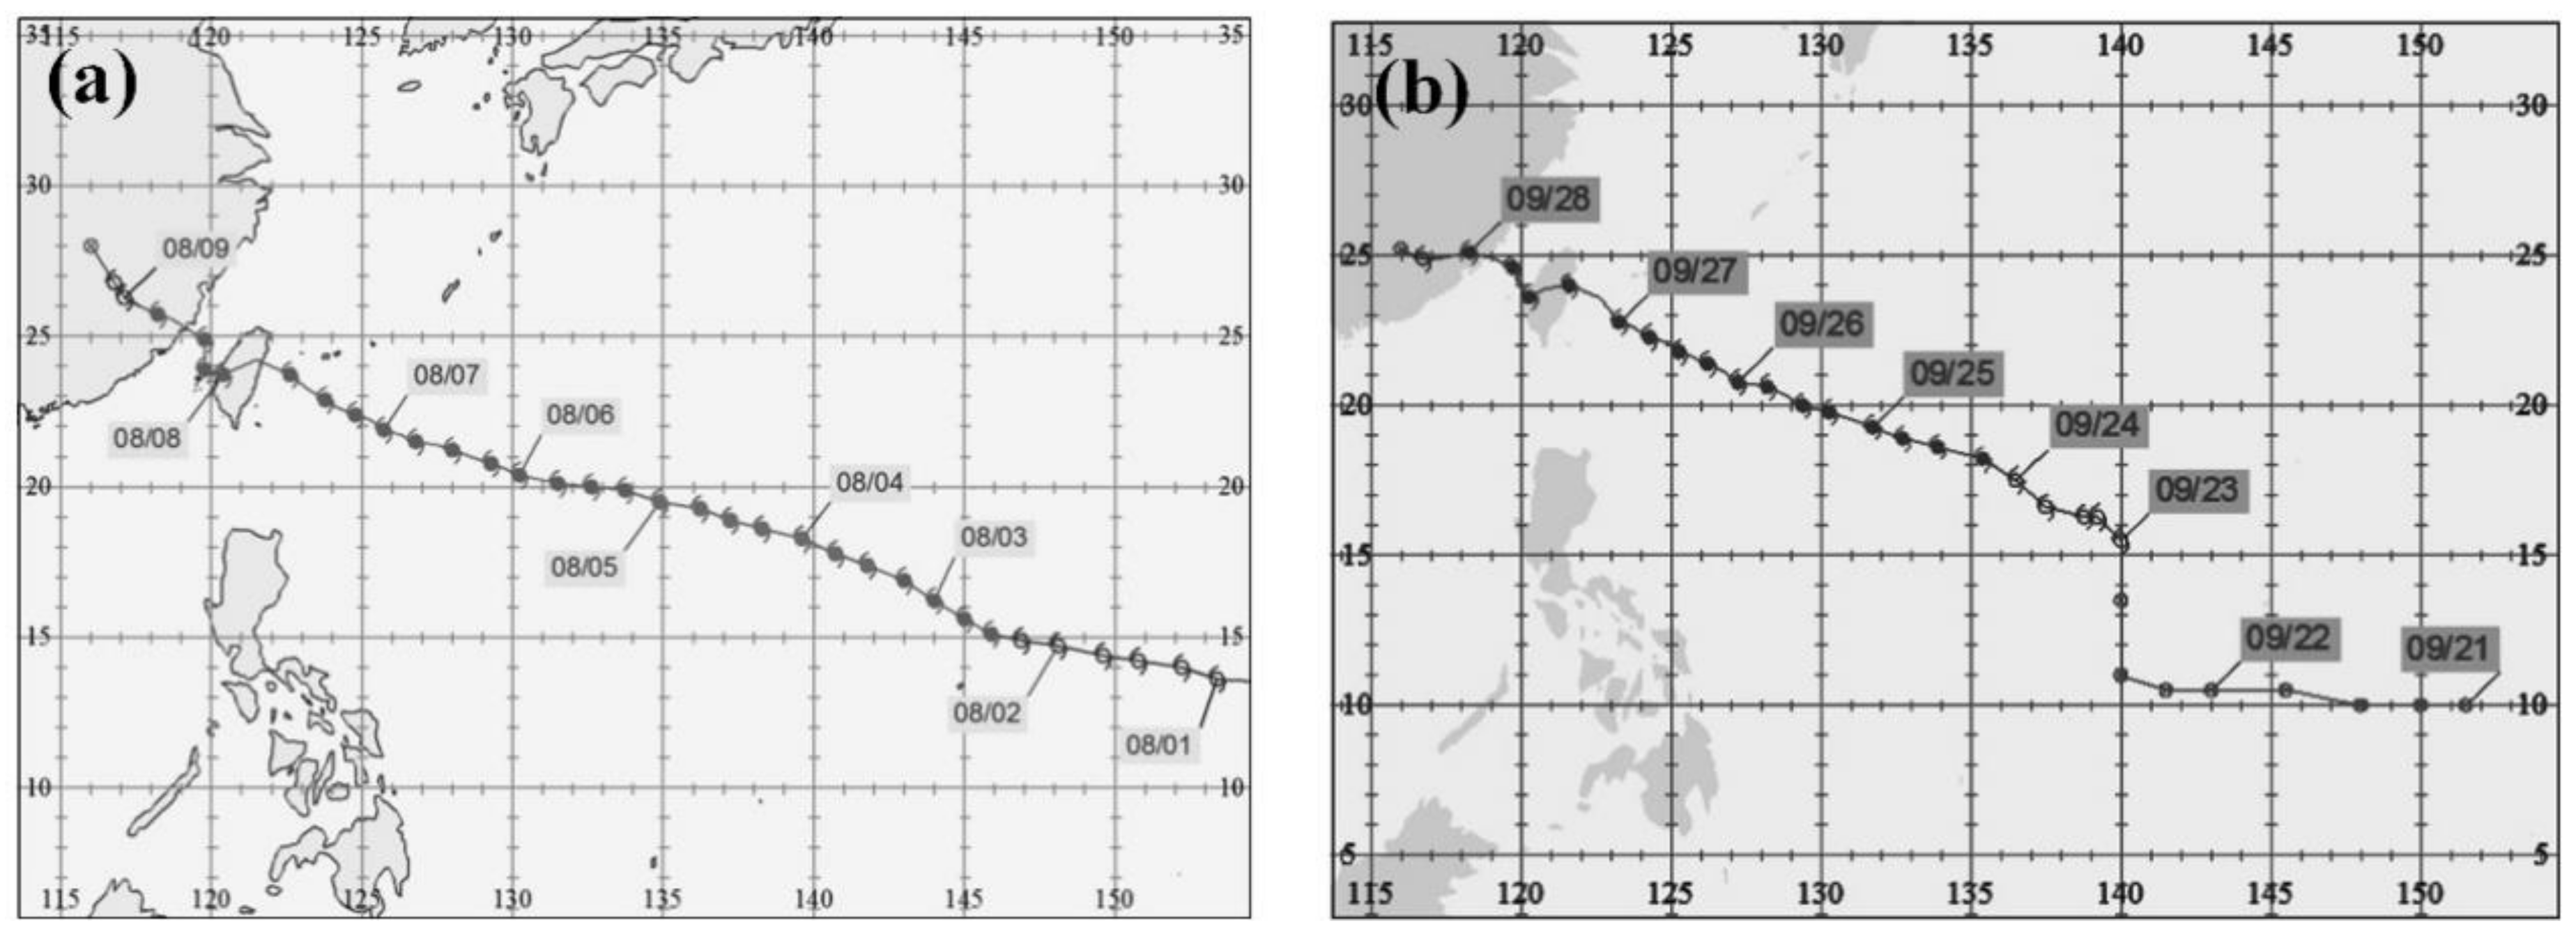
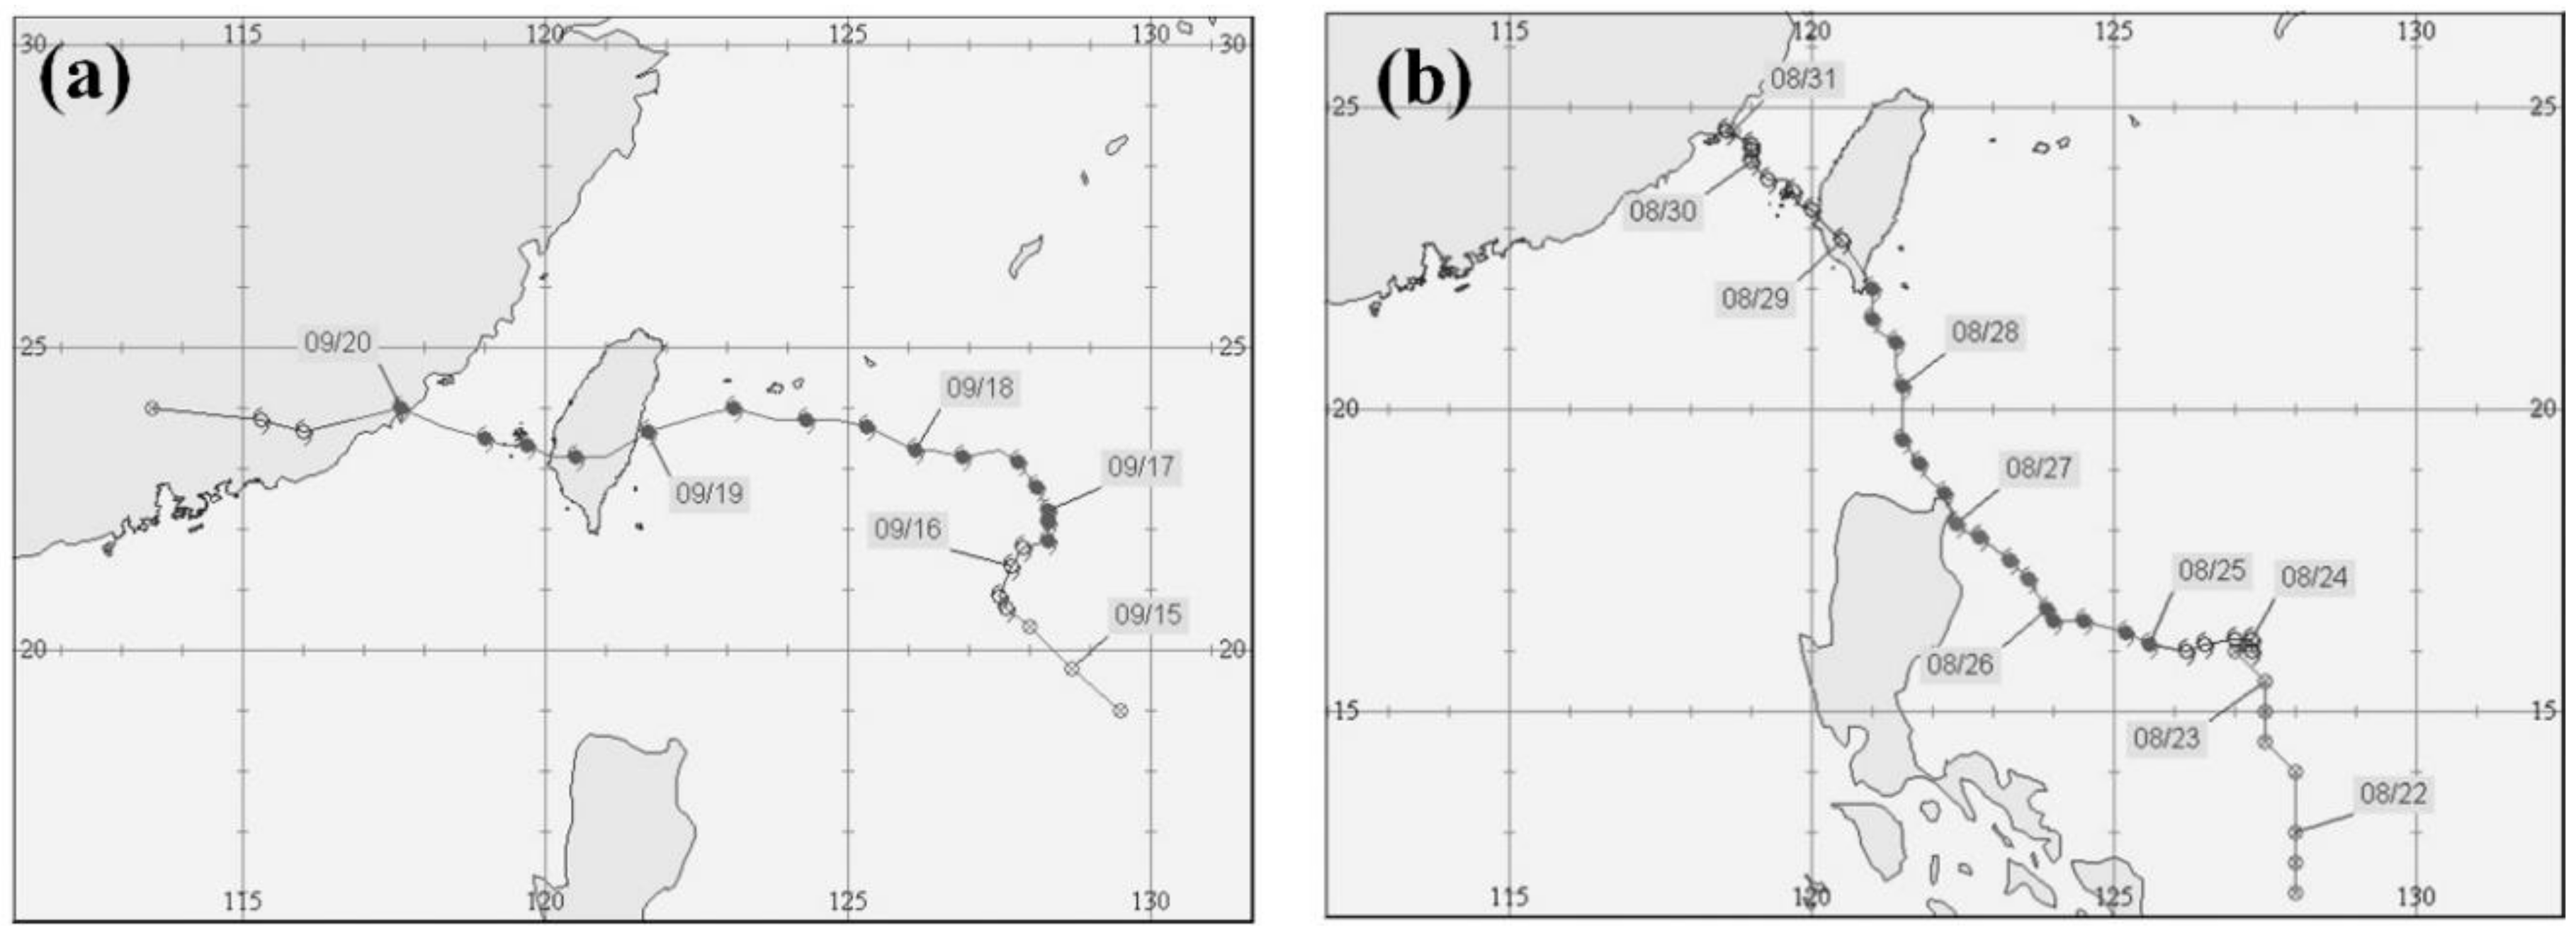
Studies have often categorized typhoons first by their tracks, and then utilized data from historical typhoons with similar tracks to evaluate the possible future directions. Subsequently, trends in future wind force patterns in western regions are predicted. Therefore, using historical records to evaluate a typhoon’s wind force has been a feasible means in practice. Generally, typhoons affecting Taiwan are developed between Guam and the Philippines. Some are developed in the South China Sea, but most of these are weak and less damaging to Taiwan. The typhoons that affect Taiwan more directly are categorized by the CWB as westward typhoons. Among them, the typhoons whose center make landfall on Taiwan normally cause the most severe damage. The CWB further categorized those typhoons’ tracks as Types 2, 3, and 4 (
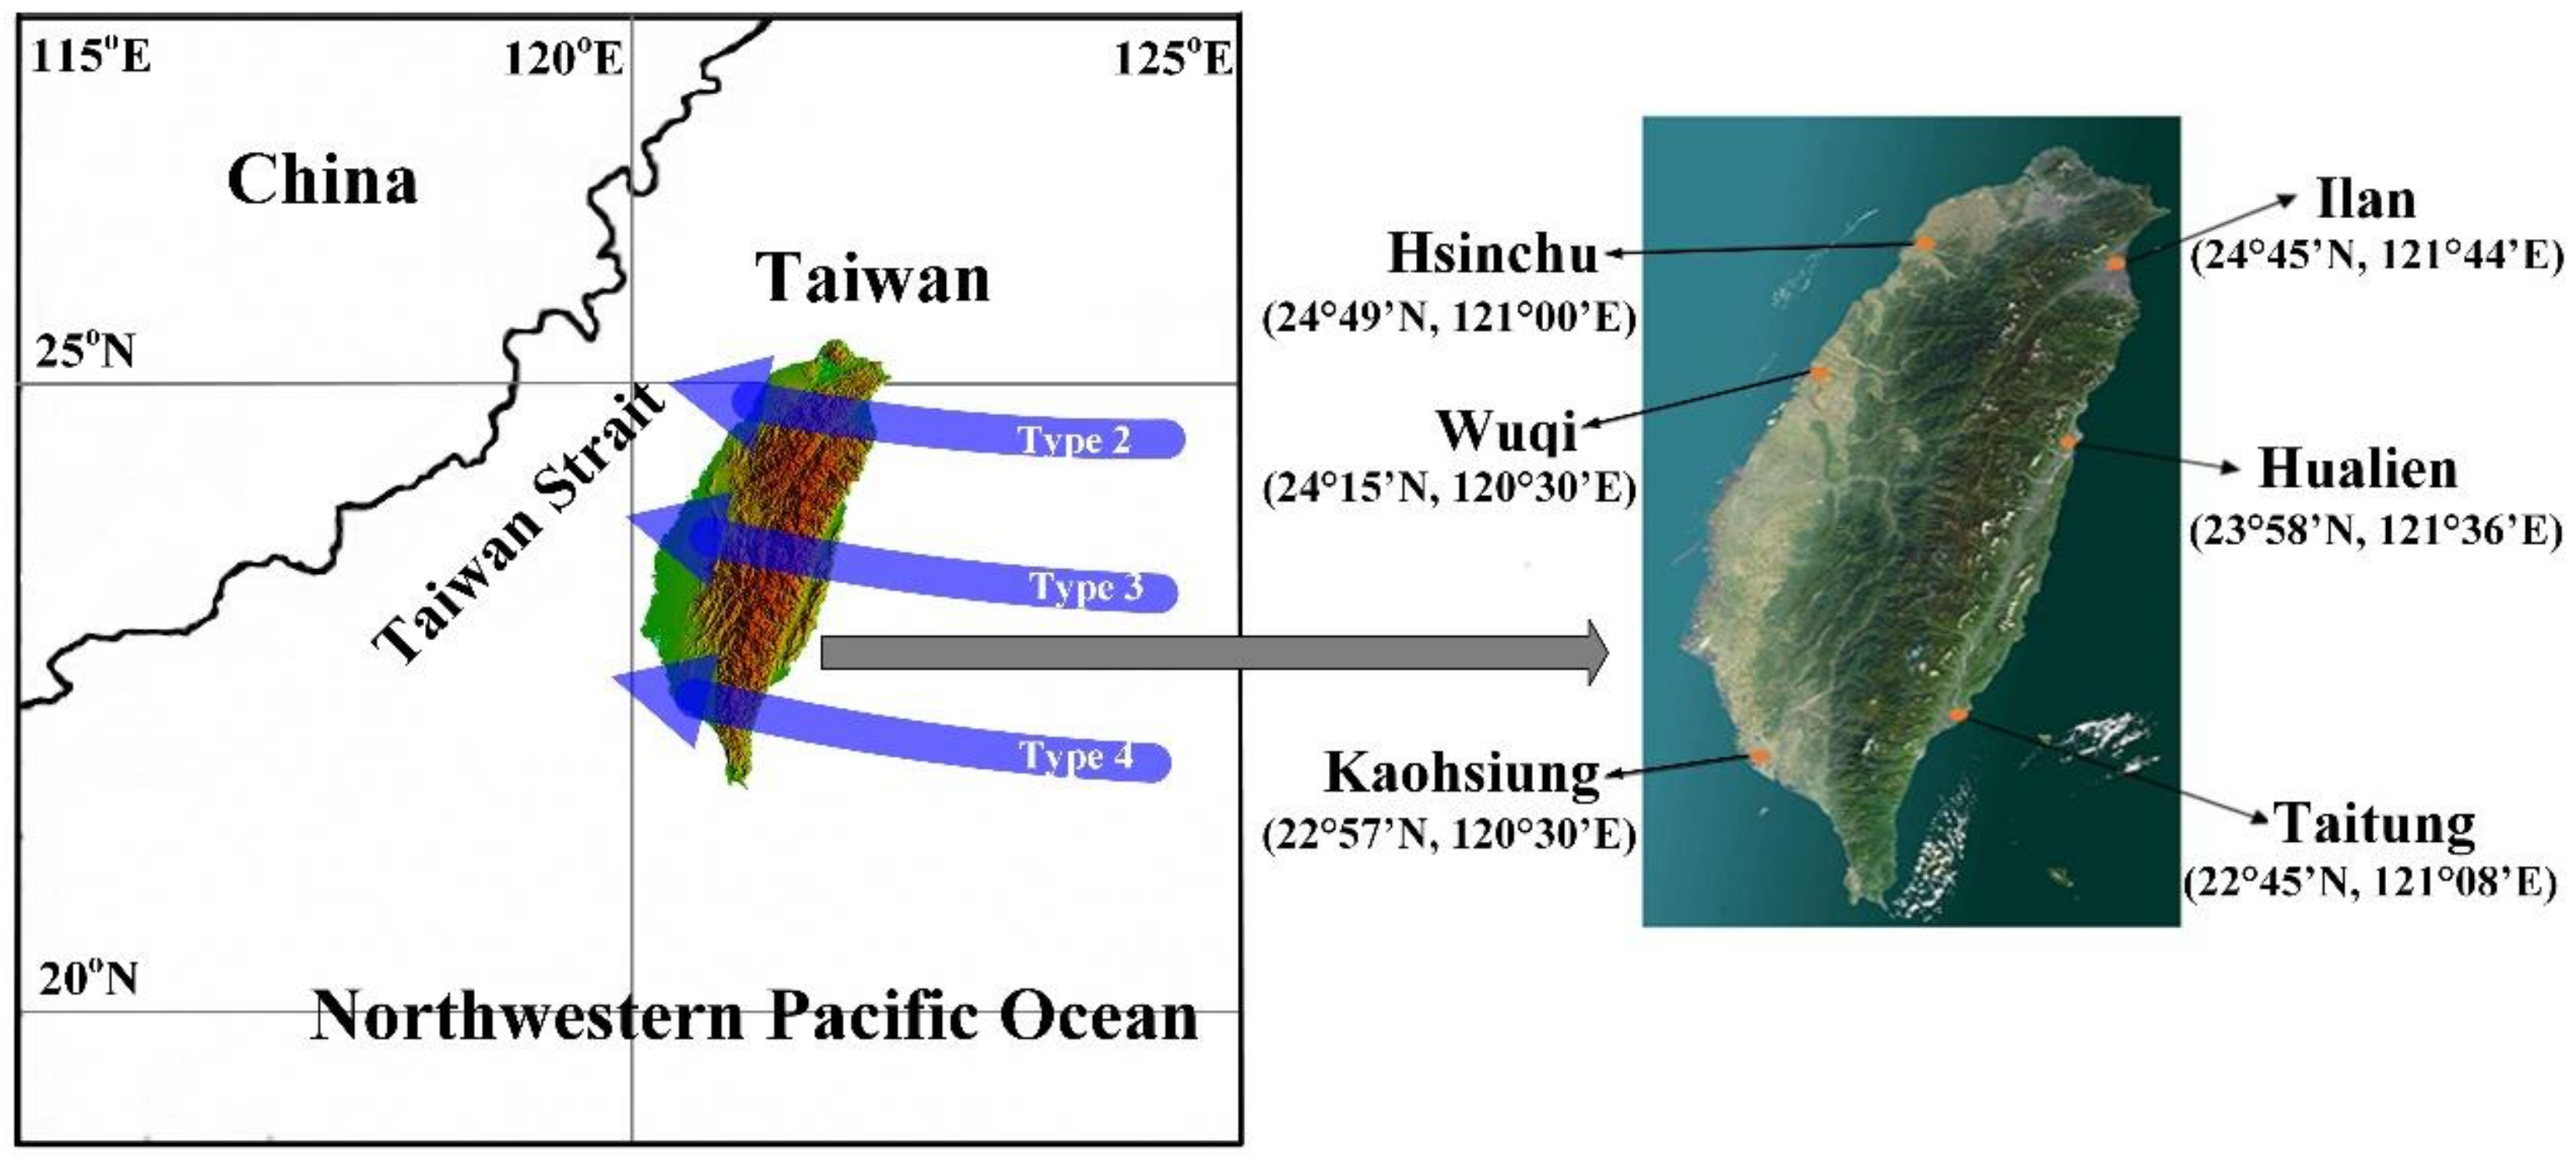
Figure 1). Types 2, 3, and 4 are defined as the center of a typhoon making landfall in northern, central, and southern Taiwan, respectively. Because their centers make direct landfalls, typhoons with these three tracks affect Taiwan the most severely. According to the CWB’s definitions, there are two other track directions for westward-moving typhoons: westward movement traveling over the southern East China Sea (near northern Taiwan) (Type 1), and westward movement traveling across the Luzon Strait, which is the strait between Taiwan and Luzon Island of the Philippines (Type 5). Because the centers of Type 1 and 5 typhoon tracks do not directly make land over Taiwan, they are associated with relatively weaker winds that cause fewer disasters than those of Type 2, 3, and 4 tracks. Thus, this study did not address Type 1 and 5 tracks.
This study investigated wind speed predictions in western coastal areas when Types 2, 3, and 4 typhoons strike in order to understand the changes in wind speed in the following couple of hours after the typhoon has passed the CMR from the east. In addition, on the basis of the analysis results, the accuracy of predictions on the maximum wind speed and its occurrence time can be evaluated and serve as a reference for predicting the effects of a typhoon on western areas. Western Taiwan refers to the geographical region west of the foothill of the CMR, taking up approximately half of the island’s area. The CMR is the longest mountain range in Taiwan, which is approximately 340 km in length and 80 km in width, and it is located east of the center of Taiwan. Positioned north-northeast to south-southwest, the CMR divides Taiwan into eastern and western regions. The highest peak is Yushan in the Yushan Range, at an altitude of 3952 m.
In recent years, numerous scholars have combined the theory of typhoon wind speed with high-speed computer calculations, creating several theories and research methodologies [
4,
5,
6,
7,
8], and resulting in great progress in predicting typhoon wind speed. Machine learning is generally employed to establish models. Using historical typhoon observation and station wind speed data, machine learning derives the correlation between actual observed information and weather parameters, further using the correlations among the parameters to establish a prediction model to fulfill the goal of prediction. In the history of machine learning development, earlier adopted methods used regression in statistics, and, more recently, neural networks. Among regression methods in statistics, linear regression has the strengths of being simple and easy to calculate; thus, it is often adopted to establish models to derive equations between parameters and to make predictions. However, for high-dimensional, nonlinear problems, stable and accurate mathematical models are required, such as a neural network [
9]. In addition, numerous studies have employed artificial intelligence to predict wind speed. For example, Li et al. [
10] proposed a data-driven model for determining a typhoon's wind power spectrum according to analytical considerations and field measurements of typhoons in the South China Sea. Wei [
11] adopted two types of neural network—an adaptive-network-based fuzzy inference system (ANFIS) and a multilayer perceptron neural network—to predict the effect on wind speed in the Penghu Islands from typhoons of various tracks. The parameters that Wei adopted were generally the same as those that were adopted in the present study. Wei’s results revealed that, because an adaptive-network-based fuzzy inference system combined fuzzy theory, it considered more factors and more theories than a multilayer perceptron neural network did, which adopted samples to train statistics. Therefore, ANFIS obtained more favorable prediction results. Croonenbroeck and Ambach [
12] investigated the short- to medium-term prediction performance of several wind power forecasting models, including the Wind Power Prediction Tool, an adaptation of the Mycielski approach, and nonparametric regression models. Wei [
13] adopted three types of machine learning method to predict wind speed at Pengjia Islet and Orchid Island, Taiwan: Pearson VII support vector machines for regression (SVR), regressions, and Holland’s hurricane wind model [
4]. When comparing the three, Wei discovered that the Pearson VII SVR model yielded the most favorable results, whereas Holland’s model was only suitable for use in the open sea and not for analyzing regions that were affected by the topographic factors of the CMR. Kadhem et al. [
5] developed a model to predict wind speed with a dependence on seasonal wind variations over a particular time frame (usually a year), in the form of a Weibull distribution model with an artificial neural network (ANN). Wei [
14] employed data-driven models, comprising SVRs, regression, and decision trees as forecasting techniques to predict the wind velocity on Orchid Island, Taiwan. Yang et al. [
15] proposed a hybrid forecasting model for wind speed prediction, which combined the decomposition and ensemble strategy and the fuzzy time series forecasting algorithm. Moreover, some studies have adopted statistical methods to evaluate typhoon wind speed. For example, Yasui et al. [
16] and Xiao et al. [
17] presented refinements of the Monte Carlo method, focusing on improvements to the statistical distribution functions describing typhoon characteristics that were used in the simulation. In addition, Yoshida et al. [
18] proposed a model for predicting the wind speed and the direction of typhoon winds, according to the Monte Carlo method.
Because the track of westward typhoons is affected by complex geographical shelters and disturbances from the CMR, wind predictions in western Taiwan as well as the impact duration of these typhoons are challenge. Therefore, this study established three wind speed prediction models for three types of westward typhoon (i.e., Types 2, 3, and 4 tracks) in order to investigate the accuracy of wind speed predictions at stations in western Taiwan. This study adopted ANN to establish typhoon wind speed prediction models, and the prediction duration was from 1 to 6 h. The research area was western Taiwan. The developed models can provide wind speed prediction information and can be used to investigate the accuracy of wind speed predictions at various locations and under various durations.
The remainder of this paper is organized as follows:
Section 2 describes the data patterns obtained from the study area.
Section 3 develops prediction models based on an ANN, and presents the prediction modeling process, comprising the parameter calibrations and performance levels of the studied cases.
Section 4 and
Section 5 provide evaluations of each typhoon path. Finally,
Section 6 presents the conclusion.
2. Experimental Data
This study adopted three weather stations in western Taiwan as test locations, which from north to south were Hsinchu Station, Wuqi Station, and Kaohsiung Station (
Figure 1). A total of 28 westward typhoon events from 2000 to 2016 were studied. Among them, 8, 13, and 7 typhoons were categorized by CWB as taking Types 2, 3, and 4 tracks, respectively; furthermore, the number of Type 3 typhoons was the highest. The impact duration, maximum wind speed, and radius of the 28 typhoons are listed in
Table 1.
From the CWB, this study collected information on typhoon characteristics and weather information from ground stations. The sampled data dated from 2000 to 2016. The ground stations adopted were Hsinchu, Wuqi, and Kaohsiung Stations in the west of Taiwan, and Ilan, Hualien, and Taitung Stations in the east.
Figure 1 details the geographical location, latitude, and longitude of these stations. Among them, Hsinchu and Ilan Stations are on the Type 2 track, Wuqi and Hualien Stations are on the Type 3 track, and Kaohsiung and Taitung Stations are on the Type 4 track. After organizing the information, this study obtained 1954 pieces of hourly data. Each piece of data contained seven typhoon characteristics: typhoon central pressure, typhoon central position (including latitude and longitude), radius of Beaufort wind scale 7, typhoon translation speed, maximum wind speed near the center, and maximum instantaneous wind speed. Station information characteristics covered the following six characteristics: station pressure, sea-level pressure, maximum average wind speed, maximum average wind direction, maximum gust wind speed, and maximum gust wind direction.
3. Model Development
This study adopted ANN and established wind speed prediction models for western Taiwan. As mentioned previously, wind speeds that were observed at stations in eastern Taiwan before typhoons made landfall were less disturbed by the terrain. The input information for these models included typhoon characteristics, data of three stations from eastern Taiwan, and data of three stations from western Taiwan; furthermore, the target output values of these models were the observed wind speed values at western stations.
When establishing wind speed prediction models for the three western stations, this study entered characteristics data that excluded those from the station itself. For example, the prediction model for Hsinchu Station adopted weather information from Ilan, Hualien, Taitung, Wuqi, and Kaohsiung Stations. This measure was adopted in the hope that the wind speed of a station, presumably an ungauged station, could be inferred from the data from other stations. Therefore, when constructing the three prediction models for western Taiwan, 37 ANN characteristics were employed (seven typhoon characteristics and 30 weather data characteristics from five stations). In addition, this study adopted backpropagation neural networks (BPNN) to establish wind speed prediction models, and a linear regression model was used as the benchmark to evaluate BPNN.
3.1. Theory
ANN is a calculation method using connected artificial neurons to simulate artificial nerve cells. Artificial neurons calculate through an approach that is parallel and dispersed. ANN can process a large amount of data simultaneously, establishing the relationship between the input and output of the system through learning. This systematic model has been widely employed in various areas for calculations and predictions [
19]. ANN is supervised learning network featuring high accuracy, high learning speed, and capacities to use continuous values as input, handle complex sample identification, and process nonlinear function compositions. Thus, ANN is suitable for making evaluations and predictions. This study adopted supervised learning to predict the typhoon wind speed.
BPNN is the most representative and most commonly adopted ANN in ANN learning. This study employed a forward framework, comprising (1) an input layer, which presented the input variables of the network, and its number of neurons was dependent on the questions; (2) a hidden layer, which processed information from the input layer, presented the interaction between input layer neurons, and after processing the information, delivered it to the output layer; and, (3) an output layer, which processed and then exported data from the hidden layer, producing the output variables of the network. In a BPNN, transfer function or activation function are rules for mapping the sum of an individual weighted input to the output. The purpose is to train the ANN to determine the optimal solution for those weighted values. Commonly adopted nonlinear transfer functions are sigmoid transfer function, hyperbolic tangent transfer function, and Gaussian transfer function [
20]. Among them, sigmoid transfer function is most often adopted. Furthermore, BPNN is a supervised learning process, and its algorithm is divided into the learning process and the recalling process. The basic principle of the learning process is to use the algorithm concepts from the gradient descent method and Levenberg–Marquardt algorithm, using repeated training and adjusting the weighted values to minimize differences between the expected output values and the actual target values, and to obtain the minimum error function, thereby achieving optimal learning. The recalling process follows the original weights, entering another set of values that have not been learned, and outputting vectors according to the recalling algorithm of the network as a verification process. The proposed modeling process was described in the following sections.
3.2. Feature Selection and Typhoon Classification
From the numerous input selection methods that are suitable to model inputs, the simple correlation-based criterion method was employed, which involves distinct correlation coefficients (CCs) for selecting the attributes. The CCs between the attributes and target were evaluated to select the appropriate attributes. In general, a CC value of higher than 0.7 represents a strong correlation, between 0.3 and 0.7 represents a median correlation, and lower than 0.3 represents a weak correlation. In this study, the threshold CC was determined to be 0.3 (weak correlation) for choosing the relevant characteristics. After the analysis, the number of selected characteristics at the Hsinchu, Wuqi, and Kaohsiung Stations of track Type 2 was 25, 27, and 18, respectively; for track Type 3, it was 18, 20, and 22, respectively; and, for track Type 4, it was 28, 23, and 13, respectively.
The typhoons that this study investigated were separated into a training set and a testing set, as shown in
Table 2. The testing set contained the last two typhoons in the collection duration of each track for verification, which were Soulik (2013) and Dujuan (2015) for Type 2, Soudelor (2015) and Megi (2016) for Type 3, and Fanapi (2010) and Nanmadol (2011) for Type 4. In addition, the training sets on those tracks were used to train the model.
3.3. Modeling and Parameter Calibration
This study employed Matlab to construct BPNN prediction models. The training set typhoons were adopted to establish a prediction model and train model parameters, thus enabling the ANN to produce output values that were close to the target value. The testing set typhoons were adopted for evaluating the ANN learning results.
Regarding BPNN parameter settings, the activation function in the hidden layers adopted a hyperbolic tangent function. As for the number of hidden layers, according to [
21], a single hidden layer would normally equip adequate verification abilities and could solve most application problems; thus, this study adopted one hidden layer. Furthermore, the amount of neurons in the hidden layer was based on a suggestion by [
22]: the parameter was set to ((input layer neurons + output layer neurons − 1)/2). The learning rate was adopted from the default value of the software. Momentum was determined through trial and error. Because the range of momentum is between 0 and 1, this study adopted 10 equally divided levels to estimate the evaluation index of each interval (0.1). Moreover, it employed root-mean-square error (RMSE) as an evaluation index to assess prediction values obtained from the estimation models. RMSE is defined as follows:
where
Yi is the estimated value of the record
i;
Oi is the observation of the record
i; and,
n is the total number of records. The smaller the RMSE, the smaller the prediction error becomes.
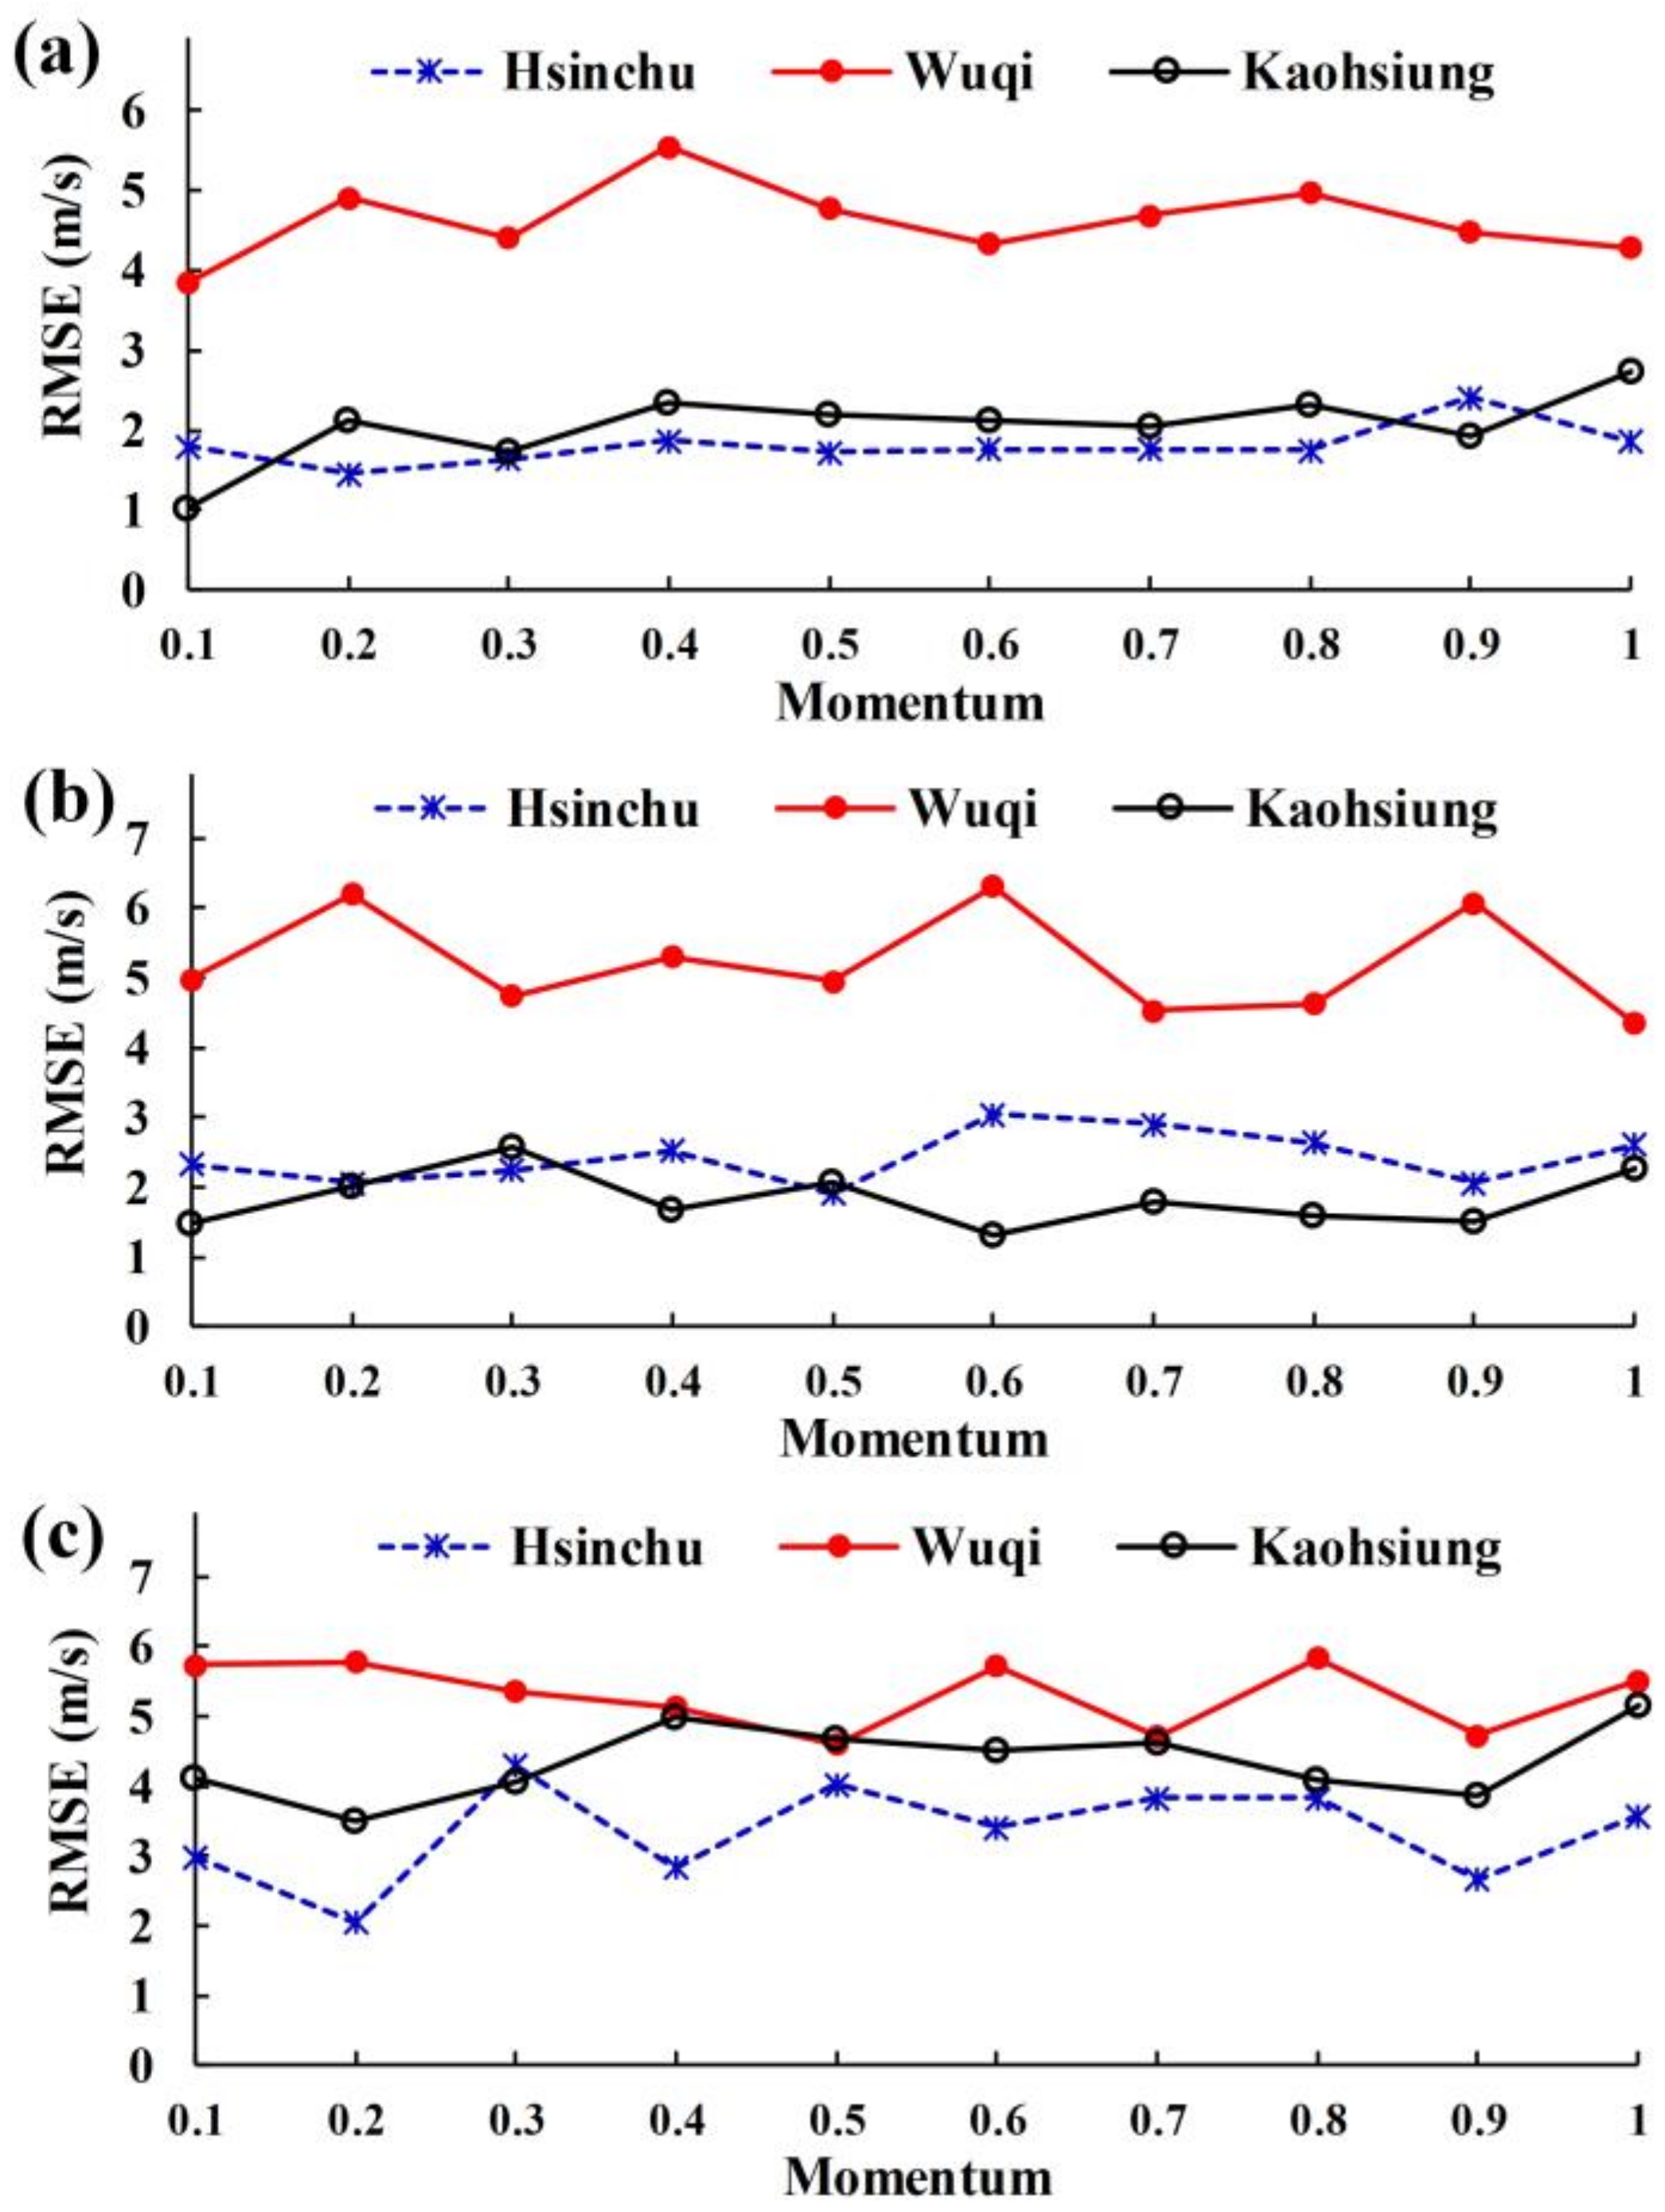
This study established individual prediction models for typhoons taking track Types 2, 3, and 4. First, parameter verification was conducted for the wind speed prediction model with a 1 h lead time. The minimum value of RMSE was used to determine the momentum in ANN.
Figure 2 presents the sensitivity analysis results of momentum.
Figure 2a–c plot the results obtained when using various momentum values for the track Types 2, 3, and 4, respectively.
Figure 2a reveals that the optimal momentums of the Type 2 in Hsinchu, Wuqi, and Kaohsiung were 0.2, 0.1, and 0.1, respectively;
Figure 2b shows that the optimal momentums for Type 3 were 0.5, 1, and 0.6, respectively; and,
Figure 2c reveals that the optimal momentums for Type 4 were 0.2, 0.5, and 0.2, respectively. Using the aforementioned evaluation method, this study evaluated the parameters for prediction models with a 2- to 6-h lead time.
3.4. Performance
To evaluate wind speed prediction models, this study adopted five methods as the evaluation criteria: RMSE (defined in the previous section), relative root mean squared error (rRMSE), mean absolute error (MAE), relative mean absolute error (rMAE), and CC. The equations for each are as follows:
where
is the mean of observed values, and
is the mean of estimated values. RMSE and MAE represent absolute errors, whereas rRMSE and rMAE represent relative errors.
5. Discussion
5.1. Performance of Each Station with Typhoons of Various Tracks
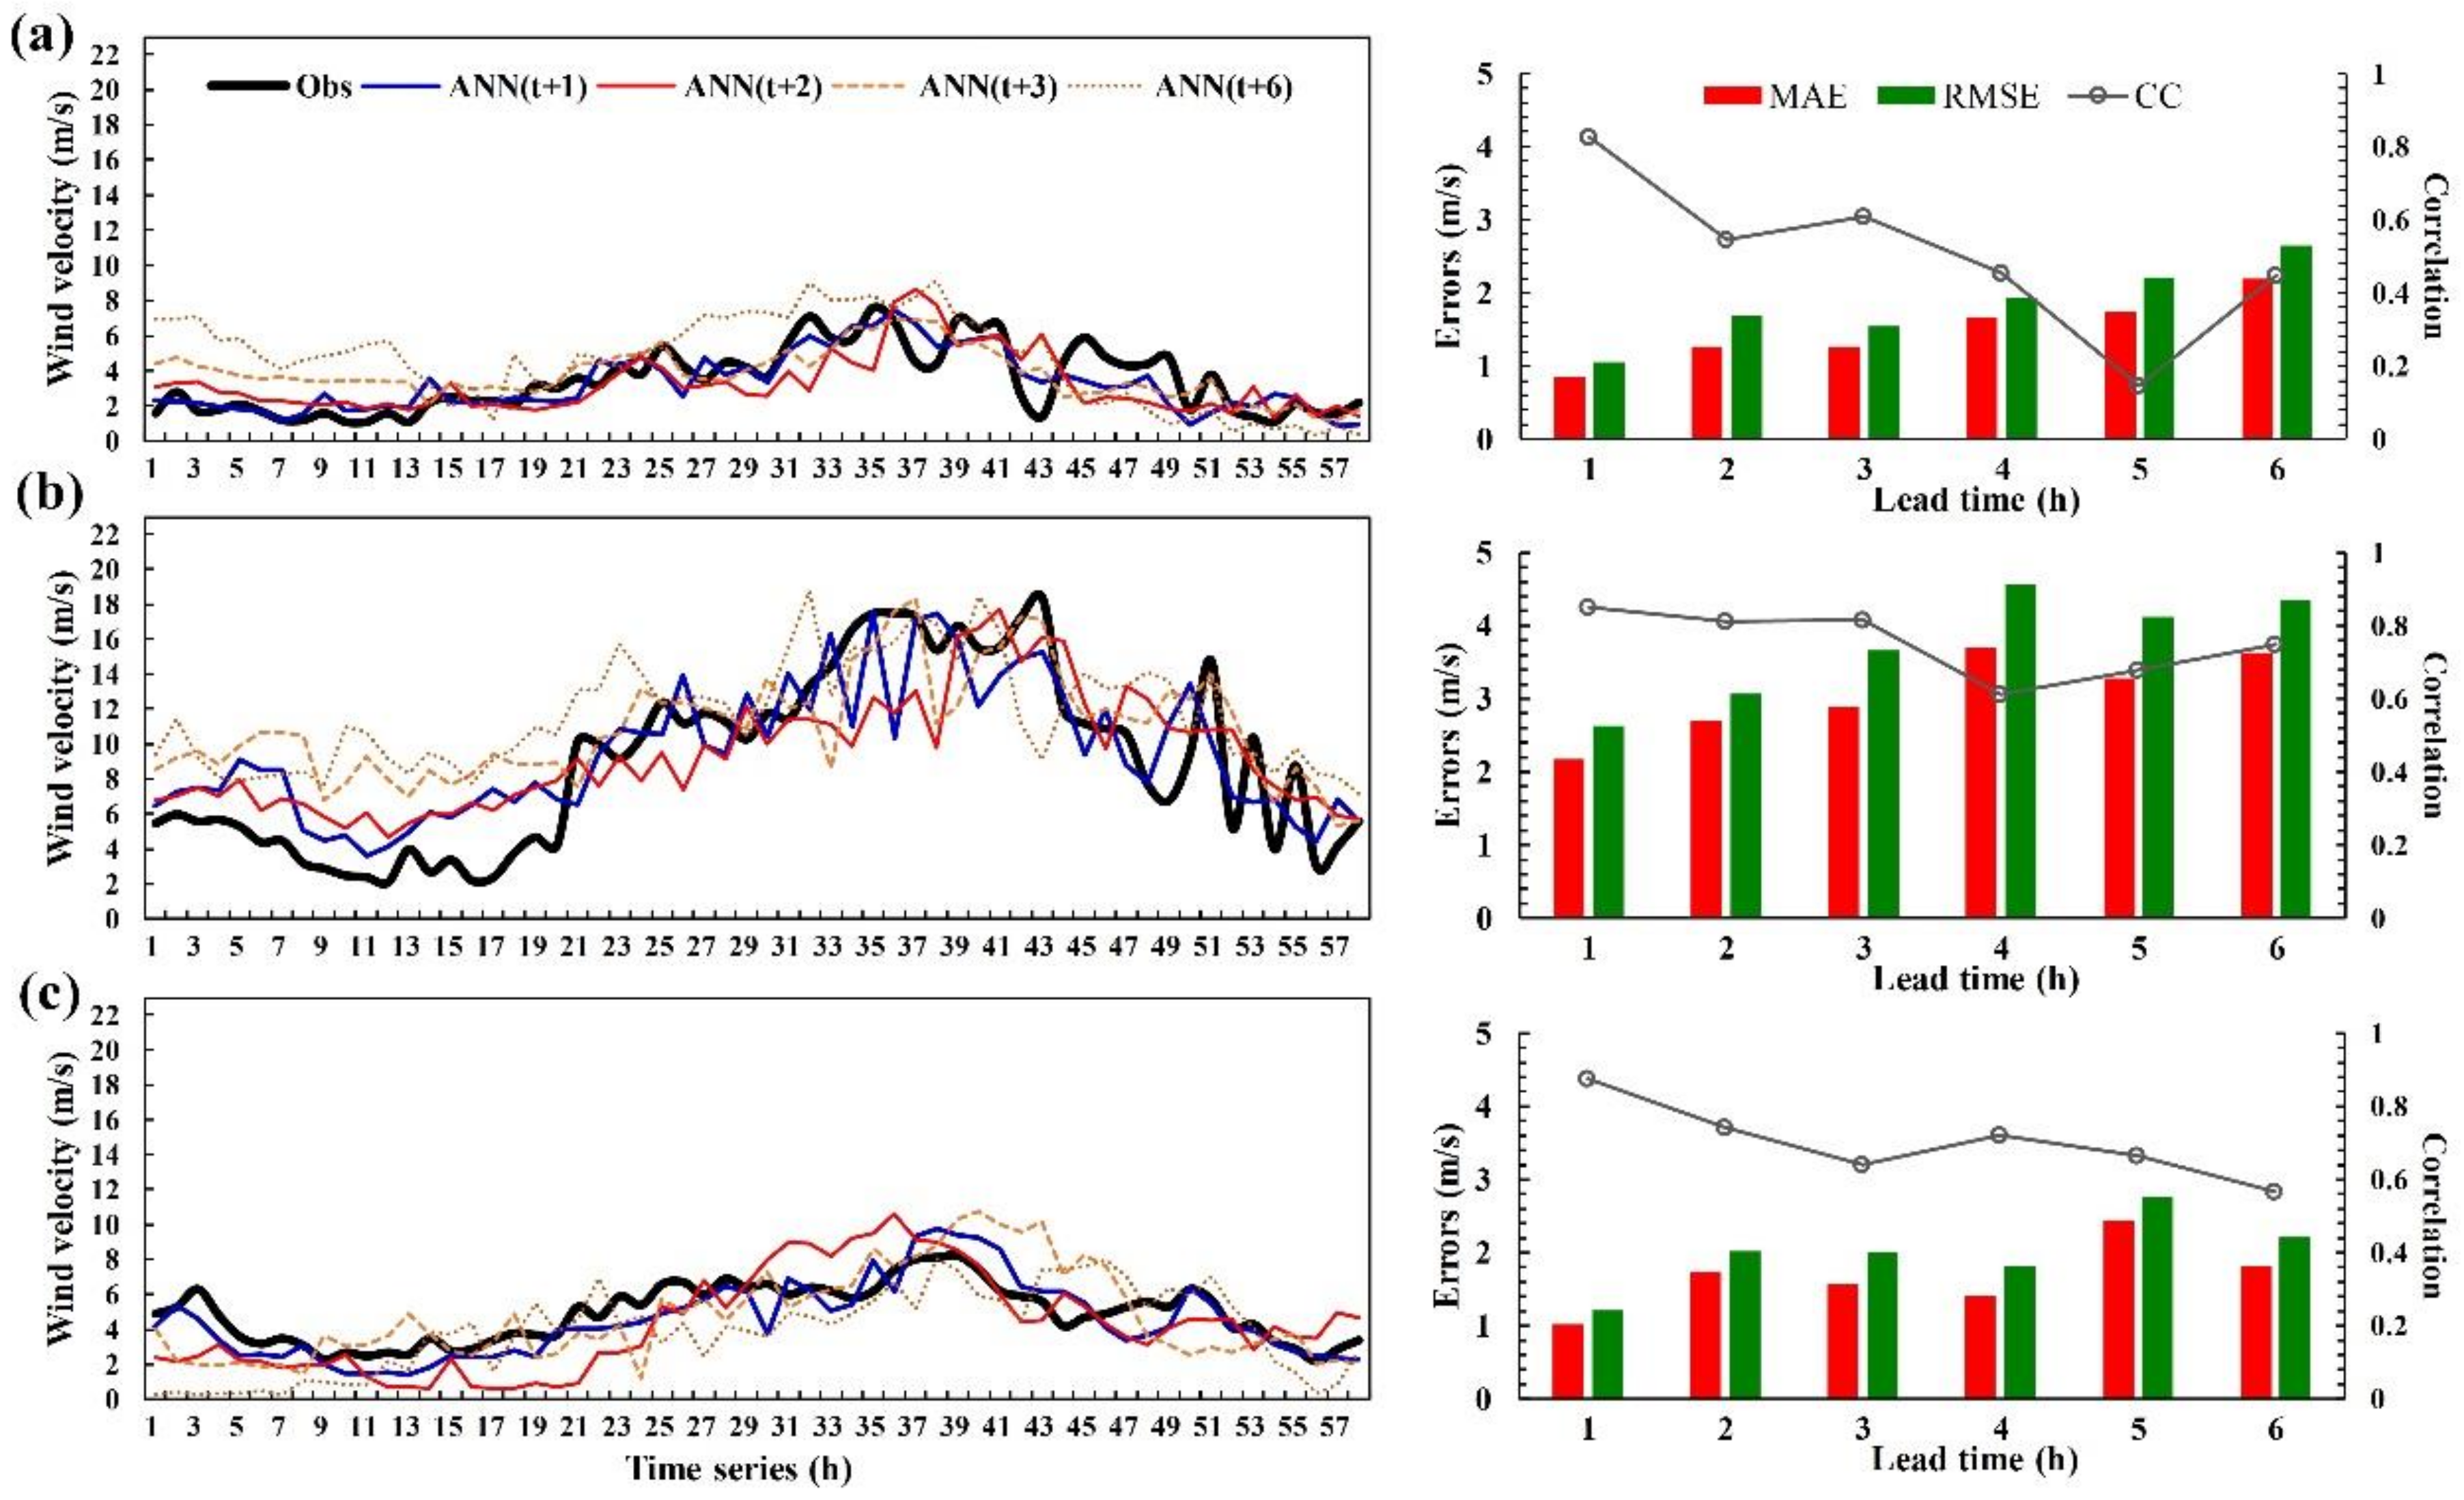
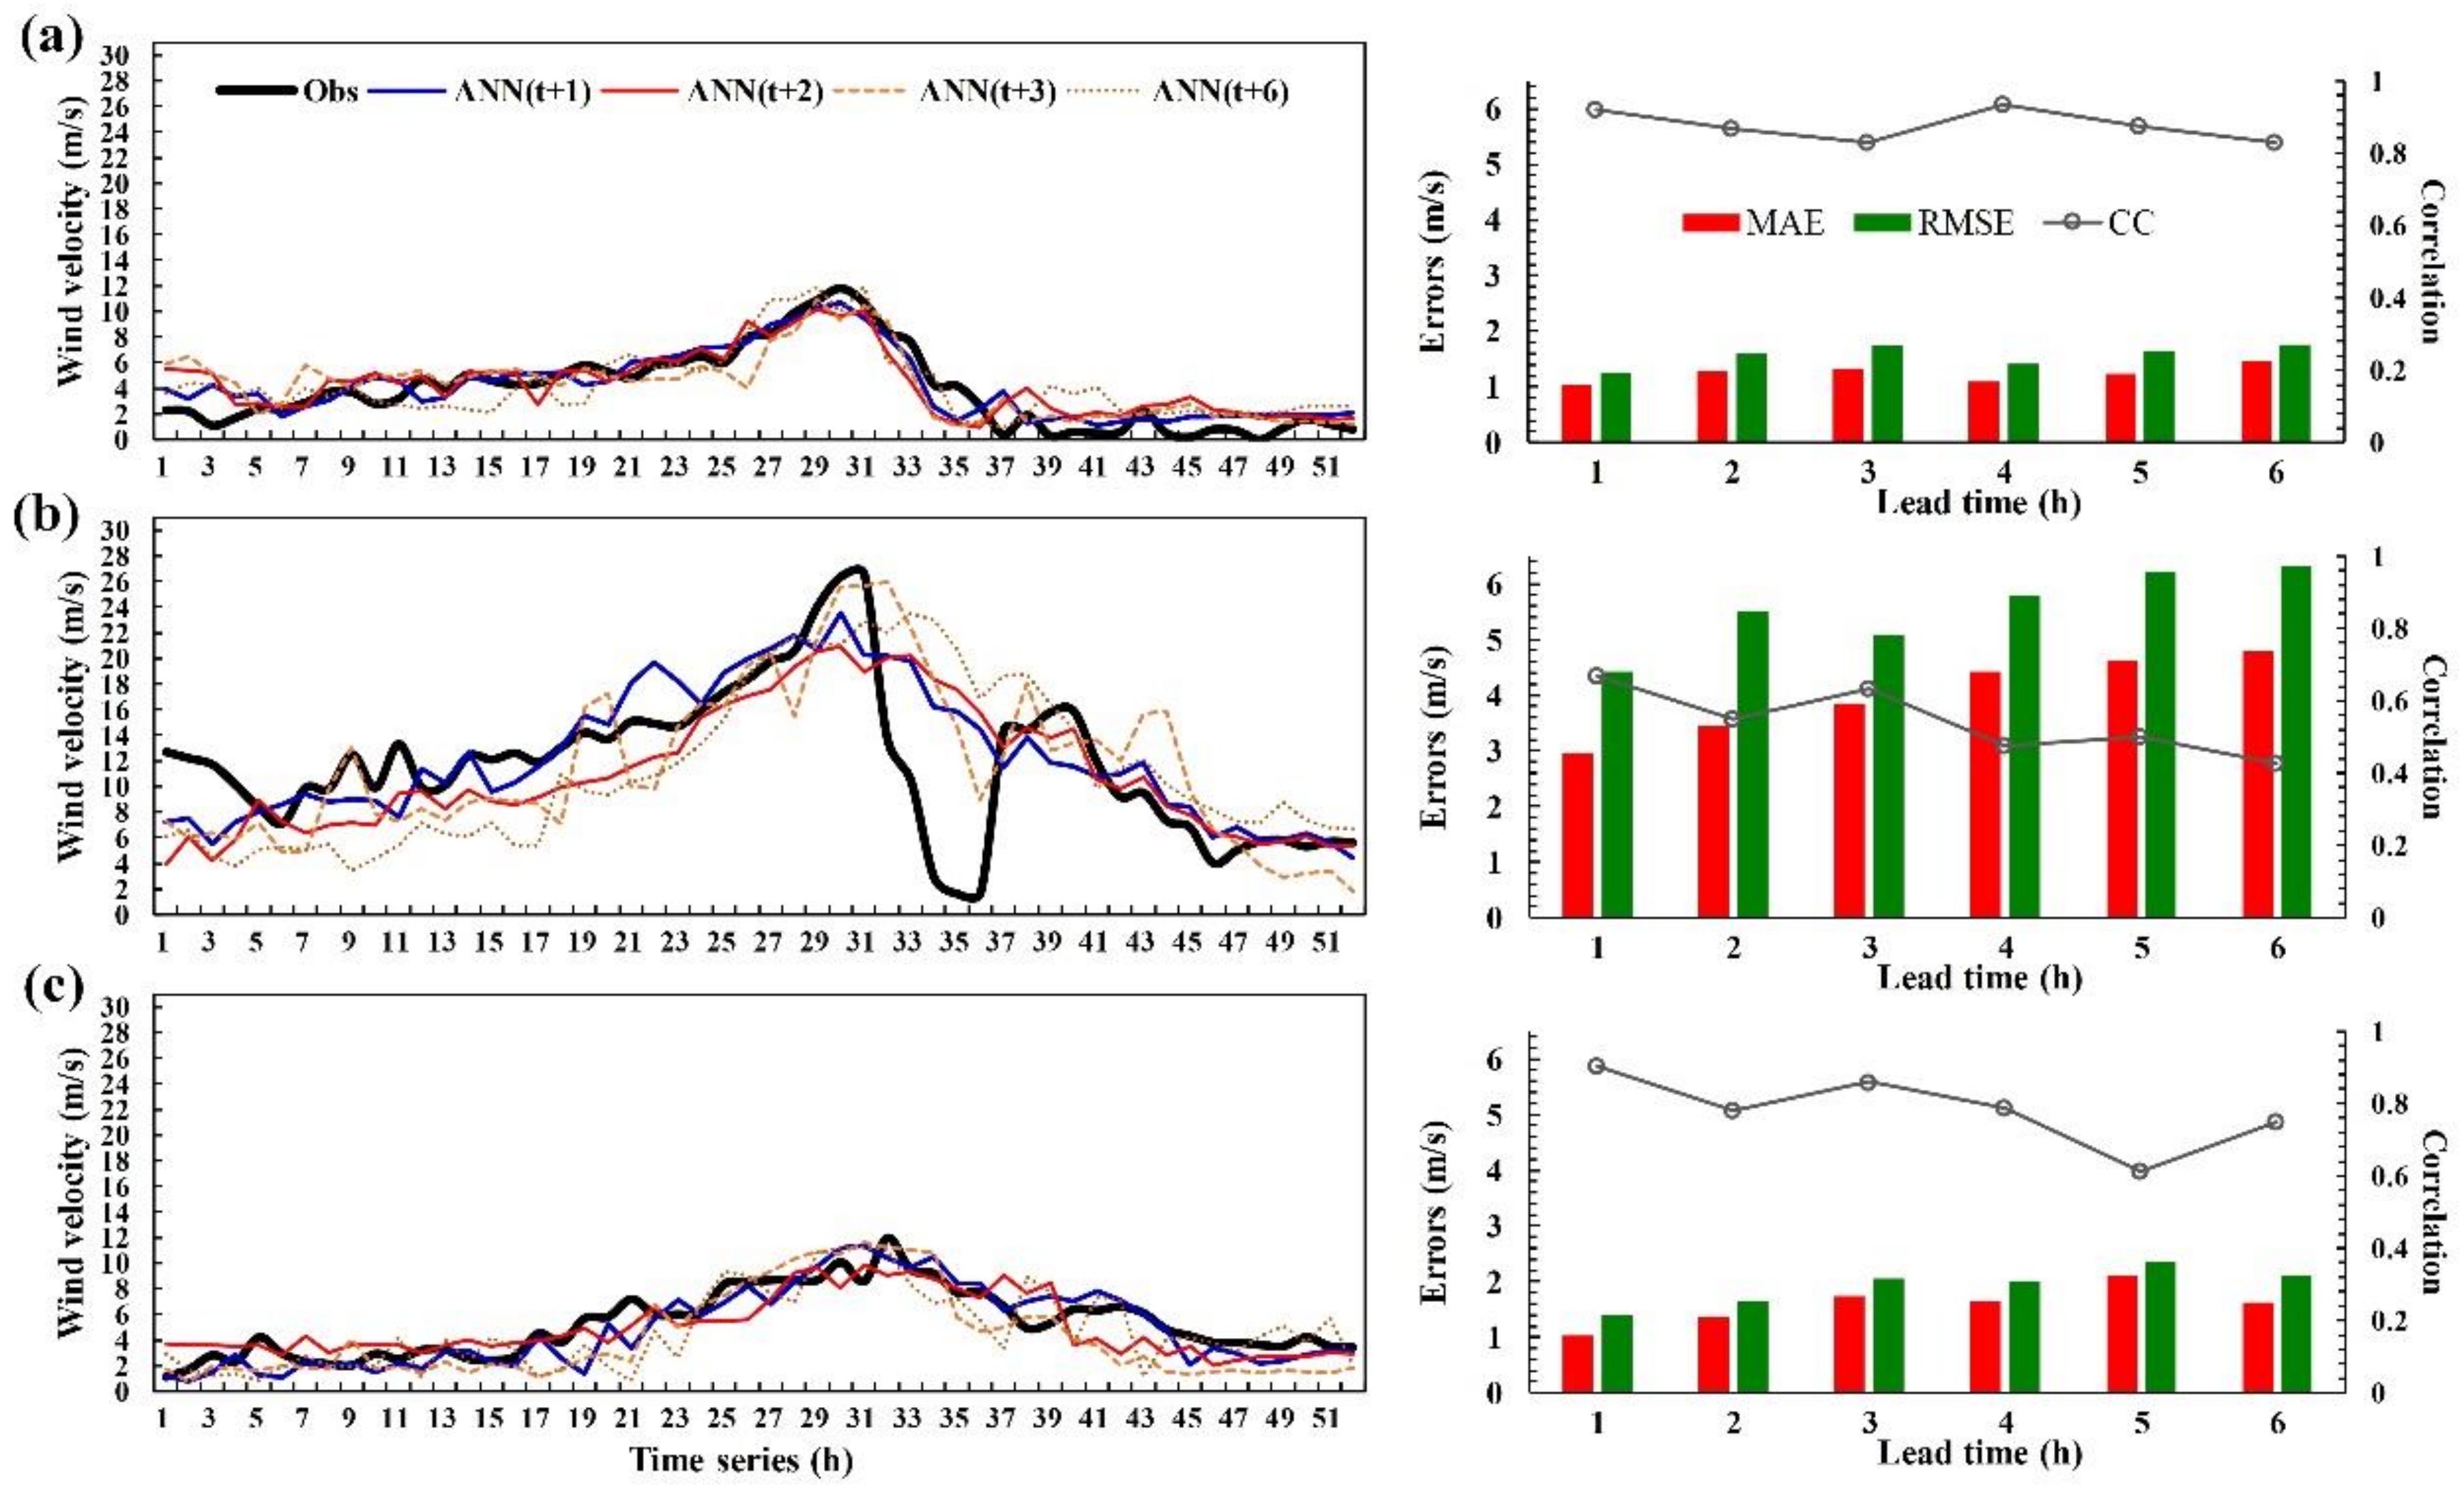
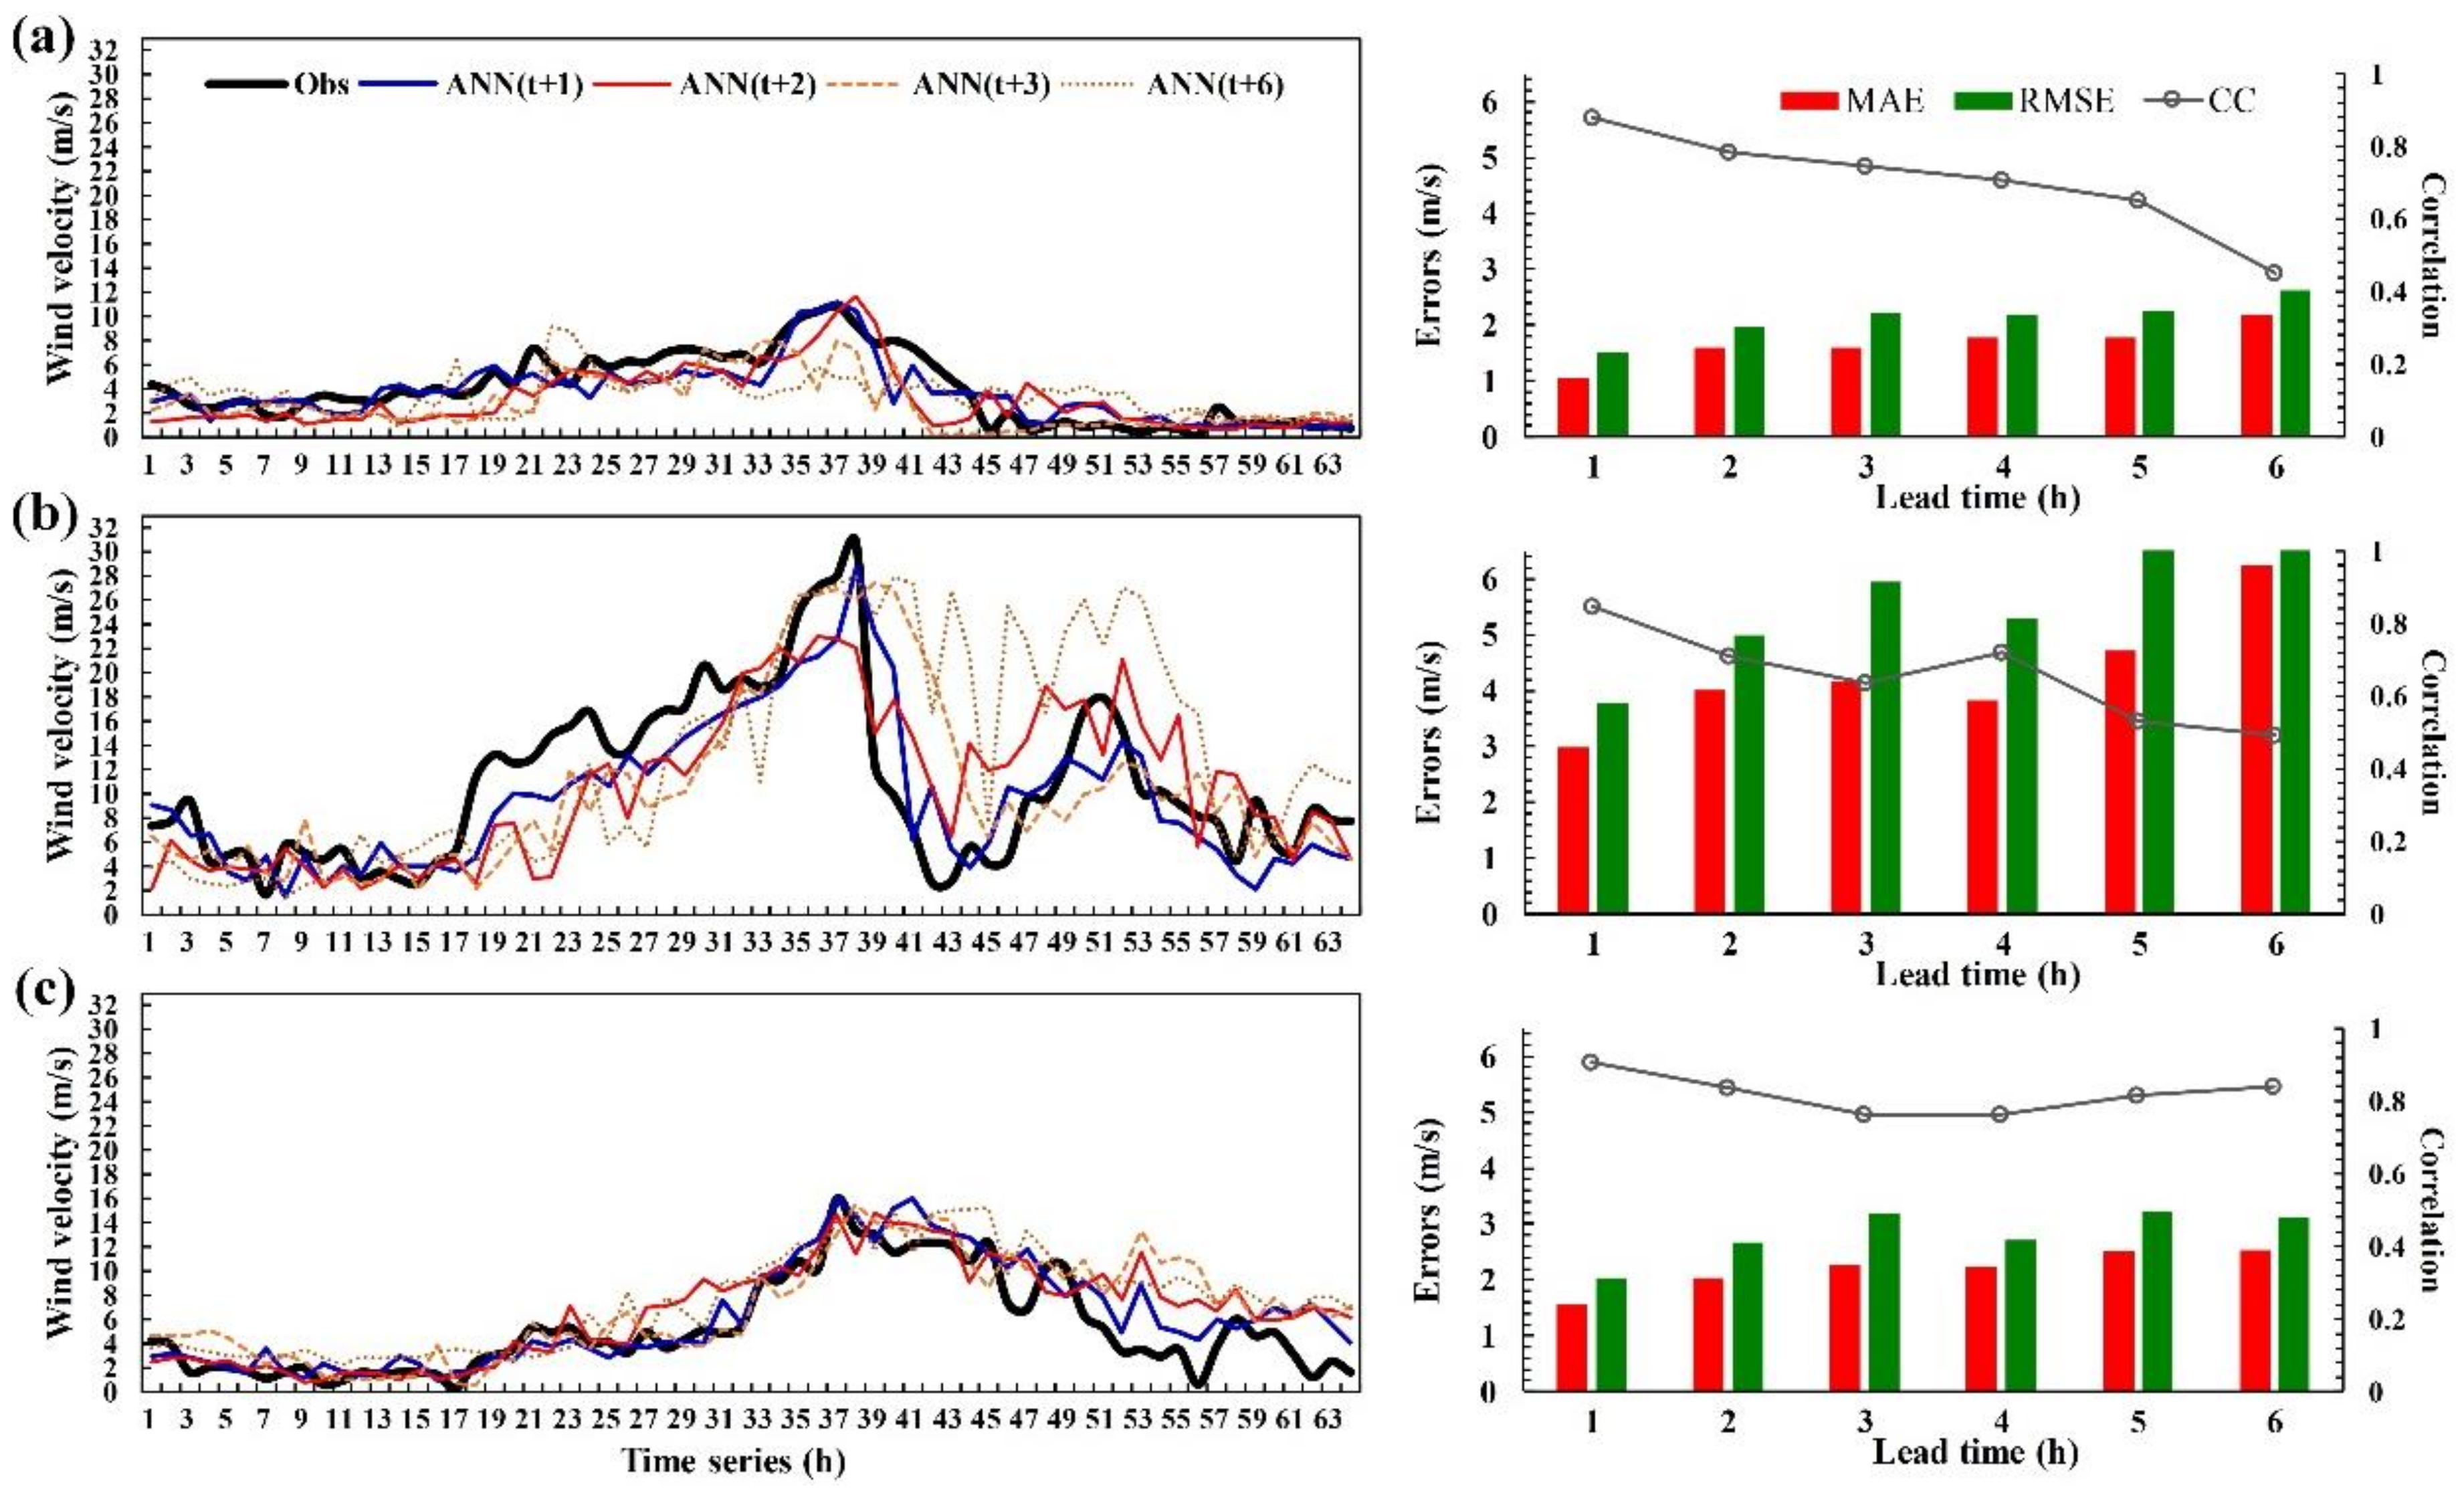
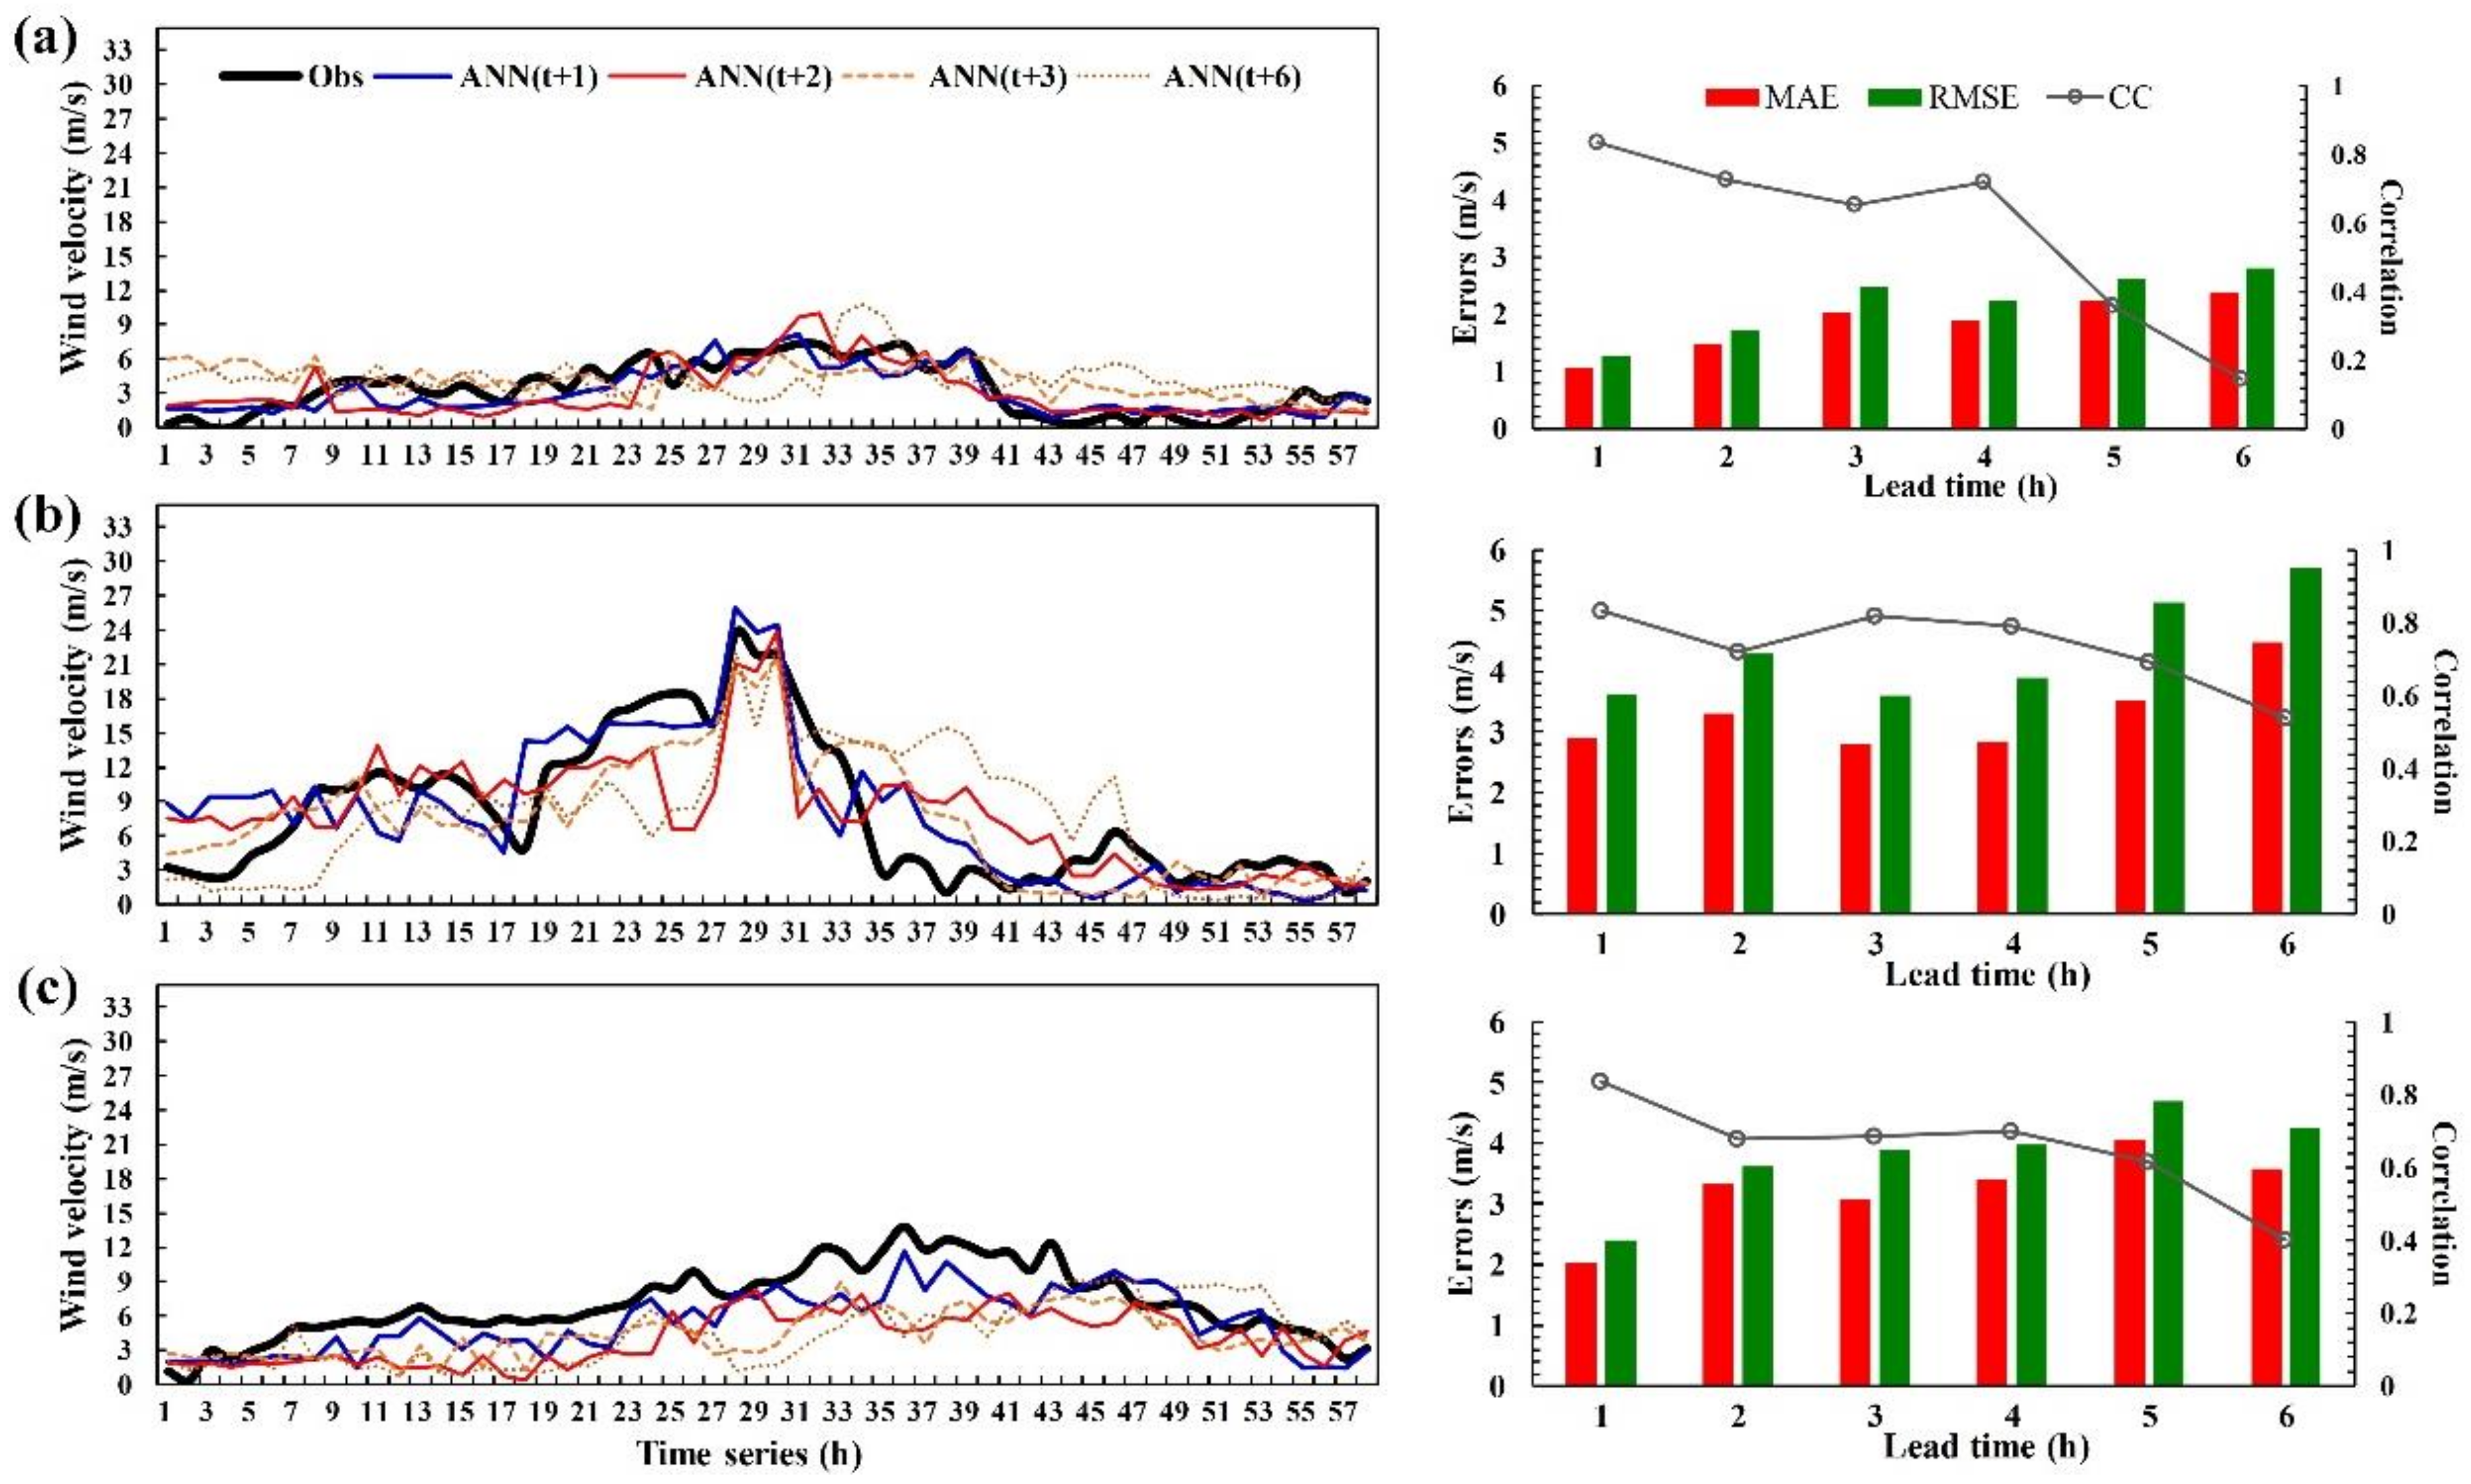
To summarize the previous section, the prediction analysis results for typhoons of various tracks indicated that, as the lead time increased, the errors of the model’s overall prediction value increased. This result reflects that longer prediction time entails greater uncertainty. In addition, among the results of the six test typhoons, the absolute errors of wind speed predictions at Hsinchu Station were generally smaller than those at Wuqi and Kaohsiung Stations. A possible reason is that a typhoon has a counterclockwise current. When it approaches Taiwan from the east, the typhoon current passes over the north end of the CMR, which creates wind from north to south in western Taiwan; thus, wind arriving in Hsinchu Station have undergone a shorter period of disturbance by the terrain. With lower uncertainty, the station produces more favorable wind speed prediction values. In addition, the average wind speed that was recorded at Wuqi Station was generally higher than that at Hsinchu and Kaohsiung Stations, possibly because Wuqi Station was by the sea, and the wind speed was increased by the Venturi effect. The Venturi effect is a phenomenon that describes the air current that enters the narrow Taiwan Strait from the broader East China Sea; due to the reduced cross-sectional area for the air to pass through, the speed of the air current in western Taiwan increases.
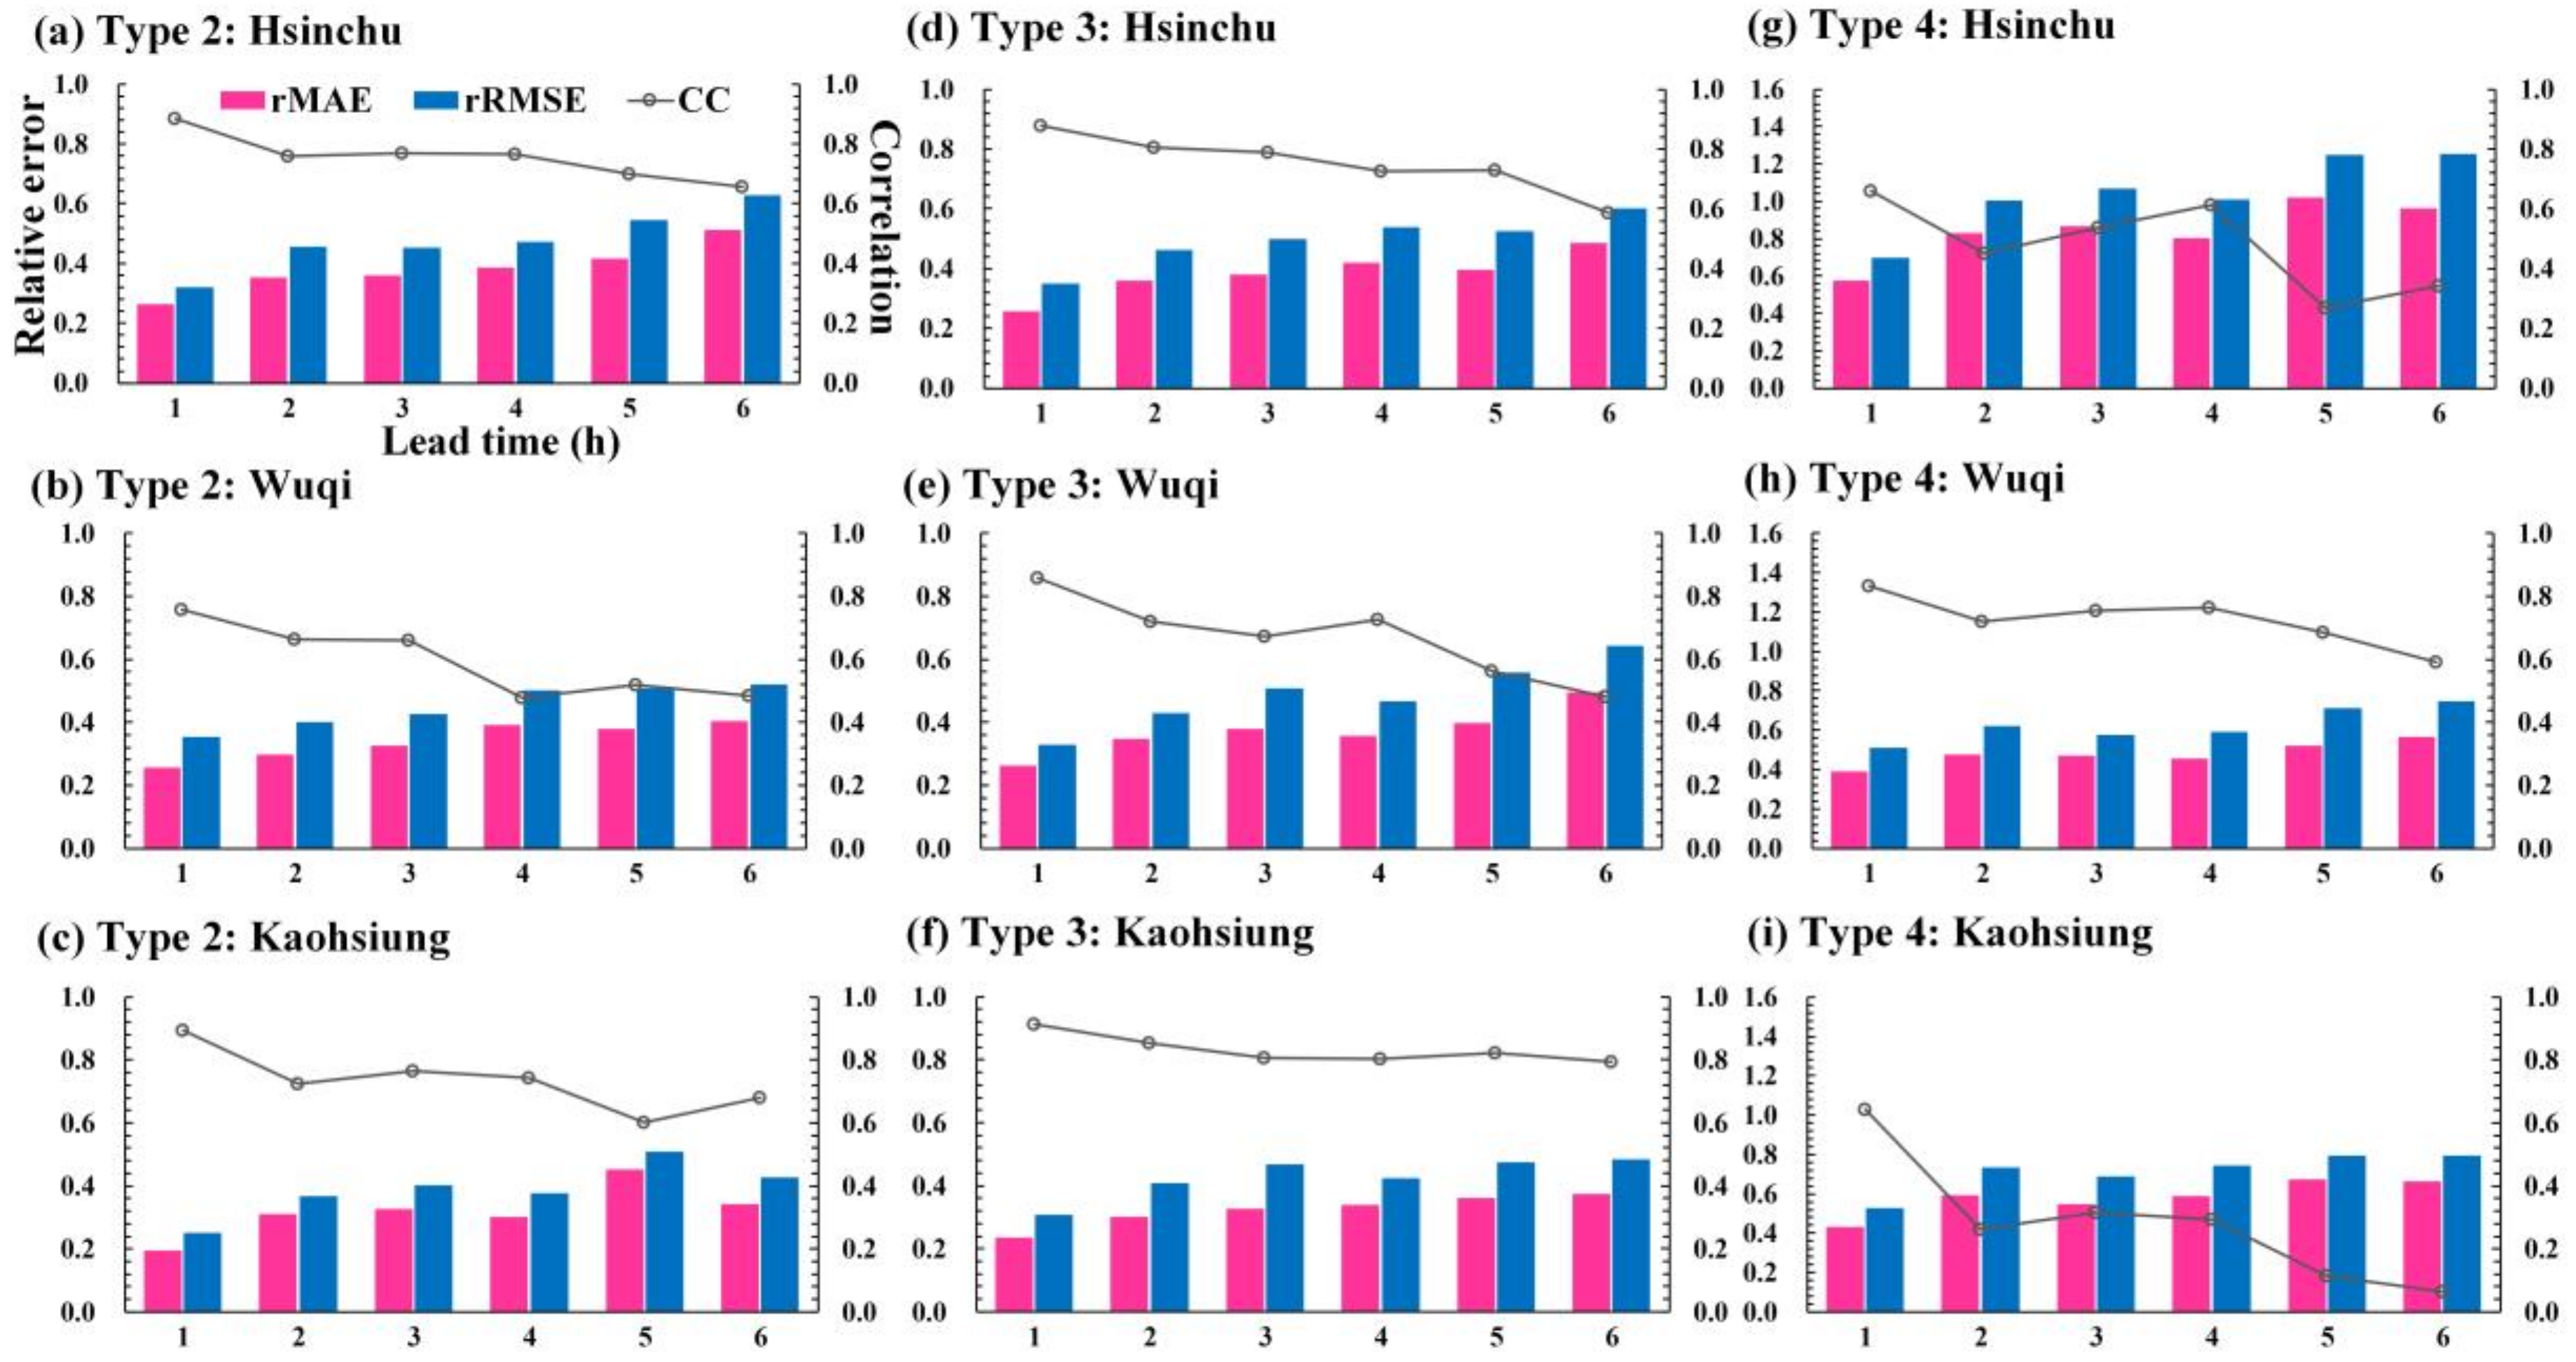
Although absolute errors can reflect the actual error size of wind speed predictions, stations with higher wind speeds naturally generate larger errors. Therefore, to fairly evaluate the relative error rates at each station under various wind speeds, relative errors must be calculated. In the following section, this study adopted Equations (2) and (4) to calculate and discuss the relative errors of rMAE and rRMSE.
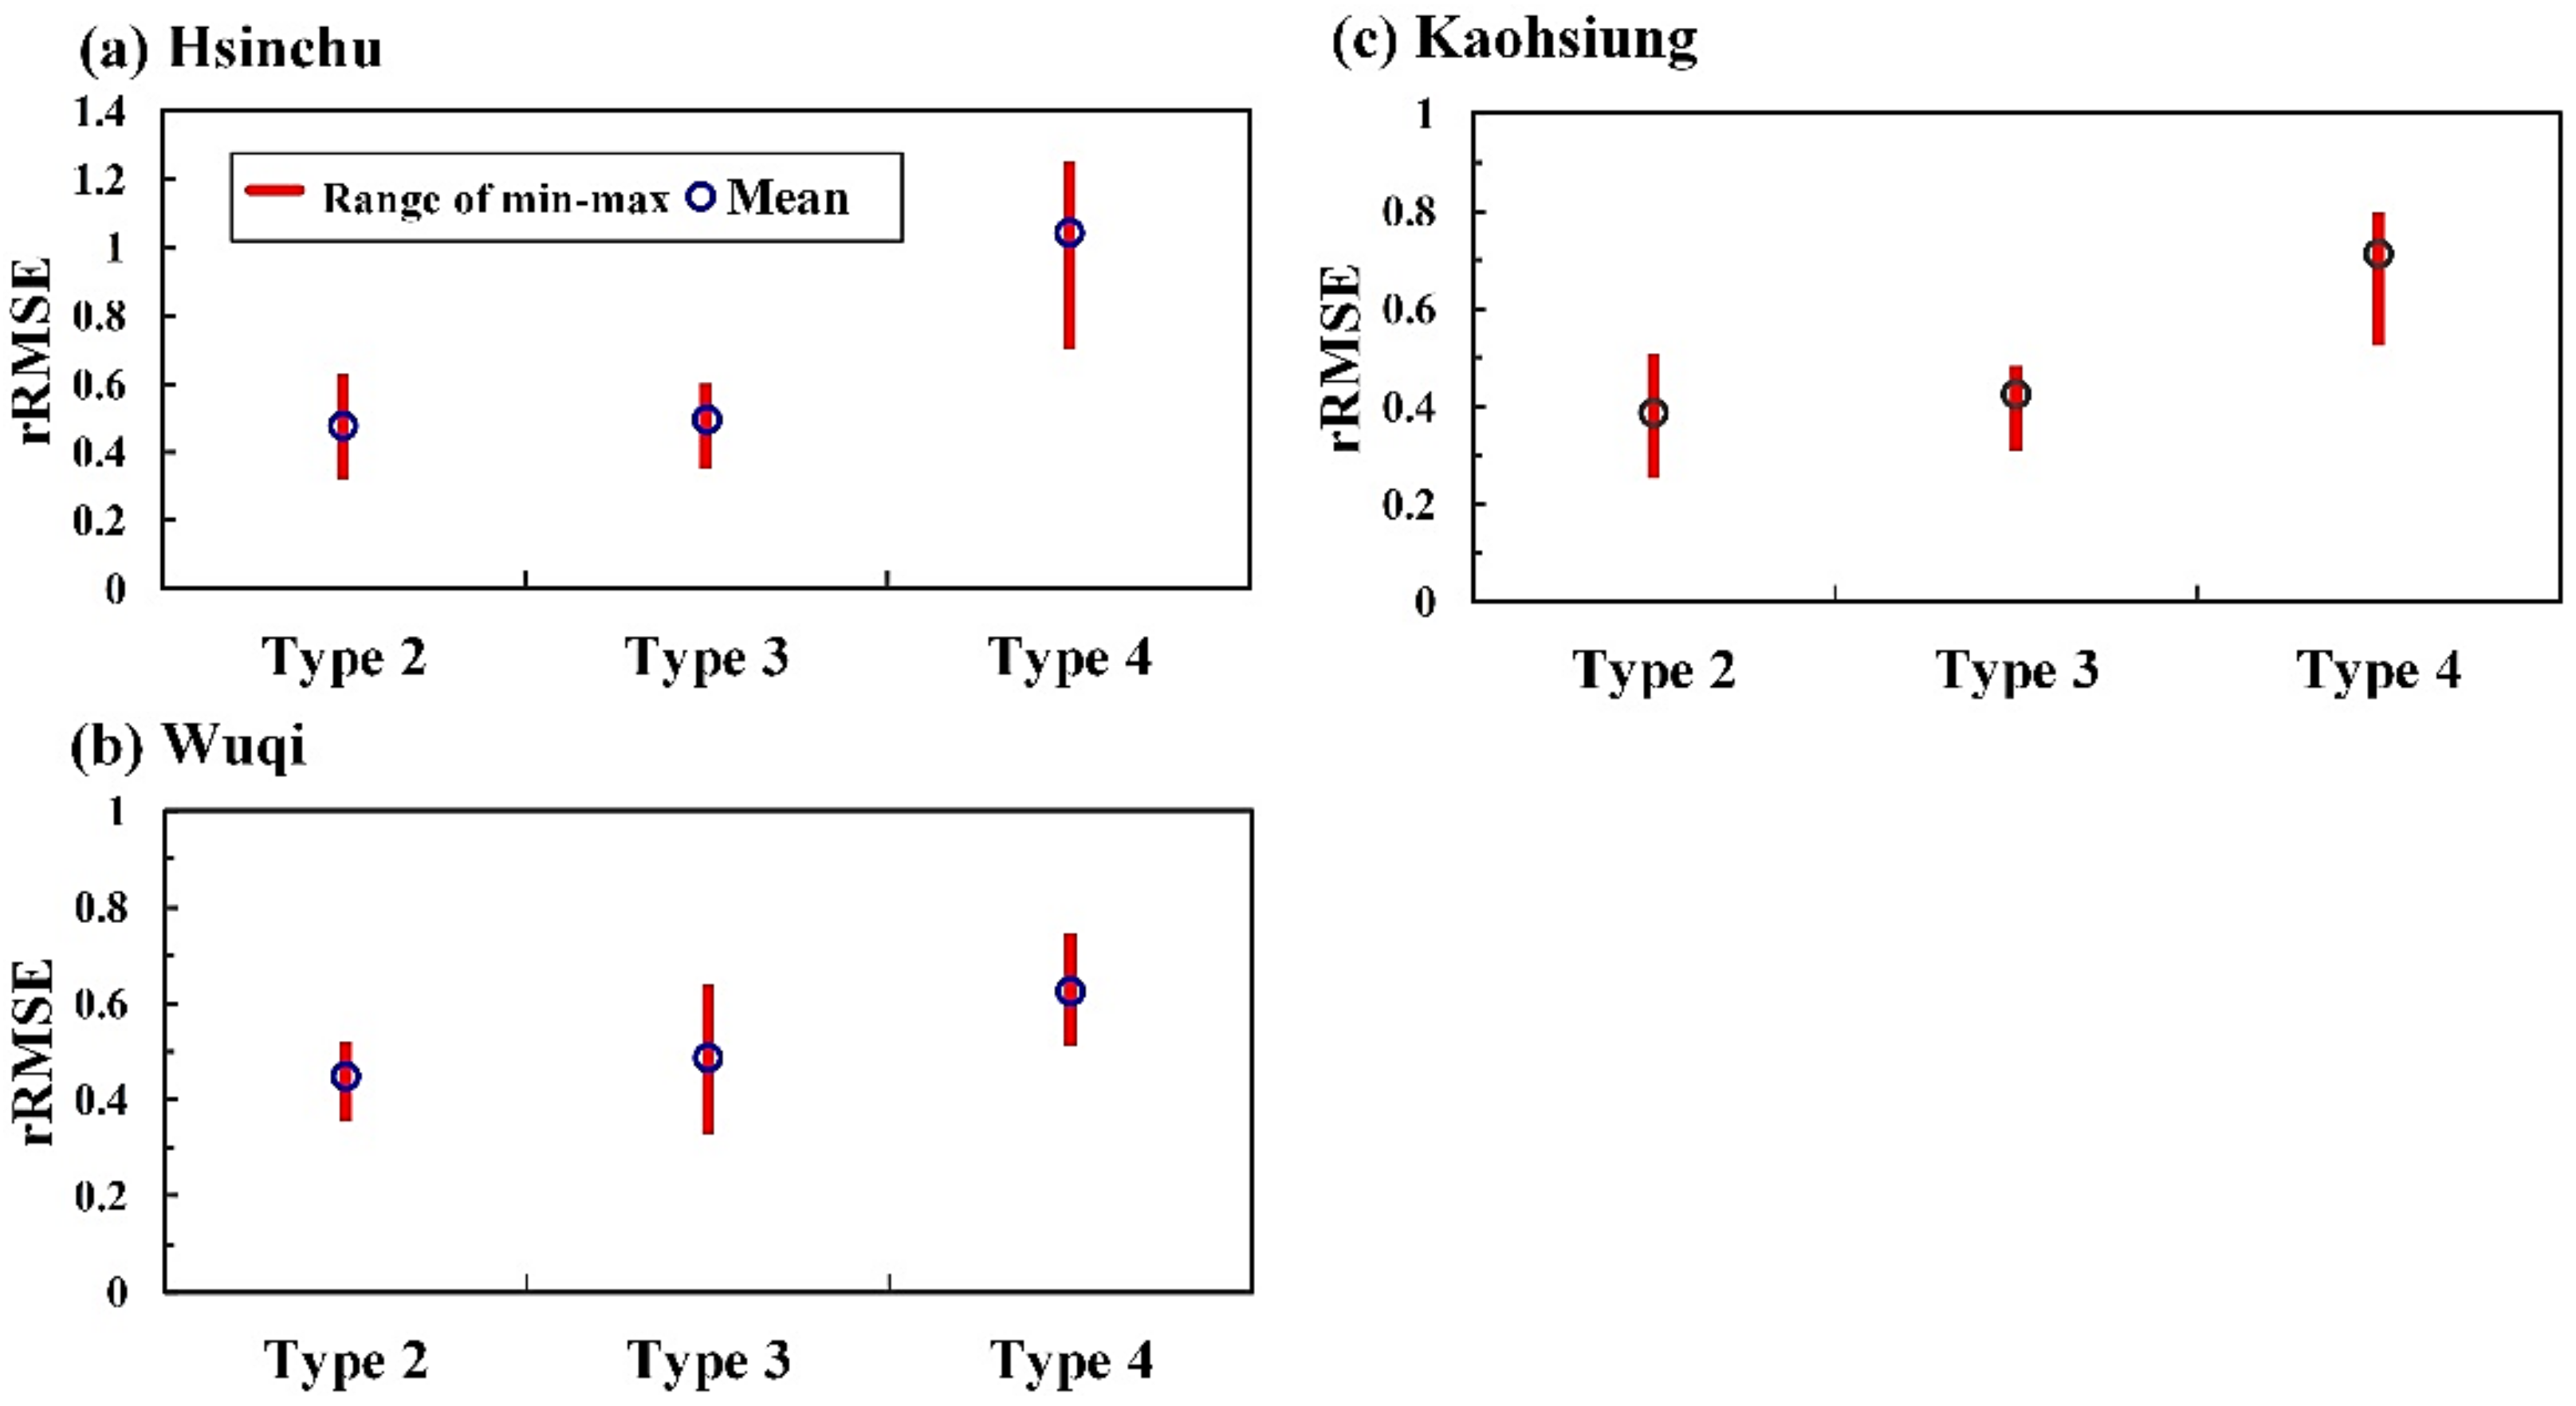
Figure 13 shows the rMAE and rRMSE of each station and each type of typhoon with a lead time of 1- to 6-h.
Figure 14 charts the maximum and minimum values and means of rRMSE with a lead time of 1- to 6-h. The figure shows that at Hsinchu Station, among the rMAEs and rRMSEs for the predicted wind speed of typhoons on three tracks, the wind speed predicted for Type 4 typhoons had larger relative errors, whereas those of Types 2 and 3 indicated smaller relative errors. The reason may be that Type 4 typhoons move further away from Hsinchu; the typhoon center is relatively further south from the station. When the typhoon approaches Taiwan from the east, the wind current takes longer to move from the north end of the CMR to arrive at Hsinchu Station. Under the influence of the terrain for a longer period, more variables are involved and the uncertainty is higher; thus, the estimations that are based on wind field simulations produce larger relative errors.
Moreover, the results from Wuqi Station revealed larger relative errors in wind speed predictions for Type 4 than Types 2 and 3.
Figure 14b reveals that the means of rRMSE for Types 2, 3, and 4 were 0.45, 0.49, and 0.63, respectively. The reason may be similar to that of Hsinchu Station. When a typhoon passes Taiwan on a Type 4 track, its counterclockwise current and central position further south mean that the typhoon circulation must bypass the northern end of the CMR, and subsequently move from northern Taiwan down to the south to affect Wuqi Station. This long period of interacting with the terrain results in high uncertainty; thus, the calculations for a simulated wind field produce larger errors. Similarly, the results from Kaohsiung Station revealed larger errors in wind speed predictions for Type 4 typhoons than Types 2 and 3.
Figure 14c indicates that the means of rRMSE for Types 2, 3, and 4 were 0.39, 0.43, and 0.71, respectively. The reason may be that, when Kaohsiung Station is under the influence of a Type 4 typhoon, the uncertainty factors for that station are more than those for other stations. On this track, when the typhoon gradually approaches Taiwan, its main influence on Kaohsiung Station is similar to that on the other two stations. The interaction time of the typhoon’s air current with the terrain is longer, resulting in greater uncertainty.
5.2. Predictions for Maximum Wind Speed and Time of Occurrence
To evaluate the predictions of maximum wind speeds and the times of occurrence, this study defined two evaluation indices. First, the relative maximal wind error rate (EW
M), which evaluates an average ratio of the maximal wind errors, with lower values being superior, was defined as follows:
where
is the estimated maximal wind at typhoon event
k,
is the observed maximal wind at typhoon event
k, and
n is the total number of typhoon events.
Second, the absolute maximal wind time error (ET
M), which computes the average time of the absolute errors, with lower values being superior, was defined as follows:
where
is the arrival time of estimated maximal wind at event
k, and
is the arrival time of observed maximal wind at event
k.
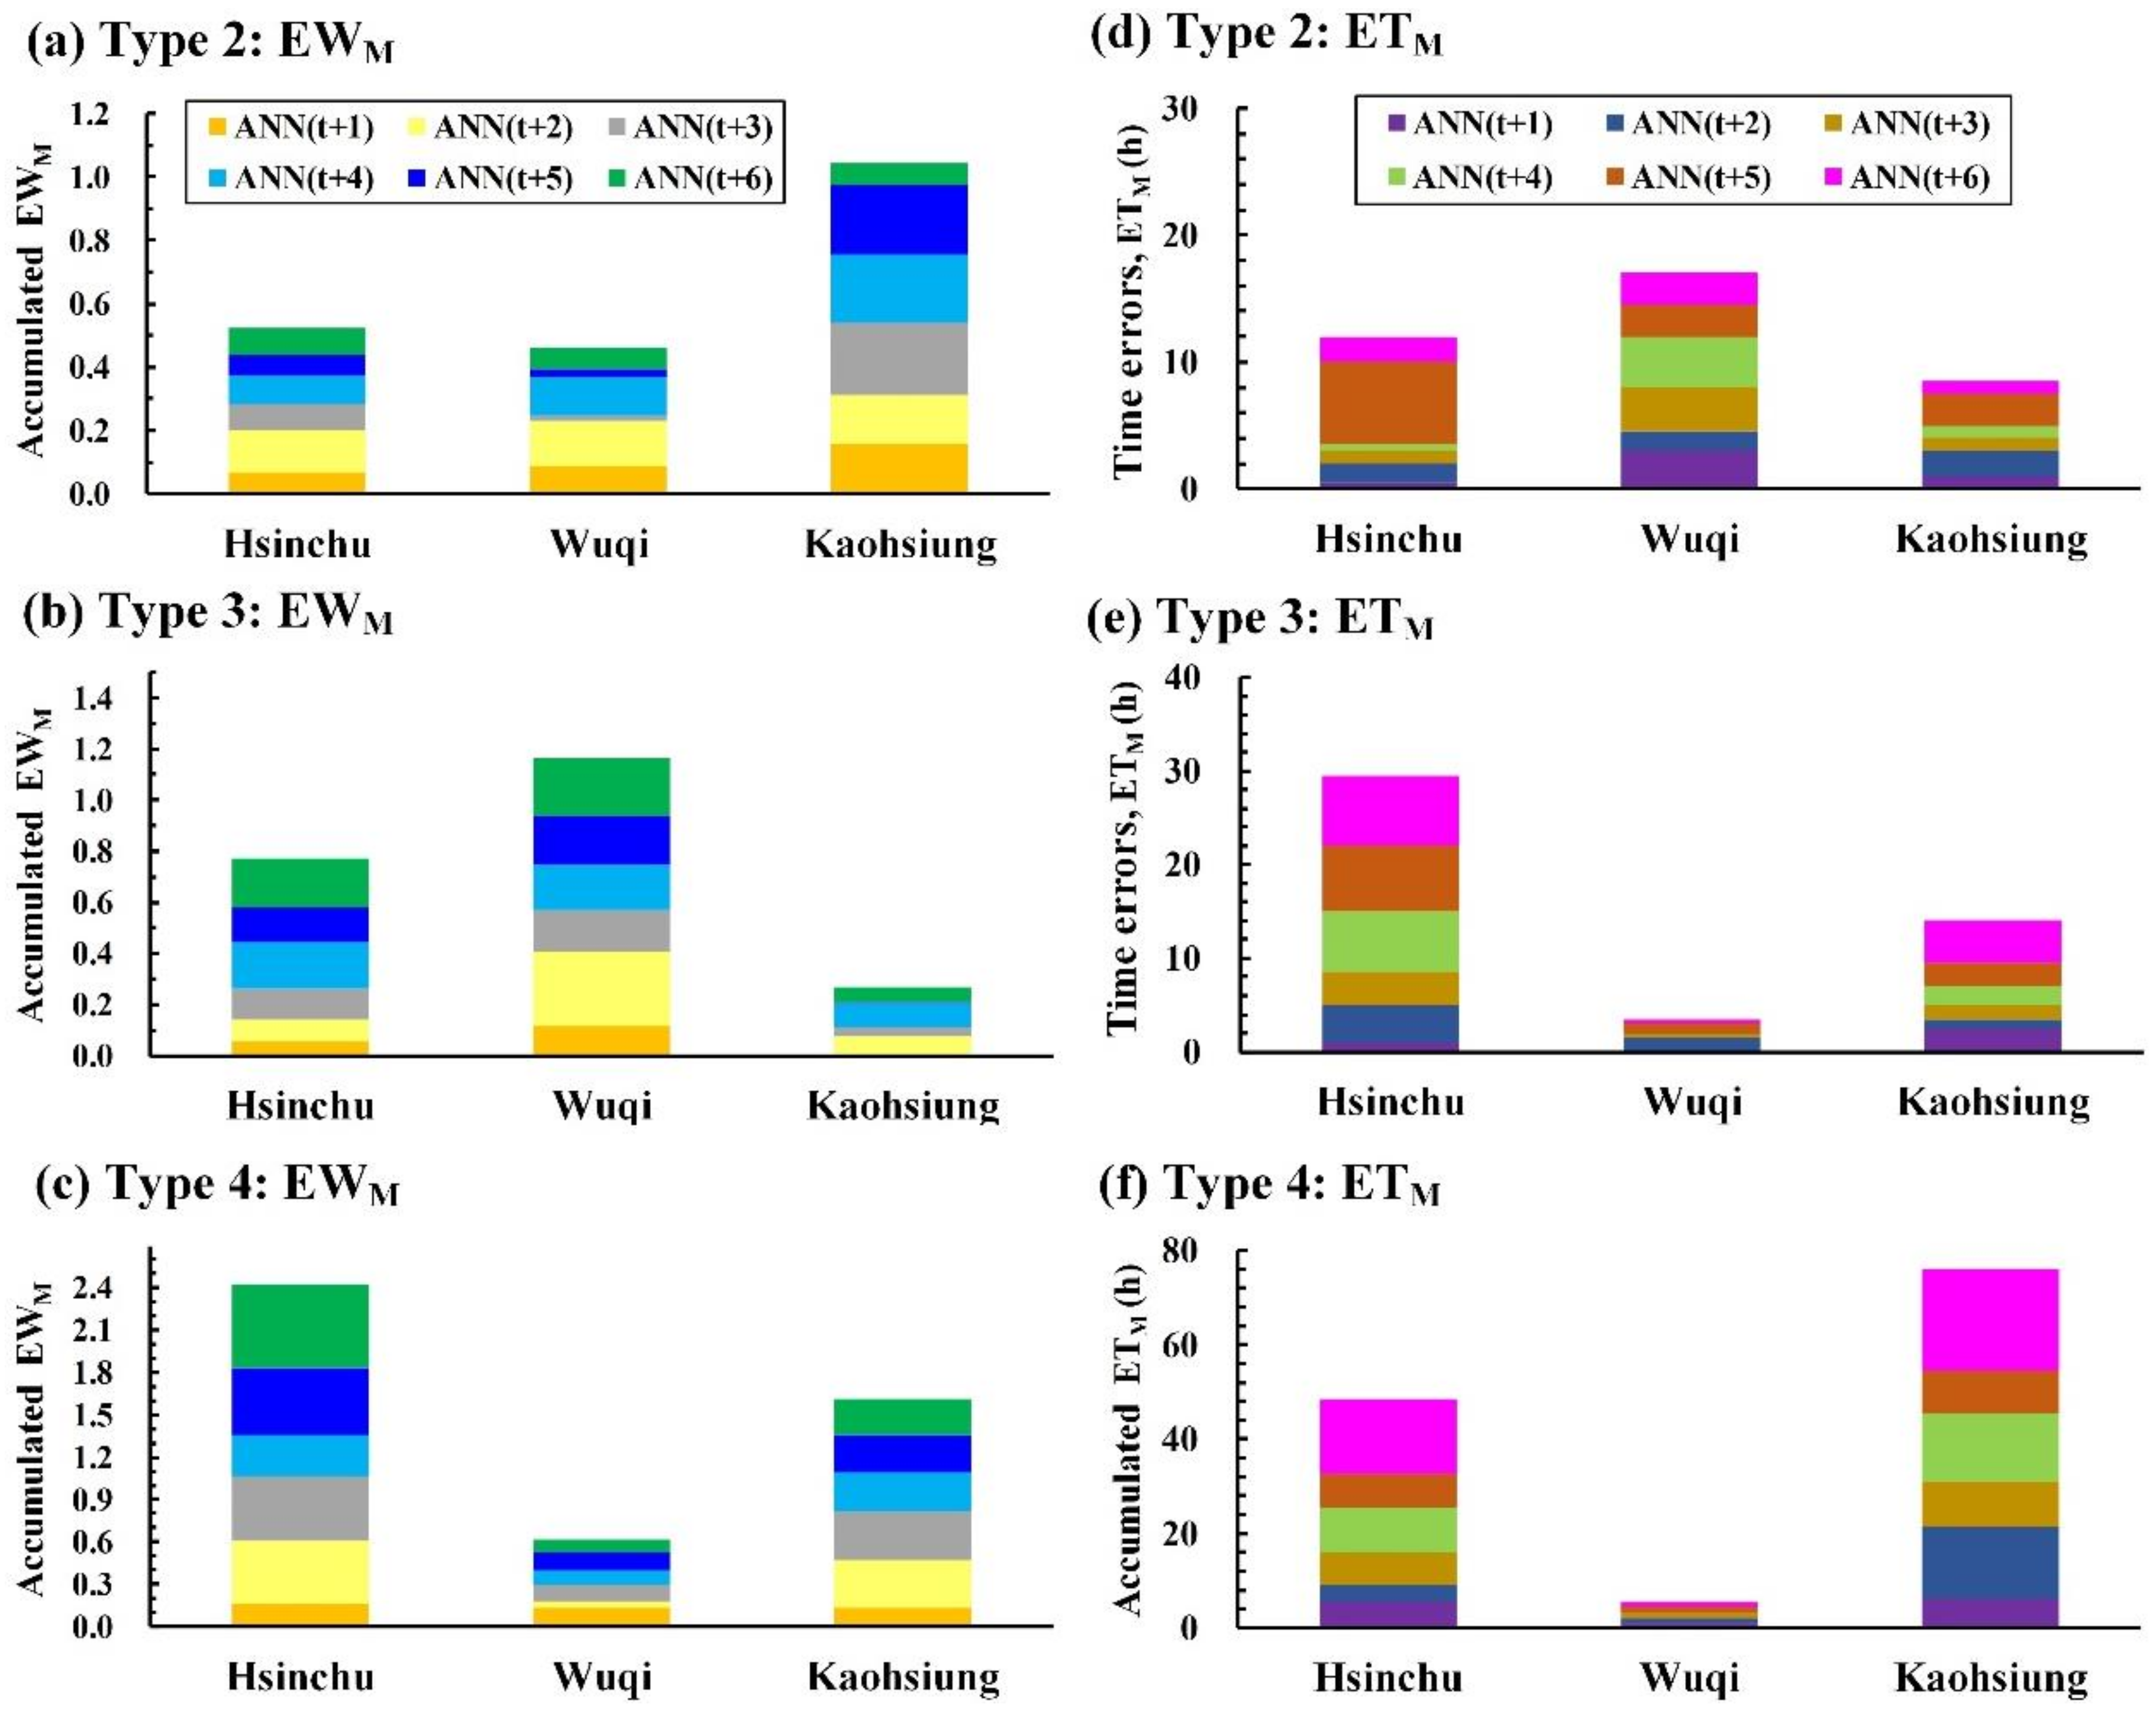
Figure 15a–c present the EW
M of Track Types 2, 3, and 4, respectively. For each track, this study summed the relative error rates with lead times of 1- to 6-h at each station to objectively evaluate their accumulated error rates. The results indicated that, with typhoons on a Type 2 track, Kaohsiung Station accumulated the largest EW
M (1.04), followed by Hsinchu Station (0.52), and then Wuqi Station (0.46). With typhoons on a Type 3 track, Wuqi Station accumulated the largest EW
M (1.17), followed by Hsinchu Station (0.77), and then Kaohsiung Station (0.27). With typhoons on a Type 4 track, Hsinchu Station accumulated the largest EW
M (2.42), followed by Kaohsiung Station (1.61), and then Wuqi Station (0.62).
Figure 15d–f present the ET
M of track Types 2, 3, and 4, respectively. For each track, this study summed the time errors with lead times of 1- to 6-h at each station to objectively evaluate their accumulated time errors. The result indicated that, with typhoons on a Type 2 track, Wuqi Station accumulated the largest ET
M (17 h), followed by Hsinchu Station (12 h), and then Kaohsiung Station (8.5 h). With typhoons on a Type 3 track, Hsinchu Station accumulated the largest ET
M (29.5 h), followed by Kaohsiung Station (14 h), and then Wuqi Station (3.5 h). With typhoons on a Type 4 track, Kaohsiung Station accumulated the largest ET
M (76 h), followed by Hsinchu Station (48.5 h), and then Wuqi Station (5.5 h).
In summary, this study showed that, for typhoons on a Type 4 track, Wuqi Station demonstrated optimal performance in both EWM and ETM; in other words, its prediction results for EWM and ETM were superior to those of other stations. However, with Types 2 and 3 tracks, optimal EWM and ETM values could not be achieved simultaneously. For the evaluation of the performance of individual lead times, EWM and ETM indicated that errors with smaller lead times (e.g., 2 h) might be greater than those with larger lead times (e.g., 6 h). A possible explanation is that, when modeling with the ANN, this study employed the RMSE as an evaluation index, which evaluates the entire typhoon period, unlike the EWM or ETM, which evaluate the specific period in which the maximum wind speed occurred.
5.3. Evaluation of the Chosen Training Set and Testing Set
In this study, data were divided for the training and testing of the models. The last two typhoons were allocated to the testing set, and the remainder were allocated to the training set; however, this method did not account for any of the statistical properties of the data subsets, making it difficult to determine whether the closest model was developed or whether the model performance based on the testing set is representative of the model performance under a range of conditions [
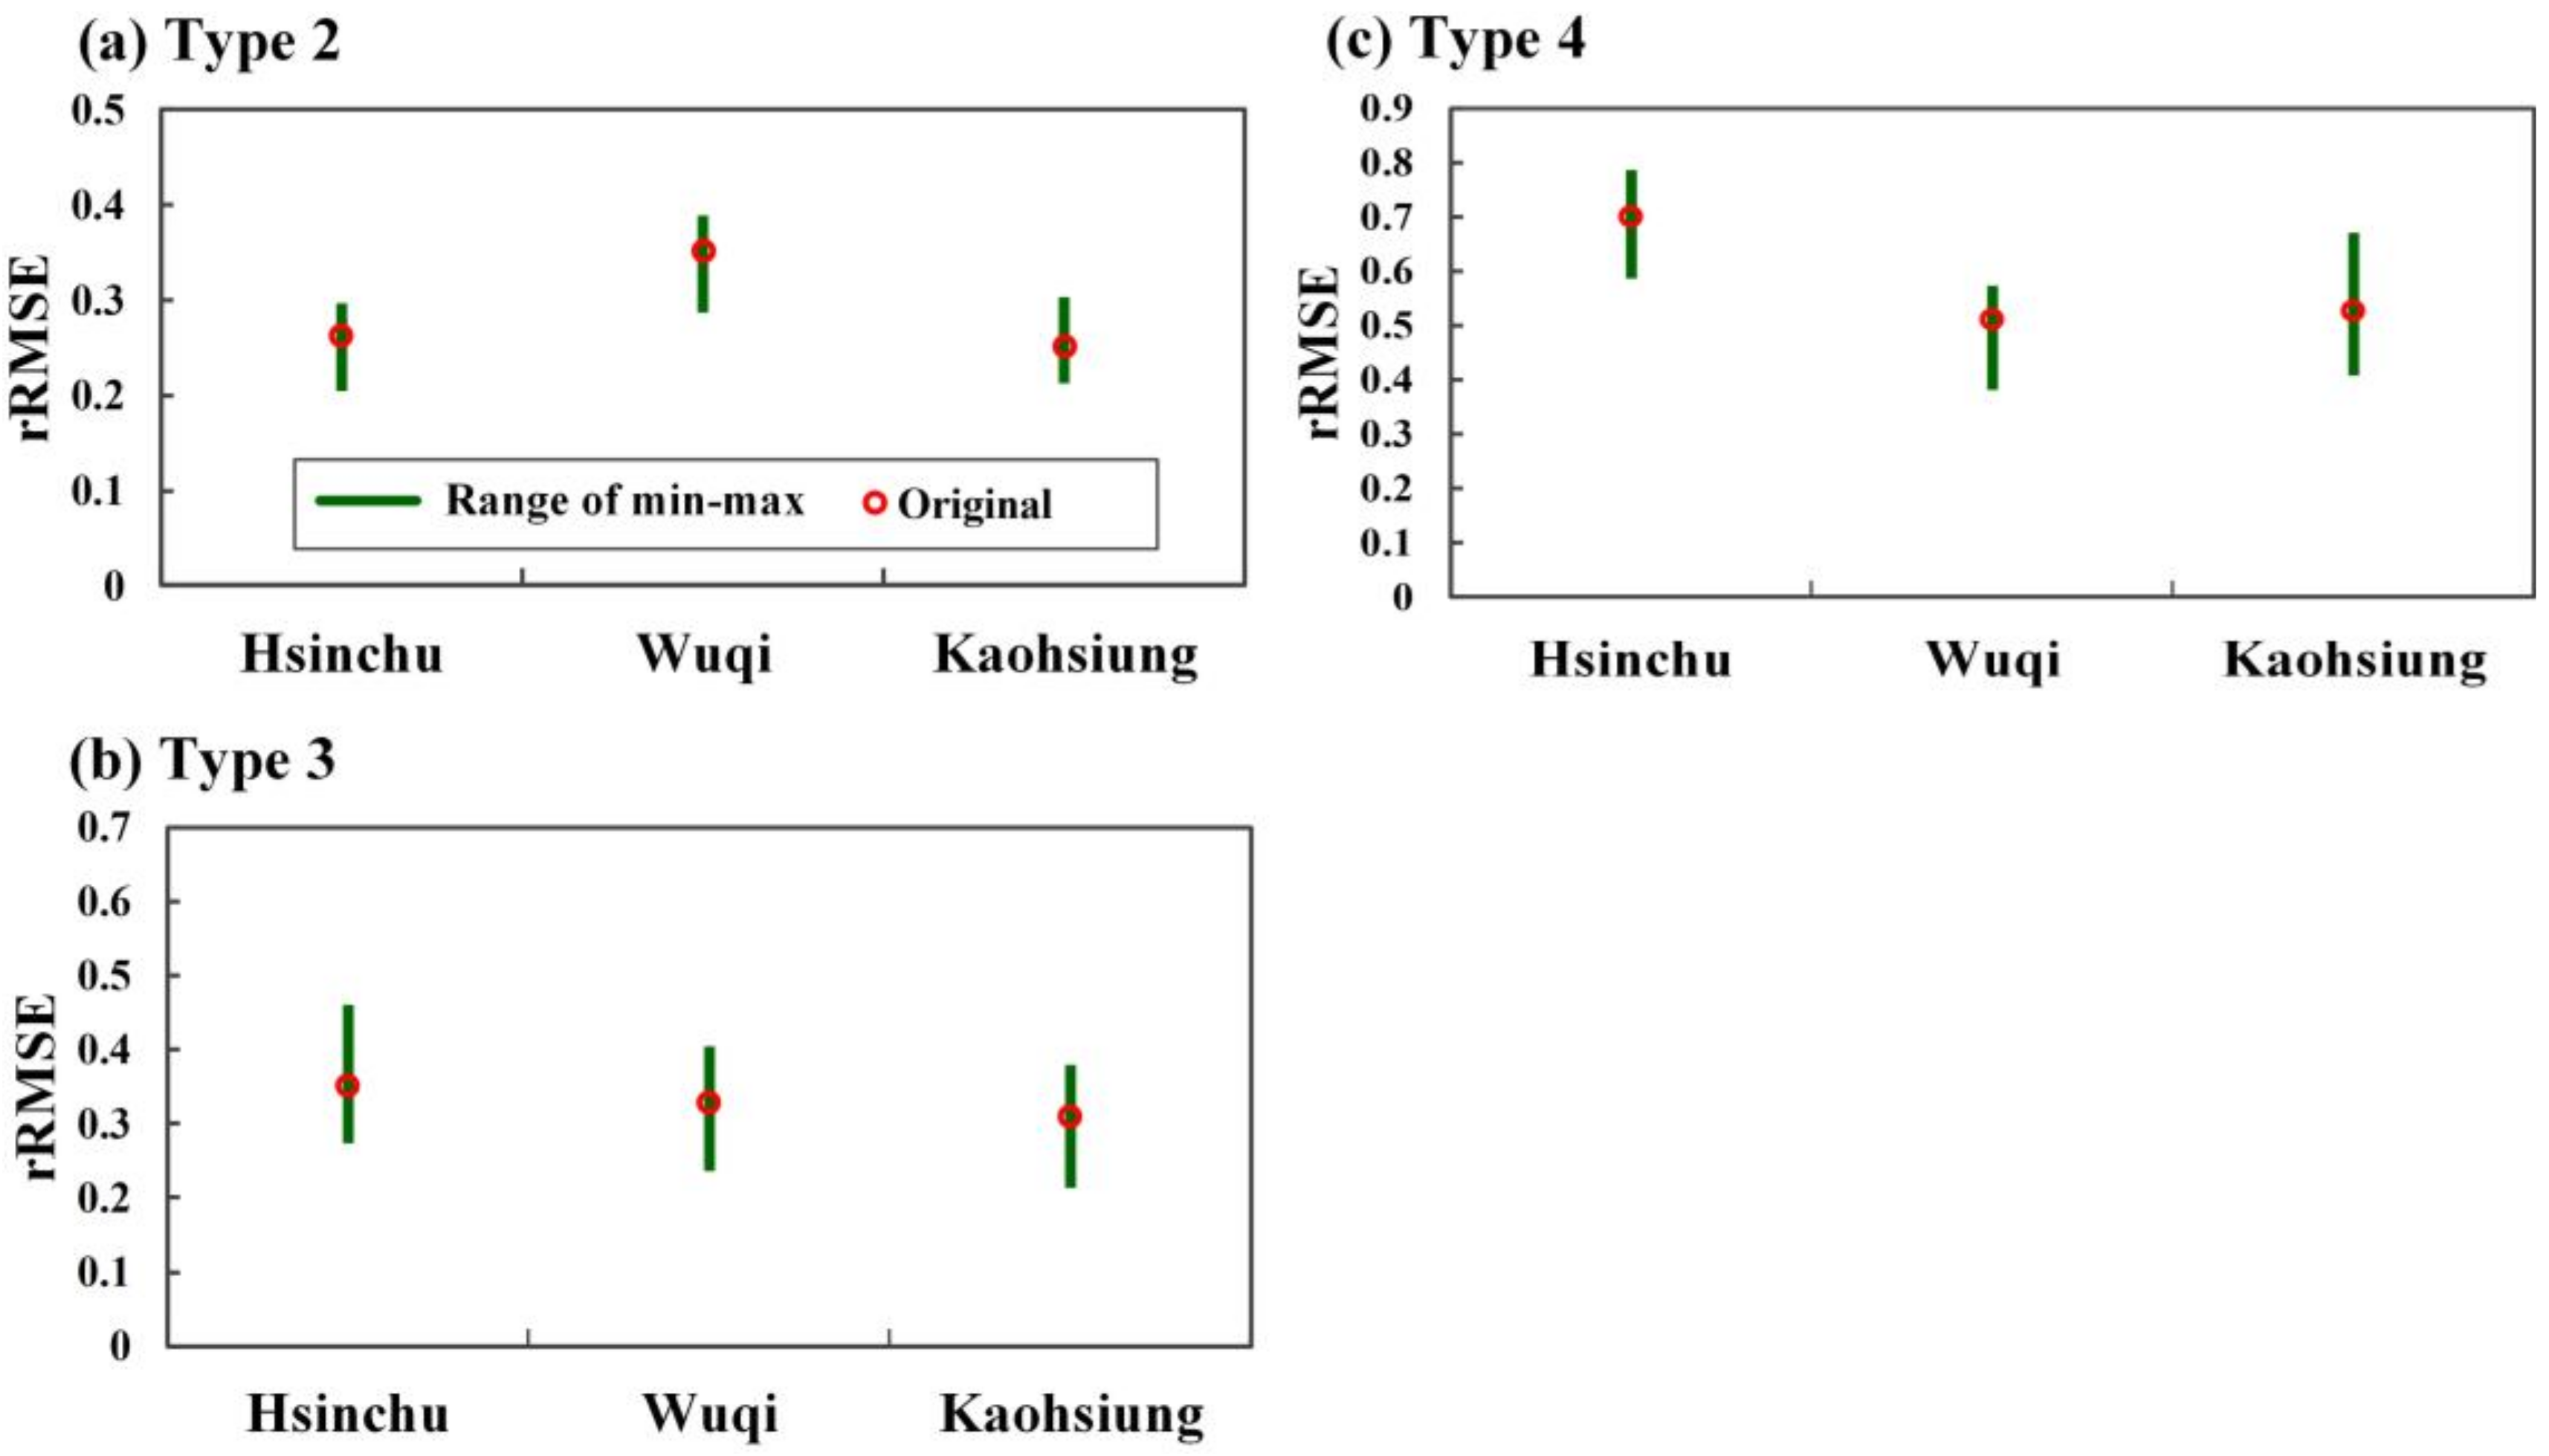
23]. Thus, this study verified whether the data division was reasonable. A cross-validation subsampling approach was employed to evaluate the performance of the models. The entire dataset was randomly partitioned into 10 equal-sized subsets. During each run, one of the partitions was chosen for testing, while the rest were used for training. This procedure was repeated 10 times so that each partition was used for testing exactly once.
Figure 16a–c present the rRMSE of track Types 2, 3, and 4, respectively. For each track, the ranges of rRMSE results of 10-fold cross-validation with a lead time of 1 h at each station are provided (green lines) and the rRMSE results that are obtained using the original data division are indicated (red points). From
Figure 16a, the min–max rRMSE of 10-fold cross-validation in Type 2 was 0.20–0.3, 0.29–0.39, and 0.21–0.30 for Hsinchu, Wuqi, and Kaohsiung, respectively; the findings that were obtained using the original data division were 0.26, 0.35, and 0.25 for Hsinchu, Wuqi, and Kaohsiung, respectively. All of the red points were on the green lines. This implies that the case using the original data division was stable and reasonable when compared with the 10-fold cross-validation. The findings were similar for Types 3 and 4 (
Figure 16b,c).
6. Conclusions
Typhoons endanger Taiwan not only with rainstorms, but, more alarmingly, with strong wind. Because of the north-south CMR that has an average height over 2000 m as well as Taiwan’s geographical location, the tracks of invading typhoons vary greatly, which makes accurately forecasting strong winds in specific places in Taiwan difficult. This study aimed at predicting the wind speed of typhoons; however, because the terrain of high mountains in Taiwan vary greatly, once typhoons of various tracks pass the CMR, their wind speeds become more difficult to predict. Thus, this study developed on-land typhoon wind speed prediction models to provide real-time wind speed prediction information. This research had two primary objectives: (1) to develop data-driven techniques and a powerful ANN model to predict the highly complex nonlinear wind systems in western Taiwan; and, (2) to investigate the accuracy of wind speed predictions at various locations and for various durations in western Taiwan when the track of westward typhoons is affected by the complex geographical shelters and disturbances of the CMR.
Three stations in western Taiwan were considered—Hsinchu Station, Wuqi Station, and Kaohsiung Station—and ANN was employed to construct wind speed prediction models and to evaluate the effects of typhoons on western Taiwan when they approached on various tracks and passed the CMR, and to obtain real-time wind forecasts. Westward typhoons were adopted, as defined by the CWB, from between 2000 and 2016, which covered typhoons with track Types 2, 3, and 4. Data from a total of 28 typhoons during typhoon warning periods were utilized. This study made predictions for wind speed at each station, with lead times of 1- to 6-h, and compared the predictions with actual wind speeds for discussion.
Based on the discussions and results, this study formed the following conclusions:
Regarding the absolute errors of the prediction values from the three stations, Hsinchu Station demonstrated more favorable results in six typhoon simulations than Wuqi or Kaohsiung Stations. A possible reason is that typhoons have a counterclockwise current, and when they approach Taiwan from the east, the typhoon current passes the north end of the CMR and reaches western Taiwan from north to south. Because Hsinchu Station is geographically north of Wuqi and Kaohsiung Stations, it has undergone a shorter duration of terrain disturbance by the time that the typhoon air current arrives. With lower uncertainty, the wind speed can be more easily predicted.
Regarding relative errors at each station from each track, the relative error rate (rMAE and rRMSE) of Hsinchu, Wuqi, and Kaohsiung Stations for typhoons on track Type 4 were larger than those on track Types 2 and 3. A possible reason for why all of the stations demonstrated larger relative errors for typhoons on track Type 4 is that the time that the typhoon circulation interacts with the terrain was longer, making it more difficult for the model to provide a precise simulation.
Regarding maximum wind speed prediction and the time at which it occurred, typhoons on track Types 2, 3, and 4 had EWM performances that were most favorable at Wuqi Station, Kaohsiung Station, and Wuqi Station, respectively; furthermore, for typhoons on track Types 2, 3, and 4, their ETM performances were most favorable at Kaohsiung Station, Wuqi Station, and Wuqi Station, respectively.


