Article

Hazard Quotients, Hazard Indexes, and Cancer Risks of Toxic Metals in PM10 during Firework Displays

1
NIDA Center for Research & Development of Disaster Prevention & Management, School of Social and Environmental Development, National Institute of Development Administration (NIDA), 118 Moo 3, Sereethai Road, Klong-Chan, Bangkapi, Bangkok 10240, Thailand
2
SKLLQG, Institute of Earth Environment, Chinese Academy of Sciences (IEECAS), Xi’an 710075, China
3
Department of Regional Activation, Faculty of Regional Policy, Takasaki City University of Economics, 1300 Kaminamie, Takasaki, Gunma 370-0801, Japan
*
Author to whom correspondence should be addressed.
Atmosphere 2018, 9(4), 144; https://doi.org/10.3390/atmos9040144
Submission received: 19 March 2018 / Revised: 5 April 2018 / Accepted: 6 April 2018 / Published: 12 April 2018
(This article belongs to the Special Issue Urban Particulate Matters: Composition, Sources, and Exposure)

Abstract

:
Bonfire night is a worldwide phenomenon given to numerous annual celebrations characterised by bonfires and fireworks. Since Thailand has no national ambient air quality standards for metal particulates, it is important to investigate the impacts of particulate injections on elevations of air pollutants and the ecological health impacts resulting from firework displays. In this investigation, Pb and Ba were considered potential firework tracers because their concentrations were significantly higher during the episode, and lower than/comparable with minimum detection limits during other periods, indicating that their elevated concentrations were principally due to pyrotechnic displays. Pb/Ca, Pb/Al, Pb/Mg, and Pb/Cu can be used to pin-point emissions from firework displays. Air mass backward trajectories (72 h) from the Hybrid Single-Particle Lagrangian Integrated Trajectory (HYSPLIT) model indicated that areas east and north-east of the study site were the main sources of the airborne particles. Although the combined risk associated with levels of Pb, Cr, Co., Ni, Zn, As, Cd, V, and Mn was far below the standards mentioned in international guidelines, the lifetime cancer risks associated with As and Cr levels exceeded US-EPA guidelines, and may expose inhabitants of surrounding areas of Bangkok to an elevated cancer risk.

Highlights

  • Pyrotechnics emit PM10-bound heavy metals that degrade ambient air quality
  • Pb/Ca, Pb/Al, Pb/Mg, and Pb/Cu ratios can pinpoint emissions from firework displays
  • Pb and Ba are possible tracers, with elevated concentrations during firework displays
  • PM10 metals in ambient air are mainly crustal emissions regardless of firework events
  • Limited combined risk associated with Pb, Cr, Co., Ni, Zn, As, Cd, V, and Mn levels
  • As and Cr levels exceed US-EPA guidelines for lifetime cancer risk

1. Introduction

Over the last few decades there has been increasing interest in the adverse public health impacts of exposure to ambient toxic chemicals, principally in relation to carcinogenicity and mutagenicity [1,2,3,4,5,6,7,8,9,10,11,12,13,14,15,16,17]. Another central concern of ambient air quality studies is the chemical compositions of particular matter elemental compounds. It is important to note that most toxic metals are preferentially present in finer aerosols, since they have lower densities, greater surface area per unit of volume, and greater organic matter content [18,19,20,21]. Recent studies underline the adverse health effects of exposure to particular matter elemental compounds [22,23,24,25]. To the best of our knowledge, there are very few publications on PM10-bound heavy metals in Southeast Asian countries, which have a combined population of 651 million. Consequently, it seems necessary to monitor the levels of such metals in ambient air. Such data would be essential for public administrative bodies, such as the Environmental Protection Agency (EPA) or Pollution Control Department (PCD) to prepare amendments or revisions to air quality standards, as well as to establish baseline data for atmospheric research communities.
Previous studies have highlighted traffic emissions [26,27,28,29], solid waste incinerators [17,30], thermal power plants [31,32,33], industrial boilers [34,35], open burning of e-waste and municipal solid waste [36,37], and forest fires [38,39], as major sources of heavy metals in ambient air. Despite the large number of published studies on the emission sources of selected metals in particulate matter, their behaviours in tropical regions remain unclear, especially in Southeast Asian countries, where few databases of particular matter elemental compounds have been published and made publicly accessible.
During the past few years, several studies have examined the enhanced levels of toxic pollutants in ambient air during firework displays [40,41,42,43,44,45]. The literature also highlights the impacts of firework displays as one of the main contributors of specific metal particulates in ambient air [46,47,48]. Despite several investigations highlighting the importance of traffic emissions as a source of chemical pollutants in Bangkok [8,9,10,13], there is no research on the effects of the “Loy Krathong Festival” (LKF) on the increase of selected metals in ambient air. It is well known that afirework display can significantly enhance the level of selected metals in ambient particles [41,42,43,44,45]. Hence, it is evident that more field research is required to elucidate the influences of firework displays on selected metal profiles. The main goals of this study are to: (i) compare selected metal profiles before and after firework displays; (ii) investigate the influences of firework displays on the behaviours of selected PM10-bound metals; and (iii) calculate hazard quotients, hazard indexes, and cancer risks associated with toxic metals in PM10 before and after bonfire night episodes in metropolitanBangkok.

2. Materials & Methods

2.1. Air Quality Observation Sites

This study examined the impacts of fireworks displays on ambient air quality in Bangkok according to the mass concentrations of PM10 and their chemical characteristics, including selected metals. Data on ambient air quality were collected from four Pollution Control Department (PCD) Air Quality Observatory Sites, namely MBK (MBKOS), Ramkamhaeng (RKOS), Land Development Department (LDDOS) and Victory Monument Observatory Site (VMOS), which were carefully chosen for the assessment of selected metals in PM10. The positions of air quality monitoring sites in relation to a public firework display platform are illustrated in Figure 1. Bangkok has a tropical climate, with stifling hot temperatures (i.e., from March to June), high humidity (i.e., rainy season from July to October) and influences from the South Asian monsoon system. Precipitation differs greatly during the year, with between 180 mm to 220 mm of rain during the summer and the beginning of autumn, and only 10 mm of rain during the winter months.
Intensive monitoring campaigns were performed consecutively, before and after the bonfire night event during LKF, Father’s Day (5th of December), and New Year’s Eve celebrations from 2012 to 2013, forming a database of 62 individual PM10 samples (50 collected before, and 12 after the firework display). In addition, it is important to note that firework display period (FDP) and non-firework display period (NDP) stand for “Firework Display Period” and “Non-firework Display Period”, respectively.
High-volume air samplers (TE-6001; Graseby-Andersen, Atlanta, GA, USA) were used to obtain unmanned 24 h samples for PM10 at the four sampling sites, yielding volumes of approximately 1632 m3 for each 24 h sample. PM10 were collected on 20 × 25 cm Whatman glass fibre filters (GFFs) at a flow rate of approximately 1.133 m3 min−1 (i.e., 40 cfm): Sample air flow rate was calibrated for standard temperature and pressure conditions. A more comprehensive explanation of the air sampling method was given in “Compendium Method IO-2.2. Sampling of Ambient Air for PM10 using an Andersen Dichotomous Sampler” [49].

2.2. Chemical Analysis of Selected Metals

Chemical preparations, coupled with analytical instrument optimisation, were comprehensively described in earlier reports [50,51]. In summary, PM10 filters were positioned in PTFE vessels and digested in a mixture of 2 mL hydrofluoric acid (50% atomic absorption spectrometry grade; Kanto Chemical Co., Inc., Tokyo, Japan), 3 mL nitric acid (60% electronic laboratory grade; Kanto Chemical Co., Inc., Tokyo, Japan), and 1 mL hydrogen peroxide (30% atomic absorption spectrometry grade; Kanto Chemical Co., Inc., Tokyo, Japan) in a microwave digestion system (Anton Parr GmbH, Graz, Austria). The microwave oven was operated at 700 W for 10 min, and 1000 W for a further 10 min. Hydrofluoric acid was evaporated by heating the sample solutions at 200 °C on a hot plate. The digested solutions were further diluted with 0.1 mol L−1 nitric acid (prepared from 60% nitric acid) was the added to obtain a 50 mL sample. The concentrations of 31 selected metals (Li, Be, Na, Mg, Al, K, Ca, Sc, V, Cr, Mn, Fe, Co., Ni, Cu, Zn, As, Se, Rb, Sr, Y, Zr, Mo, Cd, Sn, Sb, Cs, Ba, Tl, Pb, and Bi) were determined by inductively coupled plasma mass spectrometry (Agilent 7500cx; Agilent Technologies, Inc., Santa Clara, CA, USA). All the chemical analytical processes were verified using Standard Reference Material (SRM) 1648 (i.e., urban particulate matter) provided by the US National Institute of Standards and Technology (NIST). The analytical results showed good agreement with the certified or reference values. The instrumental detection limits of the 31 selected metals are displayed in Table S1 (see Supplementary Material).

2.3. Health Risk Assessment of Selected Metals

Concentration and time are frequently used to depict exposure, where amount/mass characterises dose, and the time parameter allows calculation of the dose rate. In order to evaluate the health threats associated with PM10, the average exposure to selected metals by inhalation (Dinh) for both children and adults, based on individual’s body weight during a given period, is computed using Equation (1) [46,52,53]:
D i n h = C × I n h R × E F q × E D B W × A T
where Dinh is exposure by respiratory inhalation (mg kg−1 day−1); InhR is inhalation rate (7.6 and 20 m3 day−1 for children (InhRchild) and adults (InhRadult), respectively); EFq is exposure frequency (day year−1); ED is exposure duration (6 years for children (EDchild), 24 years for adults (EDadult), respectively); BW is average body weight (15 kg for children (BWchild), 70 kg for adults (BWadult)); AT is the averaging time (for non-cancer toxic risks, AT (days) = ED × 365; for cancer risks, AT (days) = 70 × 365); C is exposure-point concentration, which is calculated by the upper limit of the 95% confidence interval for the mean (mg m−3). In this study, the lifetime average daily dose (LADD) of selected metals through inhalation is employed for evaluating health risk, as described in Equation (2).
L A D D = C × E F q A T = ( I n h R c h i l d × E D c h i l d B W c h i l d + I n h R a d u l t × E D a d u l t B W a d u l t )
It is also important to introduce the concept of a hazard quotient. Theoretically, a hazard quotient (HQ) is the ratio of the potential exposure to a selected metal, relative to the level at which no adverse effects are expected. After Dinh is computed, HQ can be obtained using Equations (3) and (4):
H Q = D i n h R f D
H I = H Q i
RfD is the reference dose (mg kg−1 day−1). Hazard Index (HI) is calculated by summing the individual HQs to assess the total health risks of all selected target metals. RfD values from Feng et al. (2016) [46] were used for Pb (3.52 × 10⁻³), Cr (2.86 × 10⁻⁵), Co. (5.71 × 10⁻⁶), Ni (2.06 × 10⁻²), Zn (3.01 × 10⁻¹), As (3.01 × 10⁻⁴), Cd (1 × 10⁻³), V (7 × 10⁻³), and Mn (1.4 × 10⁻⁵). If the calculated HQ is < 1, then no adverse health effects are expected because of exposure. Conversely, if HQ is >1, then negative health impacts are possible.
Cancer risk of total elements (Rt) and cancer risk of certain element (Re) are computed using Equations (5) and (6):
R e = L A D D × S F a
R t = R
where SFa is a slope factor (mg kg−1 day−1). The SFa values used for Cr, Co., Ni, As, and Cd are 42, 9.8, 0.84, 15.1, and 6.4, respectively [46].

2.4. Enrichment Factors of Selected Metals

During the past few decades, enrichment factor (EF) has been comprehensively adopted to evaluate the influences of vehicular exhausts, industrial emissions, and mining coupled with ore processing, on atmospheric metals [54,55,56]. Despite some uncertainties regarding the selection criteria for the reference elements, Al, Fe, and Si are regularly employed for EF computations [57]. In this investigation, Fe was selected as a reference element, presuming the subtle influences of contaminated Fe and the upper continental crustal composition provided by Rudnick (2003) [58]. The EF of an element E in a PM10 sample can be explained as
E F = ( E / R ) A i r ( E / R ) C r u s t
where R is a reference element. In the case of EF values close to one, the crust can be considered as the main contributor. Additionally, SPSS (version 13) was adopted for Pearson correlation analysis (SLRA) and t-tests.

2.5. Estimation of Mineral Matter in PM10

The evaluation of mineral matter (MIN) in PM10 was conducted using the common oxides of Ti, Al, Mn, Mg, Ca, Na, K, and Fe, which were summed (represented as MIN) and then subsequently computed using Equation (8) [46,59,60].
M I N = 1.89 × A l + 1.59 × M n + 1.67 × M g + 1.95 × C a + 1.35 × N a + 1.21 × K + 1.43 × F e
It is important to note that trace elements (TE) is the sum of all other metals except the above elements in MIN, as shown in Equation (9).
T E = L i + B e + S c + V + C r + C o + N i + C u + Z n + A s + S e + R b + S r + Y + Z r + M o + C d + S n + S b + C s + B a + T l + P b + B i
For Ca, a factor of 1.95 is adopted herein because of the presence of CaO and CaCO3.

2.6. Back Trajectory Analysis

Backward trajectories, starting from each receptor site, were calculated using the HYSPLIT_4 (Hybrid Single-Particle Lagrangian Integrated Trajectory) Model with GDAS (Global Data Analysis System) one-degree gridded meteorological dataset [61]. The 72-h backward trajectories with 6 h temporal resolutions were computed at starting time of 02:00 UTC (local time in Thailand is UTC + 7 h) on each sampling day. Since back trajectories are sensitive to differences in starting height [62], the trajectories were tested starting from multiple heights of 1000 m, 1500 m, and 2000 m above sea level to confirm the uncertainty due to the inadequate spatial and/or temporal resolution of the input data.

3. Results and Discussion

Table 1 shows the statistical descriptions of selected PM10-bound metals, as well as the t-test analysis during the FDP and NDP, as mentioned previously in Section 2.1. The arithmetic means of the 31 selected metal particulate contents ranged from 0.061 ± 0.0086 ng m−3 (Be) to 2096 ± 548 ng m−3 (Ca) for FDP, and from 0.062 ± 0.017 ng m−3 to 2794 ± 929 ng m−3 (Ca) for NDP (see Table 1). Of the 31 selected metals, although seven (Al, Ca, Sc, Cr, Y, Ba, and Pb) showed significant variations (p < 0.05) in mean concentrations between FDP and NDP (see Table 1), only two of those (Ba and Pb) represented significant increases. These findings were in good agreement with previous studies highlighting that Ba and Pb can be considered as firework tracers [47,63,64]. The fact that some earlier studies highlight Sr [63,64], Mg and K [47,63], and K, Ba, Sr, Cd, S, and P [63] as firework tracers may simply reflect the complexity of metal salts generally employed to generate colours in firework displays, which include SrCO3 (red), CaCl2 (orange), NaNO3 (yellow), BaCl2 (green), copper CuCl2 (blue), and a mixture of metal salts including Sr and Cu (purple). It is also crucial to note that the fact that other elements previously used as firework tracers were lower during FDP can be explained by overwhelming contributions of traffic emissions during the observatory period. For instance, Rb and K (water-soluble fractions) were often identified as representative source tracers of biomass burning; in several studies it is reported that Rb, Bi, Sr and Mg concentrations reflected the contribution of fireworks [65,66]. In fact it is worthy of note that Bi, K, Sr, Ga, Ti, Mg, Cu, Al, Na, S, V, Cl and Ba are elements typically emitted during pyrotechnic displays: Na and K are used as metal oxidizers, Al (white, silver), Mg (white, silver), Cu (blue), Ba (green as chlorates, white as carbonates and nitrates), Sr (red), Na (yellow) and Ti (silver) are color and sparkle emitters, S is used as propellant [67,68,69,70]. Furthermore, even though the fizzling and crackling sound effects of the fireworks were originally achieved by using Pb tetroxide components, nowadays, due to the toxicity of Pb compounds, Bi trioxide and Bi subcarbonate, mixed with Al and Mg are mostly used [70,71]. The fact that Pb and Ba showed significant enhancement coupled with significant variations for Al, Ca, Sc, Cr and Y can be ascribed to several factors. A previous study indicated that heavy-duty vehicles are stronger emitters of Ba and Sb—but not of Cu—than light duty vehicles. Since the number of heavy-duty vehicles in Bangkok decreased dramatically as a result of air pollution control policy, it appears rational to interpret the significantly higher Ba detected during FDP as being relatively low Ba emissions from non-heavy-duty vehicles observed in NDP. Furthermore, it is well known that gasohol (i.e., a mixture of ethanol and gasoline) is a widely used fuel in Thailand nowadays, and thus is responsible for the withdrawal of tetraethyl lead from petrol. Therefore, it seems reasonable to conclude that the significantly higher levels of Pb observed during FDP are the result of firework particle injections coupled with comparatively low Pb emissions from vehicle fleet. In addition, the significantly higher contents of Al, Ca, Sc, Cr and Y observed in NDP can simply explained as a overwhelming contribution triggered by firework display over these five selected metals.
It is well known that selected metals can be categorised into two clusters: crustal metals (including Al, Ca, Fe, Mg, K, and Na), which could be principally attributed to high loading of crustal dust; and anthropogenic metals (such as Zn, As, Pb, V, Ti, Cr, Mn, Ni, Sr, Cu, Li, Cd, and Co.), which originate from human activities (e.g., traffic exhaust, industrial emissions, burning of fossil fuels) [72]. It is also crucial to note that Na, Cl, Br can be categorized as sea-salt particles [73,74,75] while Ca, Mg, K can be considered as particulate matters which originated from biomass burnings [76,77,78].
In this study, the atmospheric concentrations of crustal metals (i.e., the sum of Al, Ca, Fe, Mg, K, and Na) were 6582 ng m−3 for FDP and 7438 ng m−3 for NDP. Interestingly, the particulate contents of anthropogenic metals (i.e., the sum of Zn, As, Pb, V, Ti, Cr, Mn, Ni, Sr, Cu, Li, Cd, and Co.) were 510 ng m−3 for FDP and 468 ng m−3 for NDP. Since the anthropogenic metals were slightly higher in FDP, it seems rational to interpret particle injections triggered by firework displays as a main contributor to atmospheric concentrations of anthropogenic metals during the LKF period. These findings are also in good agreement with the finding that the TE concentration (see Equation (9)) detected in FDP (i.e., 581 ng m−3) was slightly higher than in NDP (i.e., 526 ng m−3).
As illustrated in Figure 2, two near-identical patterns (represented as percentage contributions) of particulate selected metals were detected during the FDP and NDP episodes, both of which followed the sequence: Ca > Na > K > Fe> Al > Mg > Zn > Cu > Pb. The similar decreasing sequence of selected metals between the two episodes highlights the relatively homogeneous distribution of the 31 target compounds inthe ambient air of Bangkok during the observation periods. Since previous studies report that vehicle exhaust is the main emission source of air pollutants in Bangkok [8,9,10,12,79], it appears rational to interpret the high similarity distribution patterns of the selected metal compositions between the two episodes, as resulting from road traffic emissions, rapidly overwhelming other potential contributors during the sampling period. Further evaluations of particulate metal injections triggered by firework displays were conducted by applying the concept of diagnostic binary ratios, which will be described in Section 3.1.

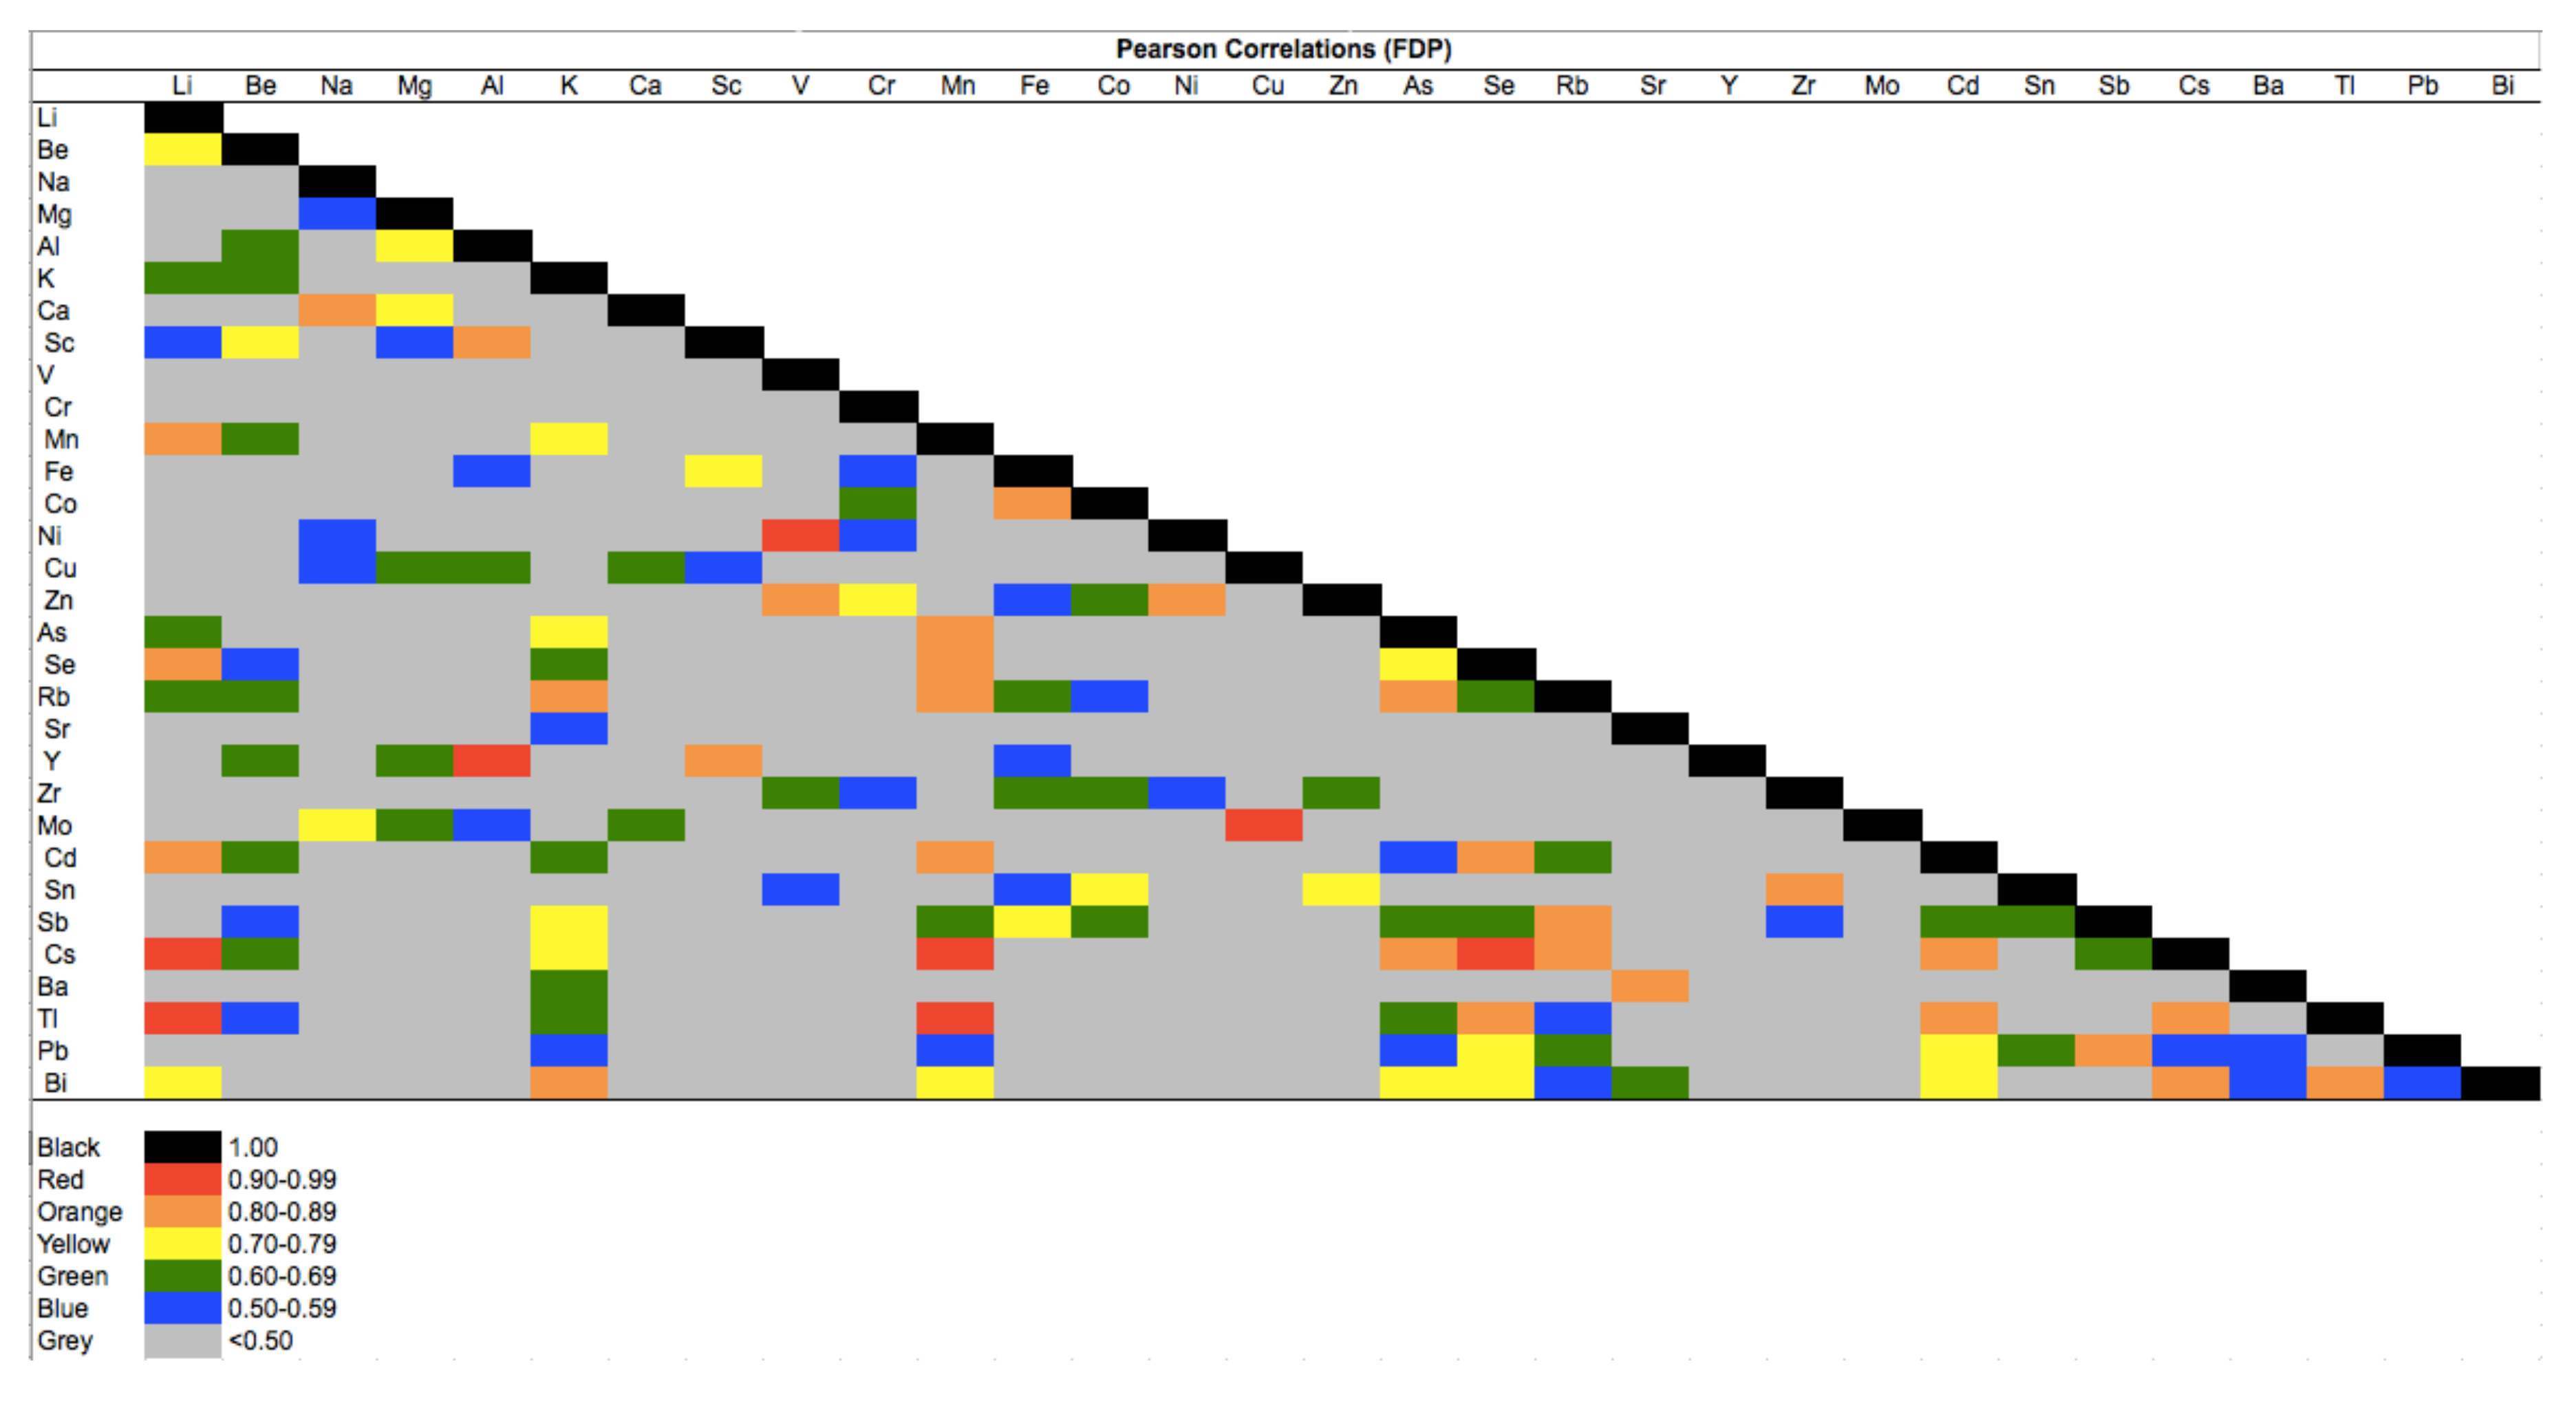
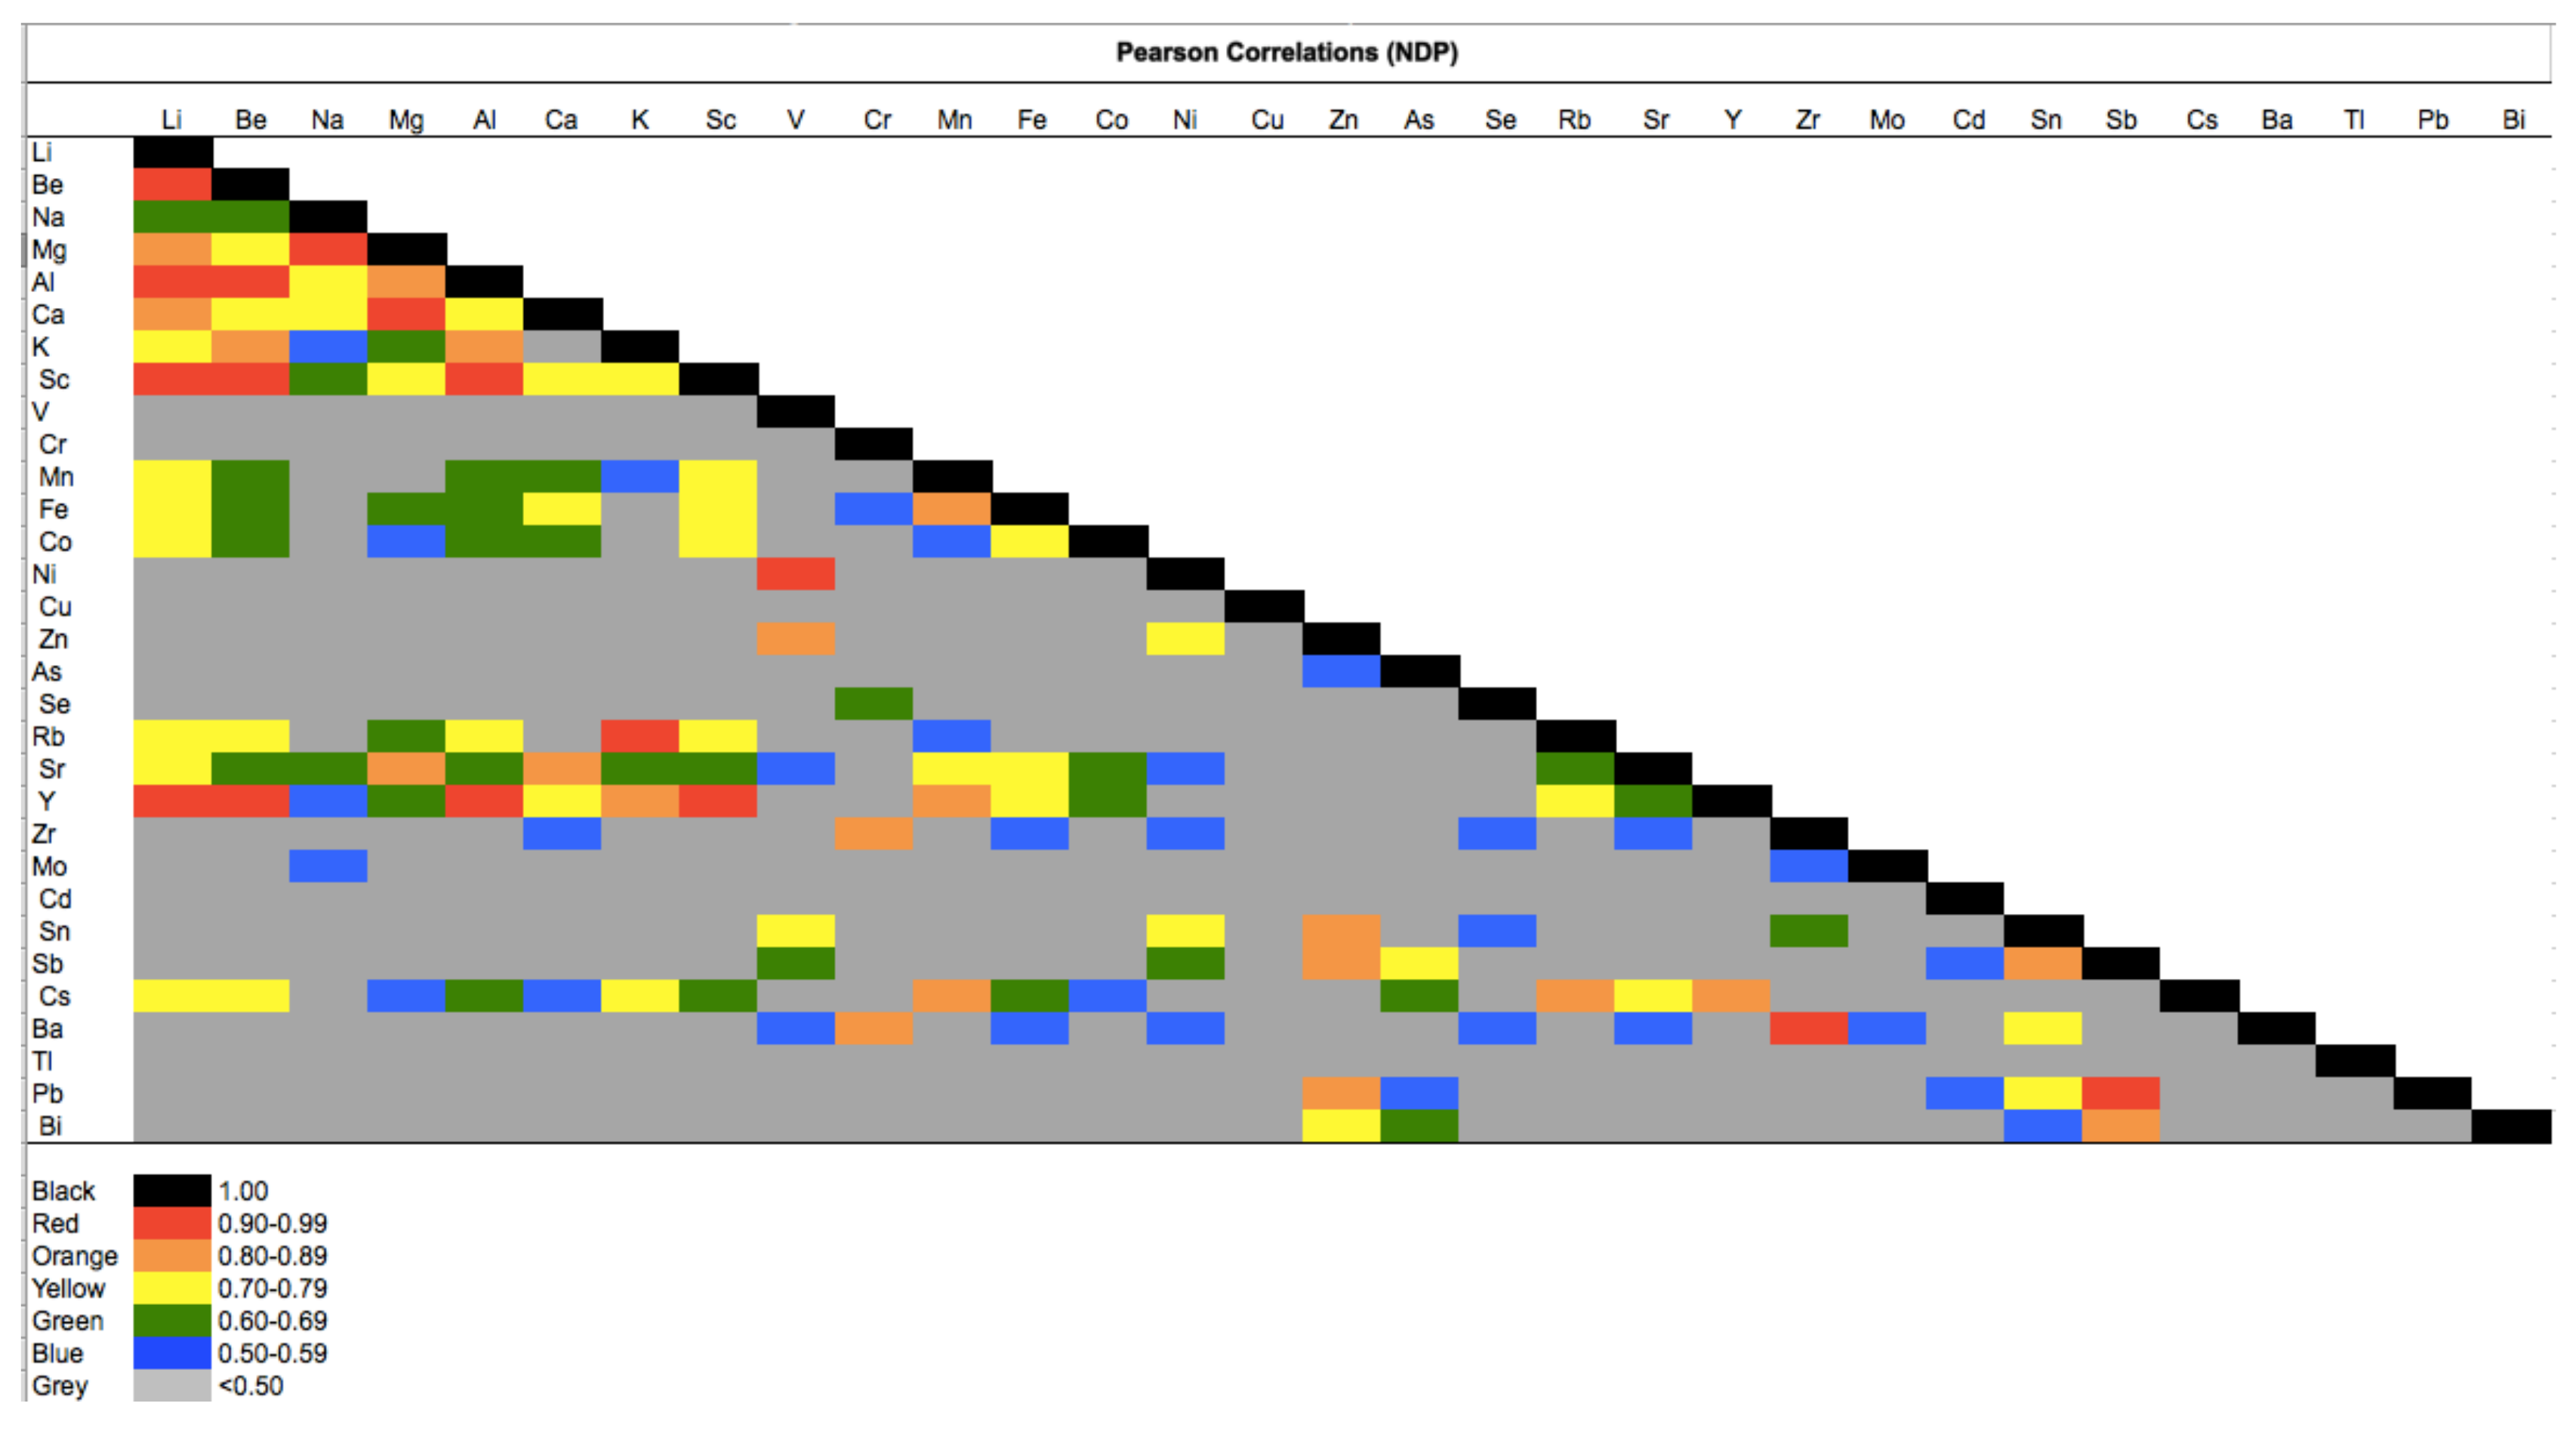
3.1. Diagnostic Binary Ratios of Selected Metals

Although the application of diagnostic binary ratios is frequently criticised as a reliable tool for identifying the emission sources of air pollutants [80], this technique has still been widely used in numerous studies tracing particular matter elemental compounds in ambient air during the past few years [81,82,83]. A simple binary ratio of two or three selected metals is sensitive to physicochemical transformations, and emission source strengths that can occur in the ambient air commonly involve metal contributions from numerous sources. Consequently, a comprehensive consideration of several metal ratios can provide a broader picture for potential source identification. In this study, Ba and Pb were the only two metals that showed significantly higher concentrations during the firework display episodes. It is also worth mentioning that Ca, Na, K, Fe, Al, Mg, Zn, and Cu were the eight most abundant metals observed in both episodes. For these reasons, 16 pairs of selected metals were selected as potential tracers for firework emissions (see Table 2). The 16 metal ratios fell within the ranges 0.033∼0.56 and 0.017∼0.35 for FDP and NDP respectively. As illustrated in Figure 3A,B, emissions of Li–Cs showed a strong correlation (R = 0.92, n = 50, p < 0.0001), followed by Li–Tl (R = 0.92, n = 50, p < 0.0001), Al–Y (R = 0.93, n = 50, p < 0.0001), V–Ni (R = 0.91, n = 50, p < 0.0001), Mn–Cs (R = 0.97, n = 50, p < 0.0001), Mn–Tl (R = 0.90, n = 50, p < 0.0001), and Cu–Mo (R = 0.92, n = 50, p < 0.0001). Consequently, Li/Cs, Li/Tl, Al/Y, V/Ni, Mn/Cs, and Mn/Tl were tested to evaluate their potential as firework tracers. Unfortunately, the FDP/NDP ratios of these six metal ratios were ≈1, and therefore inappropriate as firework tracers. Interestingly, only four metal ratios observed in FDP (i.e., Pb/Ca, Pb/Al, Pb/Mg, and Pb/Cu) were approximately twice that in NDP. Additionally, eight metal ratios (Ba/Ca, Ba/Na, Ba/K, Ba/Fe, Ba/Al, Ba/Mg, Ba/Zn, and Ba/Cu) had ratios <1.6. Since Se and Cd were the two metals with the largest enrichment factors (Figure 4), a binary ratio of Se/Cd was also computed in both sampling campaigns. Regrettably, the FDP/NDP ratio of Se/Cd was close to one (i.e., 0.8), indicating its unsuitability for characterising firework displays.

3.2. Enrichment Factors of Selected Metals

As shown in Figure 4, the logarithmic EFs of the 31 selected metals in PM10 detected at both monitoring campaigns from November 2012 to December 2013 followed the sequence:
Se>Sb>Cd>Bi>Cu>Sn>Pb>Mo>Zn>As>Tl>Ba>Ni>V>Rb>Ca>Cs>K>Na>Zr>Mn>Li>Be>Sr>Co>Cr>Fe>Y>Sc>Mg>Al. These findings can be categorised into four groups as an arbitrary scale, based on earlier reports [79,84]. Firstly, Se, Sb, and Cd were excessively enriched (i.e., 3 < Log(EF) < 4). Secondly, Bi, Cu, Sn, Pb, Mo, and Zn were highly enriched (i.e., 2 < Log(EF) < 3). Thirdly, As and Tl were substantially enriched (i.e., 1 < Log(EF) < 2). Fourthly, Ba, Ni, V, Rb, Ca, Cs, K, Na, Zr, Mn, Li, Be, Sr, Co., Cr, Fe, Y, Sc, Mg, and Al were not enriched (i.e., Log(EF) < 1). It is important to note that almost 35% of Log(EF) were between 1–3; only 10% were >3; and 55% were <1. It is well known that numerous phenomena, such as vehicular exhaust, construction dust, crustal sources, industrial emissions, burning of agricultural waste, re-suspension of road dust, and sea salt aerosols, can greatly alter the Log(EF) values.
Since the Log(EF) values of five metals (Co., Cr, Y, Sc, and Mg) approached zero (i.e., EF values close to one) in both sampling periods, it is to be concluded that the crust is the major source. Although previous studies highlighted Mg as a firework tracer [47,63], the present findings suggest that Mg might not be a good indicator of firework displays. The extremely high Log(EF) values of Se, Sb, and Cd are explained in terms of vehicular emissions, and are in reasonable accordance with previous studies [79,85,86,87]. Additionally, the extremely low Log(EF) values observed for Al (i.e., FDP: −0.59; NDP: −0.54) observed here are consistent with earlier studies [25,79]. Terrestrial soil releases of particulate Al are the most reasonable interpretation of these exceedingly low Log(EF) values detected in both sampling episodes.
The back trajectory analysis reveals prevailing easterly and north-easterly surface winds during the observation period (see Figures S1–S5). It is obvious that the majority of the prevailing winds passed over potential anthropogenic emission sources (i.e., the Special Economic Zones (SEZ) in Cambodia) before reaching the study site. Although total employment in all of Cambodia’s SEZs is currently approximately 68,000, this represents just under 1% of total employment and 3.7% of total secondary industry employment in Cambodia [88]. Transport statistics (available online: http://apps.dlt.go.th/statistics_web/brochure/cumcar12.pdf) show 7,523,381 vehicles registered in Bangkok as of 31 December 2012. The total number of vehicles in Bangkok is almost double that for the whole of Cambodia, which was calculated as 338,791 (i.e., population× number of vehicles per capita: (16,132,910 × 21)/1000) (available online: http://www.nationmaster.com/country-info/stats/Transport/Road/Motor-vehicles-per-1000-people).
Hence, it appears reasonable to assume that the easterly winds were comparatively less influenced by anthropogenic emissions. These findings were consistent with the relatively low Log(EF) values observed in the present study, highlighting that crustal emissions dominated the ambient air quality of Bangkok during the observation period. In addition, other anthropogenic emission sources such as fossil fuel-fired utility and industrial boilers from factories, iron and steel production, cement production, and non-ferrous metal manufacturing coupled with municipal sectors can also play important roles in governing particulate selected metal contents in ambient air [89,90,91]. It is also crucial to underline that the number of cars is not the only factor of anthropogenic emissions volume study.

3.3. Hazard Quotients, Hazard Indexes, and Cancer Risks of Selected Metals

Statistics for Dinh-children, Dinh-adults, HQchildren, HQadult, and LADD are shown in Table 3 and Table 4, including during both monitoring campaigns. As clearly displayed in Table 3 and Table 4, the risk levels of Pb, Cr, Co., Ni, Zn, As, Cd, V, and Mn through the inhalation exposure system in both FDP and NDP were in the range of 3.52 × 10⁻⁷~6.75 × 10⁻³ and 1.99 × 10⁻⁷~3.80 × 10⁻³ for children and adults respectively. Both values were much lower than the acceptance risk of 1. It should be noted that the sequence of risk levels for the non-carcinogenic heavy metals was Mn>Cr>Co.>As>Pb>Cd>V>Zn>Ni, which differ from those for PM2.5 in Xinxiang (Zn>Pb>As>V>Cr>Mn>Ni>Cd>Co) [46]. This discrepancy might be explained by some differences in particle size distributions [92,93,94] and emission source characteristics between Bangkok and Xinxiang. It is worth mentioning that the sum of the risk levels (HI) for the nine heavy metals were 7.28× 10⁻³ and 4.10 × 10⁻³ for children and adults, respectively. These are clearly less than 0.1; moreover, they are 33 and 32 times lower than the risk levels reported for Xinxiang for children and adults respectively. Since the HQchildren values were almost double the HQadult values for both monitoring periods, it appears reasonable to mention that children are more vulnerable than adults to the noncancerous effects of these nine non-carcinogenic heavy metals [95]. This can be attributed to their mouthing behaviours, whereby children’s hand-to-mouth activities represent a major pathway of chemical exposure [12,96].
The LADD of Pb, Cr, Co., Ni, Zn, As, Cd, V, and Mn, and the total cancer risk (Rt) (see Equation (6)) associated with As, Cd, Cr, Ni, and Co. exposure via respiration, are also displayed in Table 3 and Table 4. The sequence of R values (see Equation (5)) during the FDP was As>Cr>Cd>Co.>Ni, which differs from those observed in Xinxiang (i.e., As>Cd>Cr>Ni>Co.) [46]. It is important to note that the carcinogenic risks associated with As, Cd, Cr, Ni, and Co. were all >10−6; in particular, As and Cr were 180 and 145 times greater than internationally accepted precautionary or threshold values for cancer risk [48,97]. Additionally, the carcinogenic risks for Ni (FDP: 5.94 × 10⁻⁶; NDP: 4.51 × 10⁻⁶) and Co. (FDP: 6.51 × 10⁻⁶; NDP: 6.55 × 10⁻⁶) were slightly higher than the accepted value of 10−6. Overall, the lifetime cancer risks of particulate As, Cd, Cr, Ni, and Co noticeably surpass the US-EPA guidelines, and it seems rational to conclude that these may expose neighbouring residents in Bangkok to enhanced risk of cancer

4. Conclusions

The atmospheric concentrations, hazard quotients, hazard indices, and cancer risks of 31 selected metals present in PM10 were investigated during firework display and non-display periods in Bangkok. Only Ba and Pb were significantly higher during the firework display periods. These results were consistent with earlier findings indicating that these two metals can be acknowledged as firework tracers. Since the Pb/Ca, Pb/Al, Pb/Mg, and Pb/Cu ratios were approximately two times higher during the firework display period, it seems reasonable to apply these four diagnostic binary ratios as potential firework tracers, particularly in the case of Bangkok. Enrichment factors highlighted the importance of crustal emissions as a main contributor to the presence of particular matter elemental compounds in ambient air in Bangkok, regardless of firework events. No significant differences in risk levels were observed for Pb, Cr, Co, Ni, Zn, As, Cd, V, or Mn during firework episodes. Although the HI values observed in both sampling campaigns were much lower than international guidelines, the carcinogenic risks associated with As, Cd, Cr, Ni, and Co all exceeded the acceptable level of 10−6, raising public health concerns over the increased cancer risk among surrounding residents in Bangkok.

Supplementary Materials

The following are available online at https://www.mdpi.com/2073-4433/9/4/144/s1.

Acknowledgments

The authors acknowledge support for this study from the Information Technology Foundation under the Initiative of Her Royal Highness Princess Maha Chakri Sirindhorn; the National Science and Technology Development Agency (NSTDA); the Chinese Academy of Sciences (IEECAS); and the National Institute of Development Administration (NIDA). The authors acknowledge all research staff at the Pollution Control Department (PCD), The Ministry of Natural Resources and Environment of the Kingdom of Thailand for their assistance with field sampling of PM10.

Author Contributions

S.P. and J.C. conceived and planned the monitoring campaigns. A.I. carried out the chemical extraction and instrumental analysis. S.P. performed the hazard indexes and hazard quotients and wrote the manuscript with input from all authors. Additionally, all authors provided critical feedback and helped shape the research, analysis and manuscript.

Conflicts of Interest

The authors declare no conflict of interest.

References

  1. Amodio, M.; Caselli, M.; de Gennaro, G.; Tutino, M. Particulate PAHs in two urban areas of Southern Italy: Impact of the sources, meteorological and background conditions on air quality. Environ. Res. 2009, 109, 812–820. [Google Scholar] [CrossRef] [PubMed]
  2. Bozlaker, A.; Muezzinoglu, A.; Odabasi, M. Atmospheric concentrations, dry deposition and air–soil exchange of polycyclic aromatic hydrocarbons (PAHs) in an industrial region in Turkey. J. Hazard. Mater. 2008, 153, 1093–1102. [Google Scholar] [CrossRef] [PubMed]
  3. Černá, M.; Pochmanová, D.; Pastorková, A.; Beneš, I.; Leníček, J.; Topinka, J.; Binková, B. Genotoxicity of urban air pollutants in the Czech Republic: Part I. bacterial mutagenic potencies of organic compounds adsorbed on PM10 particulates. Mutat Res. Gen. Tox. Environ. 2002, 469, 71–82. [Google Scholar] [CrossRef]
  4. Garban, B.; Blanchoud, H.; Motelay-Massei, A.; Chevreuil, M.; Ollivon, D. Atmospheric bulk deposition of PAHs onto France: Trends from urban to remote sites. Atmos. Environ. 2002, 36, 5395–5403. [Google Scholar] [CrossRef]
  5. Guo, H.; Lee, S.C.; Ho, K.F.; Wang, X.M.; Zou, S.C. Particle-associated polycyclic aromatic hydrocarbons in urban air of Hong Kong. Atmos. Environ. 2003, 37, 5307–5317. [Google Scholar] [CrossRef]
  6. Halsall, C.J.; Lee, R.G.; Coleman, P.J.; Burnett, V.; Harding-Jones, P.; Jones, K.C. PCBs in UK urban air. Environ. Sci. Technol. 1995, 29, 2368–2376. [Google Scholar] [CrossRef] [PubMed]
  7. Pongpiachan, S. Diurnal variation, vertical distribution and source apportionment of carcinogenic polycyclic aromatic hydrocarbons (PAHs) in Chiang-Mai, Thailand. Asian Pac. J. Cancer 2013, 14, 1851–1863. [Google Scholar] [CrossRef]
  8. Pongpiachan, S. Vertical distribution and potential risk of particulate polycyclic aromatic hydrocarbons in high buildings of Bangkok, Thailand. Asian Pac. J. Cancer 2013, 14, 1865–1877. [Google Scholar] [CrossRef]
  9. Pongpiachan, S.; Choochuay, C.; Hattayanone, M.; Kositanont, C. Temporal and spatial distribution of particulate carcinogens and mutagens in Bangkok, Thailand. Asian Pac. J. Cancer 2013, 14, 1879–1887. [Google Scholar] [CrossRef]
  10. Pongpiachan, S.; Kositanont, C.; Palakun, J.; Liu, S.; Ho, K.F.; Cao, J. Effects of day-of-week trends and vehicle types on PM2.5-bounded carbonaceous compositions. Sci. Total Environ. 2015, 532, 484–494. [Google Scholar] [CrossRef] [PubMed]
  11. Pongpiachan, S.; Hattayanone, M.; Choochuay, C.; Mekmok, R.; Wuttijak, N.; Ketratanakul, A. Enhanced PM10 bounded PAHs from shipping emissions. Atmos. Environ. 2015, 108, 13–19. [Google Scholar] [CrossRef]
  12. Pongpiachan, S.; Hattayanone, M.; Suttinun, O.; Khumsup, C.; Kittikoon, I.; Hiruyatrakul, P.; Cao, J. Assessing human exposure to PM10-bound polycyclic aromatic hydrocarbons during fireworks displays. Atmos. Pollut. Res. 2017, 8, 816–827. [Google Scholar] [CrossRef]
  13. Pongpiachan, S.; Liu, S.; Huang, R.; Zhao, Z.; Palakun, J.; Kositanont, C.; Cao, J. Variation in day-of-week and seasonal concentrations of atmospheric PM2.5-bound metals and associated health risks in Bangkok, Thailand. Arch. Environ. Contam. Toxicol. 2017, 72, 364–379. [Google Scholar] [CrossRef] [PubMed]
  14. Pongpiachan, S.; Mattanawadee, H.; Junji, C. Effect of agricultural waste burning season on PM 2.5-bound polycyclic aromatic hydrocarbon (PAH) levels in Northern Thailand. Atmos. Pollut. Res. 2017, 8, 1069–1080. [Google Scholar] [CrossRef]
  15. Pongpiachan, S.; Hattayanone, M.; Tipmanee, D.; Suttinun, O.; Khumsup, C.; Kittikoon, I.; Hirunyatrakul, P. Chemical characterization of polycyclic aromatic hydrocarbons (PAHs) in 2013 Rayong oil spill-affected coastal areas of Thailand. Environ. Pollut. 2017, in press. [Google Scholar] [CrossRef] [PubMed]
  16. Ratcliffe, H.E.; Swanson, G.M.; Fischer, L.J. Human exposure to mercury: A critical assessment of the evidence of adverse health effects. J. Toxicol. Environ. Health 1996, 49, 221–270. [Google Scholar] [CrossRef] [PubMed]
  17. Zhang, H.; He, P.J.; Shao, L.M. Fate of heavy metals during municipal solid waste incineration in Shanghai. J. Hazard. Mater. 2008, 156, 365–373. [Google Scholar] [CrossRef] [PubMed]
  18. Charlesworth, S.; Everett, M.; McCarthy, R.; Ordóñez, A.; de Miguel, E. A comparative study of heavy metal concentration and distribution in deposited street dusts in a large and a small urban area: Birmingham and Coventry, West Midlands, UK. Environ. Int. 2003, 29, 563–573. [Google Scholar] [CrossRef]
  19. Madrid, F.; Barrientos, E.D.; Madrid, L. Availability and bio-accessibility of metals in the clay fraction of urban soils of Sevilla. Environ. Pollut. 2008, 156, 605–610. [Google Scholar] [CrossRef] [PubMed]
  20. Yatkin, S.; Bayram, A. Determination of major natural and anthropogenic source profiles for particulate matter and trace elements in Izmir, Turkey. Chemosphere 2008, 71, 685–696. [Google Scholar] [CrossRef] [PubMed]
  21. Yatkin, S.; Bayram, A. Source apportionment of PM10 and PM2.5 using positive matrix factorization and chemical mass balance in Izmir, Turkey. Sci. Total Environ. 2008, 390, 109–123. [Google Scholar] [CrossRef] [PubMed]
  22. Fang, W.; Yang, Y.; Xu, Z. PM10 and PM2.5 and health risk assessment for heavy metals in a typical factory for cathode ray tube television recycling. Environ. Sci. Technol. 2013, 47, 12469–12476. [Google Scholar] [CrossRef] [PubMed]
  23. Kong, S.; Lu, B.; Ji, Y.; Zhao, X.; Chen, L.; Li, Z.; Han, B.; Bai, Z. Levels, risk assessment and sources of PM 10 fraction heavy metals in four types dust from a coal-based city. Microchem. J. 2011, 98, 280–290. [Google Scholar] [CrossRef]
  24. Lu, X.; Zhang, X.; Li, L.Y.; Chen, H. Assessment of metals pollution and health risk in dust from nursery schools in Xi’an, China. Environ. Res. 2014, 128, 27–34. [Google Scholar] [CrossRef] [PubMed]
  25. Wu, S.; Peng, S.; Zhang, X.; Wu, D.; Luo, W.; Zhang, T.; Zhou, S.; Yang, G.; Wan, H.; Wu, L. Levels and health risk assessments of heavy metals in urban soils in Dongguan, China. J. Geochem. Explor. 2015, 148, 71–78. [Google Scholar] [CrossRef]
  26. Christoforidis, A.; Stamatis, N. Heavy metal contamination in street dust and roadside soil along the major national road in Kavala’s region, Greece. Geoderma 2009, 151, 257–263. [Google Scholar] [CrossRef]
  27. Duong, T.T.; Lee, B.K. Determining contamination level of heavy metals in road dust from busy traffic areas with different characteristics. J. Environ. Manag. 2011, 92, 554–562. [Google Scholar] [CrossRef] [PubMed]
  28. Johansson, C.; Norman, M.; Burman, L. Road traffic emission factors for heavy metals. Atmos. Environ. 2009, 43, 4681–4688. [Google Scholar] [CrossRef]
  29. Ndiokwere, C.L. A study of heavy metal pollution from motor vehicle emissions and its effect on roadside soil, vegetation and crops in Nigeria. Environ. Pollut. B 1984, 7, 35–42. [Google Scholar] [CrossRef]
  30. Jianguo, J.; Jun, W.; Xin, X.; Wei, W.; Zhou, D.; Yan, Z. Heavy metal stabilization in municipal solid waste incineration flyash using heavy metal chelating agents. J. Hazard. Mater. 2004, 113, 141–146. [Google Scholar] [CrossRef] [PubMed]
  31. Meij, R.; te Winkel, H. The emissions of heavy metals and persistent organic pollutants from modern coal-fired power stations. Atmos. Environ. 2007, 41, 9262–9272. [Google Scholar] [CrossRef]
  32. Reddy, M.S.; Basha, S.; Joshi, H.V.; Jha, B. Evaluation of the emission characteristics of trace metals from coal and fuel oil fired power plants and their fate during combustion. J. Hazard. Mater. 2005, 123, 242–249. [Google Scholar] [CrossRef] [PubMed]
  33. Sushil, S.; Batra, V.S. Analysis of fly ash heavy metal content and disposal in three thermal power plants in India. Fuel 2006, 85, 2676–2679. [Google Scholar] [CrossRef]
  34. Dahl, O.; Nurmesniemi, H.; Pöykiö, R.; Watkins, G. Comparison of the characteristics of bottom ash and fly ash from a medium-size (32 MW) municipal district heating plant incinerating forest residues and peat in a fluidized-bed boiler. Fuel Process. Technol. 2009, 90, 871–878. [Google Scholar] [CrossRef]
  35. Yoo, J.I.; Kim, K.H.; Jang, H.N.; Seo, Y.C.; Seok, K.S.; Hong, J.H.; Jang, M. Emission characteristics of particulate matter and heavy metals from small incinerators and boilers. Atmos. Environ. 2002, 36, 5057–5066. [Google Scholar] [CrossRef]
  36. Fujimori, T.; Itai, T.; Goto, A.; Asante, K.A.; Otsuka, M.; Takahashi, S.; Tanabe, S. Interplay of metals and bromine with dioxin-related compounds concentrated in e-waste open burning soil from Agbogbloshie in Accra, Ghana. Environ. Pollut. 2016, 209, 155–163. [Google Scholar] [CrossRef] [PubMed]
  37. Wang, Y.; Cheng, K.; Wu, W.; Tian, H.; Yi, P.; Zhi, G.; Fan, J.; Liu, S. Atmospheric emissions of typical toxic heavy metals from open burning of municipal solid waste in China. Atmos. Environ. 2017, 152, 6–15. [Google Scholar] [CrossRef]
  38. Betha, R.; Pradani, M.; Lestari, P.; Joshi, U.M.; Reid, J.S.; Balasubramanian, R. Chemical speciation of trace metals emitted from Indonesian peat fires for health risk assessment. Atmos. Res. 2013, 122, 571–578. [Google Scholar] [CrossRef]
  39. Breulmann, G.; Markert, B.; Weckert, V.; Herpin, U.; Yoneda, R.; Ogino, K. Heavy metals in emergent trees and pioneers from tropical forest with special reference to forest fires and local pollution sources in Sarawak, Malaysia. Sci. Total Environ. 2002, 285, 107–115. [Google Scholar] [CrossRef]
  40. Camilleri, R.; Vella, A.J. Effect of fireworks on ambient air quality in Malta. Atmos. Environ. 2010, 44, 4521–4527. [Google Scholar] [CrossRef]
  41. Kulshrestha, U.C.; Rao, T.N.; Azhaguvel, S.; Kulshrestha, M.J. Emissions and accumulation of metals in the atmosphere due to crackers and sparkles during Diwali festival in India. Atmos. Environ. 2004, 38, 4421–4425. [Google Scholar] [CrossRef]
  42. Sarkar, S.; Khillare, P.S.; Jyethi, D.S.; Hasan, A.; Parween, M. Chemical speciation of respirable suspended particulate matter during a major firework festival in India. J. Hazard. Mater. 2010, 184, 321–330. [Google Scholar] [CrossRef] [PubMed]
  43. Seidel, D.J.; Birnbaum, A.N. Effects of Independence Day fireworks on atmospheric concentrations of fine particulate matter in the United States. Atmos. Environ. 2015, 115, 192–198. [Google Scholar] [CrossRef]
  44. Steinhauser, G.; Sterba, J.H.; Foster, M.; Grass, F.; Bichler, M. Heavy metals from pyrotechnics in New Years Eve snow. Atmos. Environ. 2008, 42, 8616–8622. [Google Scholar] [CrossRef]
  45. Tian, Y.Z.; Wang, J.; Peng, X.; Shi, G.L.; Feng, Y.C. Estimation of the direct and indirect impacts of fireworks on the physicochemical characteristics of atmospheric PM10 and PM2.5. Atmos. Chem. Phys. 2014, 14, 9469–9479. [Google Scholar] [CrossRef]
  46. Feng, J.; Yu, H.; Su, X.; Liu, S.; Li, Y.; Pan, Y.; Sun, J.H. Chemical composition and source apportionment of PM 2.5 during Chinese spring festival at Xinxiang, a heavily polluted city in north China: Fireworks and health risks. Atmos. Res. 2016, 182, 176–188. [Google Scholar] [CrossRef]
  47. Tsai, H.H.; Chien, L.H.; Yuan, C.S.; Lin, Y.C.; Jen, Y.H.; Ie, I.R. Influences of fireworks on chemical characteristics of atmospheric fine and coarse particles during Taiwan’s Lantern Festival. Atmos. Environ. 2012, 62, 256–264. [Google Scholar] [CrossRef]
  48. Wang, Y.; Zhuang, G.; Xu, C.; An, Z. The air pollution caused by the burning of fireworks during the lantern festival in Beijing. Atmos. Environ. 2007, 41, 417–431. [Google Scholar] [CrossRef]
  49. Winberry, W.T.; Murphy, N.T.; Riggin, R.M. Compendium of Methods for the Determination of Toxic Organic Compounds in Ambient Air; Atmospheric Research and Exposure Assessment Laboratory, Office of Research and Development, US Environmental Protection Agency: Triangle Park, NC, USA, 1988. [Google Scholar]
  50. Iijima, A.; Sato, K.; Fujitani, Y.; Fujimori, E.; Saitoh, Y.; Tanabe, K.; Ohara, T.; Kozawa, K.; Furuta, N. Clarification of the predominant emission sources of antimony in airborne particulate matter and estimation of their effects on the atmosphere in Japan. Environ. Chem. 2009, 6, 122–135. [Google Scholar] [CrossRef]
  51. Iijima, A.; Sato, K.; Ikeda, T.; Sato, H.; Kozawa, K.; Furuta, N. Concentration distributions of dissolved Sb(III) and Sb(V) species in size-classified inhalable airborne particulate matter. J. Anal. Atomic Spectrom. 2010, 25, 356–363. [Google Scholar] [CrossRef]
  52. Granero, S.; Domingo, J. Levels of metals in soils of Alcala de Henares, Spain: Human health risks. Environ. Int. 2012, 28, 159–164. [Google Scholar] [CrossRef]
  53. Kong, S.F.; Lu, B.; Ji, Y.Q.; Zhao, X.Y.; Bai, Z.P.; Xu, Y.H.; Liu, Y.; Jiang, H. Risk assessment of heavy metals in road and soil dust within PM2.5, PM10 and PM100 fractions in Dongying city, Shandong Province, China. J. Environ. Monit. 2012, 14, 791–803. [Google Scholar] [CrossRef] [PubMed]
  54. Li, Y.M.; Pan, Y.P.; Wang, Y.S.; Wang, Y.F.; Li, X.R. Chemical characteristics and sources of trace metals in precipitation collected from a typical industrial city in Northern China. Huan Jing Ke Xue 2012, 33, 3712–3717. (In Chinese) [Google Scholar] [PubMed]
  55. Wang, W.; Cheng, S.; Zhang, D. Association of inorganic arsenic exposure with liver cancer mortality: A meta-analysis. Environ. Res. 2014, 135, 120–125. [Google Scholar] [CrossRef] [PubMed]
  56. Zhang, H.; Wang, Z.; Zhang, Y.; Ding, M.; Li, L. Identification of traffic-related metals and the effects of different environments on their enrichment in roadside soils along the Qinghai-Tibet highway. Sci. Total Environ. 2015, 521–522, 160–172. [Google Scholar] [CrossRef] [PubMed]
  57. López, J.M.; Callén, M.S.; Murillo, R.; García, T.; Navarro, M.V.; de la Cruz, M.T.; Mastral, A.M. Levels of selected metals in ambient air PM10 in an urban site of Zaragoza (Spain). Environ. Res. 2005, 99, 58–67. [Google Scholar] [CrossRef] [PubMed]
  58. Rudnick, R.L. The Crust. In Treatise on Geochemistry; Elsevier: New York, NY, USA, 2003; Volume 3. [Google Scholar]
  59. Kong, S.F.; Li, L.; Li, X.X.; Yin, Y.; Chen, K.; Liu, D.T.; Yuan, L.; Zhang, Y.J.; Shan, Y.P.; Ji, Y.Q. The impacts of firework burning at the Chinese Spring Festival on air quality: Insights of tracers, source evolution and aging processes. Atmos. Chem. Phys. 2015, 15, 2167–2184. [Google Scholar] [CrossRef]
  60. Terzi, E.; Argyropoulos, G.; Bougatioti, A.; Mihalopoulos, N.; Nikolaou, K.; Samara, C. Chemical composition and mass closure of ambient PM10 at urban sites. Atmos. Environ. 2010, 44, 2231–2239. [Google Scholar] [CrossRef]
  61. Draxler, R.R.; Hess, G.D. An overview of the HYSPLIT_4 modelling system for trajectories, dispersion and deposition. Aust. Meteorol. Mag. 1998, 47, 295–308. [Google Scholar]
  62. Draxler, R.R. Evaluation of an ensemble dispersion calculation. J. Appl. Meteorol. 2003, 42, 308–317. [Google Scholar] [CrossRef]
  63. Kumar, M.; Singh, R.K.; Murari, V.; Singh, A.K.; Singh, R.S.; Banerjee, T. Fireworks induced particle pollution: A spatio-temporal analysis. Atmos. Res. 2016, 180, 78–91. [Google Scholar] [CrossRef]
  64. Vecchi, R.; Bernardoni, V.; Cricchio, D.; D’Alessandro, A.; Fermo, P.; Lucarelli, F.; Nava, S.; Piazzalunga, A.; Valli, G. The impact of fireworks on airborne particles. Atmos. Environ. 2008, 42, 1121–1132. [Google Scholar] [CrossRef]
  65. Cançado, J.E.; Saldiva, P.H.; Pereira, L.A.; Lara, L.B.; Artaxo, P.; Martinelli, L.A.; Arbex, M.A.; Zanobetti, A.; Braga, A.L. The impact of sugar cane–burning emissions on the respiratory system of children and the elderly. Environ. Health Perspect. 2006, 114, 725. [Google Scholar] [CrossRef] [PubMed] [Green Version]
  66. Salam, A.; Hasan, M.; Begum, B.A.; Begum, M.; Biswas, S.K. Chemical characterization of biomass burning deposits from cooking stoves in Bangladesh. Biomass Bioenergy 2013, 52, 122–130. [Google Scholar] [CrossRef]
  67. Deka, P.; Hoque, R.R. Diwali fireworks: Early signs of impact on PM10 properties of rural Brahmaputra valley. Aerosol Air Qual. Res. 2014, 14, 1752–1762. [Google Scholar] [CrossRef]
  68. Moreno, T.; Querol, X.; Alastuey, A.; Amato, F.; Pey, J.; Pandolfi, M.; Kuenzli, N.; Bouso, L.; Rivera, M.; Gibbons, W. Effect of fireworks events on urban background trace metal aerosol concentrations: Is the cocktail worth the show? J. Hazard. Mater. 2010, 183, 945–949. [Google Scholar] [CrossRef] [PubMed]
  69. Perrino, C.; Tiwari, S.; Catrambone, M.; Dalla Torre, S.; Rantica, E.; Canepari, S. Chemical characterization of atmospheric PM in Delhi, India, during different periods of the year including Diwali festival. Atmos. Pollut. Res. 2011, 2, 418–427. [Google Scholar] [CrossRef]
  70. Russell, M.S. The Chemistry of Fireworks; Royal Society of Chemistry: London, UK, 2009. [Google Scholar]
  71. Grima, M.; Butler, M.; Hanson, R.; Mohameden, A. Firework displays as sources of particles similar to gunshot residue. Sci. Justice 2012, 52, 49–57. [Google Scholar] [CrossRef] [PubMed]
  72. Pan, Y.; Tian, S.; Li, X.; Ying, S.; Yi, L.; Wentworth, G.R.; Wang, Y. Trace elements in particulate matter from metropolitan regions of northern China: Sources, concentrations and size distributions. Sci. Total Environ. 2015, 537, 9–22. [Google Scholar] [CrossRef] [PubMed]
  73. Allen, H.C.; Laux, J.M.; Vogt, R.; Finlayson-Pitts, B.J.; Hemminger, J.C. Water-induced reorganization of ultrathin nitrate films on NaCl: Implications for the tropospheric chemistry of sea salt particles. J. Phys. Chem. 1996, 100, 6371–6375. [Google Scholar] [CrossRef]
  74. Laskin, A.; Moffet, R.C.; Gilles, M.K.; Fast, J.D.; Zaveri, R.A.; Wang, B.; Nigge, P.; Shutthanandan, J. Tropospheric chemistry of internally mixed sea salt and organic particles: Surprising reactivity of NaCl with weak organic acids. J. Geophys. Res. Atmos. 2012, 117. [Google Scholar] [CrossRef]
  75. Zhuang, H.; Chan, C.K.; Fang, M.; Wexler, A.S. Formation of nitrate and non-sea-salt sulfate on coarse particles. Atmos. Environ. 1999, 33, 4223–4233. [Google Scholar] [CrossRef]
  76. Johansson, L.S.; Tullin, C.; Leckner, B.; Sjövall, P. Particle emissions from biomass combustion in small combustors. Biomass Bioenergy 2003, 25, 435–446. [Google Scholar] [CrossRef]
  77. Li, J.; Pósfai, M.; Hobbs, P.V.; Buseck, P.R. Individual aerosol particles from biomass burning in southern Africa: 2, Compositions and aging of inorganic particles. J. Geophys. Res. Atmos. 2003, 108. [Google Scholar] [CrossRef] [Green Version]
  78. Saarikoski, S.; Sillanpää, M.; Sofiev, M.; Timonen, H.; Saarnio, K.; Teinilä, K.; Karppinen, A.; Kukkonen, J.; Hillamo, R. Chemical composition of aerosols during a major biomass burning episode over northern Europe in spring 2006: Experimental and modelling assessments. Atmos. Environ. 2006, 41, 3577–3589. [Google Scholar] [CrossRef]
  79. Pongpiachan, S.; Iijima, A. Assessment of selected metals in the ambient air PM10 in urban sites of Bangkok (Thailand). Environ. Sci. Pollut. Res. 2016, 23, 2948–2961. [Google Scholar] [CrossRef] [PubMed]
  80. Galarneau, E. Source specificity and atmospheric processing of airborne PAHs: Implications for source apportionment. Atmos. Environ. 2008, 42, 8139–8149. [Google Scholar] [CrossRef]
  81. Font, A.; de Hoogh, K.; Leal-Sanchez, M.; Ashworth, D.C.; Brown, R.J.; Hansell, A.L.; Fuller, G.W. Using metal ratios to detect emissions from municipal waste incinerators in ambient air pollution data. Atmos. Environ. 2015, 113, 177–186. [Google Scholar] [CrossRef]
  82. Hieu, N.T.; Lee, B.K. Characteristics of particulate matter and metals in the ambient air from a residential area in the largest industrial city in Korea. Atmos. Res. 2010, 98, 526–537. [Google Scholar] [CrossRef]
  83. Weckwerth, G. Verification of traffic emitted aerosol components in the ambient air of Cologne (Germany). Atmos. Environ. 2001, 35, 5525–5536. [Google Scholar] [CrossRef]
  84. Karageorgis, A.P.; Katsanevakis, S.; Kaberi, H. Use of enrichment factors for the assessment of heavy metal contamination in the sediments of Koumoundourou Lake, Greece. Water Air Soil Pollut. 2009, 204, 243–258. [Google Scholar] [CrossRef]
  85. Almeida, S.M.; Pio, C.A.; Freitas, M.C.; Reis, M.A.; Trancoso, M.A. Source apportionment of atmospheric urban aerosol based on weekdays/weekend variability: Evaluation of road re-suspended dust contribution. Atmos. Environ. 2006, 40, 2058–2067. [Google Scholar] [CrossRef]
  86. Crawford, J.; Chambers, S.; Cohen, D.D.; Dyer, L.; Wang, T.; Zahorowski, R. Receptor modelling using positive matrix factorization, back trajectories and Radon-222. Atmos. Environ. 2007, 41, 6823–6837. [Google Scholar] [CrossRef]
  87. Lough, G.C.; Schauer, J.J.; Park, J.S.; Shafer, M.M.; Deminter, J.T.; Weinstein, J.P. Emissions of metals associated with motor vehicle roadways. Environ. Sci. Technol. 2005, 39, 826–836. [Google Scholar] [CrossRef] [PubMed]
  88. Warr, P.; Menon, J. Cambodia’s Special Economic Zones. JSEAE 2016, 33, 273–290. [Google Scholar] [CrossRef]
  89. Bhanarkar, A.D.; Rao, P.S.; Gajghate, D.G.; Nema, P. Inventory of SO2, PM and toxic metals emissions from industrial sources in Greater Mumbai, India. Atmos. Environ. 2005, 39, 3851–3864. [Google Scholar] [CrossRef]
  90. Pacyna, E.G.; Pacyna, J.M.; Fudala, J.; Strzelecka-Jastrzab, E.; Hlawiczka, S.; Panasiuk, D.; Nitter, S.; Pregger, T.; Pfeiffer, H.; Friedrich, R. Current and future emissions of selected heavy metals to the atmosphere from anthropogenic sources in Europe. Atmos. Environ. 2007, 41, 8557–8566. [Google Scholar] [CrossRef]
  91. Skodras, G.; Grammelis, P.; Samaras, P.; Vourliotis, P.; Kakaras, E.; Sakellaropoulos, G.P. Emissions monitoring during coal waste wood co-combustion in an industrial steam boiler. Fuel 2002, 81, 547–554. [Google Scholar] [CrossRef]
  92. Marcazzan, G.M.; Vaccaro, S.; Valli, G.; Vecchi, R. Characterisation of PM10 and PM2.5 particulate matter in the ambient air of Milan (Italy). Atmos. Environ. 2001, 35, 4639–4650. [Google Scholar] [CrossRef]
  93. Samara, C.; Voutsa, D. Size distribution of airborne particulate matter and associated heavy metals in the roadside environment. Chemosphere 2005, 59, 1197–1206. [Google Scholar] [CrossRef] [PubMed]
  94. Wang, J.; Hu, Z.; Chen, Y.; Chen, Z.; Xu, S. Contamination characteristics and possible sources of PM10 and PM2.5 in different functional areas of Shanghai, China. Atmos. Environ. 2013, 68, 221–229. [Google Scholar] [CrossRef]
  95. Yang, L.X.; Gao, X.M.; Wang, X.F.; Nie, W.; Wang, J.; Gao, R.; Xu, P.J.; Shou, Y.P.; Zhang, Q.Z.; Wang, W.X. Impacts of firecracker burning on aerosol chemical characteristics and human health risk levels during the Chinese New Year celebration in Jinan, China. Sci. Total Environ. 2014, 476–477, 57–64. [Google Scholar] [CrossRef] [PubMed]
  96. Pongpiachan, S. Incremental lifetime cancer risk of PM2.5 bound polycyclic aromatic hydrocarbons (PAHs) before and after the wildland fire episode. Aerosol Air Qual. Res. 2016, 16, 2907–2919. [Google Scholar] [CrossRef]
  97. Feng, J.L.; Sun, P.; Hu, X.L.; Zhao, W.; Wu, M.H.; Fu, J.M. The chemical composition and sources of PM2.5 during the 2009 Chinese New Year’s holiday in Shanghai. Atmos. Res. 2012, 118, 435–444. [Google Scholar] [CrossRef]
Figure 1. Locations of four PCD air quality observation sites, Bangkok.
Atmosphere 09 00144 g001
Figure 2. Percentage contributions of selected metals collected during FDP and NDP.
Atmosphere 09 00144 g002aAtmosphere 09 00144 g002b
Figure 3. (A) Pearson correlation analysis of 31 selected metals collected during FDP; (B) Pearson correlation analysis of 31 selected metals collected during NDP.
Atmosphere 09 00144 g003aAtmosphere 09 00144 g003b
Figure 4. Logarithms of enrichment factors for 31 selected metals collected during FDP and NDP.
Atmosphere 09 00144 g004
Table 1. Statistical description of concentrations of 31 selected metals (ng m−3) in PM10 during FDP and NDP.
FDPNDPt-Test
Conc. (ng m3)Conc. (ng m3)(p < 0.05)
Li0.852 (0.425~1.26)0.844 (0.280~1.63)NS *
Be0.0614 (0.0444~0.0766)0.0624 (0.0300~0.100)NS
Na1374 (198~2855)1339 (77.6~3006)NS
Mg263 (26.5~492)330 (109~641)NS
Al722 (N.D.~1028)883 (237~1,768)S **
K1206 (741~1969)1094 (199~2542)NS
Ca2096 (1219~2977)2794 (973~5274)S
Sc0.160 (0.0751~0.210)0.196 (0.0800~0.360)S
V5.97 (3.20~12.1)4.67 (1.38~11.15)NS
Cr2.03 (0.600~7.05)3.58 (0.220~27.10)S
Mn39.6 (20.2~64.0)41.1 (12.2~93.6)NS
Fe922 (569~1167)997 (380~1446)NS
Co.0.391 (0.212~0.546)0.393 (0.140~0.690)NS
Ni4.16 (2.18~7.30)3.16 (0.670~6.59)NS
Cu133 (85.8~264)163 (45.9~410)NS
Zn233 (123~411)189 (35.4~496)NS
As7.00 (2.35~13.3)6.32 (0.950~22.4)NS
Se3.52 (0.916~6.12)3.24 (0.590~10.4)NS
Rb5.09 (2.57~8.22)4.99 (1.27~11.0)NS
Sr8.05 (3.44~20.7)7.04 (2.63~13.7)NS
Y0.347 (N.D.~0.506)0.465 (0.220~0.870)S
Zr7.95 (5.55~11.8)8.54 (3.64~12.5)NS
Mo4.11 (0.757~15.1)5.15 (0.0300~17.6)NS
Cd1.80 (0.289~3.26)1.40 (0.260~3.89)NS
Sn9.55 (4.62~20.6)8.85 (2.26~17.5)NS
Sb10.1 (5.33~15.2)9.43 (3.01~28.8)NS
Cs0.239 (0.0347~0.458)0.237 (N.D.~0.710)NS
Ba68.1 (38.3~106)57.0 (19.5~95.6)S
Tl0.334 (0.0357~0.798)0.295 (0.0400~1.19)NS
Pb74.7 (29.2~145)47.2 (7.96~119)S
Bi1.82 (0.449~4.63)1.83 (0.310~6.89)NS
* NS: Non-significant; ** S: Significant.
Table 2. Mean ratios of selected metals representative of FDP and NDP.
Diagnostic Binary RatiosFDPNDPFDP/NDP
Pb/Ca0.0360.0172.1
Pb/Na0.0540.0351.5
Pb/K0.0620.0431.4
Pb/Fe0.0810.0471.7
Pb/Al0.100.0531.9
Pb/Mg0.280.142.0
Pb/Zn0.320.251.3
Pb/Cu0.560.291.9
Ba/Ca0.0330.0201.6
Ba/Na0.0500.0431.2
Ba/K0.0570.0521.1
Ba/Fe0.0740.0571.3
Ba/Al0.0940.0651.5
Ba/Mg0.260.171.5
Ba/Zn0.290.301.0
Ba/Cu0.510.351.5
Li/Cs3.63.561.00
Li/Tl2.62.860.89
Al/Y207718971.09
V/Ni1.41.50.97
Mn/Cs1651730.96
Mn/Tl1191390.85
Cu/Mo32321.03
Cu/Sb13170.8
Cd/Cu0.0140.00861.6
Cd/Pb0.0240.0300.8
Se/Cd2.02.30.8
Table 3. Hazard quotients, hazard indexes, and cancer risks for selected metals present in PM10 in Bangkok.
ElementsFDPNDP
Dinh-childrenDinh-adultsHQchildrenHQadultDinh-childrenDinh-adultsHQchildrenHQadultRf
Pb1.72 × 1079.67 × 1084.87 × 1052.75 × 1051.08× 1076.12 × 1083.08 × 1051.74 × 1053.52 × 103
Cr4.65 × 1092.62 × 1091.63 × 1049.17 × 1058.22 × 1094.63 × 1092.87 × 1041.62 × 1042.86 × 105
Co.8.97 × 10105.06 × 10101.57 × 1048.86 × 1059.03 × 10105.09 × 10101.58 × 1048.92 × 1055.71 × 106
Ni9.56 × 1095.39 × 1094.64 × 1072.62 × 1077.26 × 1094.09 × 1093.52 × 1071.99 × 1072.06 × 102
Zn5.34 × 1073.01 × 1071.77 × 1061.00 × 1064.34 × 1072.45 × 1071.44 × 1068.14 × 1073.01 × 101
As1.61 × 1089.07 × 1095.34 × 1053.01 × 1051.45 × 1088.19 × 1094.82 × 1052.72 × 1053.01 × 104
Cd4.13 × 1092.33 × 1094.13 × 1062.33 × 1063.21 × 1091.81 × 1093.21 × 1061.81 × 1061.00 × 103
V1.37 × 1087.73 × 1091.96 × 1061.10 × 1061.07 × 1086.04 × 1091.53 × 1068.63 × 1077.00 × 103
Mn9.09 × 1085.12 × 1086.49 × 1033.66 × 1039.44 × 1085.33 × 1086.75 × 1033.80 × 1031.40 × 105
Σ8.46 × 1074.77 × 1076.92 × 1033.90 × 1036.82 × 1073.85 × 1077.28 × 1034.10 × 103-
Dinh-children: Exposure by respiratory inhalation by children (mg kg−1 day−1); Dinh-adults: Exposure by respiratory inhalation by adults (mg kg−1 day−1); HQchildren: Hazard quotient for children; HQadults: Hazard quotient for adults; RfD: Reference dose (mg kg−1 day−1); LADD: Life Time Average Daily Dose; SFa: Slope Factor (mg kg−1 day−1); Re: Cancer risk of a given element; FDP: Firework Display Period; NDP: Non-firework Display Period.
Table 4. Life time average daily doses, slope factors, and cancer risk of given elements for selected metals present in PM10 in Bangkok.
ElementsFDPNDP FDPNDP
LADDLADDSFaRR
Pb1.27 × 1048.03 × 105---
Cr3.44 × 1066.08 × 106421.45 × 1042.56 × 104
Co.6.65 × 1076.69 × 1079.86.51 × 1066.55 × 106
Ni7.08 × 1065.37 × 1060.845.94 × 1064.51 × 106
Zn3.95 × 1043.22 × 104---
As1.19 × 1051.07 × 10515.11.80 × 1041.62 × 104
Cd3.06 × 1062.38 × 1066.41.96 × 1051.52 × 105
V1.02 × 1057.94 × 106---
Mn6.73 × 1056.99 × 105---
Σ6.26 × 1045.05 × 104-3.57 × 1044.44 × 104
Dinh-children: Exposure by respiratory inhalation by children (mg kg−1 day−1); Dinh-adults: Exposure by respiratory inhalation by adults (mg kg−1 day−1); HQchildren: Hazard quotient for children;HQadults: Hazard quotient for adults; RfD: Reference dose (mg kg−1 day−1); LADD: Life Time Average Daily Dose; SFa: Slope Factor (mg kg−1 day−1); Re: Cancer risk of a given element; FDP: Firework Display Period; NDP: Non-firework Display Period.

