Article

Atmospheric Emissions from Oil and Gas Extraction and Production in Greece

by
Georgios Papailias
* and
Ilias Mavroidis
School of Science and Technology, Hellenic Open University, 18 Aristotelous Street, 26335 Patras, Greece
*
Author to whom correspondence should be addressed.
Current address: 20 Kalogera Street, 11361 Athens, Greece.
Atmosphere 2018, 9(4), 152; https://doi.org/10.3390/atmos9040152
Submission received: 25 November 2017 / Revised: 6 April 2018 / Accepted: 12 April 2018 / Published: 18 April 2018
(This article belongs to the Special Issue Advances in Atmospheric Physics: Selected Papers from CEST2017)

Abstract

:
This paper addresses the atmospheric emissions of CO2, SO2, H2S, NOx, and volatile organic compounds (VOCs) from oil and gas extraction and production in the Gulf of Kavala. This is currently the only location of oil and gas production in Greece. Facilities are located both offshore (Kappa and Delta platforms) and onshore (Sigma plant), producing sweet gas, sour gas, and sour crude oil. This study presents the characteristics of atmospheric emissions, including emission measurements, emission inventories, and concentration measurements, from a central monitoring station and twelve total sulfation stations, the latter aiming to assess the effects of atmospheric emissions to air quality. During the development of the monitoring system, special attention was placed to sulfur compounds, since the existence of sour gas and sour crude oil was expected to lead to increased amounts of H2S and SO2. One of the main findings of the present study is that if the prevailing wind direction is considered (i.e., from N–NE), then the central monitoring station is not located downwind of the onshore and offshore facilities; therefore, its position should be re-examined. The emission inventories showed that flaring at the offshore facilities is the main source of SO2 emissions, while SO2 emissions and ambient concentrations were well below the relevant standards. Furthermore, CO2 emissions were lower by 67.73% as compared to 2008, when emissions reached a maximum. This was attributed to more energy demanding activities during that period, and mainly to the operation of turbines between 2007 and 2009. Since it is expected that the exploitation of hydrocarbons as well as oil and gas extraction and production will increase in the future in Greece, appropriate measures should be taken to ensure environmental protection, such as the use of up-to-date emission control technologies and a flare gas recovery system.

1. Introduction

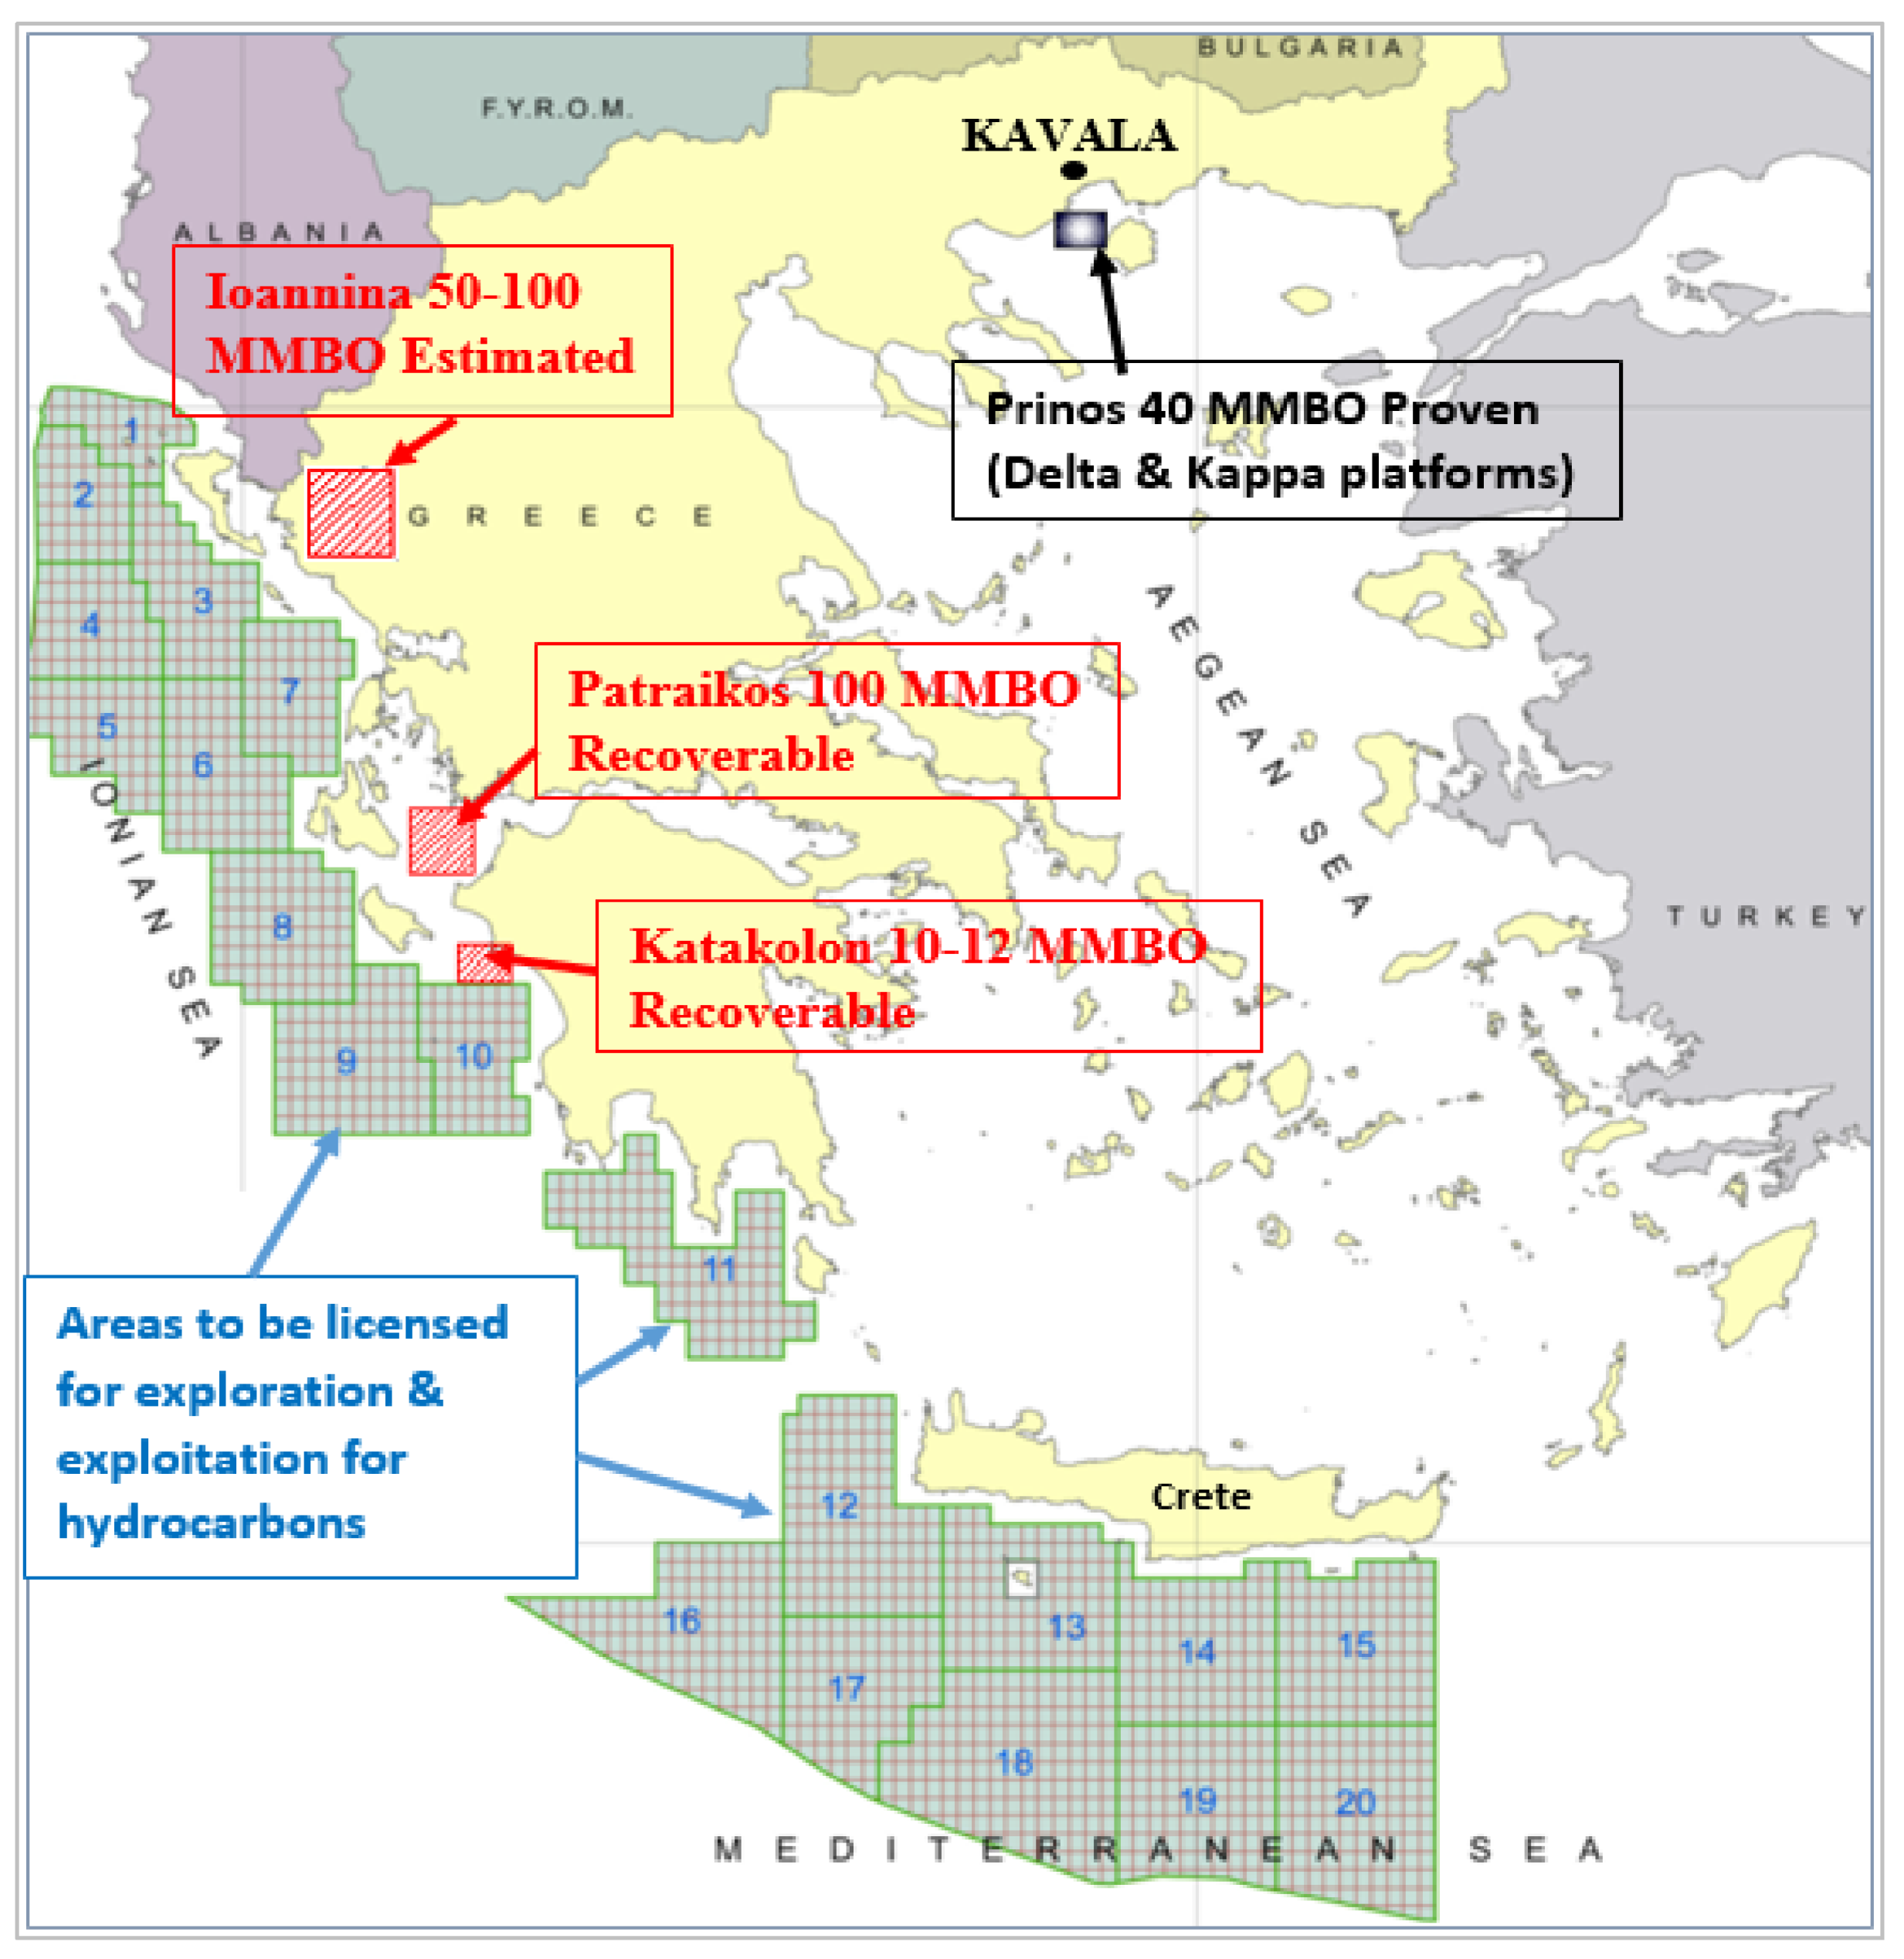
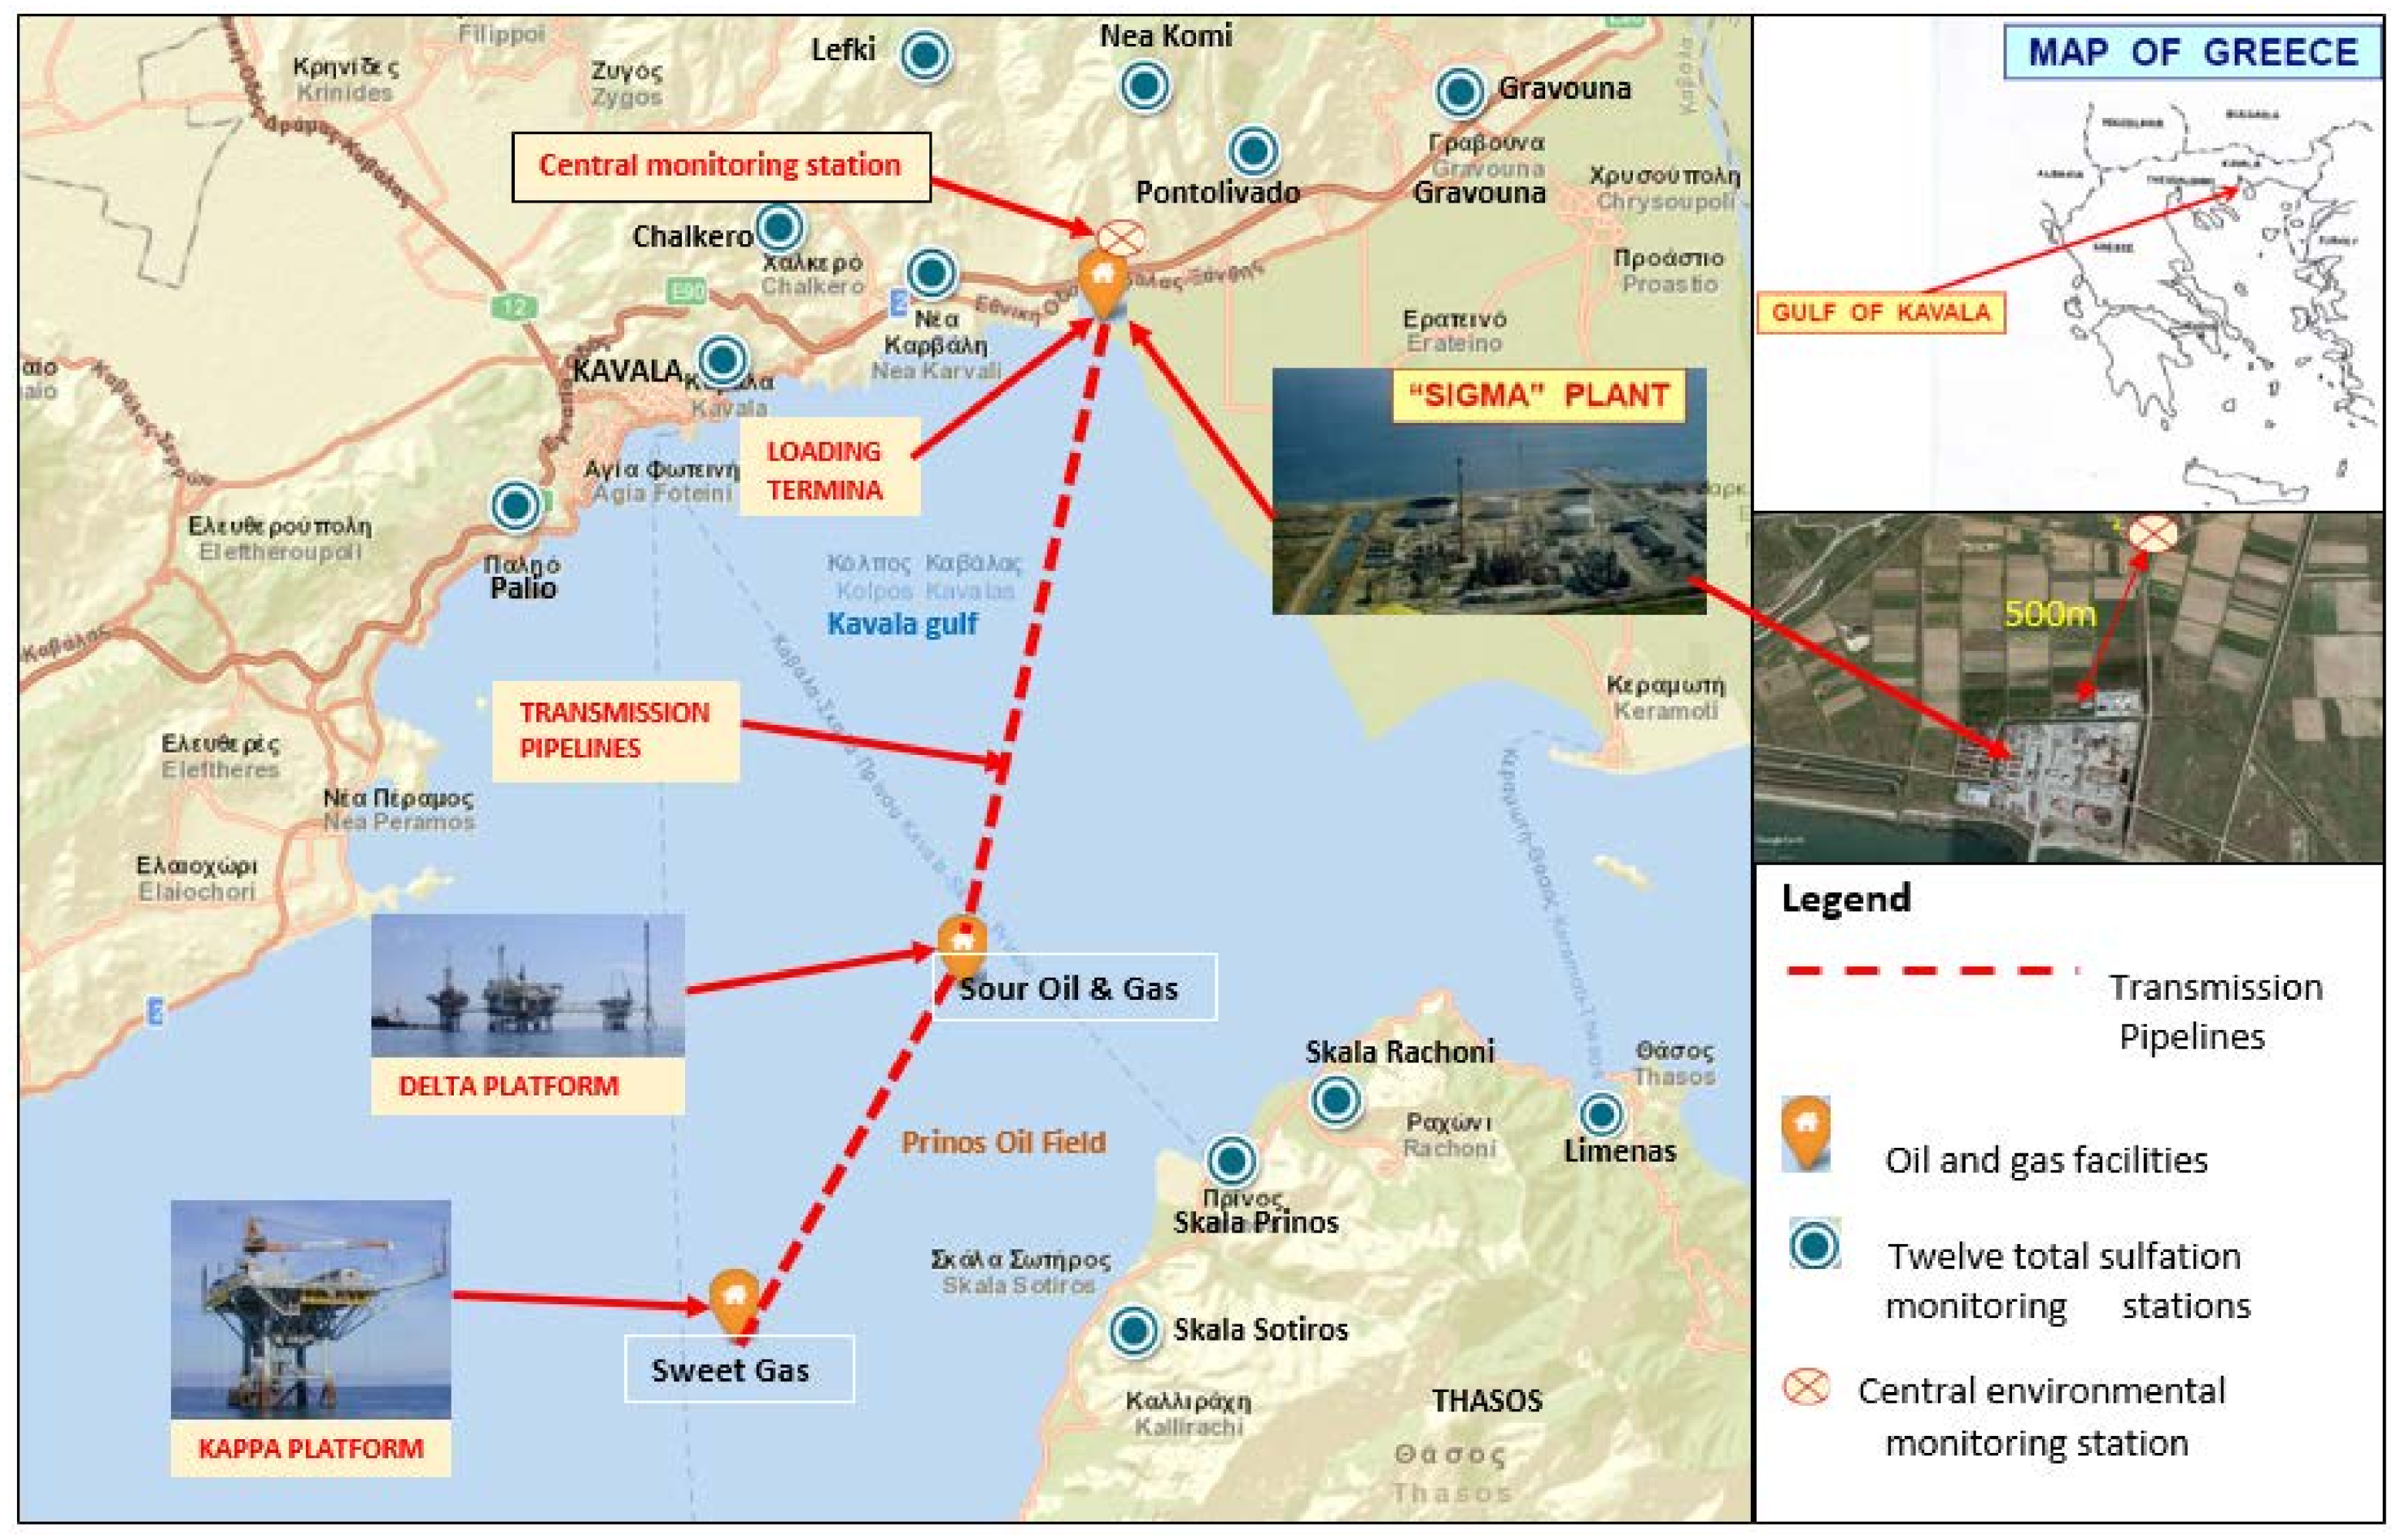
1.1. Oil and Gas Extraction and Production in Greece

Oil and gas exploration in Greece begun in 1969, when the State granted hydrocarbon exploration concession rights to a Consortium of foreign companies in the Gulf of Kavala. The first well drilling in the region took place at “EAST THASSOS-1” in 1971, while in 1972 the natural gas reservoir “SOUTH KAVALA” was discovered. Nowadays, there are three sour crude oil reservoirs in Prinos basin (Delta platform) and one sweet gas reservoir in south Kavala (Kappa platform) [1].
The present work focuses on atmospheric emissions from the facilities in 2014. In order to fully understand the potential impact of oil and gas extraction on the environment, it is important to understand the activities involved [2]. The facilities in reservoirs such as that of Prinos are developed both offshore and onshore, and the produced sour gas, sour crude oil, and sweet gas are transported through pipelines from offshore to onshore (Figure 1).
At the onshore facilities, main activities include the final processing of oil and gas streams into stabilized crude oil, natural gas, natural gas in liquid form and elemental sulfur. At the offshore facilities, the primary function of process equipment (three-phase production, separation, and glycol regeneration furnace) takes place, where the produced crude oil and gas are stabilized (first processing of oil and gas streams) in order to be transported through pipelines from offshore to onshore [3]. The total atmospheric emissions from the oil and gas production industry in 2014 in Greece originated from the facilities discussed in this paper. The average production of 2014 was 1486 bopd sour crude oil and 5,412,002 Nm3 natural gas [4]. Since then, a new investment programme has been implemented in order to increase the current crude oil production up to 20,000 bopd [5]. To this end, the Greek authorities have leased three new blocks in Western Greece: one onshore in Ioannina, and two offshore in the Gulf of Patraikos and in Katakolon (January 2015). They also invited applications for bids for 20 blocks in the Ionian Sea and south of Crete (July 2015) (Figure 2) [6].

1.2. Atmospheric Emissions from Oil and Gas Extraction

In most oil and gas facilities, initially the fluid flows naturally to the surface under pressure from the bottom hole. When the produced fluid reaches the surface, it is driven to the separation units. The crude oil is separated from the dissolved gas (associated gas) and the hydrogen sulfide (H2S) and is then stored in order to be loaded in tankers. In Prinos, the recovery of hydrocarbons is mainly achieved through the use of gas lifting. The operator injects sweet natural gas into the producing wells using gas lifting (enhanced oil recovery); as a result, the oil and gas production is increased and the produced fluid contains less hydrogen sulfide (Figure 3) [7].
The main sources of atmospheric emissions from oil and gas extraction in the Gulf of Kavala are the following:
  • exhausts from boilers, turbines, furnaces, heaters, and incinerators operating on natural gas
  • exhausts from diesel engines
  • gas flaring
  • release of hydrocarbons from gas venting (onshore storage and during the loading of crude oil) [8,9,10].
The basic energy source is natural gas, which is a blend of sweet gas from the South Kavala well (domestic), sour gas from the Prinos basin (domestic), and imported natural gas. Diesel is mainly used in internal combustion engines. Emissions into the air from the oil and gas activities consist primarily of exhaust gases and flaring, containing CO2, NOx, SO2, PM10, PM2.5, and VOCs (volatile organic compounds; CH4 and nmVOC). In addition, the most important sources of VOCs emissions are the external floating roof tanks (onshore facilities). NOx, PM2.5, and PM10 emissions are considered negligible due to the use of natural gas for power supply [10,11].
This study presents an overview of the atmospheric emissions and the concentrations of air pollutants related to the oil and gas extraction and production (onshore and offshore) facilities in the Gulf of Kavala, which are the only such facilities existing in Greece. This paper presents, analyzes, and discusses data on CO2, SO2, H2S, NOx, and VOCs provided by air quality measurements, emission measurements and emission inventories, as described in the following sections of the paper. This is the first such study in Greece and aims to provide insight into the current status of atmospheric emissions and air quality related to oil and gas extraction, as well as to identify the individual contributions of the main sources of SO2, NOx, and CO2. Such information is of special interest in order to propose appropriate management measures, including the use of novel technologies, where necessary. Furthermore, the results of this study are important not only since it is the first of its kind in Greece but also since the exploitation of hydrocarbons in Greece is expected to significantly increase in the coming years.

2. Methodology

2.1. Air Quality Measurements

The offshore and onshore facilities are located about 8 km north-west of the island of Thasos and 10 km east of the city of Kavala respectively. According to the Greek and European Union legislation, the operator must monitor and control air pollutants into the atmosphere from all oil and gas activities within approximately 100 km from the coast, in order to ensure high air quality levels and protect human health, through compliance with the concentration standards set in the legislation (Directives EU 2008/50 and 1999/30) [12,13,14,15].
For this purpose, the operator has installed an onshore air quality monitoring network, consisting of twelve total sulfation monitoring stations and one central environmental monitoring station (Continuous Emission Monitoring and Recording Systems) which is located close to the onshore facilities. The monitoring network is common for the onshore and offshore installations. The main environmental station records hydrogen sulfide (H2S), sulfur dioxide (SO2), total hydrocarbons (THC), methane (CH4), non-methane hydrocarbons (NMHC), and meteorological parameters (wind direction and speed, ambient temperature, relative humidity). In particular, sulfur dioxide concentrations are measured by the standard method of ultraviolet fluorescence EN 14121 (TÜV-Report: 936/21206773/C) [16].
The twelve total sulfation measuring stations record concentrations of sulfur compounds using a passive concentration measurement device based on the assumption that lead dioxide can oxidize sulfur gases such as sulfur dioxide, hydrogen sulfide, and mercaptans to lead sulfate (total sulfation) [17]. The average rate of sulfate formation provides a useful measure of the activity of sulfur dioxide into the atmosphere at great distances. To this end, a paste of lead dioxide and mastic alcoholic solution is placed on special surfaces which are exposed to the atmosphere for a period of one month. Then, they are treated in the laboratory with a sodium carbonate solution. The unreacted lead dioxide is filtered and its pH is adjusted at 2.5; as a result, the sulfates precipitate as boron sulfate (BaSO4). The turbidity due to the boron sulfate precipitation is measured using a spectrophotometer at 420 nm. Finally, the total sulfur is calculated using the following equation:
mg   SO 3   per   day / 100   cm 2 = mgBaSO 4 × ( M W S O 3 M W B a S O 4 ) d × α
where d is the number of days, α is the area in cm2, M W S O 3 is the molecular weight of SO3, and M W B a S O 4 is the molecular weight of BaSO4. SO3 concentrations are converted to SO2 using the conversion schemes described in the literature [18] in order to allow comparison with SO2 ambient concentration standards.

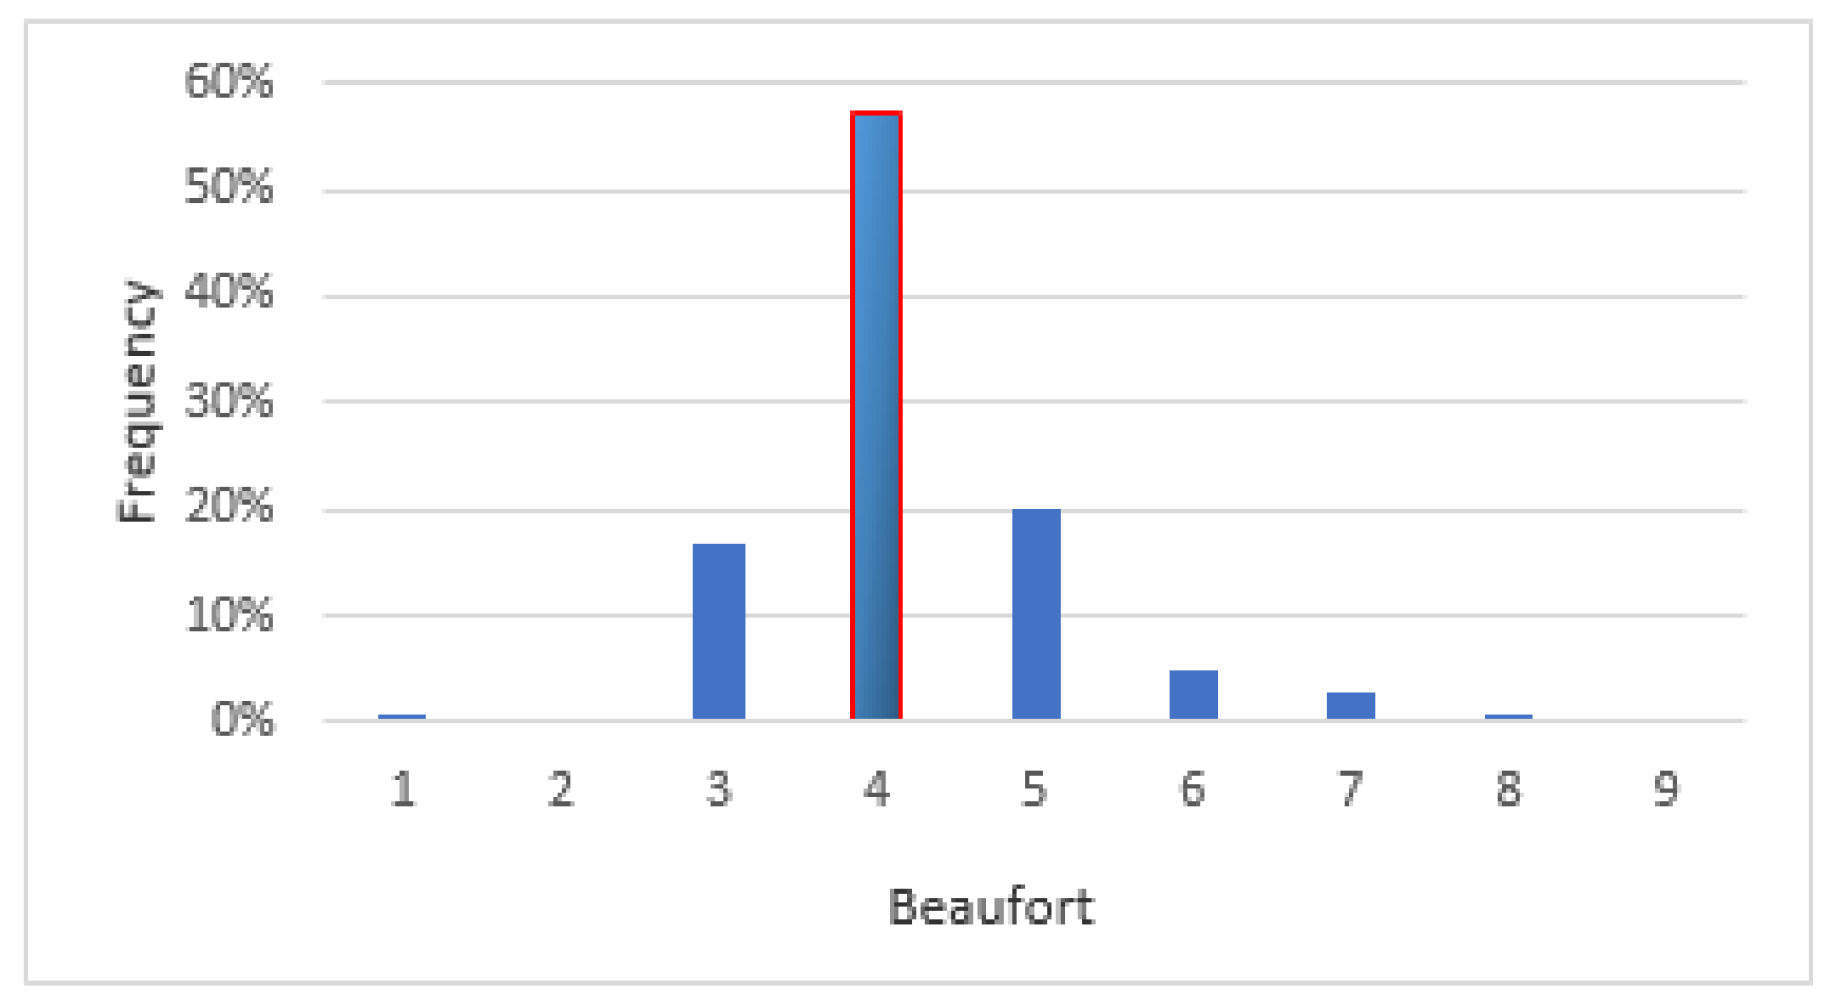
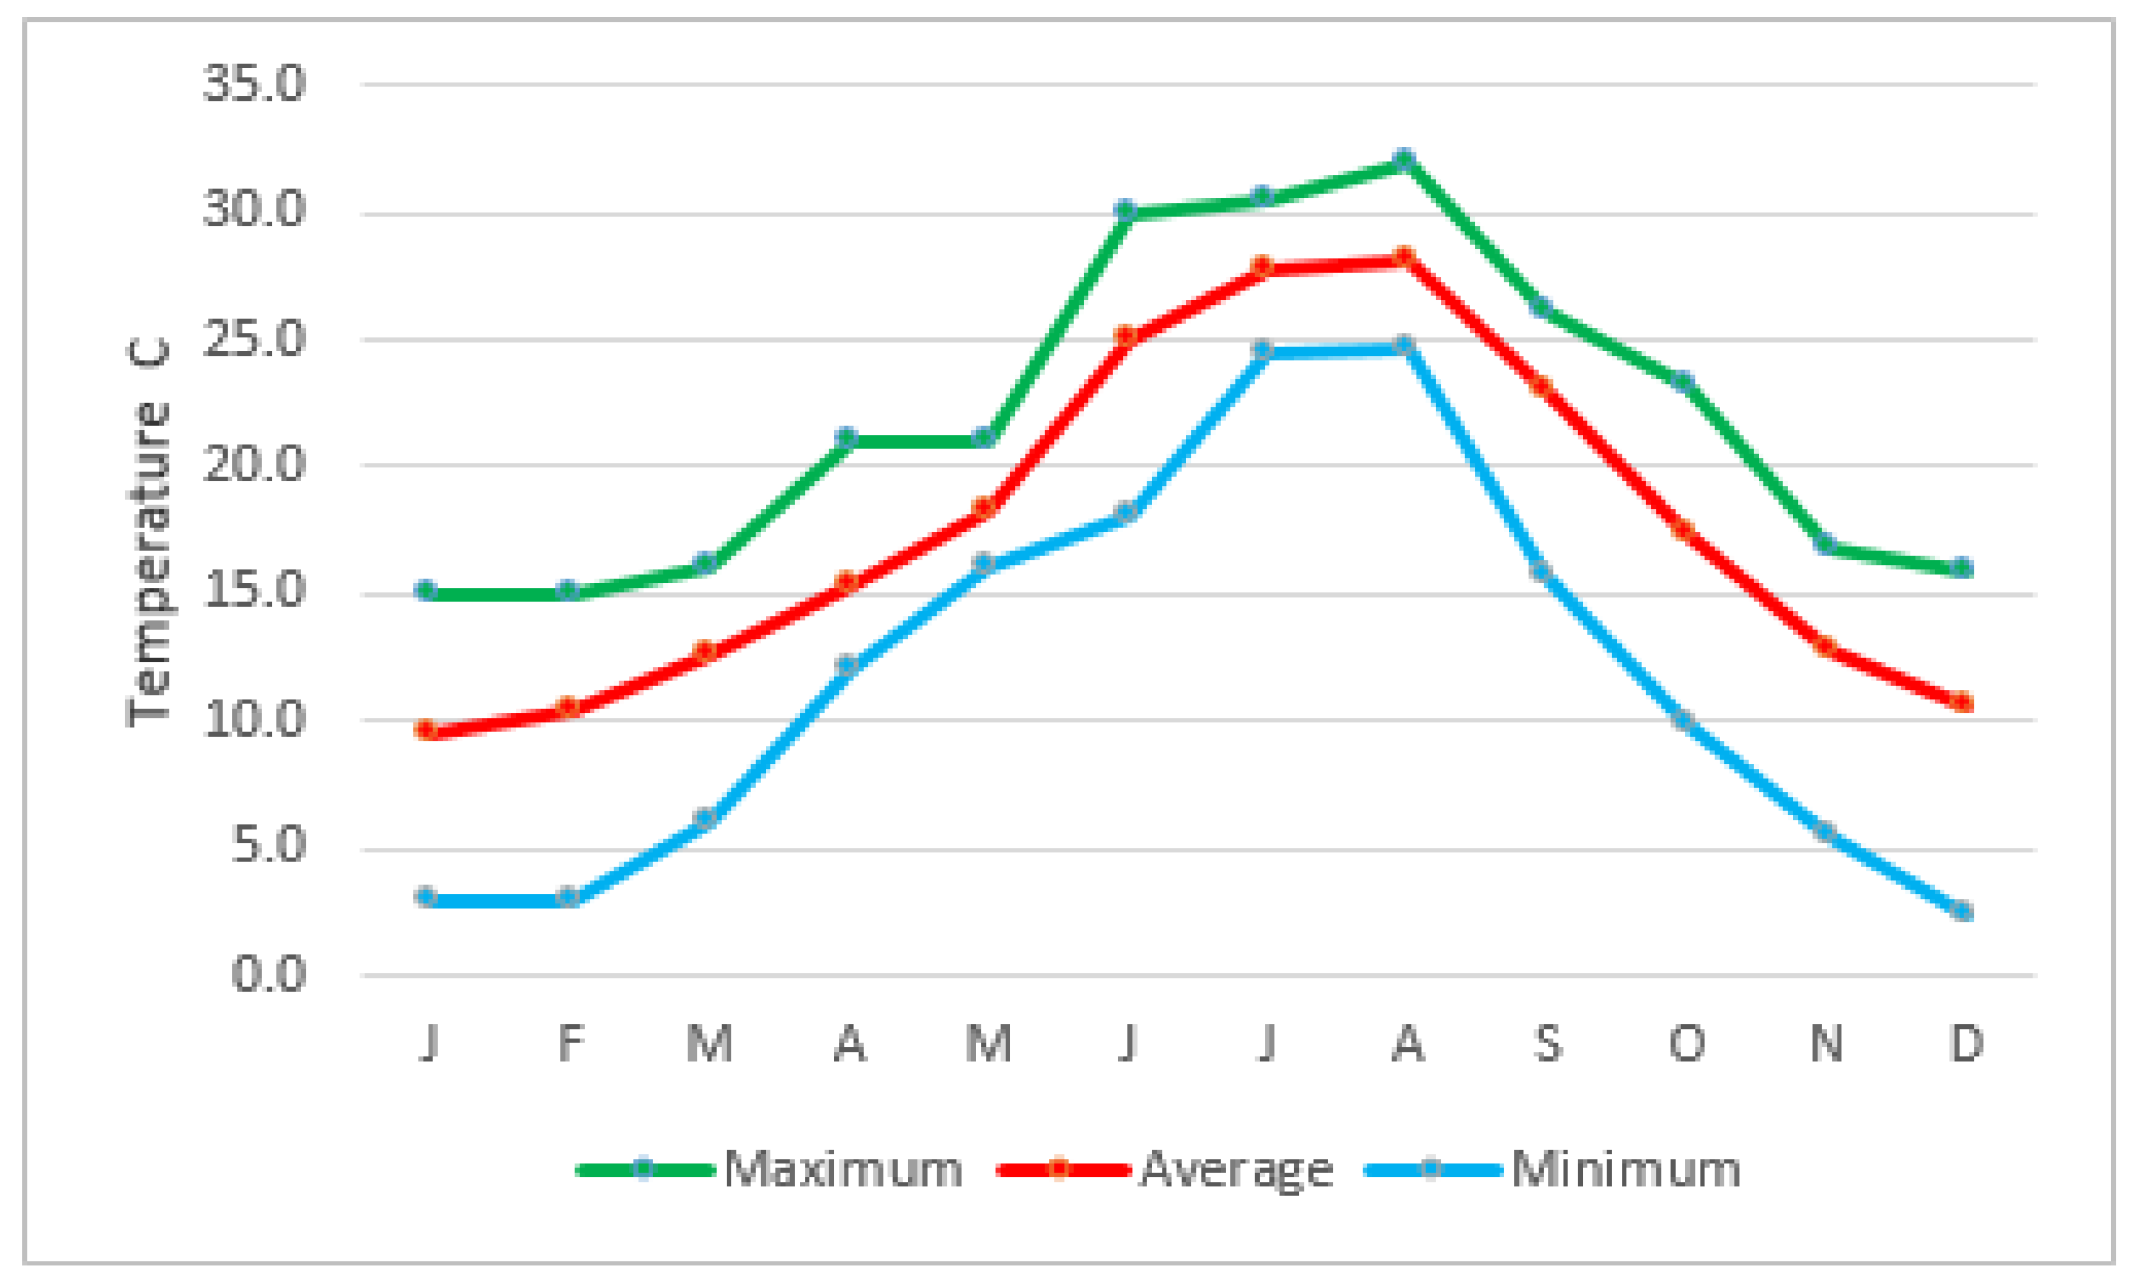
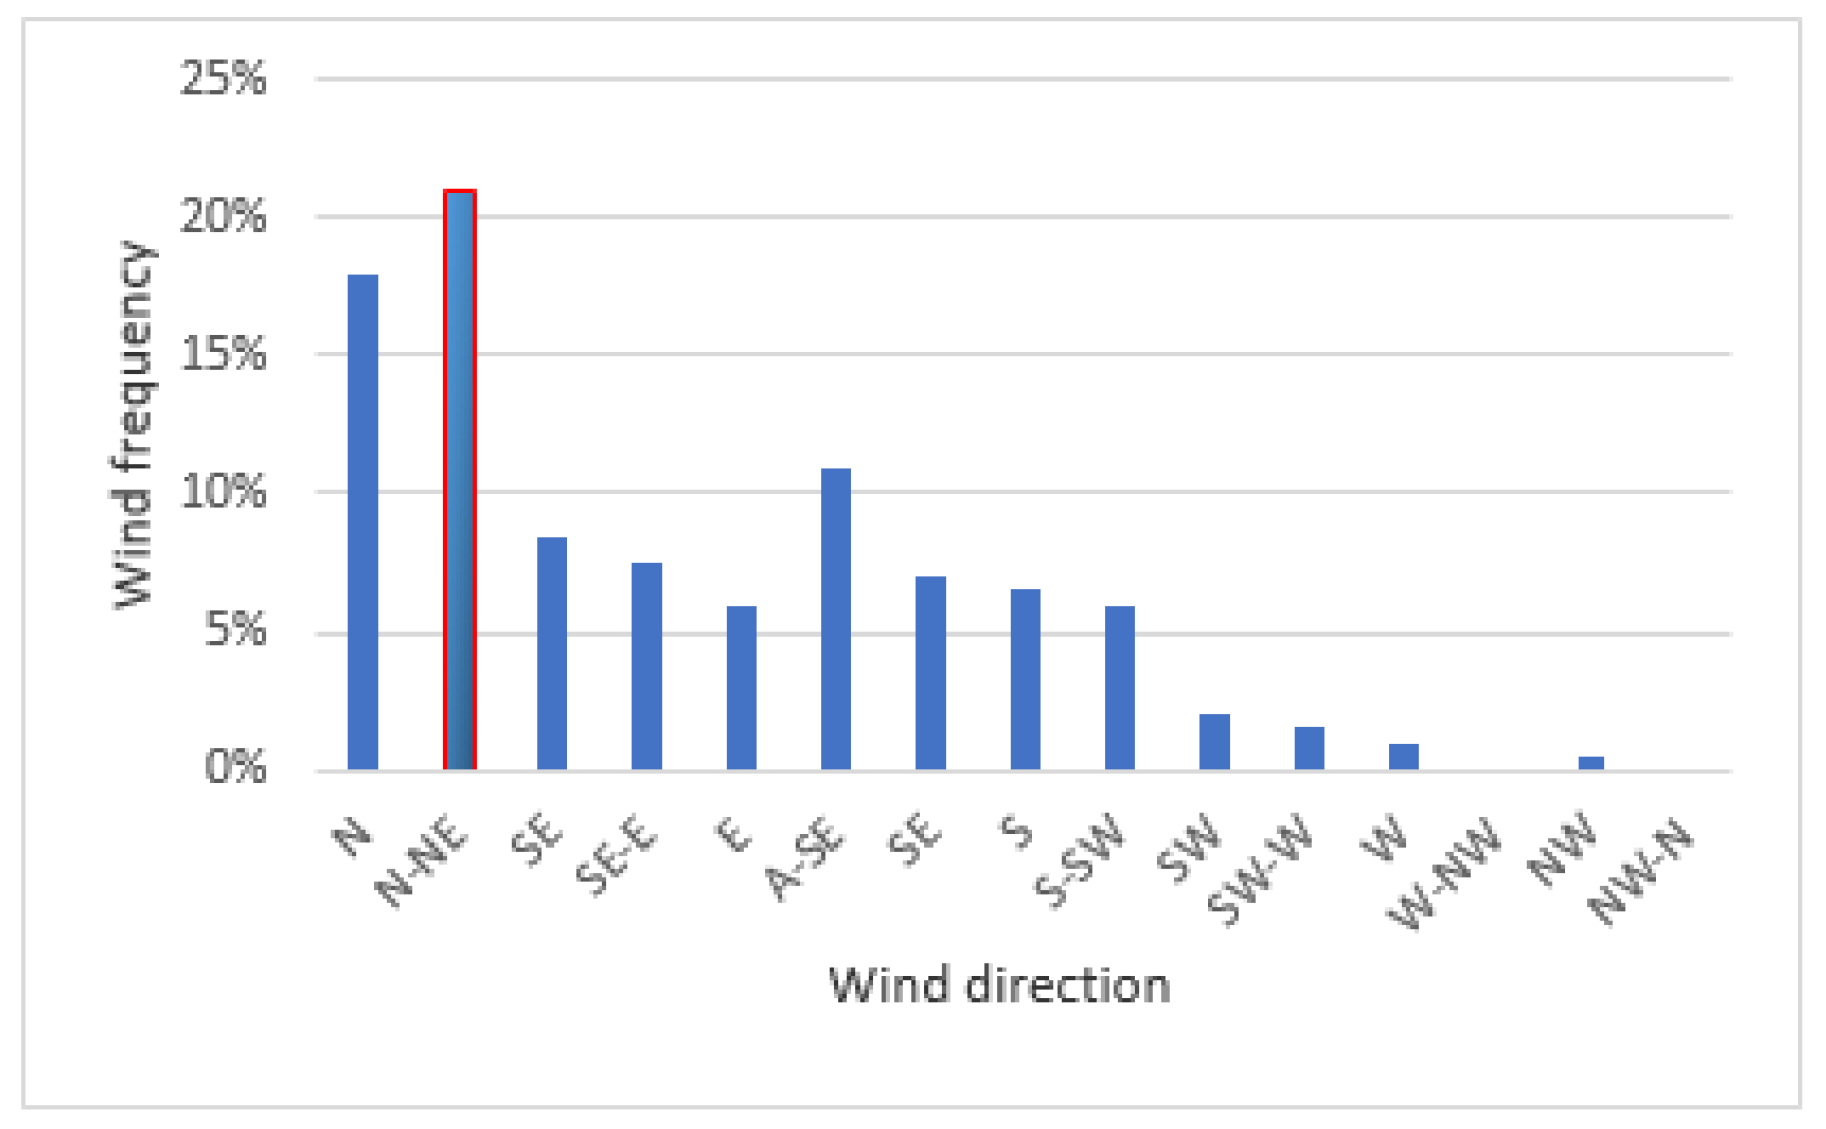
2.2. Meteorological Measurements

The region has a typical Mediterranean climate, characterized by rainy winters and dry, warm to hot summers. Meteorological measurements from the main monitoring station, averaged over a period of 5 years (2009–2013), are presented here to show the main parameters of interest for air quality. The average wind speed was approximately 4 Beaufort scale (ranging mainly between 3 and 5, i.e., between 12 km/h and 38 km/h), as shown in Figure 4. Wind speed was rarely below 0.5 km/h. The main wind direction was from north to northeast, followed by winds blowing from east to southeast (Figure 5) [11,17]. A first observation in relation to Figure 1 and Figure 5 is that if the main wind direction is considered (i.e., from N–NE) then the central monitoring station is not adequately located to capture the impact of this wind direction on pollutant concentrations downwind of the onshore and offshore facilities. This should be taken into consideration in relation to the concentrations measured at the central monitoring station, since wind fields affect the dispersion and the local and regional transport of pollutants into the atmosphere.
The annual average temperature was 16.3 °C. During the warmer period (May–September), the average maximum temperature was 31 °C while in the colder period the average minimum temperature was less than 5 °C (Figure 6).
Finally, the humidity values for the continental area ranged from 52.8 to 77.1%.

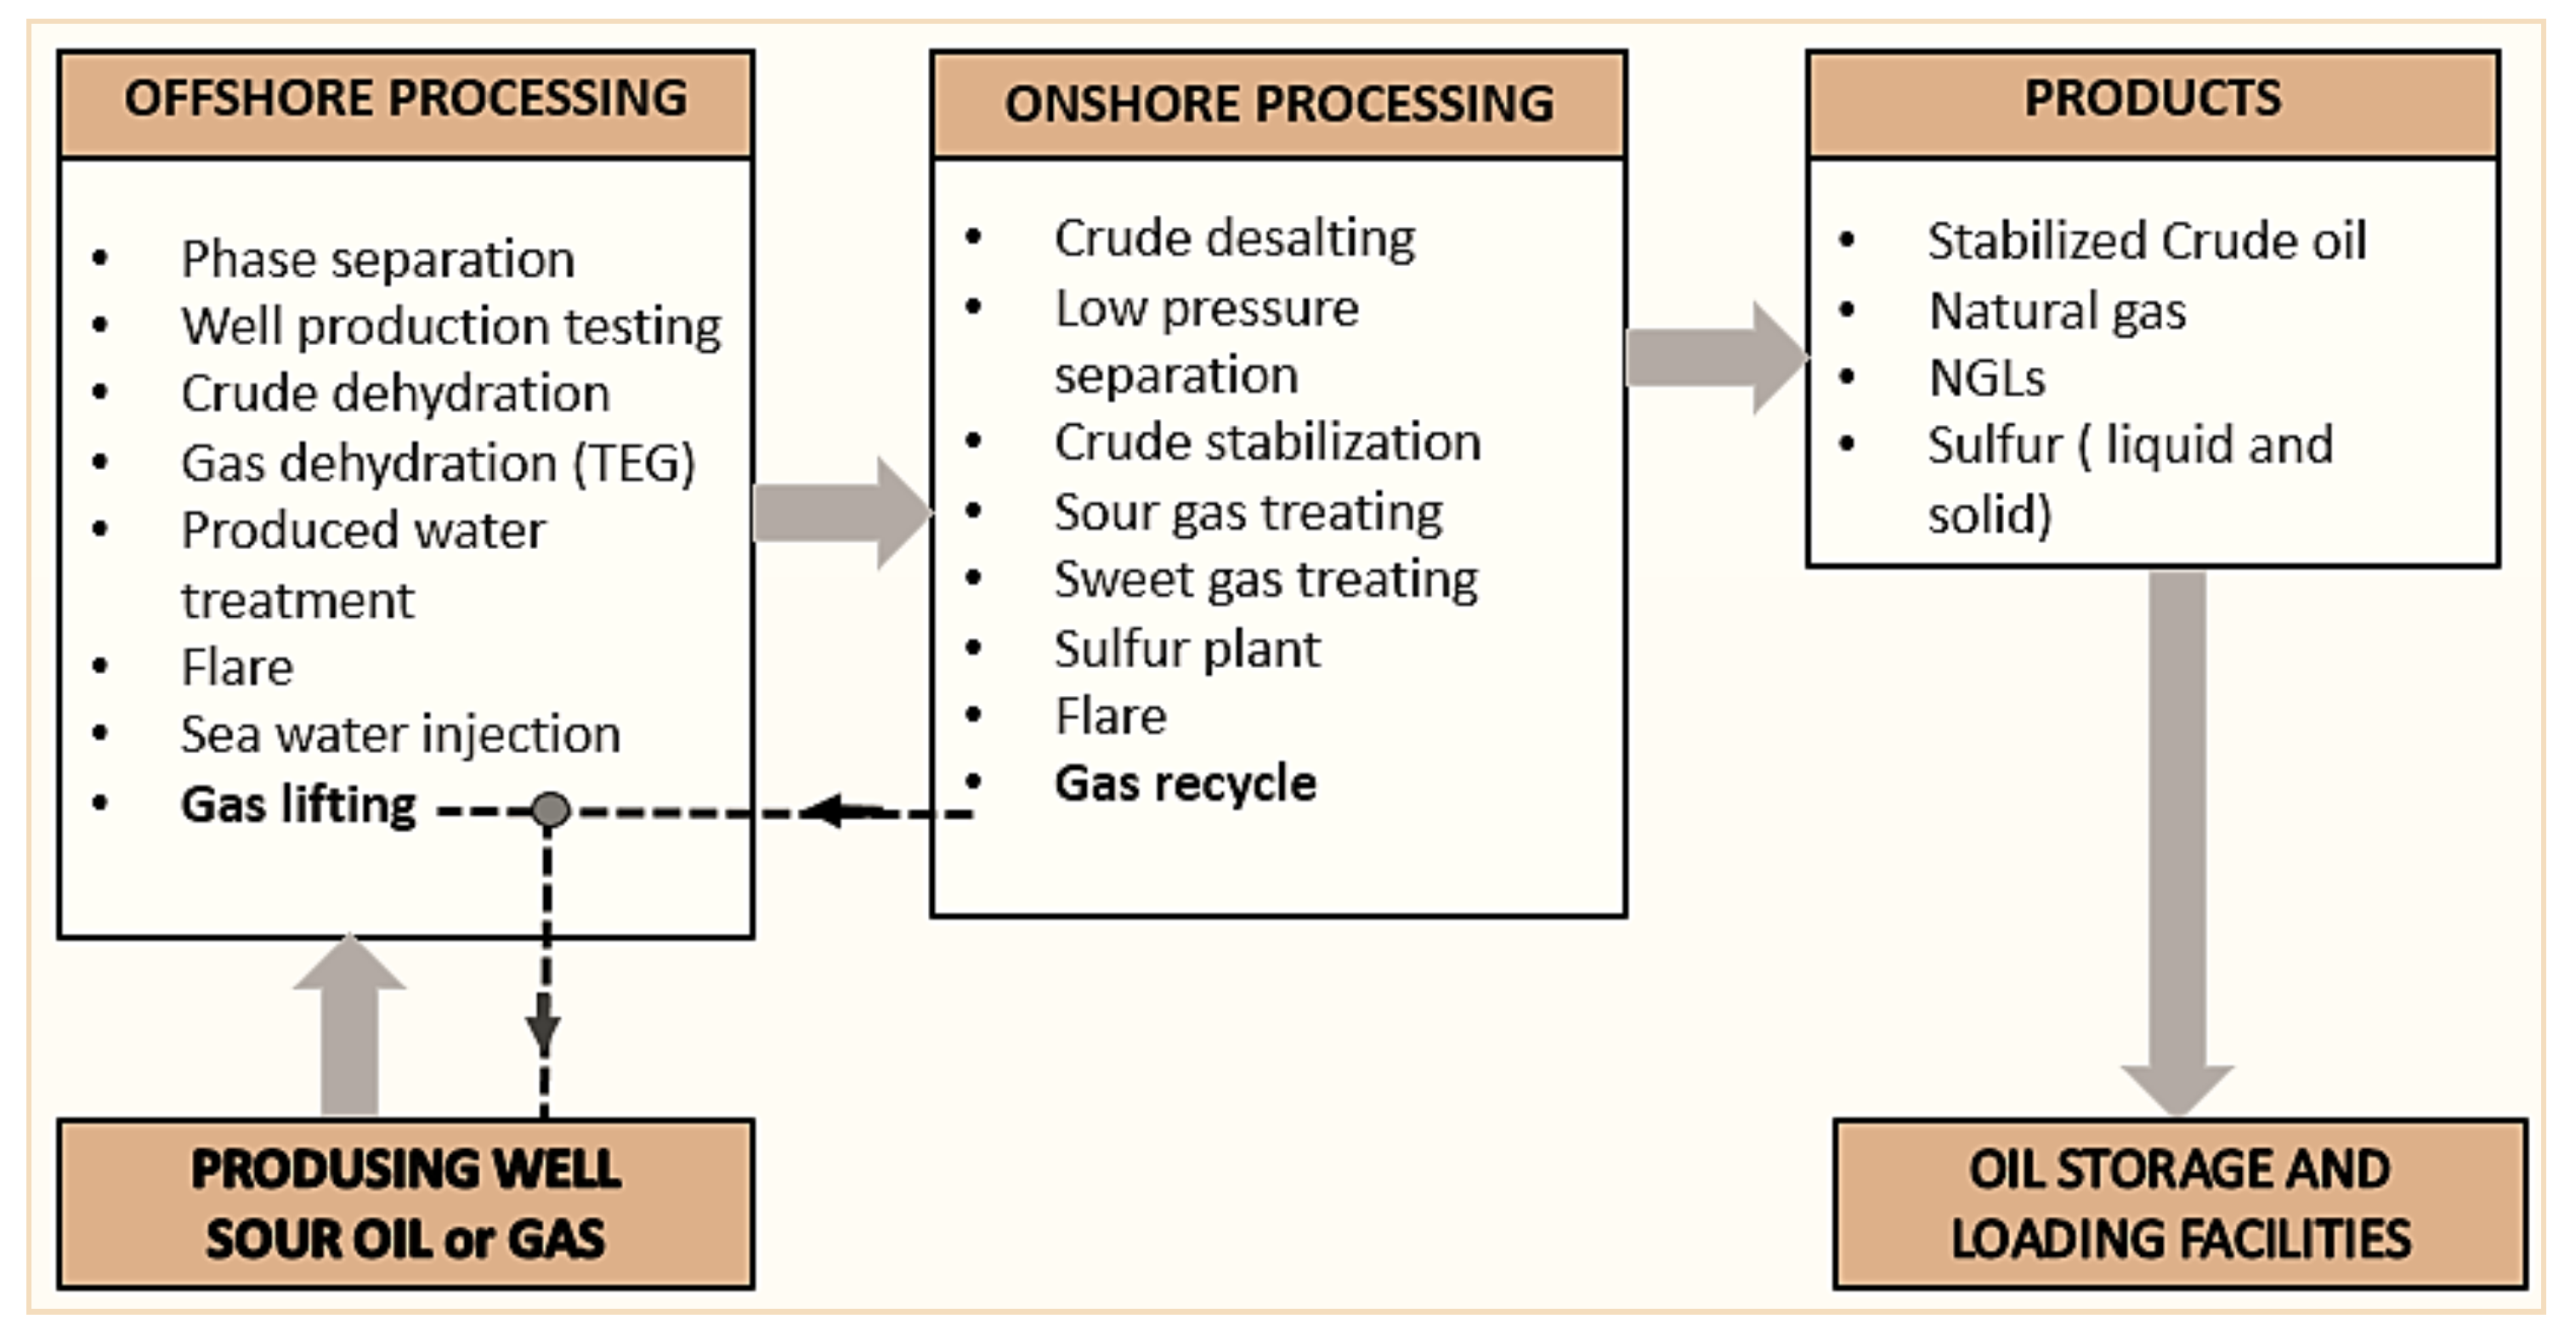
2.3. Atmospheric Emissions

The operator of the oil and gas extraction and production facility monitors, controls, and reports CO2, NOx, and SOX emissions on the basis of the internationally agreed obligations (2001/81/EU, 2003/87/EU, 2008/50/EU, and 2010/75/EU). An inventory is prepared each year, using field-specific emission factors in accordance with the requirements of the European Environment Agency and the approved monitoring program of the Hellenic Ministry of Environment and Energy for the facility [17,19,20,21,22,23].
For the emission inventories, the composition of the fuel as well as the relevant flow rates are, in general, required for equipment such as boilers, heaters, furnaces, flares, incinerators, and power generators. Design data along with chromatographic composition, including hydrocarbons and sulfur contents, as well as the monthly amount of fuel gas, were used to calculate the emission inventories of sulfur oxides and carbon dioxide. On the other hand, VOCs emissions inventories are largely based on emission factors generated from empirical and engineering studies, rather than on actual measurements [24]. Therefore, the estimates of VOCs have uncertainties inherent to the emission factors and emission models applied.
VOCs emissions occur as the result of leaks or malfunctions in equipment and as a result of gas venting from the storage and the loading of crude oil. The VOCs inventory is calculated using the API 2517 method (Table 1) [25]. The main emission sources are the following:
  • The floating roof tanks used for the storage of stabilized crude oil, with the total VOC emissions amounting to 3.61 Mt/year with a production of crude oil about 6000 bbl/day.
  • Emissions during loading crude oil into a tanker are estimated at 86.36 t per year, with a daily production of crude oil at 12,000 bbl (maximum expected production) [23].
The thermal input power of the facilities was 50 MW; therefore, the combustion of fuels in their installations (boilers, heaters, furnace, and flares) must set the emission limit values in accordance with Directive 2010/75/EU; emissions into air from the incineration of SRU (Sulfur Recovery Unit) which converts hydrogen sulfide into sulfur shall not exceed these emission limit values [26]. In particular, the SRU followed by a tail gas incinerator (for the remaining H2S removal) are considered the best available techniques (BAT). In accordance with Article 14(3) of Directive 2010/75/EU and the Implementing Decision relevant to 2014/738, the authorities set the permit conditions of SO2 emissions for the SRU installations according to the BAT conclusions [27]. Hence, a continuous monitoring system is used for undertaking direct emission measurements of SO2 and H2S in the furnace of the Sulfur Unit Incinerator. In the other furnaces of the combustion units, discontinuous measurements are contacted every semester to evaluate the quantities of SO2 and NOx present in the emission.
SO2 inventories are calculated according to the methodologies which are included in the Concawe publication report on “Air pollutant emission estimation methods for E-PRTR reported by refineries” (Table 1) [28]. The calculation of SO2 emissions in all combustion sources (excluding the incinerator) is based on the content of sulfur (S) in the fuel; all the sulfur in the fuel is converted to SO2. Continuous monitoring takes place in the furnace of the Sulfur Unit Incinerator; the total annual emissions of SO2 are calculated by the amount of pollutant emitted on a daily basis. The SO2 emission factor of the flare process at the offshore installations is equivalent to 2.79 × 10⁻³ t SO2/m3 of the produced water. On the other hand, the average value of the SO2 emission factor for the stationary combustion units of the onshore facilities is 30 ppmv S (81.24 × 10⁻⁹ t SO2/s m3) [10,11,17]. Generally, in gas flares the actual combustion efficiency is lower than 100% due to the open burning and wind conditions. The conversion of H2S to SO2 in the flare ranges from 46 to 72%, indicating that H2S was not completely converted to SO2 in the flares [29].
The flow rate and temperature of the exhaust gases at the boilers and the incinerator chimneys are monitored continuously in order to calculate the NOX emissions. The NOX concentrations for all combustion units are estimated as the average of twelve measurements per year (one measurement per month) in each exhaust system using a portable analyzer; the NOx emissions are, therefore, determined by measuring the actual NOx in each exhaust gas, based on the stoichiometric combustion equation (Table 1). The NOx emission factor is equivalent to 0.003 kg NOx/Nm3 of natural gas for all combustion engines while the NOx coefficient for turbines is equivalent to 0.006 kg NOx/Nm3 of natural gas [10,11,17].
The CO2 inventories are calculated using IPCC 2006 guidelines and the standard tier uncertainty estimation “Tier 2a” (fuel consumption from the facilities together with country-specific emission factors) [30]. Following this approach, the CO2 emissions used to estimate the annual inventory of the fuel gas domestic mixture are equivalent to 56.95 t CO2/TJ [30] (Table 2). The emission factors may vary over time, since they are associated with the composition of the fuel. Particularly, the carbon content of domestic natural gas is higher than that of the imported natural gas and, as a result, the corresponding CO2 emission factor is higher (Table 2).
It should be noted that the estimation procedures used in the inventories present uncertainties. The uncertainty associated with emission factors is very low in the case of CO2, i.e., less than 5% since plant- and country-specific emission factors are mainly applied. In the case of VOC emissions, however, (which consist of CH4 and nmVOC), the CH4 uncertainty is much higher, since IPCC default emission factors per technology/activity are applied [31].

3. Results and Discussion
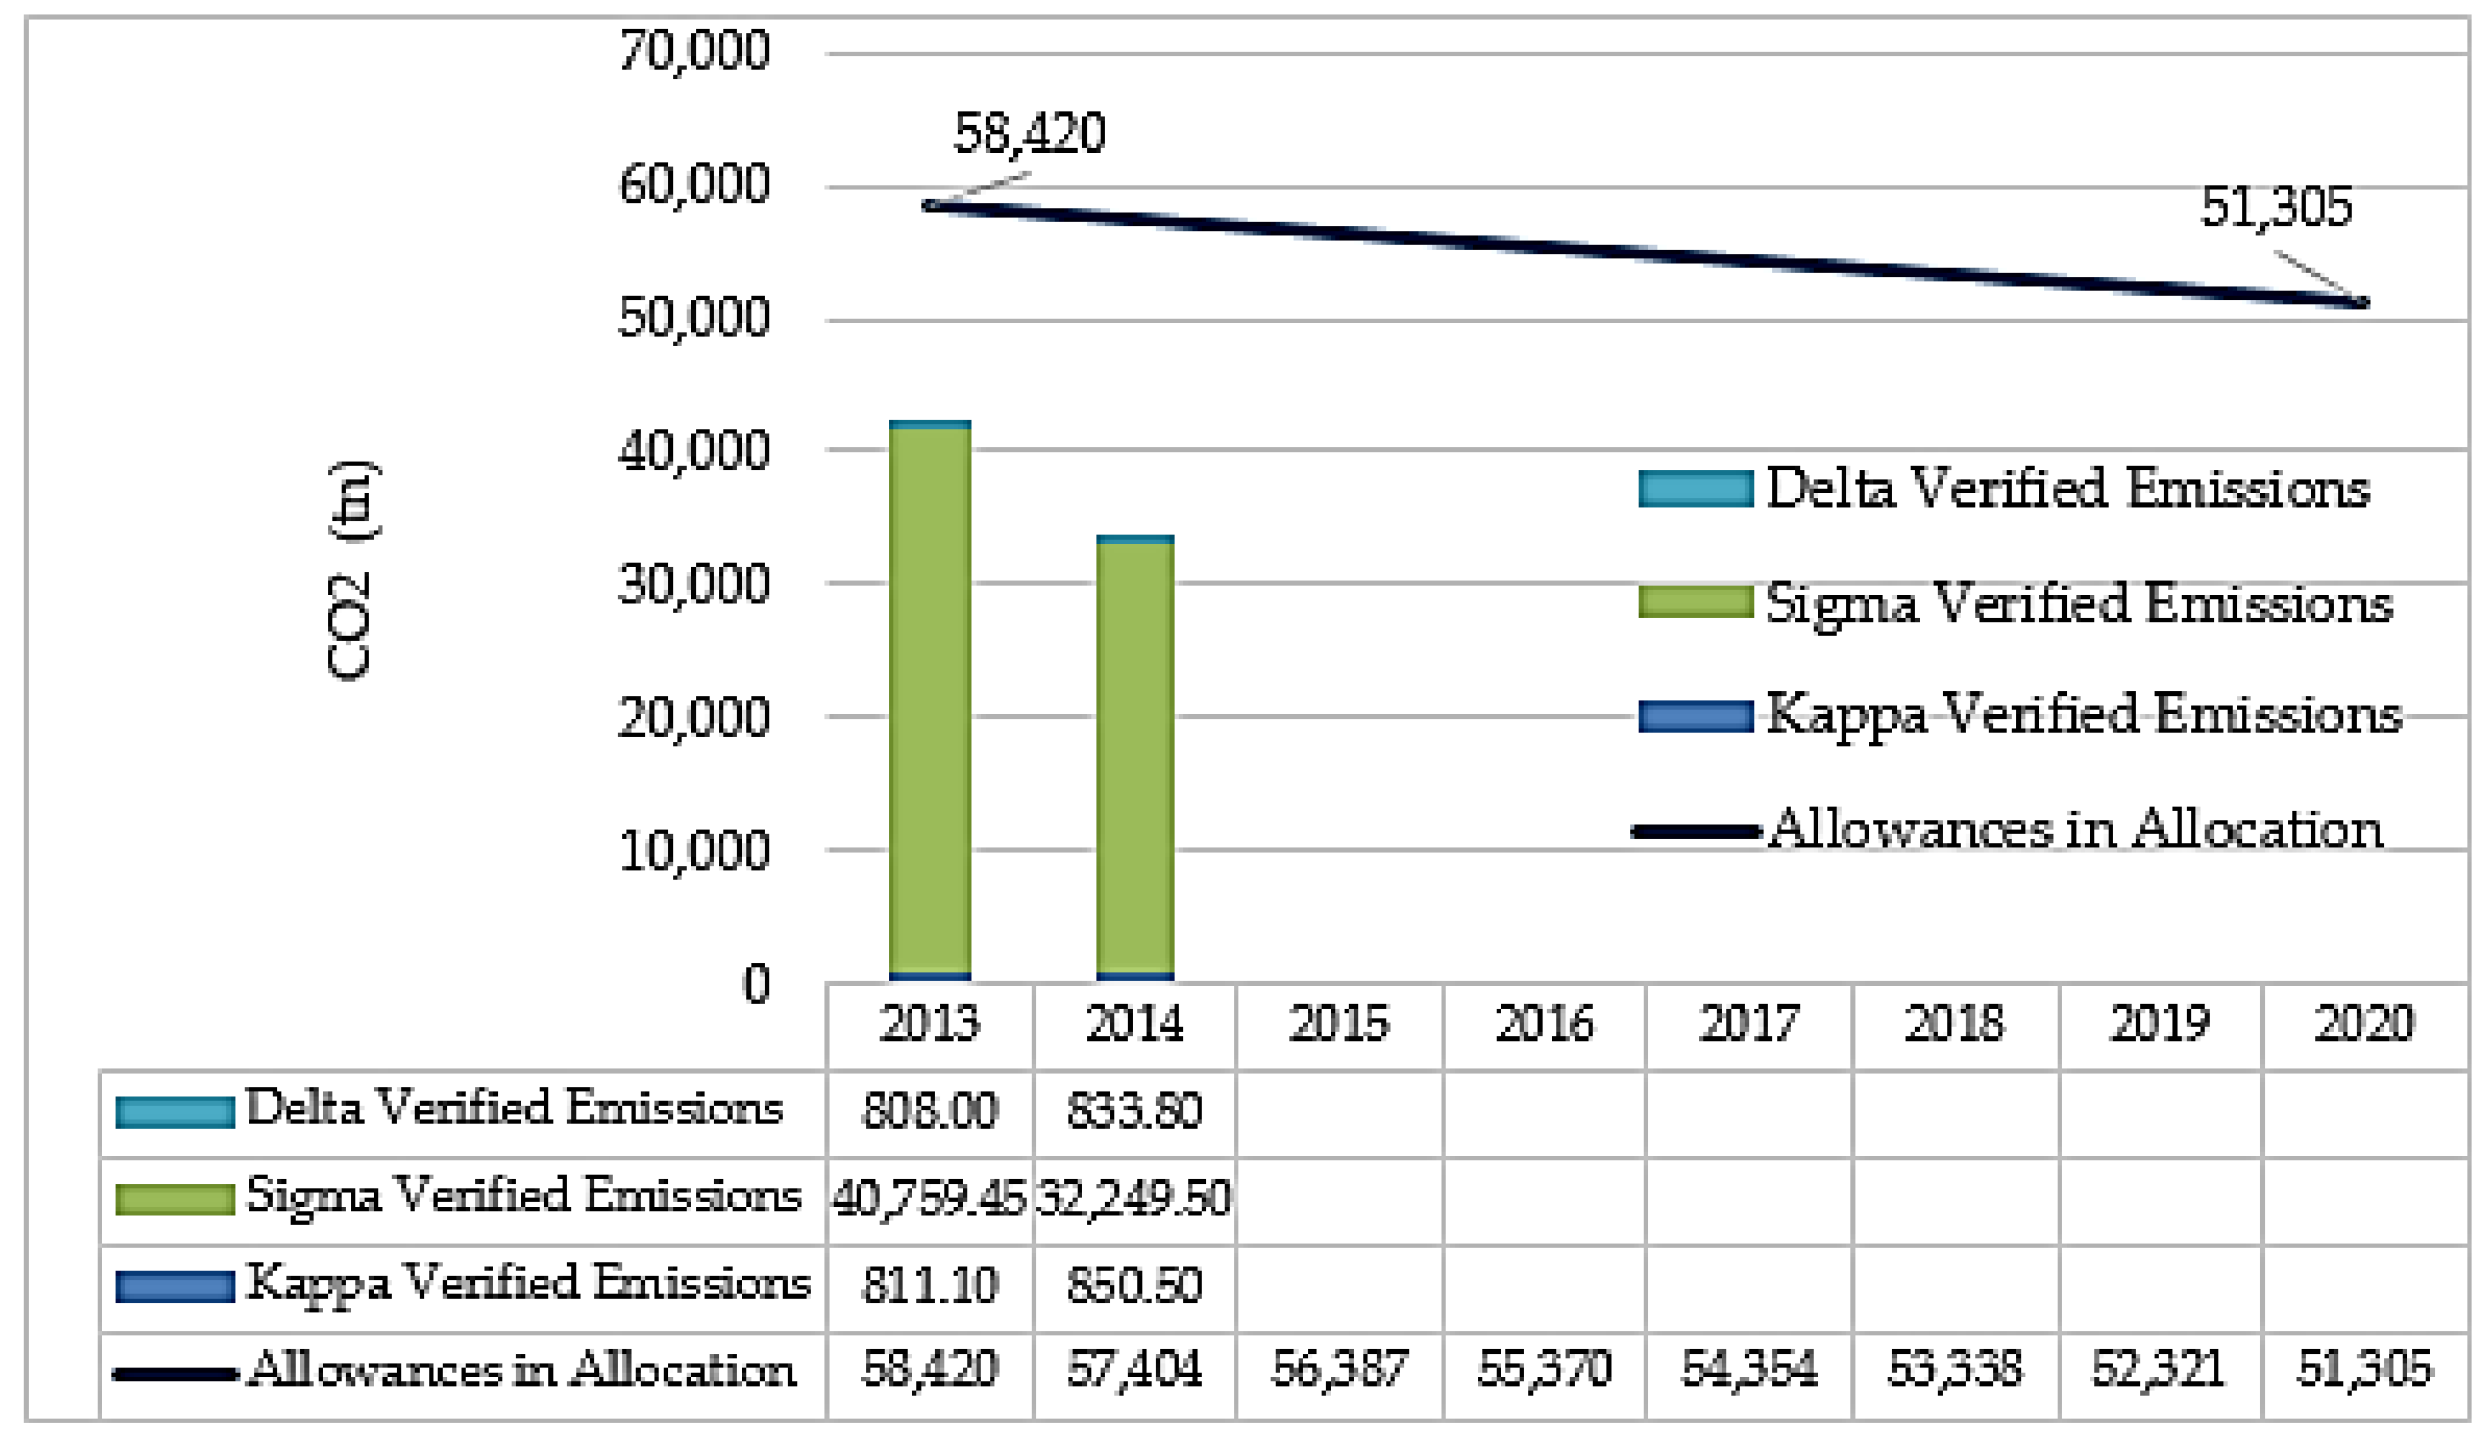
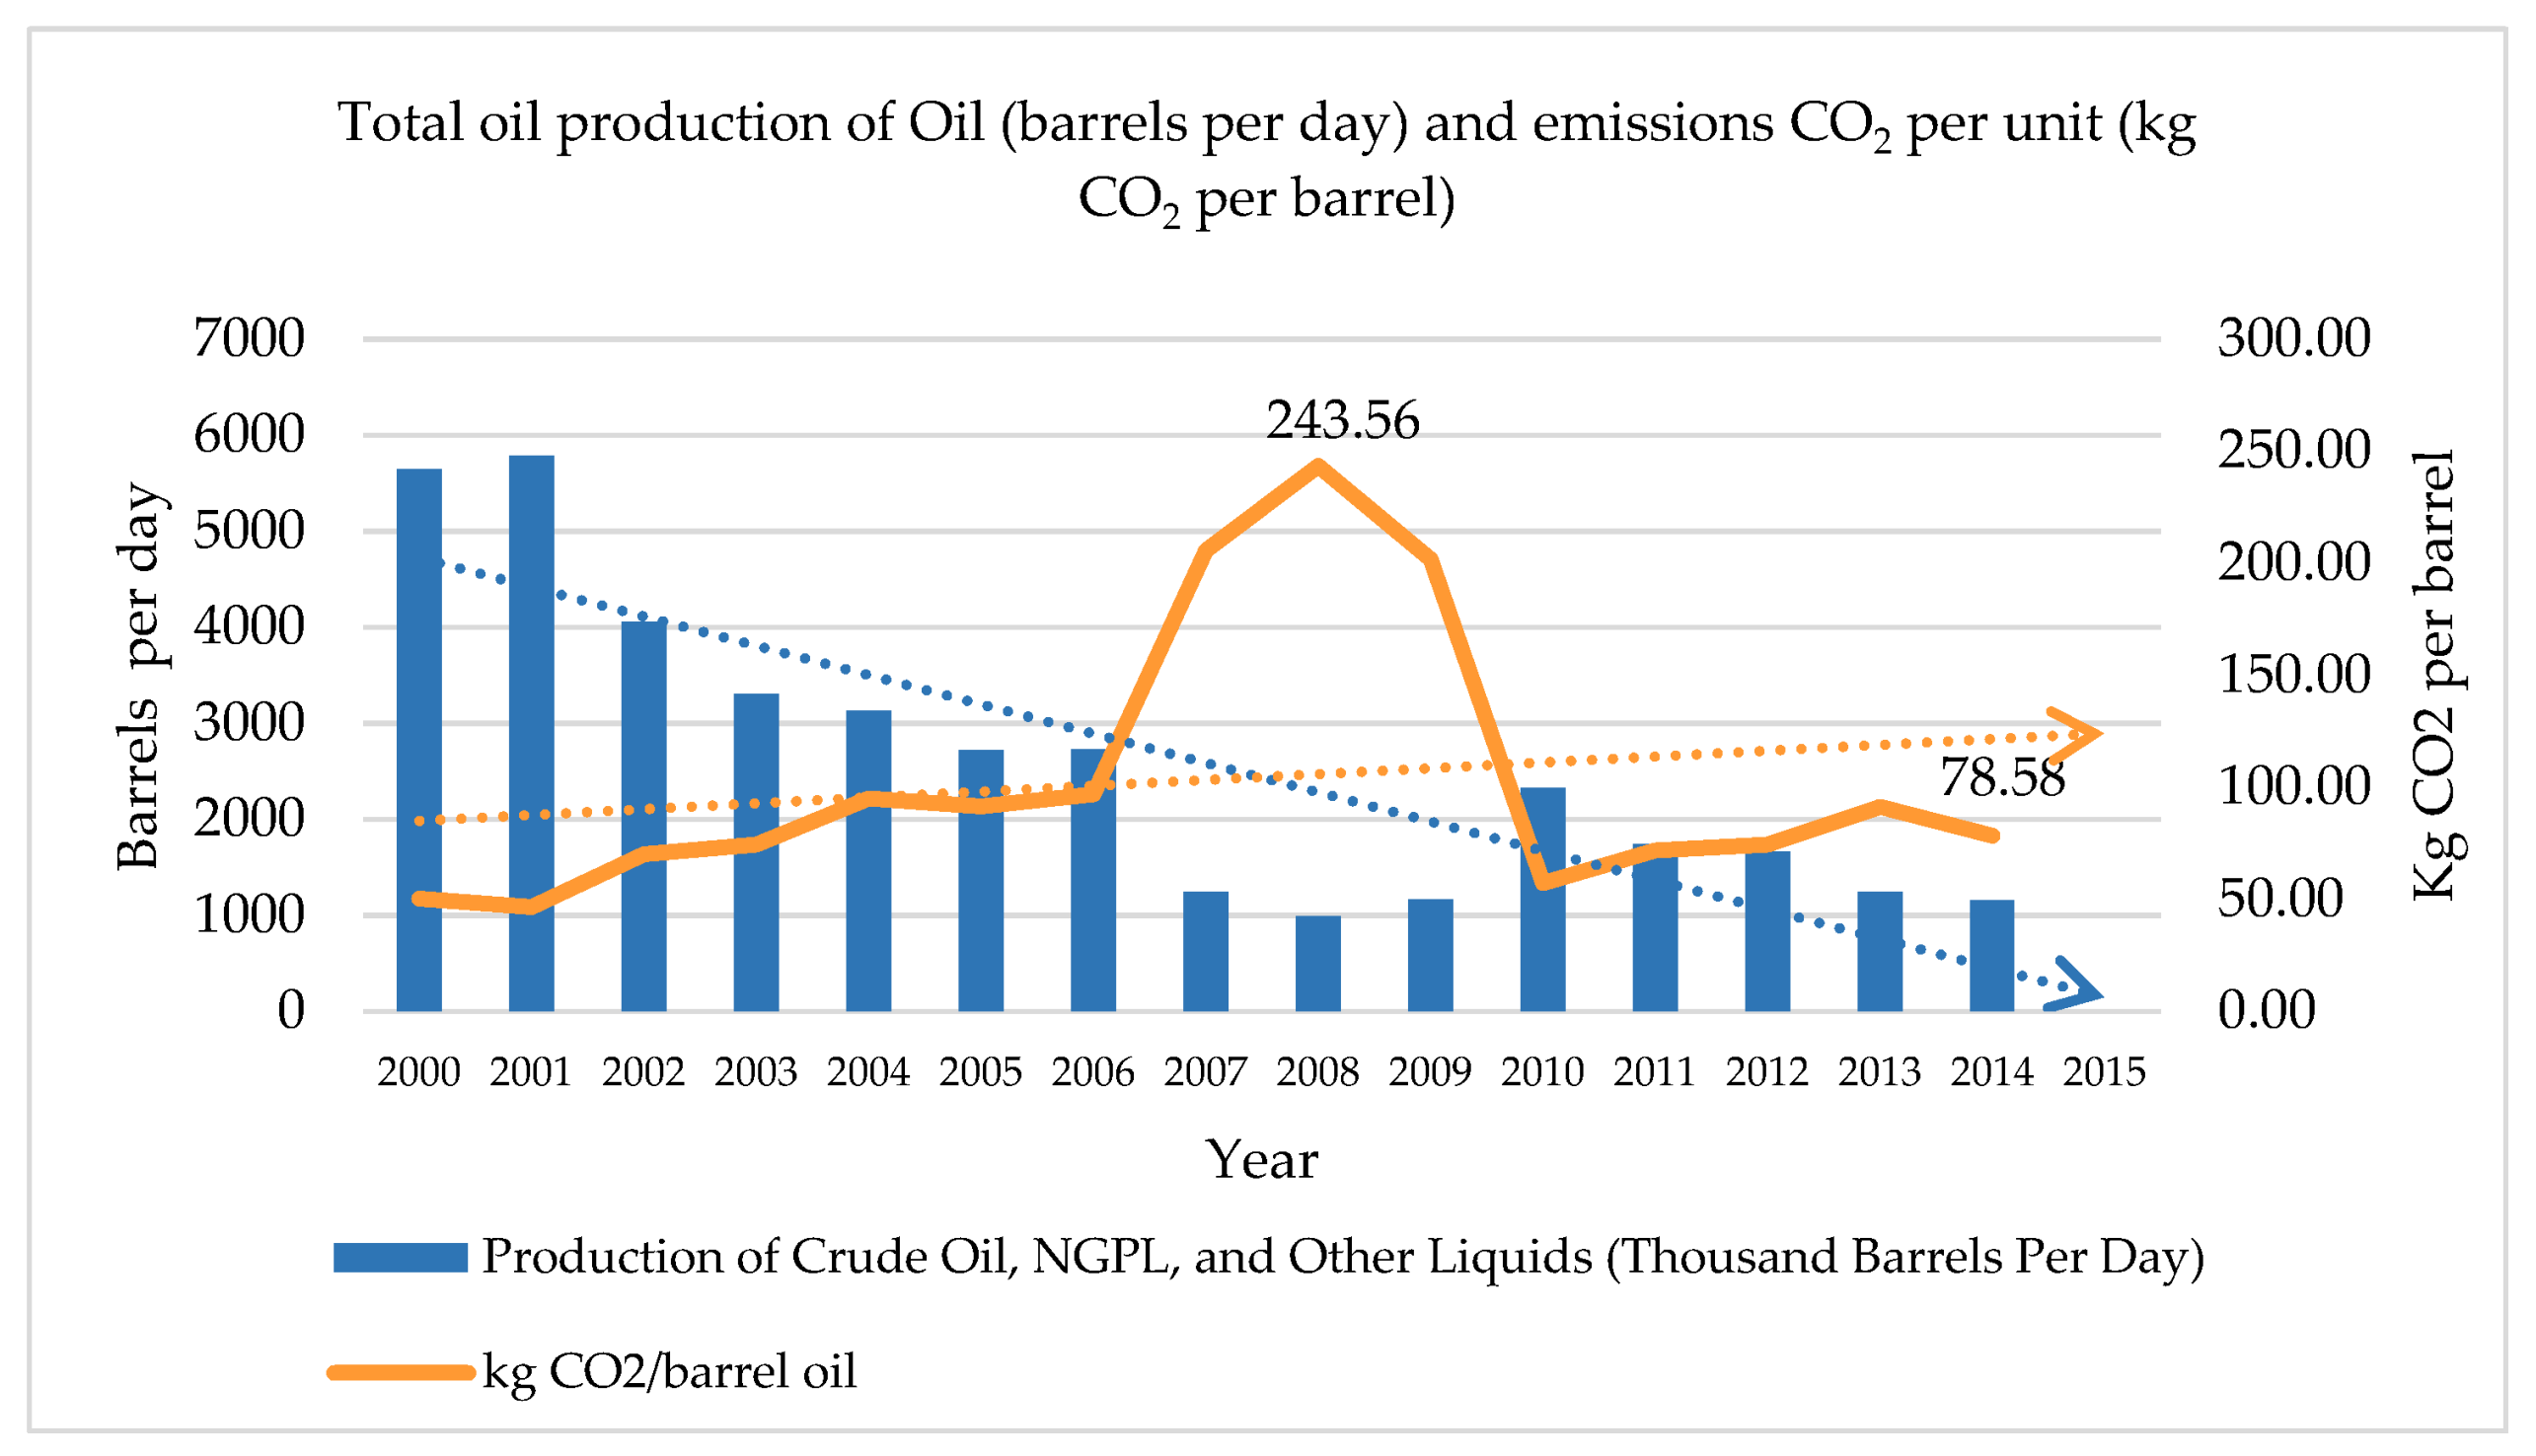
3.1. CO2 Emissions

CO2 is the greenhouse gas (GHG) most commonly produced by oil and gas activities. The energy sector has contributed by 78.61% to the total national GHG emissions for the year 2012 (without Land Use, Land-Use Change and Forestry—LULUCF), increased by approximately 13.73% compared to 1990 levels [30].
The European Union has set a target of reducing greenhouse gas emissions by 20% by 2020 (2020 package) and 40% by 2030 as compared with 1990 levels. To achieve the at least 20% target, the EU has established an emissions trading system (ETS) based on the “cap and trade” principle. This aims at reducing greenhouse gas emissions from installations covered by the system, including those from large-scale facilities in the power and industry sectors. As a member of the EU, Greece is required to report greenhouse emissions (inventories) to the European Unit Transaction Log annually [32,33].
The operator of the facilities holds a greenhouse gas emissions permit in effect, i.e., a license to operate and emit greenhouse gases covered by the EU ETS. Under the EU ETS, the operator is required to submit verified emissions data for each year to Greek registry. Data of the air emission inventory of 2014 became publicly available on the European Union Transaction Log (EUTL) on 1 April 2015. The annual greenhouse gas emissions from the facilities in the gulf of Kavala were 33,933.8 t CO2 in 2014 (Figure 7), as verified by authorized external auditors (TUV Austria Hellas), according to Regulations 600/2012/EC and 601/2012/EU. The emissions of greenhouse gases from the offshore facilities (Delta complex and Kappa) during 2014 were 1684.3 t CO2, which equals to 4.82% of the total emissions (Figure 7) [4].
The quantity of allowances issued each year appears to decrease in a linear manner, beginning from the mid-point of the period from 2008 to 2012. More specifically, the quantity of allowances decreases by a linear factor of 1.74% compared to the average annual total quantity of allowances in accordance with the Commission Decisions on national allocation plans for the period from 2008 to 2012 (Directives 2003/87 and 2009/29). In 2014, the CO2 emissions accounted for less than the allowances, confirming that the greenhouse gas emission reduction commitment requirements until 2020 are met by the facilities in the Gulf of Kavala (Figure 7).
While Figure 7 presents the total CO2 emissions from the facilities, Figure 8 presents the historical trend of direct and indirect CO2 emissions per barrel of hydrocarbons delivered per day, for the 2000–2014 period, in relation to the production of crude oil and other liquid fuels [30,34]. The data from the period 2000 to 2014 revealed that the trend of oil production was linearly decreasing, while CO2 emissions were in general increasing for the same period. Furthermore, emissions of CO2 decreased by 67.73% for 2014 as compared to CO2 emissions in 2008, a year where emissions had peaked [30].
In 2014, the CO2 emission intensity of the Greek oil and gas extraction is significantly higher than the worldwide average. Although the world average was around 130 kg CO2 per ton oil equivalent (TOE), the average for Greece in 2014 was 433 kg CO2 per ton oil equivalent (or 78.58 kg per barrel), and in 2008 it was 1719 kg CO2 per ton oil equivalent (or 243.56 kg per barrel) (Figure 8) [35]. For the calculations, the default oil industry conversions for 27° API oil gravity (7.2 barrels per metric ton) are used [36]. The CO2 emissions from the combustion of oil were approximately 3000 kg per toe [37]. During 2007, 2008, and 2009, oil production was quite low (Figure 8). On the other hand, CO2 emissions presented maximum values. One possible reason could be that more energy was required to extract the oil and gas from the reservoir due to more energy demanding activities [37], as well as the fact that during these years, turbines were operated (both electricity and heat). In 2010, the operator decided to close all the turbines in order to cover the energy demand with natural gas provided by the Public Gas Corporation (DEPA) for financial and technical reasons [11].
International literature on emissions from the oil and gas industry generally confirm that turbines are major contributors to carbon dioxide (CO2) emission from offshore installations. For example, on the Norwegian Continental Shelf, turbines contributed by 79.4% to the total CO2 emissions in 2014 [38]. This confirms the strong link between the fact that there was an increase in the annual CO2 emissions for the period 2007–2009—albeit the decrease in oil production—and the operation of gas turbines during that same period.

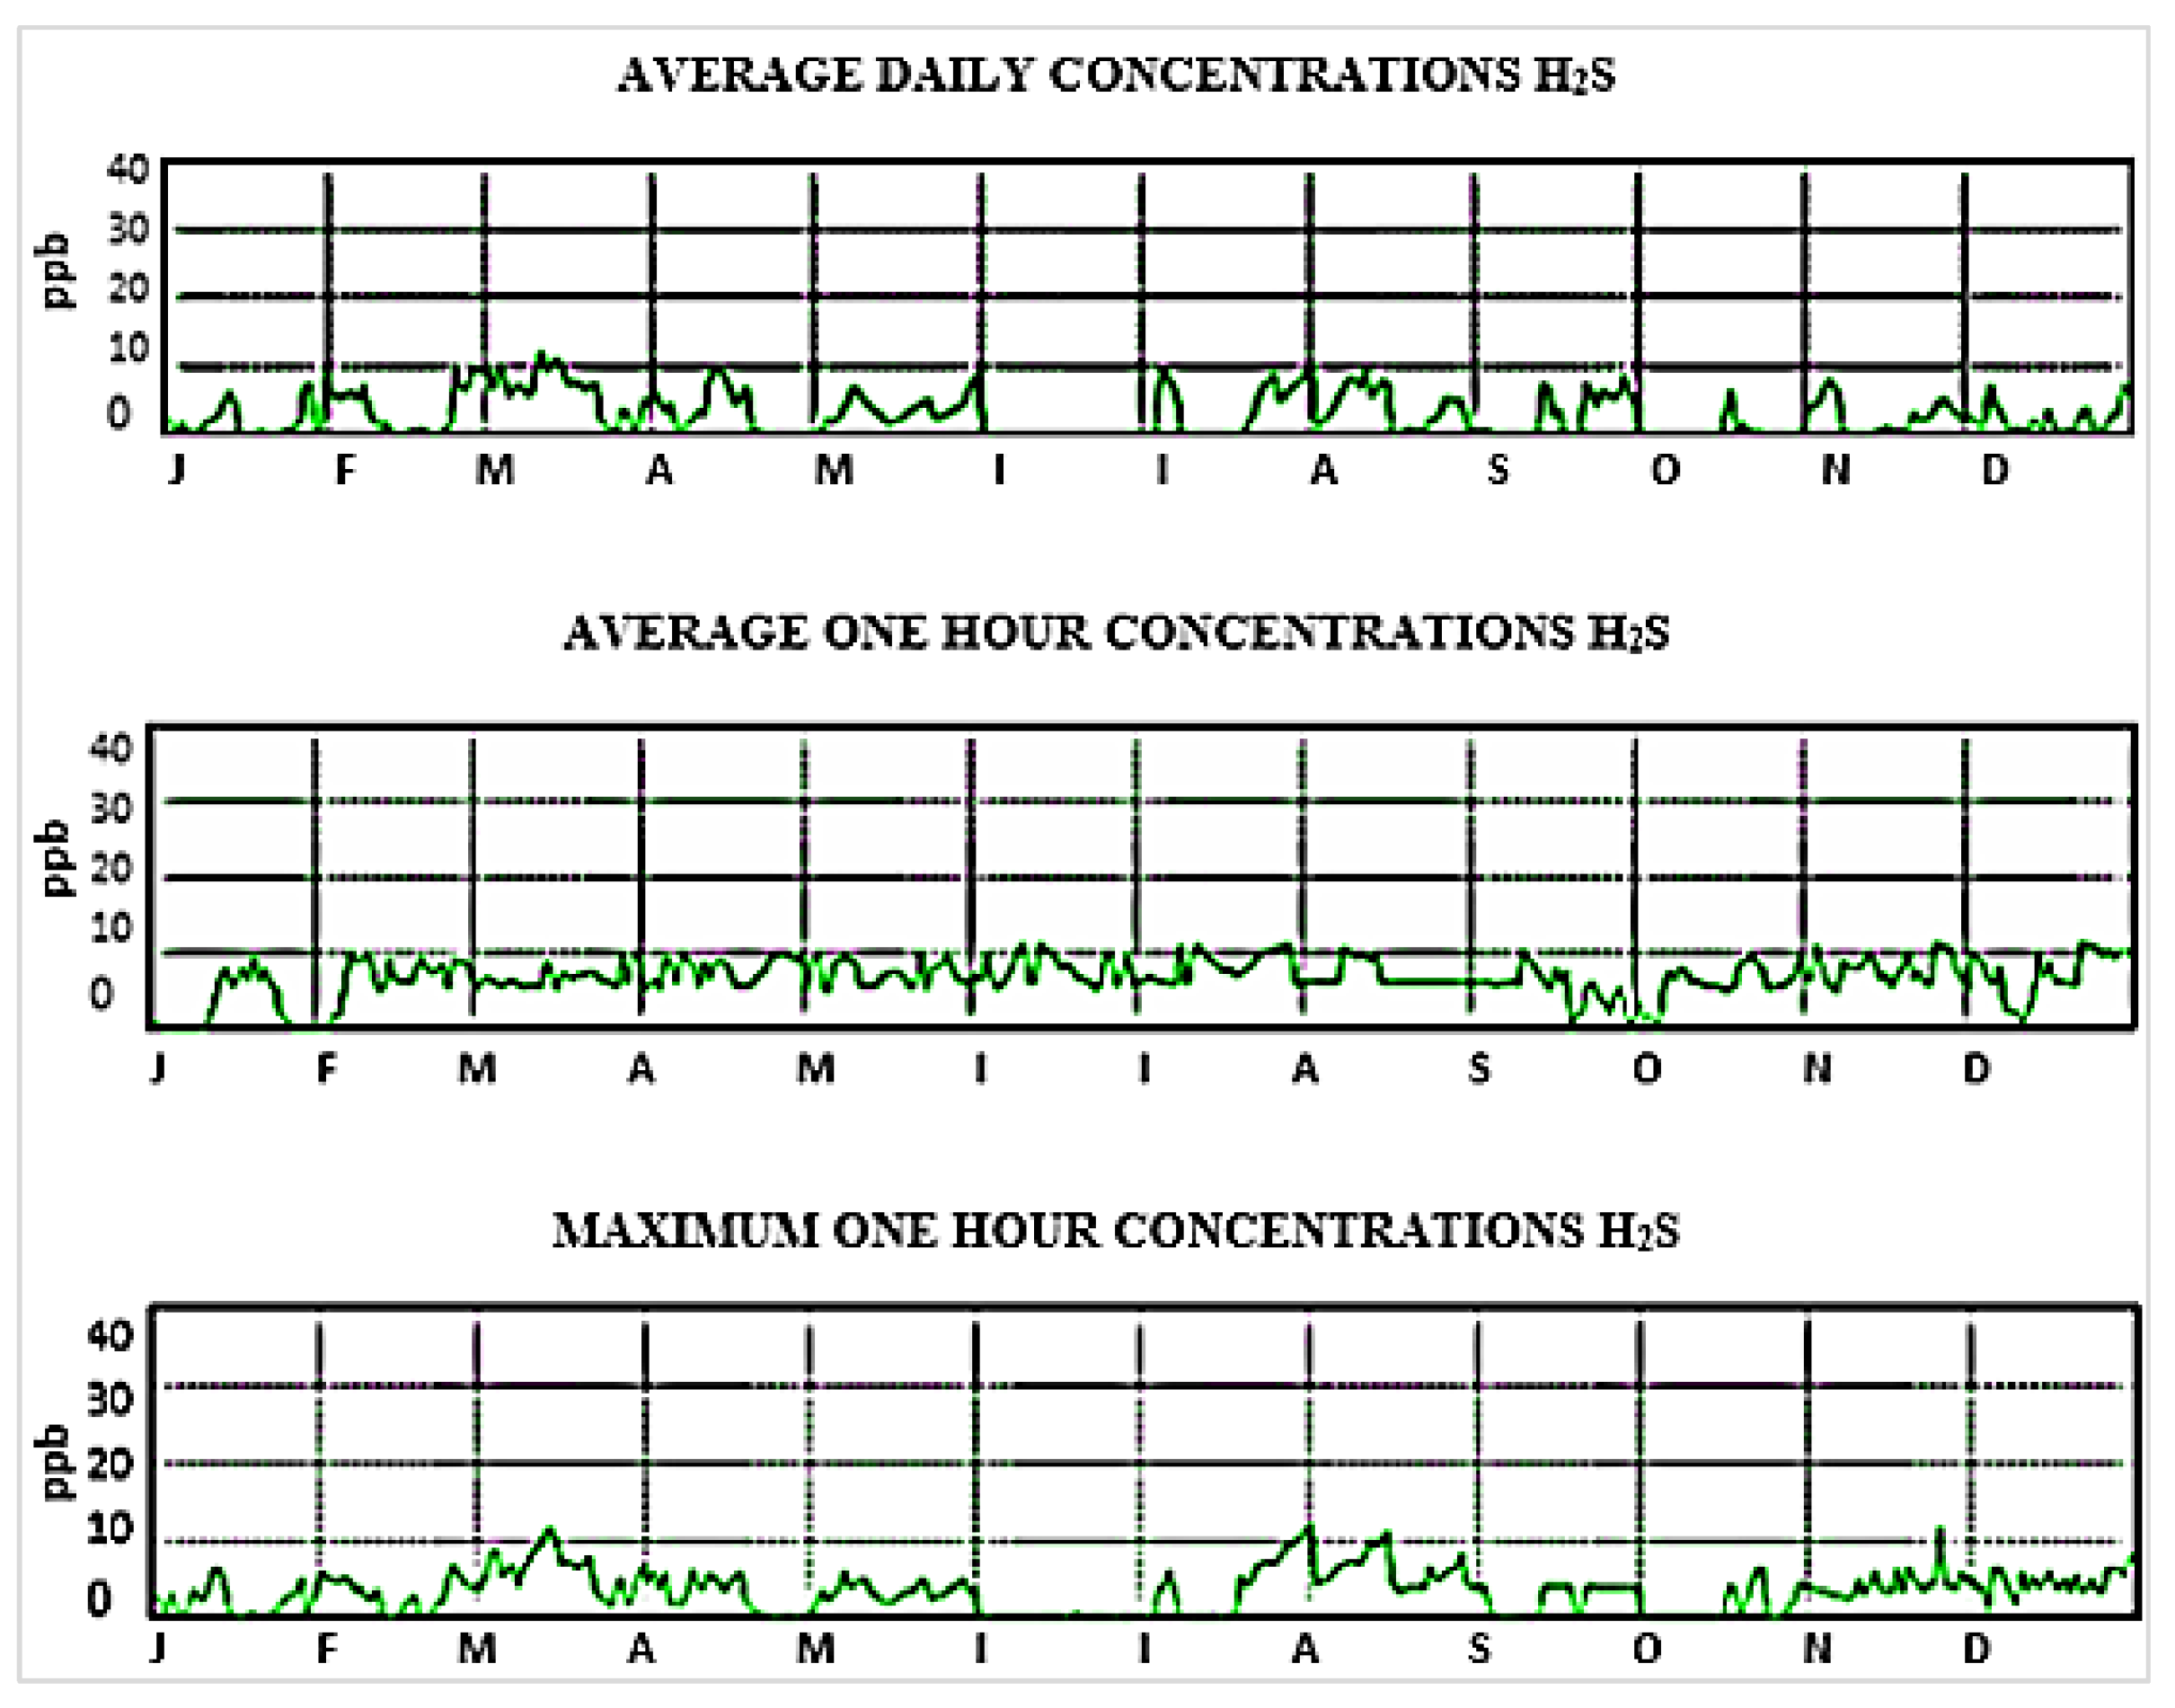
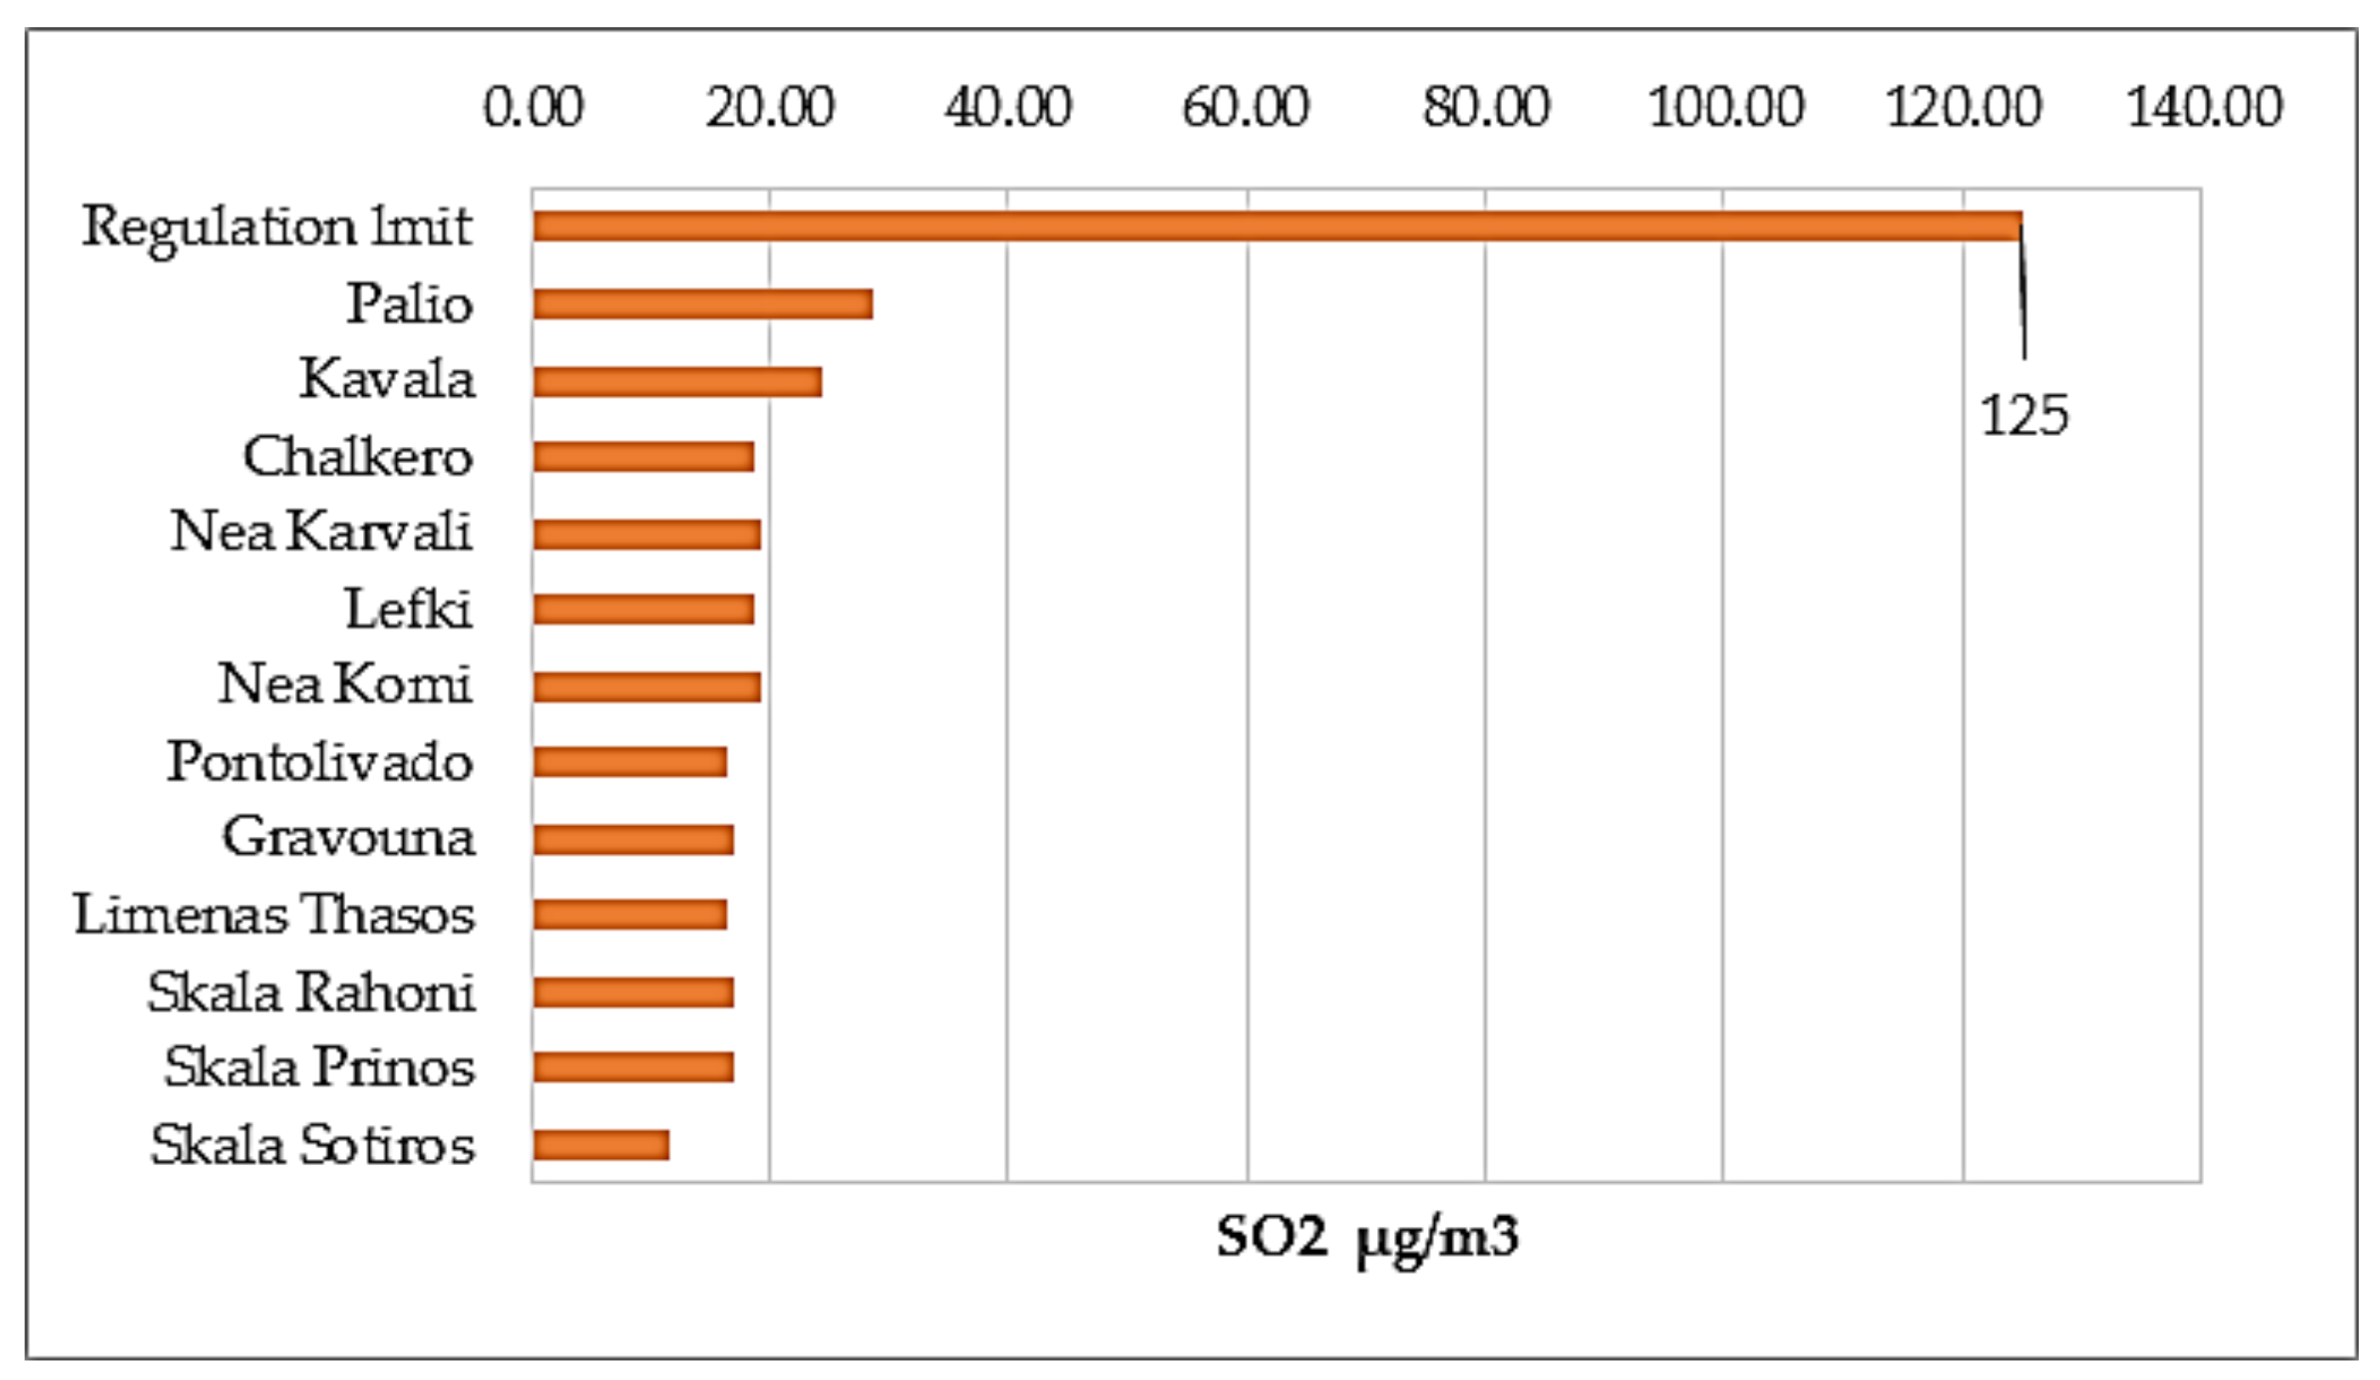
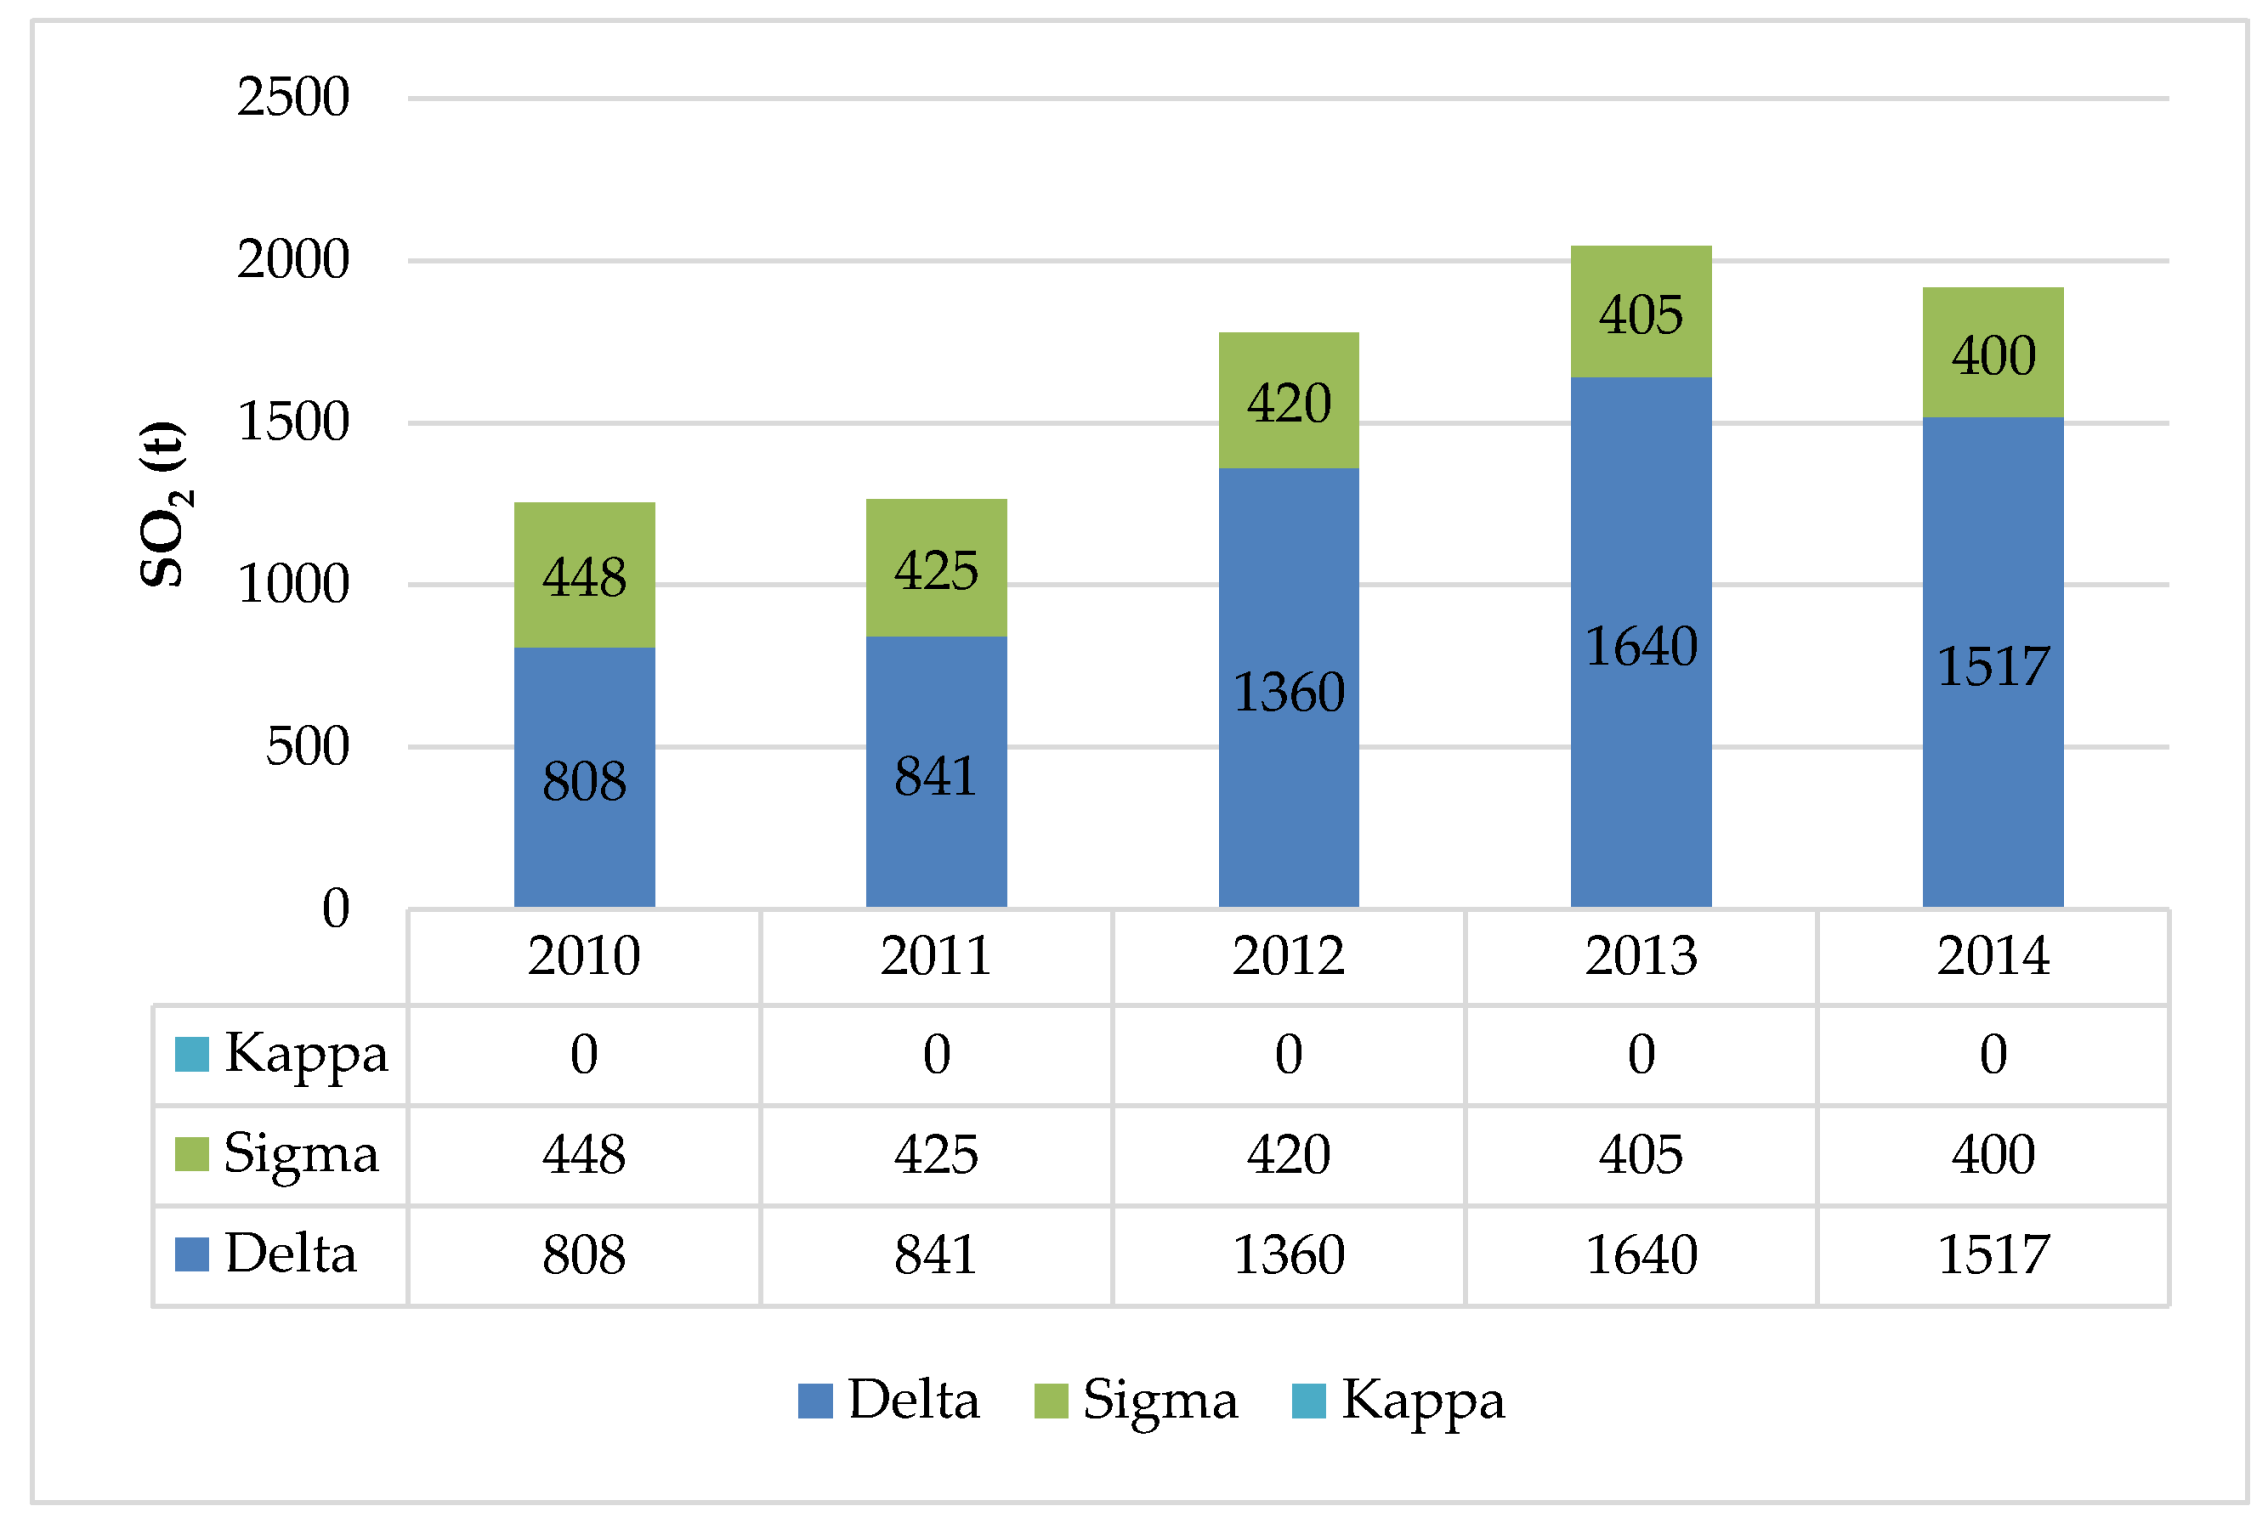
3.2. Sulfur Emissions (H2S and SO2)

Emissions of sulfur dioxide are related to the sulfur content (%) of the fuel and are calculated based on the H2S content of the gas. Two adjacent reservoirs may produce crude oil with different composition, varying even in terms of extraction depth. The average content of H2S in the deposit reservoirs of the Gulf of Kavala ranges from 35 to 40% [39].
For the year 2014, data on sulfur dioxide (SO2), collected by the central monitoring station show that the measured values are below the permitted limits (Figure 9), while annually averaged 24-h data from the twelve (12) linked sulfur monitoring stations also show very low concentration levels (Figure 10). More specifically, SO2 concentrations have a maximum value of average daily concentration of approximately 25 ppb or 65.47 μg/m3 and a maximum value of one-hour concentration of 50 ppb or 130 μg/m3. The limit values according to the European Union legislation are 125 μg/m3 for an average period of 24 h (not to be exceeded more than three times a calendar year) and 350 μg/m3 for an average period of one hour (not to be exceeded more than 24 times a calendar year) [12].
Emission measurements of SO2 and H2S from the furnace stack of the Sulfur Unit Incinerator (S-501) as well as the stacks of the boilers and the superheater are below the permitted limits according to the limit values of Directive 2010/75/EU (Table 3). Measurements in stacks of flare equipment are not available.
Emissions of sulfur dioxide (SO2) from the offshore installations (Kappa and Delta complex) in 2014 were 1517 t, which is equivalent to 79.13% of the total emissions (Figure 11) [4]. The Kappa platform produces sweet gas from the South Kavala field, an almost depleted gas field. It is also being supplied with electricity by the onshore installations through a submarine cable; therefore, SO2 emissions account to zero.
On the contrary, at the onshore facilities (Sigma), the Sulfur Plant converts 99% of the H2S included in the sour gas to sulfur. As a result, the produced natural gas is low in sulfur content and is used as fuel for energy production. Hence, the emissions of SO2 at the onshore facilities were very low, as shown in Figure 11.
H2S measured concentrations have a maximum value of about 15 ppb (0.015 ppm) or 0.021 mg/m3 (Figure 12). The limit of 20 ppm time-weighted average (TWA) is used, according to OSHA Standards [40]. The ambient concentration measurements of H2S at the twelve total sulfation monitoring stations and at the central environmental monitoring station located close to the onshore facilities, suggest that H2S emissions are negligible (Figure 12). It should be noted that the lowest-adverse-effect level of hydrogen sulfide is 15 mg/m3 (10 ppm). As a result, according to WHO, hydrogen sulfide 30-min average concentrations should not exceed 7 μg/m3 [41].
As noted above, the H2S concentrations have a maximum value of about 15 ppb or 0.021 mg/m3 (Figure 12). There is not an established limit for the hydrogen sulfide (H2S) emissions; some people can detect hydrogen sulfide odor at a concentration equivalent to 0.5 ppb, but 90% of the people detect hydrogen sulfide in concentrations equivalent to 50 ppb [41]. Hydrogen sulfide is a key parameter for the daily operation of the facilities and H2S concentrations are measured to ensure the protection of the employees and the inhabitants of the surrounding region.

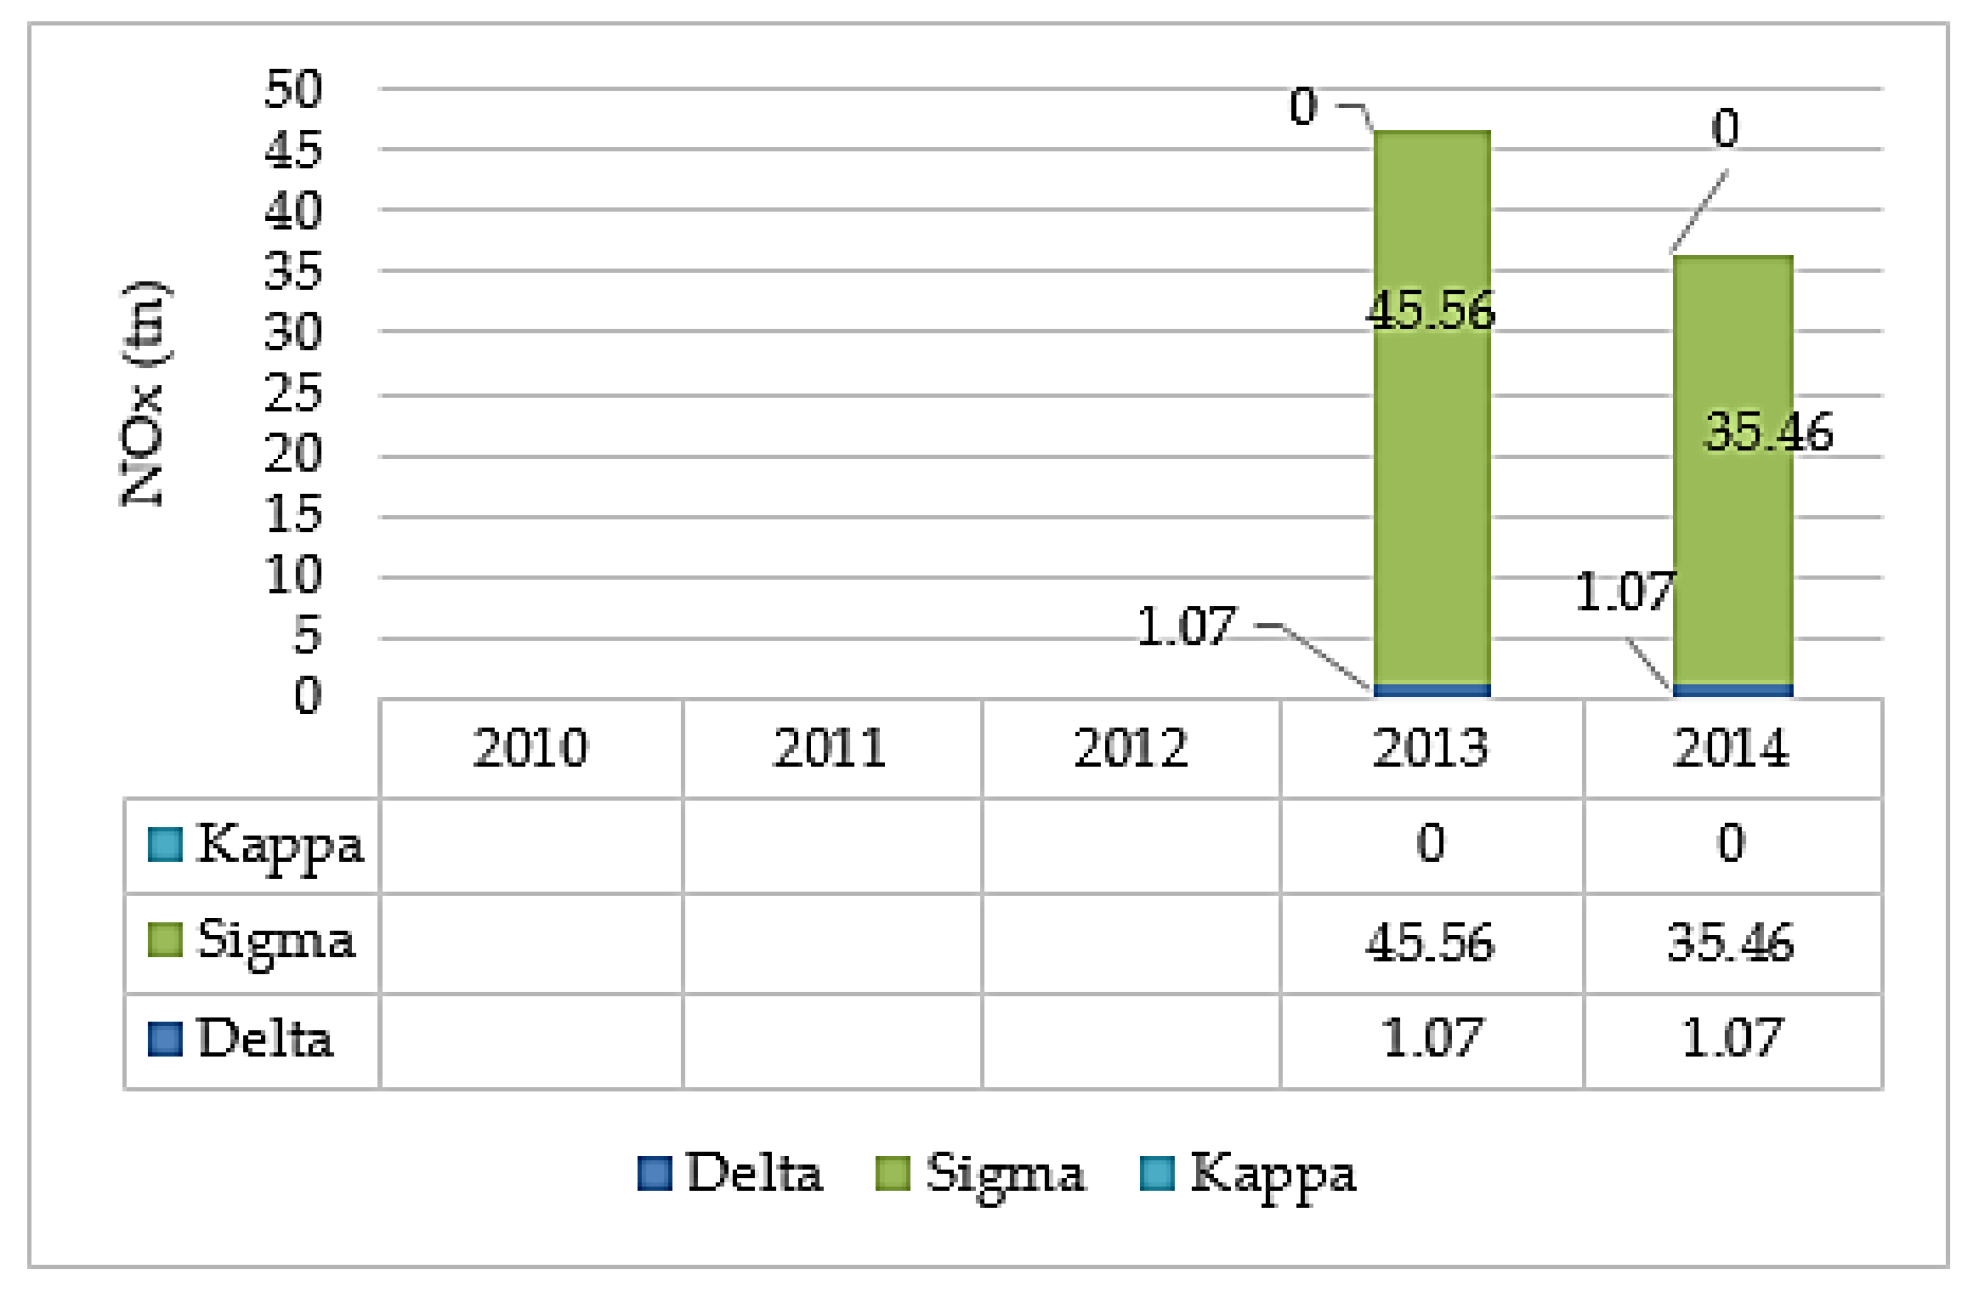
3.3. Emissions of Nitrogen Oxides (NOx) and Nitrous Oxide (N2O)

The total emissions of nitrogen oxides (NOx = NO + NO2) and nitrous oxide (N2O) at the offshore and onshore facilities during 2014, expressed as NO2 equivalent, were 36.53 t (Figure 13) [4]. Onshore facilities are supplying electricity to the offshore installations through a submarine cable. Moreover, natural gas is used as a fuel to cover energy needs at the onshore facilities and is the main reason for the very low emissions of NOx from the oil and gas extraction and production in Greece.
Emission measurements of NOx conducted at the furnace stack of the Sulfur Unit Incinerator (S-501) as well as at the stacks of the boilers and the superheater showed that emissions are below the limit values set at the 2010/75/EU Directive (Table 4) [10].

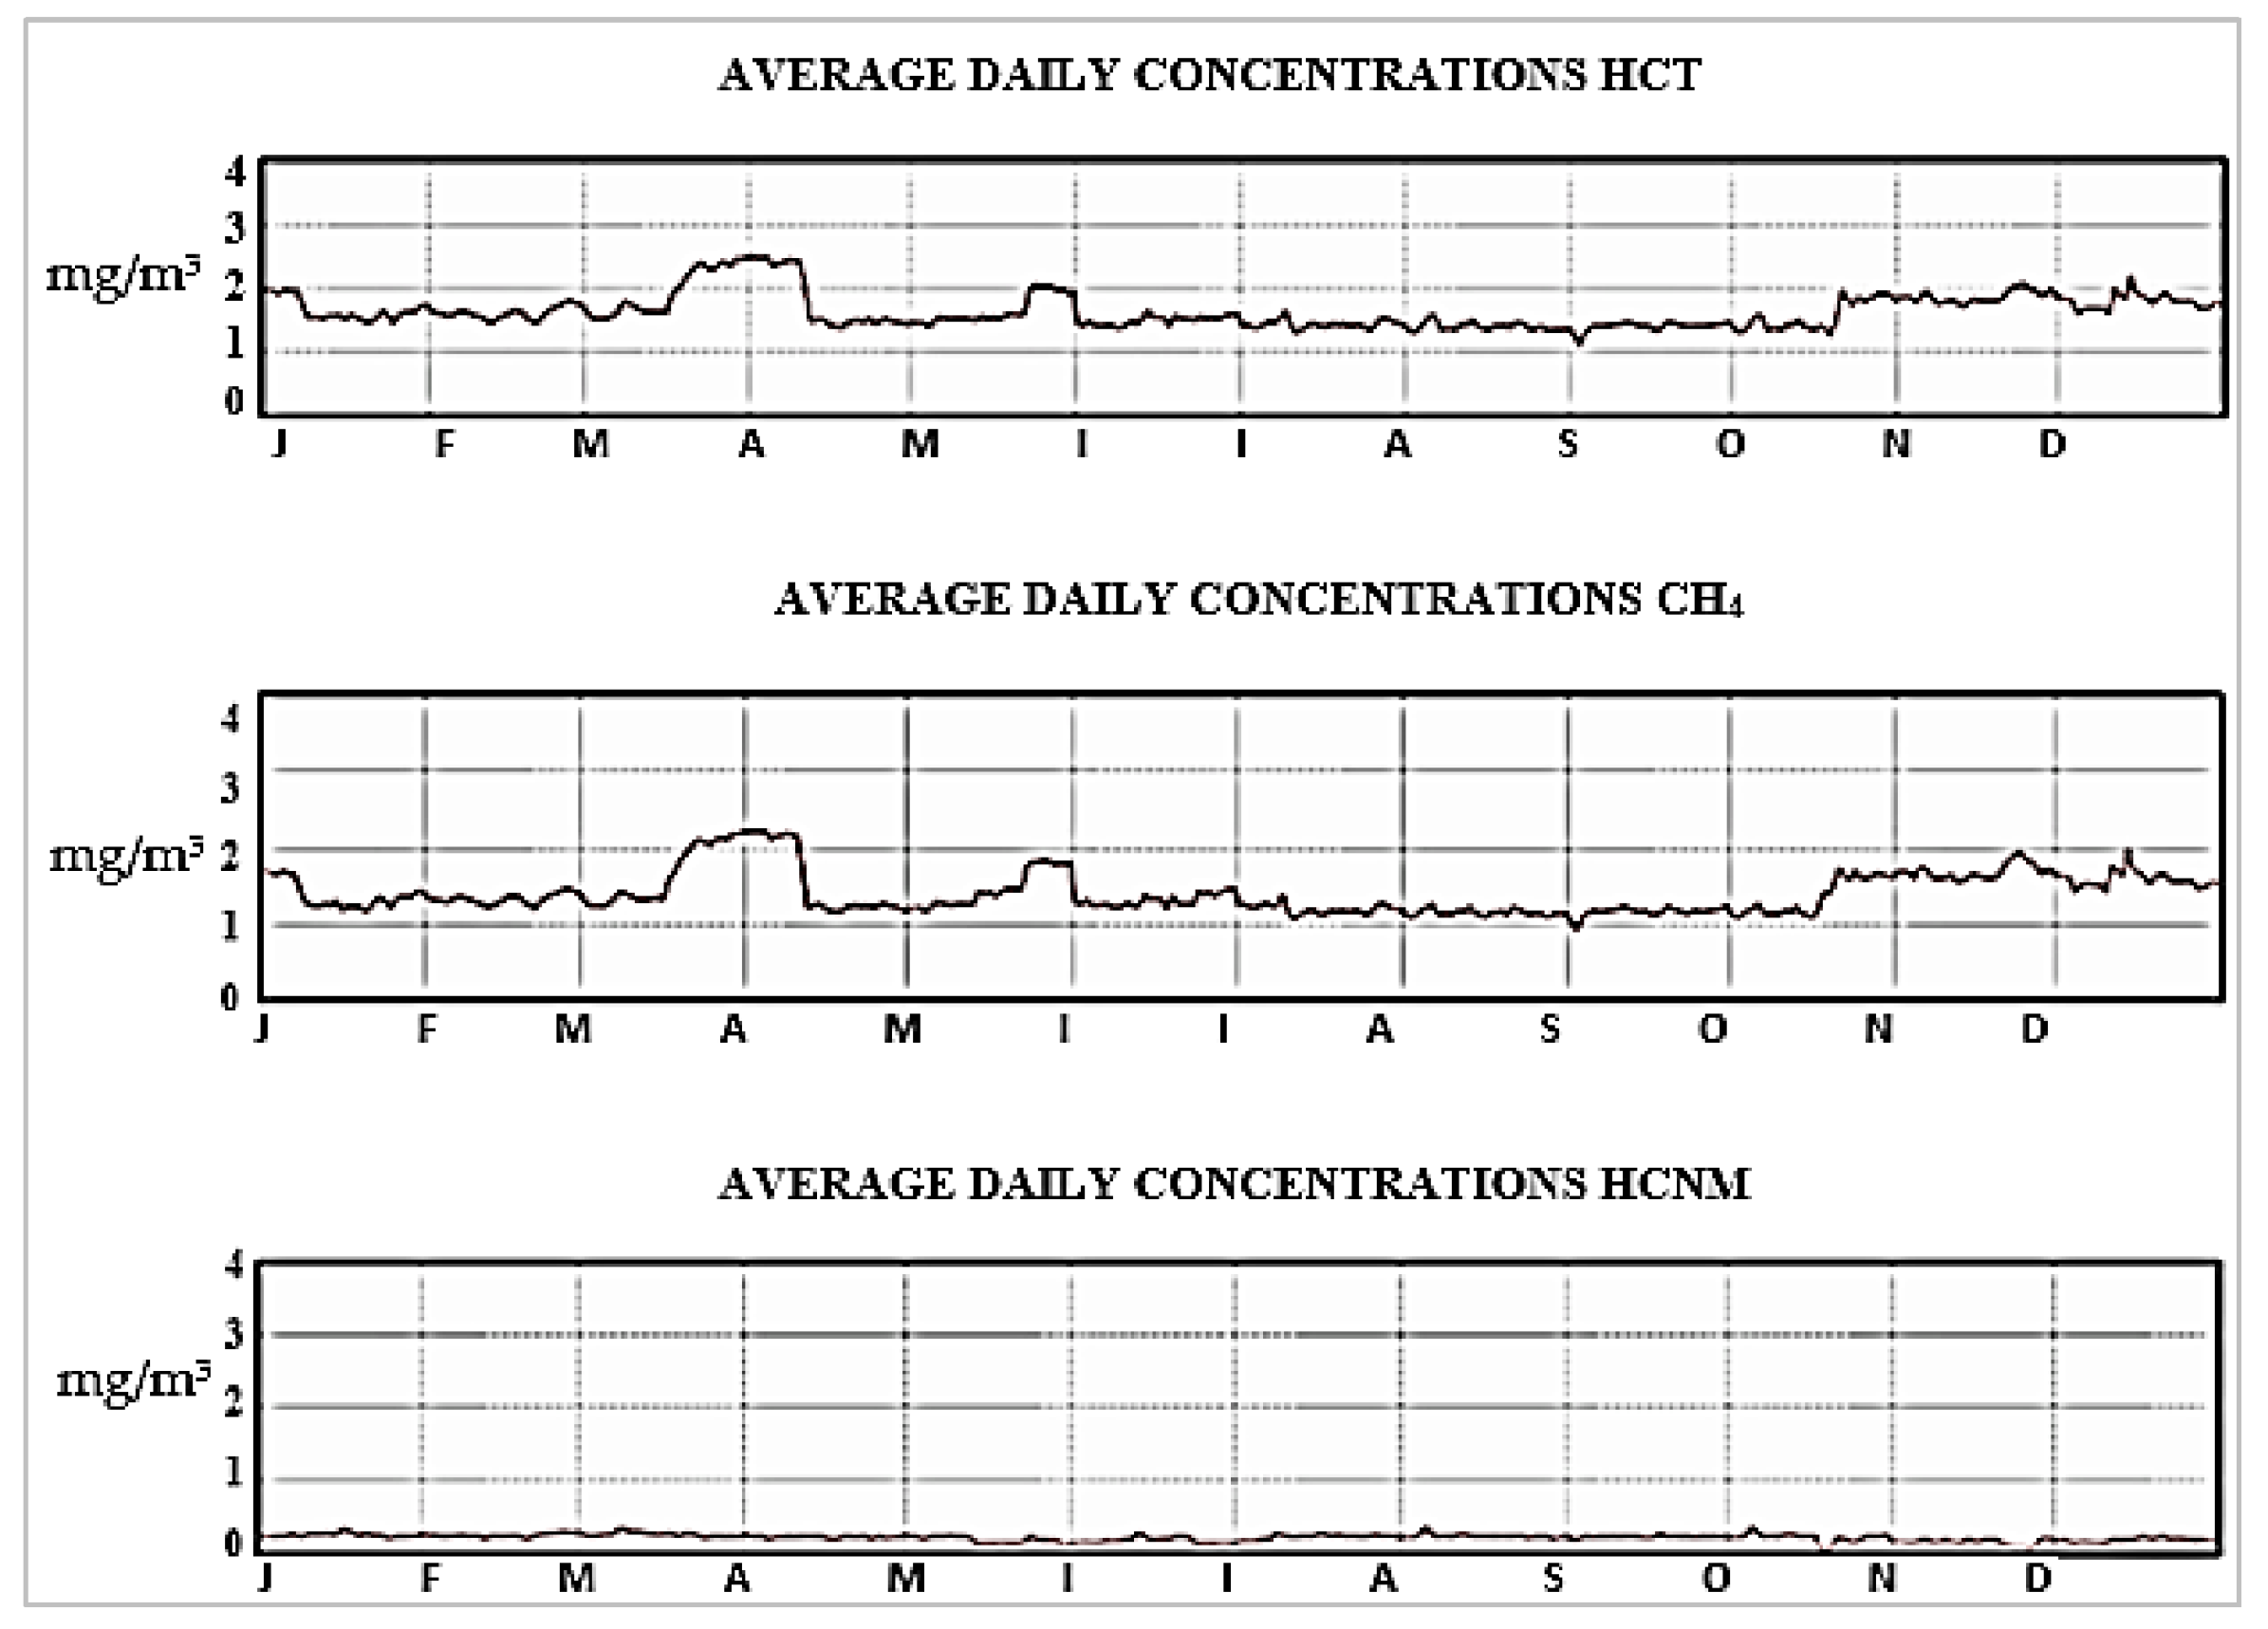
3.4. Volatile Organic Compounds (VOCs)

VOCs were collected by passive sampling at the central monitoring station, as described in a previous section, and the concentrations of the total VOCs (HCT, CH4, and HCNM) are low, as shown in Figure 14. The maximum daily average concentration of HCT (Hydrocarbon Concentration Total) was 2.5 mg/m3 in April 2014. It should be noted that among the VOCs, benzene is the only compound for which the European directive on air quality has set a limit of 5 μg/m3 (about 1.5 ppb) [12].

3.5. Summary of Contributions to Atmospheric Emissions for 2014

Table 5 presents a summary of the contribution of the individual activities of the Oil and Gas offshore and onshore installations of the Gulf of Kavala in relation to the main criteria pollutants NOX and SO2, as well as to CO2, which is the greenhouse gas mainly emitted by oil and gas activities.
Τhe majority of CO2 emissions occur at the onshore facilities. The main emission sources are the direct-fired boilers (74.24%) and the sulfur tail gas incinerator of the Sulfur Plant (10.16%), which includes two Claus units in parallel and three sulfreen-type batch reactors. Overall, CO2 emissions of oil and gas production at the onshore facilities are mainly due to the operation of boilers using sweet gas, diesel combustion engines, boilers for glycol regeneration using sour gas, and flaring. It should be noted that in offshore facilities, the major CO2 emissions are due to gas flaring and the furnace (2.39%).
The majority of SO2 emissions occur at the offshore facilities. The main source of SO2 at the offshore facilities was the gas flare (79.13%); sweet gas and a small amount of sour gas were burnt in the process of water treatment. Combustion engines were using diesel fuel with very low sulfur content (ultralow sulfur diesel) and, therefore, their emissions are not calculated for the annual inventory. At the onshore facilities (Sigma), the Sulfur Plant converts 99% of the H2S included in the sour gas to sulfur. As a result, the produced natural gas is low in sulfur content and is used as fuel for energy production. The main source of sulfur emissions at the onshore facilities is the incinerator stack (20.72%) where the sulfur unit tail gas is safely burned.
The majority of NOx emissions occur at the onshore facilities. The emissions from onshore facilities accounted for 97.07% of the total emissions, as at the offshore facilities, combustion engines for power generation (which are the main source for NOx and N2O) were not used. Nitrogen oxides are emitted by diesel combustion engines, flares and the dehydration process of sour gas. The biggest source of NOx emissions are the boilers (83.47%) at the onshore installations.
Finally, it should be noted that PM2.5 and PM10 are considered negligible due to the use of natural gas for power supply. Measurements of exhausts from boilers, turbines, furnaces, heaters, and incinerators showed that the concentration of dust emitted by stacks due to the production process did not exceed 1 degree on the Ringelman scale [42].

4. Conclusions

The monitoring and controlling of atmospheric emissions represents a critical component of the assessment of the environmental performance of oil and gas exploration and production, and is necessary for ensuring a good air quality status and for protecting the health and safety of employees and the quality of life of the local population.
Concentration measurements and emission inventories from oil and gas activities in Greece for the year 2014 confirm that emissions of atmospheric pollutants and greenhouse gases are very low and within the limits set by the national air quality standards and the European Union legislation. However, the study also revealed that if the prevailing wind direction is considered (i.e., from N–NE) then the central air quality monitoring station is not adequately located to fully characterize the emissions from the onshore and offshore facilities. To account for this limitation, at least one sampling point should be installed downwind of the source, taking also into account the location of the nearest residential area. Therefore, the possibility of relocating the station, for example to the west of the onshore installations and towards the town of Nea Karvali, could be considered.
The examination of the CO2 emission inventories for the years 2007, 2008, and 2009 showed that the main source of CO2 emissions were the turbines. Emissions of CO2 were low since they are controlled within the framework of efforts of the European Union to reduce greenhouse gas emissions until 2020, contributing to the global emissions reduction goals. The CO2 emission intensity of the Greek oil and gas extraction industry is significantly higher than the world average, which was around 130 kg. CO2 per ton oil equivalent (toe) for 2014. The oil and gas extraction industry in the Gulf of Kavala can take further action for strengthening the infrastructure development in order to reduce the carbon footprint of the facilities.
The total offshore emissions (Delta complex) of sulfur dioxide (SO2) are equivalent to 1517 t for the year 2014. The majority of SO2 emissions originate from the combustion of sweet gas and of a small amount of sour gas (process of water treatment) in the flare of the offshore facilities. Although the produced oil and gas contains about 50% hydrogen sulfide, the operator has developed specific techniques (SRU) at the onshore facilities to make the development of sour products as safe as possible for the environment. However, further improvements could be made: for example, a Flare Gas Recovery System could be used, which would result in avoiding visible smoke and flames from flaring systems and would recover the valuable gases currently wasted at the flare stack [43]. This issue should be further addressed to reduce SO2 emissions. Furthermore, sound databases related to the oil and gas extraction and production sector should be easily accessible by emission inventory developers to use in emissions calculations. Finally, it is proposed to study in more detail the acid gas flare combustion process at the offshore facilities.
In conclusion, the oil and gas production industry in Greece does not result in significant atmospheric emissions, taking into account the progress made in the efforts to reduce emissions and protect the environment, through the use of emission control technologies and the continuous monitoring and assessment of atmospheric emissions and local air quality. However, since the establishment of the Hellenic Hydrocarbons Management Company S.A., Athens, Greece, in 2011 (Law 4001/2011), rights for the exploration and exploitation of hydrocarbons are being granted in Greece, and it is expected that following this first stage, the exploitation of hydrocarbons as well as oil and gas extraction and production will increase in the future. Therefore, it is necessary for decision-makers and operators to ensure environmental protection and the health and safety of employees and the general population, inter alia through the development of appropriate monitoring systems and the use of up-to-date emission control technologies, thus establishing a closed optimization system.

Acknowledgments

The authors are sincerely grateful to Vasilis Tsetoglou, Group HSE Manager (KAVALA OIL), for providing the air emission data from the central environmental monitoring station.

Author Contributions

All authors have equally contributed to the preparation of this paper. G.P. and I.M. analyzed the data, prepared the discussion of results and wrote the paper.

Conflicts of Interest

The authors declare that there is no conflict of interest with respect to the research, authorship, and publication of this article.

References

  1. Kavala Oil S.A. History. 2016. Available online: http://www.kavalaoil.gr/index.php?act=viewCat&catId=1 (accessed on 30 March 2016).
  2. E&P Forum/UNEP. Environmental Management in Oil and Gas Exploration and Production; E&P Forum/UNEP: Paris, France, 1997; pp. 12–13. ISBN 92-807-1639-5. [Google Scholar]
  3. Kavala Oil S.A. Offshore Facilities. 2016. Available online: http://www.kavalaoil.gr/index.php?act=viewCat&catId=20 (accessed on 30 March 2016).
  4. Hellenic Ministry of Environment & Energy. E-PRTR Inventory Report for the Offshore Facilities of Kavala Oil S.A. for the Year 2014; Hellenic Ministry of Environment & Energy: Athens, Greece, 2014. [Google Scholar]
  5. Energean Oil and Gas. Reserves and Resources. 2016. Available online: http://www.energean (accessed on 30 March 2016).
  6. Hellenic Hydrocarbons Recourse Management. Offshore Ionian & Crete Tenders 2017. 2017. Available online: http://www.greekhydrocarbons.gr/ (accessed on 30 January 2017).
  7. Ioannidis, K. Industrial Training Schedule, Notes for the Module on “Onshore & Offshore Processing”; MSc Program on Oil and Gas Technology; Eastern Macedonia and Thrace Institute of Technology: Kavala, Greece, 2014–2015. [Google Scholar]
  8. Olaguer, E.P. Atmospheric Impacts of the Oil and Gas Industry; Elsevier: New York, NY, USA, 2017; ISBN 978-0-12-801883-5. [Google Scholar]
  9. Warneke, C.; Geiger, F.; Edwards, P.; Dube, W.; Petron, G.; Zahn, A.; Brown, S.S.; Graus, M.; Gilman, J.B.; Lerner, B.M.; et al. Volatile organic compound emissions from the oil and natural gas industry in the Uintah Basin, Utah: Oil and gas well pad emissions compared to ambient air composition. Atmos. Chem. Phys. 2014, 14, 10977–10988. [Google Scholar] [CrossRef]
  10. Hellenic Ministry of Environment & Energy. Revision and Amendment of Ministerial Decision No. 96213/17.9.2003 on the Approval of the Environmental Terms of the Onshore Installations of “Kavala Oil S.A.” Operating at Nea Karvali of Kavala Perfecture. Ministerial Decision No. 213450/5.12.2013. 2013. Available online: https://diavgeia.gov.gr/decision/view/%CE%92%CE%9B%CE%93%CE%A80-%CE%92%CE%A67 (accessed on 30 January 2015).
  11. Tsetoglou, V.; (Group HSE Manager of Kavala Oil S.A., Kavala, Greece). Personal communication, 2016.
  12. European Commission. Air Quality. Available online: http://ec.europa.eu/environment/air/quality/standards.htm (accessed on 22 September 2017).
  13. European Commission. Directive 2008/50/EC, on Ambient Air Quality and Cleaner Air for Europe. 2008. Available online: http://eur-lex.europa.eu/legal-content/EN/TXT/PDF/?uri=CELEX:32008L0050&from=en (accessed on 30 June 2016).
  14. European Commission. Directive 1999/30/EC, Relating to Limit Values for Sulphur Dioxide, Nitrogen Dioxide and Oxides of Nitrogen, Particulate Matter and Lead in Ambient Air. 1999. Available online: http://eur-lex.europa.eu/LexUriServ/LexUriServ.do?uri=CELEX:31999L0030:EN:HTML (accessed on 30 June 2016).
  15. European Commission. Directive 96/62/EC, on Ambient Air Quality Assessment and Management. 1996. Available online: http://eur-lex.europa.eu/legal-content/EN/TXT/PDF/?uri=CELEX:31996L0062&from=EN (accessed on 30 June 2016).
  16. TÜV Rheinland Immissionsschutz und Energiesysteme GmbH. Summary of the Report on the Suitability Test of the Ambient Air Quality Measuring System AF22M of the Company Environnement S.A. for the Measured Component SO2 (Accessed on February 2018 by Email from Operator). Unpublished work. 2008. [Google Scholar]
  17. Hellenic Ministry of Environment & Energy. Environmental Impact Assessment of the Offshore Facilities of Kavala Oil S.A.; Hellenic Ministry of Environment & Energy: Athens, Greece, 2013; 43p. [Google Scholar]
  18. Thomas, F.W.; Davidson, C.M. Monitoring Sulfur Dioxide with Lead Peroxide Cylinders. J. Air Pollut. Control Assoc. 1961, 11, 24–27. [Google Scholar] [CrossRef] [PubMed]
  19. European Commission. The Monitoring and Reporting Regulation—General Guidance for Installations, Measurement Based Approaches. 2012, pp. 26–27. Available online: http://ec.europa.eu/clima/policies/ets/monitoring/index_en.htm (accessed on 30 May 2016).
  20. European Commission. JRC Reference Report on Monitoring of Emissions from IED-Installation. 2013. Available online: http://eippcb.jrc.ec.europa.eu/reference/BREF/ROM_FD_102013_online.pdf (accessed on 30 May 2016).
  21. European Commission. Directive 2001/81/EU, on National Emission Ceilings for Certain Atmospheric Pollutants. 2001. Available online: http://eur-lex.europa.eu/legal-content/EN/TXT/PDF/?uri=CELEX:32001L0081&from=EL (accessed on 30 March 2015).
  22. European Commission. Directive 2003/87/EU, Establishing a Scheme for Greenhouse Gas Emission Allowance Trading within the Community and Amending Council Directive 96/61/EC. 2003. Available online: http://eur-lex.europa.eu/legal-content/EN/TXT/PDF/?uri=CELEX:32003L0087&from=EN (accessed on 30 March 2015).
  23. Hellenic Ministry of Environment & Energy. Revised Environmental Impact Assessment (2013). 2013. Available online: https://diavgeia.gov.gr/decision/view/%CE%92%CE%9B%CE%93%CE%A80-%CE%92%CE%A67 (accessed on 30 January 2015).
  24. United States Environmental Protection Agency (US EPA). Volatile Organic Compounds Emissions. 2014. Available online: https://cfpub.epa.gov/roe/ (accessed on 30 December 2017).
  25. Energean Oil and Gas. Abstract of Environmental Impact Assessment in Onshore Facilities. 2013. Available online: https://www.energean.com/media/1098/2013-μπε-χερσαίων-εγκαταστασεων-περίληψη.pdf (accessed on 12 February 2018).
  26. European Commission. Directive 2010/75/EC, on Industrial Emissions (Integrated Pollution Prevention and Control). 2010. Available online: http://eur-lex.europa.eu/LexUriServ/LexUriServ.do?uri=OJ:L:2010:334:0017:0119:en:PDF (accessed on 30 June 2016).
  27. European Commission. Implementing Decision, Establishing Best Available Techniques (BAT) Conclusions, under Directive 2010/75/EU of the European Parliament and of the Council on Industrial Emissions, for the Refining of Mineral Oil and Gas. 2014. Available online: http://eur-lex.europa.eu/legal-content/EN/TXT/PDF/?uri=CELEX:32014D0738&from=EN (accessed on 10 February 2018).
  28. Concawe-Enviromental Science for the European Refining Industry. Air Pollutant Emission Estimation Methods for E-PRTR Reporting by Refineries. 2017. Available online: https://www.concawe.eu/wp-content/uploads/2017/04/Rpt_17-4.pdf (accessed on 30 December 2017).
  29. Kahforoushan, D.; Fatehifar, E.; Ahmadi, J. A Novel Method for Determination of Acid Gas Flares Emission Factors. In Proceedings of the CESET 2015 Conference, Tehran, Iran, 5–6 May 2015; Available online: https://www.researchgate.net/publication/277011787_A_Novel_method_for_determination_of_acid_gas_flares_Emission_factors (accessed on 30 December 2017).
  30. Hellenic Ministry of Environment, Energy and Climate Change. Greece—National Inventory Report 2014. 2014. Available online: http://unfccc.int/national_reports (accessed on 30 April 2016).
  31. IPCC Guidelines for National Greenhouse Gas Inventories. Stationary Combustion. 2006. Available online: https://www.ipcc-nggip.iges.or.jp/public/2006gl/pdf/2_Volume2/V2_2_Ch2_Stationary_Combustion.pdf (accessed on 20 April 2015).
  32. European Commission. Climate Action, EU Action, Climate Strategies & Targets, 2020 Climate & Energy Package. Available online: https://ec.europa.eu/clima/policies/strategies/2020_en (accessed on 30 April 2015).
  33. European Commission. Climate Action, European Transaction Log. 2014. Available online: http://ec.europa.eu/environment/ets/ohaDetails.do?accountID=92126&languageCode=en&action=all&registryCode=GR&returnURL=permitIdentifier%3D%26languageCode%3Den%26form%3Doha%26installationName%3D%26accountHolder%3D%26search%3DSearch%26installationIdentifier%3D%26resultList.currentPageNumber%3D1%26account.registryCodes%3DGR%26searchType%3Doha%26mainActivityType%3D20%26currentSortSettings%3D (accessed on 30 June 2015).
  34. U.S. Energy Information Administration. International Energy Statistics. Available online: http://www.eia.gov/cfapps/ipdbproject/iedindex3.cfm?tid=5&pid=55&aid=1&cid=GR,&syid=2000&eyid=2015&unit=TBPD (accessed on 30 June 2016).
  35. Brandt, A.R.; Unnasch, S. Energy Intensity and Greenhouse Gas Emissions from Thermal Enhanced Oil Recovery. Energy Fuels 2010, 24, 4581–4589. [Google Scholar] [CrossRef]
  36. Cheapower. Learn about Oil Industry Conversions. Available online: http://www.cheapower.com/newsandco/oil_industry_conversions.htm (accessed on 10 December 2017).
  37. Skjerpen, T.; Gavenas, E.; Rosendahl, K. CO2 emissions from Norwegian oil and gas extraction. Energy 2015, 90, 1958–1959. [Google Scholar]
  38. Norwegian Oil and Gas Association. Environmental Report. 2015. Available online: https://www.norskoljeoggass.no/Global/2015%20dokumenter/Environmental%20report%202015.pdf (accessed on 15 June 2015).
  39. Varotsis, N. Chemical Composition of Hydrocarbons; Reservoir Engineering; Department of Mineral Resources Engineering, The Technical University of Crete: Chania, Greece, 2010; pp. 13–14. [Google Scholar]
  40. US Department of Labor. Regulations (Standards-29 CFR), Occupational Safety and Health Administrator. 2017. Available online: https://www.osha.gov/pls/oshaweb/owadisp.show_document?p_table=STANDARDS&p_id=9993 (accessed on 30 June 2016).
  41. World Health Organization (WHO). Air Quality Guidelines Second Edition, Chapter 6.6 Hydrogen Sulfide. 2000. Available online: http://www.euro.who.int/__data/assets/pdf_file/0019/123076/AQG2ndEd_6_6Hydrogensulfide.PDF (accessed on 30 June 2016).
  42. United States Department of the Interior. Ringelmann Smoke Chart, Bureau of Mines (Revision of IC 7718). 1967. Available online: https://www.cdc.gov/niosh/mining/userfiles/works/pdfs/ic8333.pdf (accessed on 29 December 2017).
  43. Petrowiki. Emissions from Oil and Gas Production Operations, 4.3. Reducing SO2. Available online: http://petrowiki.org/Emissions_from_oil_and_gas_production_operations#Reducing_SO2 (accessed on 29 December 2017).
Figure 1. Offshore and onshore facilities located in the area of Prinos, in the gulf of Kavala (the locations of the total sulfation and the central air pollution monitoring stations are also indicated).
Atmosphere 09 00152 g001
Figure 2. Overview of onshore and offshore activities in Greece.
Atmosphere 09 00152 g002
Figure 3. Oil and gas processing in the case study area.
Atmosphere 09 00152 g003
Figure 4. Frequency of wind speed.
Atmosphere 09 00152 g004
Figure 5. Wind direction frequency.
Atmosphere 09 00152 g005
Figure 6. Yearly temperature variation.
Atmosphere 09 00152 g006
Figure 7. Comparison of the CO2 emissions inventory (t) with allocated allowances in the EU emissions trading system. For the years 2015 and 2016, the annual verified emissions are 31,044 t and 36,980 t respectively.
Atmosphere 09 00152 g007
Figure 8. CO2 emissions and Oil and Gas Extraction in Greece for the period 2000–2014.
Atmosphere 09 00152 g008
Figure 9. SO2 concentrations (ppb) at the central monitoring station.
Atmosphere 09 00152 g009
Figure 10. Average 24-h SO2 concentrations (μg/m3) at the twelve (12) linked Sulfur monitoring stations located at the Gulf of Kavala.
Atmosphere 09 00152 g010
Figure 11. SO2 atmospheric emissions inventory from Oil and Gas extraction from 2010 to 2014 (where SO2 (t) is the total mass of sulfur dioxide and sulfur trioxide, expressed as sulfur dioxide.).
Atmosphere 09 00152 g011
Figure 12. H2S concentrations (ppb) measured at the central monitoring station at the onshore installations.
Atmosphere 09 00152 g012
Figure 13. NOx atmospheric emissions inventory from Oil and Gas extraction for year 2014 (data for the years 2010–2012 were not available).
Atmosphere 09 00152 g013
Figure 14. Concentrations of VOCS.
Atmosphere 09 00152 g014
Table 1. Summary of inventory methodologies.
Pollutant NameM/C/EMethod UsedQuantity T (Total) (t/year)
Carbon dioxide (CO2)CIPCC 200633,933.80
Volatile organic compounds (VOCs)CAPI 251711.58
Oxides of nitrogenMN/A35.46
Oxides of nitrogenCBased on the stoichiometric combustion equation
Sulfur dioxideCConcawe report for E-PRTR reporting by refineries1917
M: Measurements based on actual continues or discontinues of pollutant concentrations of a given release route. C: Calculations using activity data (fuel used, production rate, etc.). E: Non-standardized estimations (best assumptions or expert guesses).
Table 2. Carbon dioxide emission factors (in t CO2/TJ) and net calorific value (in TJ/kt) by fuel type.
Fuel TypeNet Calorific Value (in TJ/kt)Carbon Content CC tc/TJOxidation Factor %Emission Factor (TCO2/TJ)
Diesel oil42.820.1210073.78
Heavy fuel oil40.1421.3810078.4
Natural gas—Domestic 15.95–16.2210056.95
Natural gas—Imports 15.15–15.1810055.55–55.67
Table 3. SO2 and H2S measurements in stacks [10].
FrequencySampling PointMonitoring ParameterLimit ValuesAverage Values
QuarterlyB-611 Stack (Boiler)SO2 (through calculations)35/mg/Νm33.1 mg/Nm3 (year) 6.3 mg/Nm3(day)
B-612 Stack (Boiler)SO2 (through calculations)35/mg/Νm33.1 mg/Nm3 (year) 6.3 mg/Nm3 (day)
BiannualH-611 Stack (Superheater)SO2 (through calculations)35/mg/Νm35.4 mg/Nm3 (year) 12.2 mg/Nm3 (day)
ContinuouslyS-501 Incinerator StackSO2-3 mg/Nm3 (year) 5 mg/Nm3 (day)
H2S10/mg/Νm300/mg/m3
Table 4. NOx measurements in stacks.
FrequencySampling PointMonitoring ParameterLimit ValuesAverage Values
BiannualB-611 Stack (Boiler)NOx300/mg/Nm3250 mg/Nm3 (year) 290 mg/Nm3 (day)
B-612 Stack (Boiler)NOx300/mg/Nm3250 mg/Nm3 (year) 290 mg/Nm3 (day)
H-611 Stack (Superheater)NOx300/mg/Nm3150 mg/Nm3 (year) 200 mg/Nm3 (day)
S-501 Incinerator StackNOx300/mg/Nm320 mg/Nm3 (year) 30 mg/Nm3 (day)
Table 5. Summary of Oil and Gas Emissions Contribution by Pollutant.
NOx Emissions ContributionsSO2 Emissions ContributionsCO2 Emissions Contributions
Boilers (ONP)—83.47%Flaring (OFP)—79.13%Boilers (ONP)—74.24%
Superheater (ONP)—12.46%Incinerator (ONP)—20.72%Incinerator (ONP)—10.16%
Flaring and Furnace (OFP)—2.93%Boilers (ONP)—0.11%Superheater (ONP)—8.13%
Incinerator (ONP)—0.86%Superheater (ONP)—0.02%Flaring (ONP)—2.65%
Flaring (ONP)—0.27%Flaring (ONP)—0.02%Engines (ONP)—2.43%
Flaring and Furnace (OFP)—2.39%
ONP = Onshore production; OFP = Offshore production.

