Article

Combined Effects of Synoptic-Scale Teleconnection Patterns on Summer Precipitation in Southern China

1
Key Laboratory of Meteorological Disaster, Ministry of Education (KLME)/Joint International Research Laboratory of Climate and Environment Change (ILCEC)/Collaborative Innovation Center on Forecast and Evaluation of Meteorological Disasters (CIC-FEMD)/Science and Technology Innovation Team on Climate Simulation and Forecast, Nanjing University of Information Science & Technology, Nanjing 210044, China
2
State Key Laboratory of Severe Weather, Chinese Academy of Meteorological Sciences, Beijing 100081, China
*
Author to whom correspondence should be addressed.
Atmosphere 2018, 9(4), 154; https://doi.org/10.3390/atmos9040154
Submission received: 2 March 2018 / Revised: 8 April 2018 / Accepted: 16 April 2018 / Published: 19 April 2018
(This article belongs to the Special Issue Weather and Climate Extremes: Current Developments)

Abstract

:
Using ERA-Interim daily reanalysis and precipitation data, the combined effects of East Asia-Pacific (EAP) and Silk Road (SR) teleconnection patterns on summer precipitation in Southern China were investigated on synoptic to sub-monthly timescales. Combined EAP and SR patterns lead to more persistent and extreme precipitation in the Yangtze River Valley (YRV) and exhibit an obvious zonal advance between the South Asia High (SAH) and Western Pacific Subtropical High (WPSH) prior to its onset. During typical combined events, an overlap between the SAH and WPSH remains in a favorable position for Persistent Extreme Precipitation (PEP). Furthermore, SR-induced acceleration of the westerly jet stream and extra positive vorticity advection provide persistent upper-level divergence for YRV precipitation. An anomalous EAP-related cyclone/anticyclone pair over East Asia induces enhanced low-level southwesterlies to the northern anticyclone flank and northerlies from the mid-latitudes, advecting anomalously abundant moisture toward the YRV, resulting in clear moisture convergence. Moreover, the strong ascent of warmer/moister air along a quasi-stationary front may be crucial for PEP. During decay, the SAH and WPSH diverge from each other and retreat to their normal positions, and the strong ascent of warmer/moister air rapidly weakens to dissipation, terminating PEP in the YRV.

1. Introduction

Variations of East Asian summer monsoon circulation are particularly complicated, owing to the existence and persistence of summer teleconnection patterns, including the well-known East Asia-Pacific (EAP)/Pacific-Japan (PJ) and Silk Road (SR) teleconnection patterns, recognized as the most dominant modes and most influential teleconnection patterns of the boreal summer [1,2].
The EAP teleconnection pattern tends to be confined and propagates northward along the East Asian coast in both the lower and middle troposphere, with the poleward propagation of Rossby waves triggered by anomalous cumulus convection over the western Pacific warm pool [3,4]. This meridional pattern reflects three key systems: the Okhotsk high, the Mei-Yu front, and the Western Pacific Subtropical High (WPSH) [5]. The other teleconnection trapped along the upper-level westerly jet, spanning the Eurasian continent along approximately 40° N, is the so-called SR teleconnection pattern, which tends to be geographically fixed and has the characteristics of a stationary Rossby wave train [6,7,8]. Ding and Wang [8,9] argued that this zonal pattern can be viewed as part of a circumglobal teleconnection pattern in the mid-latitude circulation of the Northern Hemisphere.
In addition, these two major patterns exert substantial influence on the East Asian summer monsoon circulation [3,10]. Circulation anomalies related to positive (negative) phases of the EAP pattern lead to summer floods (droughts) in Southern China [11,12]. Subsequently, various studies have considered the EAP pattern as an effective predictor of climate anomalies, focusing on its influence on the East Asian summer monsoon climate on inter-annual to inter-decadal timescales [12,13]. On the other hand, the SR pattern contributes to the formation of the Bonin high, the WPSH, and the Mei-Yu front, influencing the precipitation around the Asian jet regions [6,14,15]. The positive (negative) phases of the SR pattern can trigger upper-level cyclonic (anticyclonic) anomalies and strong divergence (convergence) in the mid-latitudes over East Asia, with more (less) rainfall in Southern China [16]. Subsequent studies have indicated that this circumglobal pattern can significantly affect climate and weather over a broad area, including but not limited to East Asia and the latitudes of the Asian jet stream. For example, it may also induce precipitation anomalies over Europe, Japan, Northern China, and the Indian Monsoon regions [16,17,18,19].
Recently, many studies have emphasized the coexistence and interaction of the EAP and SR patterns in summertime by analyzing monthly fields [20,21]. On the one hand, the SR pattern can enhance anomalous ascent and trigger convective activity around the Philippine Sea, forcing the EAP pattern. With the favorable configuration of the Asian jet, the wave energy propagation related to the SR pattern can stimulate anticyclonic disturbances over mid-latitude East Asia, favoring the preservation of the EAP pattern [21]. On the other hand, their interaction tends to induce more extreme climate and weather events over East Asia. Ogasawara and Kawamura [22] indicated that this combination leads to more extreme hot/cold events near Japan than a single teleconnection pattern. In particular, concurrent behavior between them plays an important role in affecting the inter-annual variability of East Asian summer precipitation. Hsu and Lin [23] noted that the EAP and SR patterns result in different precipitation patterns along the East Asian coast, and Kosaka et al. [24] highlighted the relationship between summer Mei-Yu-baiu precipitation anomalies and these two key teleconnection patterns on inter-annual timescales.
According to these previous studies, such a combination may result in extraordinary anomalous features of the East Asian summer monsoon circulation. This study aims to explore the effects of the combined EAP and SR patterns on summer precipitation in Southern China. EAP-related precipitation over Southern China mainly occurs in the positive phase of the EAP (EAP+) pattern [25]. However, less precipitation related to the negative phase over the eastern coastal region of China may be triggered by tropical cyclones/typhoons and their remnants over the western North Pacific [26]. Mechanisms of typhoon-induced precipitation are very complicated, with few similarities between individual cases, so they are not discussed in this study. In addition, during EAP-related precipitation events, the SR pattern (SR+) generally tends to be in the positive phase [27,28]. Thus, the EAP and SR teleconnection patterns refer to EAP+ and SR+ patterns in this study.
Although some attention has been paid to the coexistence and concurrent behavior of the EAP and SR teleconnection patterns on inter-annual to inter-decadal timescales [20,22,23,24], the combined effects or influences of these two key patterns on summer precipitation in Southern China on synoptic to sub-monthly timescales have rarely been reported. The distinction of the climate effects on summer rainfall between combined and single patterns cases are also worth exploring. This work attempts to explore the following issues. Firstly, do EAP+ and SR+ patterns coexist invariably? Secondly, how do the effects of the combined and single patterns on summer precipitation in Southern China differ? Thirdly, how does the combination influence rainfall? The rest of the paper is arranged as follows: Section 2 describes the data and methods; Section 3 introduces the definition of typical combined and single patterns; Section 4 investigates combined and separate effects on summer precipitation in Southern China; and Section 5 summarizes the key conclusions.

2. Data and Methods

2.1. Data

Daily meteorological datasets derived from the European Centre for Medium-Range Weather Forecast (ECMWF) Re-Analysis (ERA-Interim) during 1979–2015 were used in this study, including geopotential height (gpm), horizontal wind (m s−1), air temperature (K), specific humidity (g kg−1), and vertical p-velocity (Pa s−1), with a horizontal resolution of 2.5° × 2.5° and 17 regular vertical pressure levels [29,30]. This observational dataset is available online at https://www.ecmwf.int/. The months of June to August (JJA), 1979–2015, were selected as the study period.
Also employed were daily precipitation data obtained from China’s Ground Precipitation 0.5° × 0.5° Gridded Dataset (version 2.0) covering the land areas of China for the same period, which is produced by the National Meteorological Information Center of China (Available online: http://cdc.cma.gov.cn/) [31]. Particularly, data is not available for the islands in the South China Sea and Taiwan at this time. Based on the daily precipitation records of 2472 national meteorological stations, the spatial interpolation method of thin-plate spline was used to generate gridded precipitation data and eliminate the effects of topography, thus ensuring that the spatial distribution of interpolated precipitation is very close to that of the actual precipitation [32].

2.2. Methods

The main statistical tools used in this study included composite analysis and the ordinary Student’s t-test. Only the results of the composite analysis satisfying the criteria to at least the 0.05 level were deemed statistically significant. According to the suggestion of Grumm and Hart [33], a 21-day binominal filter (10 days on either side of a specific day) was first applied to the daily data, which is an effective method for identifying typical synoptic to sub-monthly scale circulation patterns [25], aiming to highlight the daily variability of each variable. Secondly, based on the period of 1979–2015, the daily climatological mean value and standard deviation ( σ ) of each variable were calculated using the above smoothed daily data. Compared with using unsmoothed single-day values, the climatological mean value and standard deviation appear more stable. Finally, the normalized anomaly of a variable on a specific day was calculated as follows: the corresponding climatological daily mean was first subtracted to retain the majority of the synoptic signal, and the value was divided by the corresponding climatological daily standard deviation.
Based on the daily data, the indices of the EAP and SR teleconnection patterns (referred to as the EAPI and SRI, respectively) on synoptic to sub-monthly timescales were defined as follows [20]:
EAPI = [ Ζ * 500 ( 125 °   Ε , 20 °   Ν ) - Ζ * 500 ( 130 °   Ε , 37.5 °   Ν ) + Ζ * 500 ( 130 °   Ε , 62.5 °   Ν ) ] / 3
SRI = [ Z * 200 ( 65 °   Ε , 40 °   Ν ) - Z * 200 ( 100 °   Ε , 40 °   Ν ) + Z * 200 ( 130 °   Ε , 40 °   Ν ) ] / 3
where Z 200 and Z 500 indicate the 200 hPa and 500 hPa normalized geopotential height anomalies, respectively. The atmospheric diabatic heating rate (Q) was estimated by the apparent heat source calculated according to the widely-used scheme deduced by Yanai et al. [34], which takes the form of:
Q = c p [ T t + V h T + ( p p 0 ) R / c p ω θ p ]
where c p , T, and R denote the specific heat of dry air at constant pressure, air temperature, and the gas constant for dry air, respectively, p 0 = 1000 hPa, V is the horizontal vector winds, θ the potential temperature, ω the vertical p-velocity, p the pressure, and is the isobaric gradient operator.

3. Combined Effects of Teleconnection Patterns on Summer Precipitation in Southern China

Both the EAP and SR teleconnection patterns are dominant modes in the boreal summer [2]. This study aims to investigate and distinguish the separate and combined effects of these two key teleconnection patterns on precipitation in Southern China. Based on the EAPI and SRI, the typical single EAP, single SR, and combined EAP/SR patterns are first defined and identified (for simplicity, these will be referred to as EAP-S, SR-S and EAP/SR-C patterns, respectively).

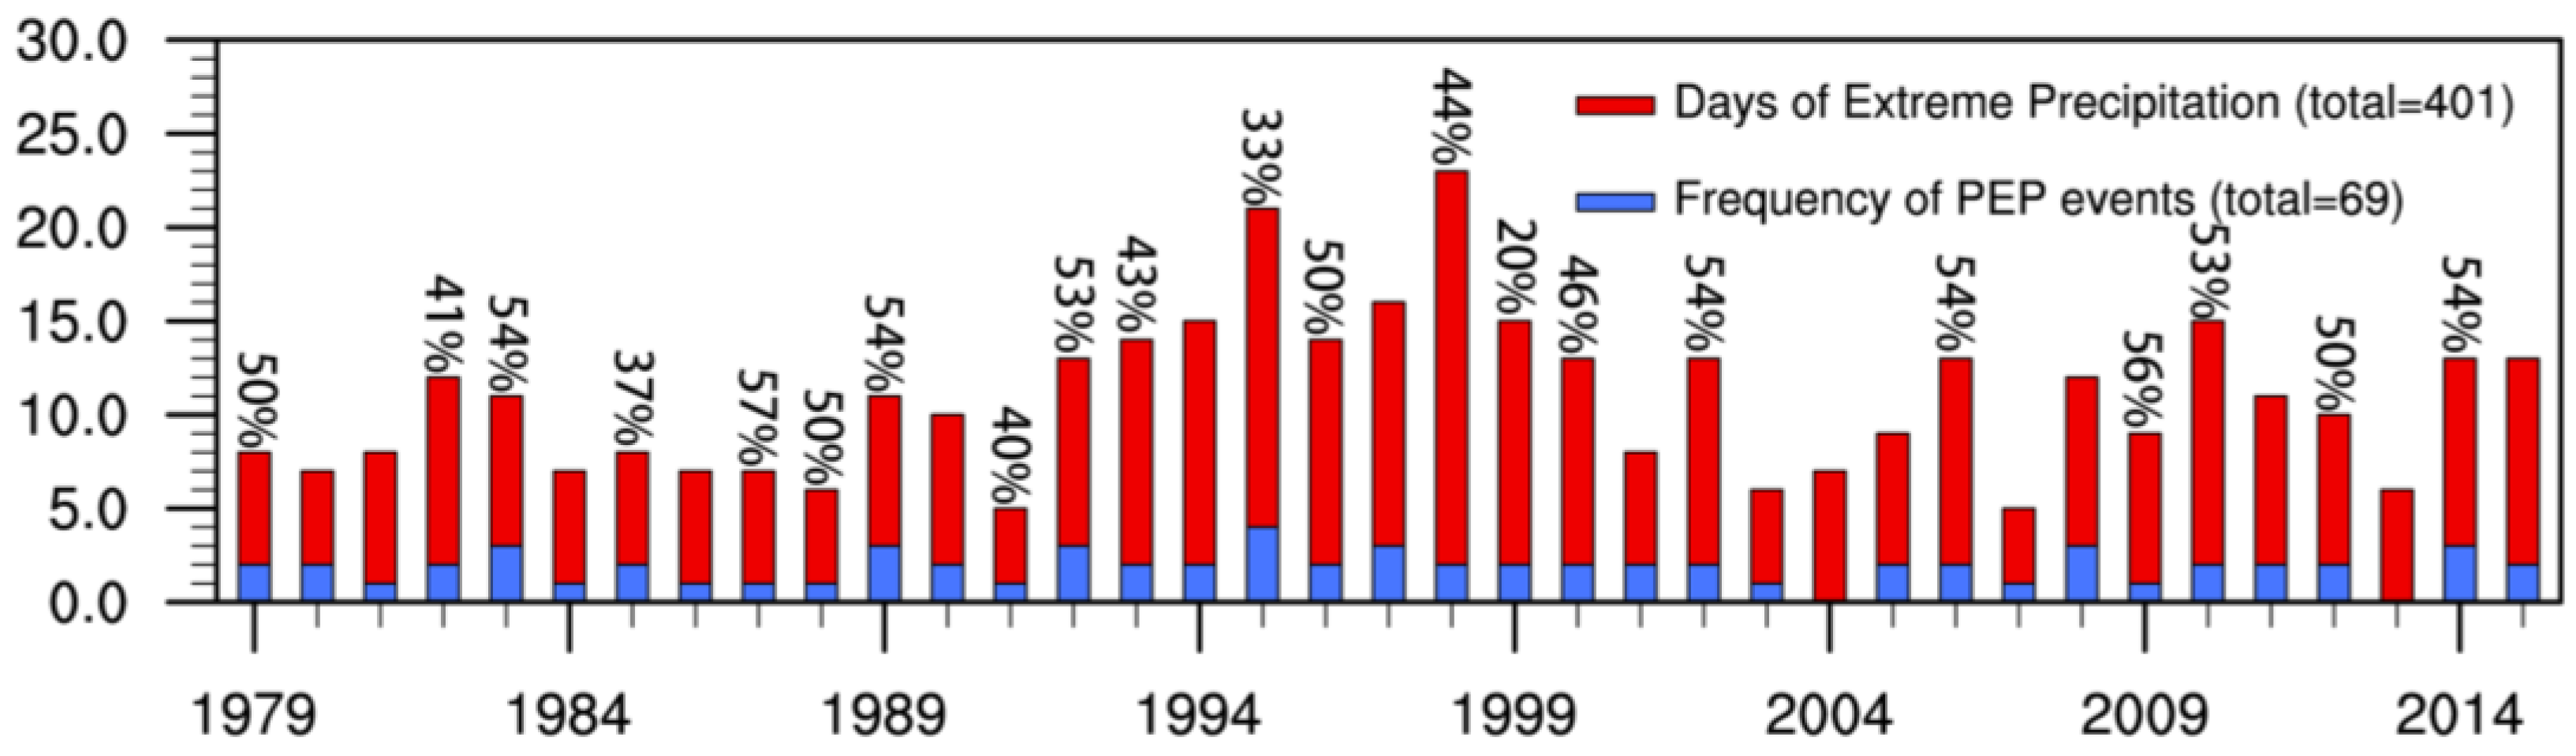
3.1. Definition and Identification of Typical Events

Typical examples of single and combined patterns are extracted by the EAPI and SRI. For convenience, day 0 denotes the start date of the typical events, and day (n) represents the day prior to (negative) and after (positive) the start date in this study.
A typical EAP-S (SR-S) event must meet the following three criteria simultaneously: (1) the value of EAPI (SRI) must be greater than +1.0 σ (less than −1.0 σ ) for at least three consecutive days; (2) the value of SRI (EAPI) should be greater than −0.5 σ (less than +0.5 σ ) and less than +0.5 σ (greater than −0.5 σ ) during the specific event; and (3) the 500 hPa (200 hPa) height anomalies corresponding to the three basic anomaly centers in Equation (1). (Equation (2)) should be distributed as ‘+, −, +’ (‘−, +, −’). Moreover, the criteria of the typical EAP/SR-C events include the following: (1) the EAPI must be greater than +1.0 σ for at least three consecutive days and the SRI must be less than −1.0 σ for at least three days during the specific event; and (2) the 500 hPa (200 hPa) height anomalies corresponding to the three anomaly centers in Equation (1). (Equation (2)) should be arranged as ‘+, −, +’ (‘−, +, −’).
Based on the above criteria, typical EAP-S, SR-S, and EAP/SR-C events will be identified for investigating the effects on summer extreme precipitation in Southern China. Extreme precipitation of at least three days’ duration is usually associated with long-lived anomalies in the large-scale circulation patterns [35]. To ensure an adequate sample size of identified cases, relaxed threshold of duration is necessary for identification [36]. Considering the relatively short persistence of extreme precipitation periods in Southern China, three consecutive days are therefore adopted as the minimum duration [25]. Relatively larger thresholds of duration (for example, five consecutive days) would lead to fewer samples of typical events. Besides, the threshold of three consecutive days has widely been accepted as the typical duration in previous studies [25,28].
The numbers of the typical EAP-S, SR-S, and EAP/SR-C events obtained from the daily indices are 17, 11, and 21, respectively. The year, start date, and end date of the identified typical events are displayed in Table 1. The results show that EAP/SR-C events prevail most frequently during early to mid-summer, but both EAP-S and SR-S events tend to be more significant during mid-to-late summer. In addition, identification of typical SR-S events indicates that Silk Road teleconnection patterns can exist and persist alone without the occurrence of EAP teleconnection patterns on synoptic to sub-monthly timescales. This means that the EAP and SR patterns do not coexist invariably. Of particular note is that the EAP/SR-C events tend to occur more frequently than both the EAP-S and SR-S events. As previously reported [24,25], the EAP teleconnection pattern and SR teleconnection pattern usually coexist in boreal summer, especially in June and July, which seems to confirm our finding. In fact, the relatively small sample size of single events may be attributed to the strict selection criteria of typical single events, aiming to eliminate the influence from the other pattern thoroughly. For example, it is possible that in some cases of identifying the EAP-S events, though EAP pattern appears and persists for at least three consecutive days, but the intensity of SR pattern fails to satisfy the criteria of ‘a typical EAP-S event’, a daily SRI reaching −0.5 σ or less during this period. However, the adoption of −1.0 σ would yield large sample size (about 35).
Composite indices and the horizontal structures of EAP-S, SR-S, and EAP/SR-C patterns are displayed in Figure 1. The results show that the EAP/SR-C events are simultaneously characterized by an anomalous north-south well-organized EAP pattern with an EAPI of more than +1.0 σ , and an upper-level SR pattern along the Asian jet stream with a SRI of less than −1.0 σ in the zonal direction (Figure 1a). In contrast, the combination tends to persist for a longer period (from day 0 to day 7) than single events (from day 0 to day 4). This implies that the interaction and coexistence between EAP and SR patterns may favor their own development and persistence [25].
Both wave trains can be clearly identified in the composite distribution of height anomalies at 500 hPa and 200 hPa (Figure 1d). A marked mid-latitude negative height anomaly centered from the coastal areas of eastern China to Japan can be detected in these three different patterns. Notably, enhanced and zonally-elongated negative height anomalies occur during EAP/SR-C events, which may be considered an overlap between the EAP and SR teleconnection patterns on synoptic to sub-monthly timescales.

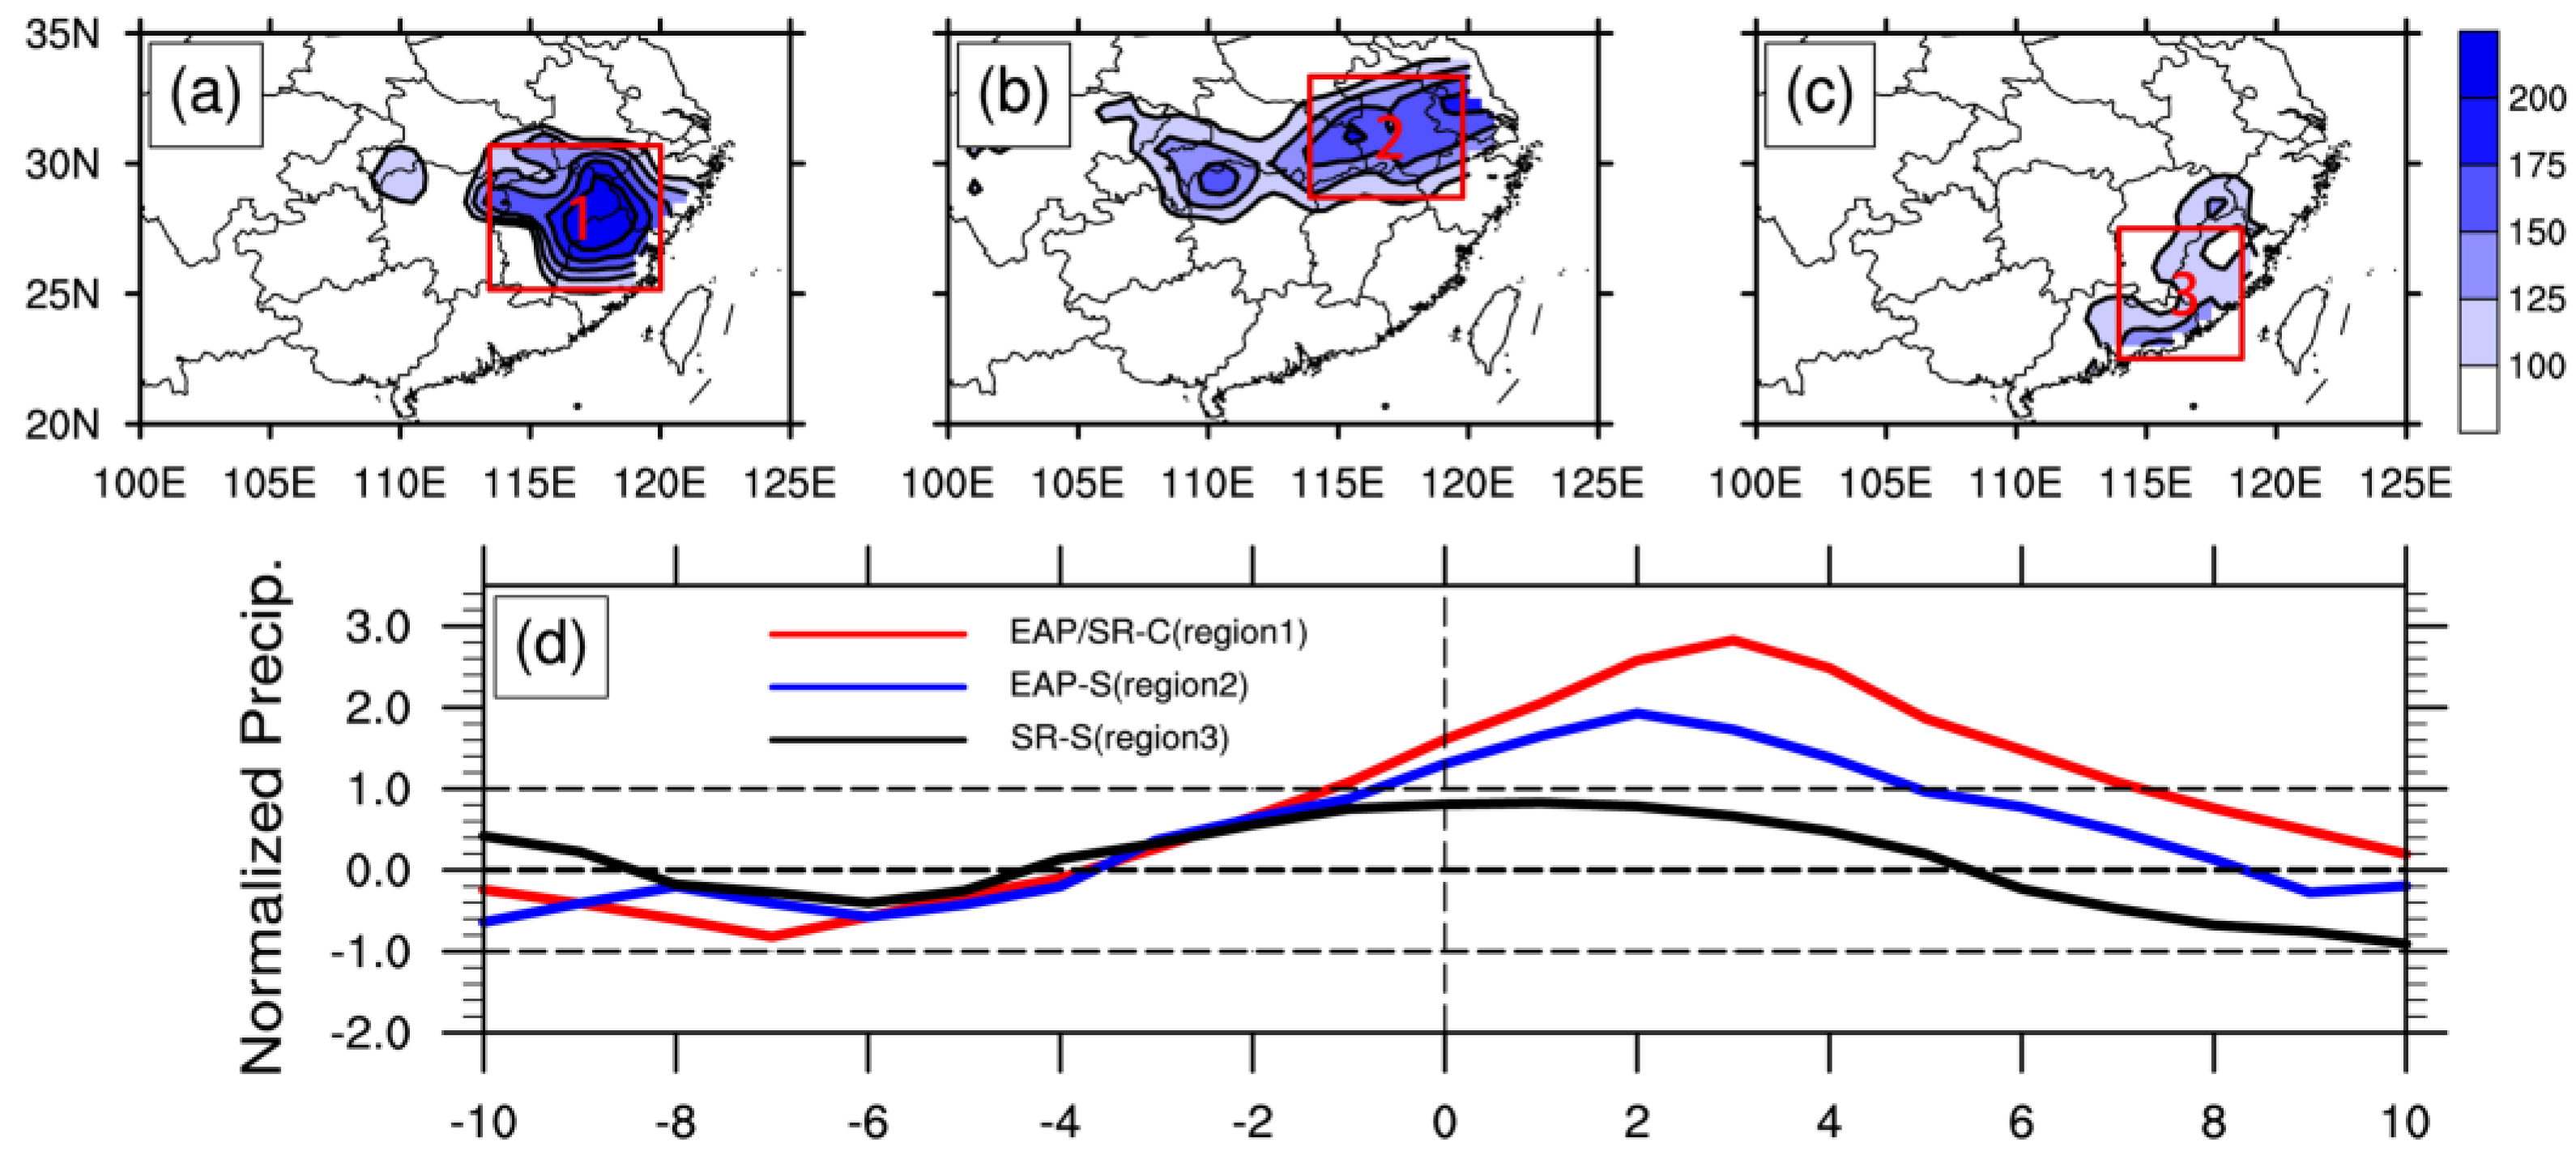
3.2. Spatial Distribution of Precipitation in Southern China

Teleconnection patterns have a tremendous influence on summer rainfall in Southern China [11,16]. Using the identified typical cases, their different effects on precipitation in Southern China are investigated in this section. Figure 2 shows the spatial distribution of accumulated precipitation in Southern China during typical EAP-S, SR-S, and EAP/SR-C events. The results reveal very different intensities and locations of accumulated precipitation. For typical EAP/SR-C events, accumulated precipitation of more than 200 mm can be observed in the Yangtze River Valley (YRV, 114–120° E, 25–30° N), which is significantly higher than for the EAP-S and SR-S events. Typical EAP-S events are characterized by intense precipitation centered in the Yangtze-Huai River Valley (YHRV, 114–120° E, 28–33° N), with accumulated precipitation of more than 150 mm (Figure 2b). As for SR-S events, accumulated precipitation of more than 100 mm is predominantly located in the coastal areas of southeast China (Figure 2c), with less rainfall in the YHRV and YRV.
There is a distinct difference in the positions of the accumulated precipitation; thus, three key regions are selected to calculate the normalized regional averaged precipitation. The evolution of domain-averaged normalized precipitation in region-1 (114–120° E, 25–30° N), region-2 (114–120° E, 28–33° N), and region-3 (114–118° E, 22.5–27.5° N) reflects the temporal variation features of rainfall during typical EAP/SR-C, EAP-S, and SR-S events, respectively (Figure 2d). Daily normalized domain-averaged precipitation in the region-1 with a standard deviation ( σ ) of more than 1.0 persists from day −1 to day 6 during EAP/SR-C events. The extreme precipitation cases in this study are identified based on 1.0 σ or greater of daily normalized domain-averaged precipitation in the YRV (region-1), and Persistent Extreme Precipitation (PEP) events refer to cases composed of at least three consecutive days with extreme precipitation [28,36]. Accordingly, this indicates the occurrence of summer PEP in the YRV during EAP/SR-C events. Furthermore, the identification based on 1.0 σ may reflect 40–50 mm day1 or greater in the precipitation center at an individual station level [25]. Although 40–50 mm day1 is not particularly extreme in the YRV during monsoon season, the accumulated amount of over 200 mm, due to its long duration, is highly likely to trigger a severe, large-scale flood within just a few days.
In contrast, during typical EAP-S events, daily normalized domain-averaged precipitation of more than 1.0 σ is detected during the period from day 0 to day 4, with a relatively shorter duration than EAP/SR-C events. Within region-3, daily normalized domain-averaged precipitation of more than 1.0 σ is not clearly observed during SR-S events, indicating the relatively weaker precipitation intensity. This implies that the combination of EAP and SR patterns may have a more effective contribution to precipitation in Southern China than the single events. The absence of intense precipitation during typical SR-S events suggests that the EAP pattern seems to be an essential factor for extreme precipitation in Southern China, and the SR pattern cannot cause extreme precipitation in Southern China directly [6,13,22]. However, the SR pattern may contribute to the development and preservation of the EAP pattern [21], and the combination of EAP and SR patterns may provide favorable conditions for persistent rainfall in Southern China, inducing PEP.
It has to be stated that the combination of EAP and SR teleconnection patterns indeed represents only one of the favorable factors responsible for such prolonged extreme precipitation events in the YRV. Figure 3 presents the temporal variation of summer extreme precipitation cases and the occurrence frequencies of PEP events within the YRV in each summer (JJA) of 1979–2015. Accordingly, 113 extreme summer precipitation cases can be extracted from the 129 days accumulated by all the identified EAP/SR-C events (Table 1), which account for about 28.2% of the 401 total summer extreme precipitation days in the YRV during 1979–2015. Furthermore, during the summers with the typical EAP/SR-C events, more than 40% summer extreme precipitation cases are related to the identified EAP/SR-C events, except for the summers of 1985, 1995, and 1999.
In addition, these 21 typical EAP/SR-C events account for about 30.9% of the total 68 PEP events in the YRV during 1979–2015. Of particular note is that the remaining 71.8% summer extreme precipitation cases and 69.1% PEP events are not absolutely exempt from influences of the combination. It is possible that, although the EAP and SR teleconnection patterns can also be detected in some PEP cases, their intensities are not as conducive as their counterparts in these 21 typical EAP/SR-C events, and fail to satisfy the criterion of ‘a typical combined event’. Thus, the contribution of weak or even obscure combinations in triggering PEP events may be relatively smaller compared with the counterpart of the identified typical EAP/SR-C events in Table 1. Consequently, these 21 identified typical EAP/SR-C events are more suitable for investigating the possible mechanisms of summer PEP in the YRV. Furthermore, considering the diversity and complexity of underlying mechanisms responsible for summer PEP in the YRV [25], this percentage may highlight the importance of the combination in inducing summer PEP events in the YRV.

4. Corresponding Anomalous Circulation Patterns

Composite analyses reveal the different intensities and positions of precipitation in these three patterns. Particularly, Persistent Extreme Precipitation (PEP) in the YRV is clearly observed during typical EAP/SR-C events. In this section, corresponding anomalous circulation patterns, moisture conditions, and vertical motions are further explored to verify the marked differences in precipitation among the three patterns. Finally, a schematic diagram of anomalous circulation patterns related to PEP during EAP/SR-C events will be presented.

4.1. Upper-Level Divergence

In the upper troposphere, prior to the onset of EAP/SR-C events, large-scale circulation is characterized by the eastward extension of the South Asia High (SAH, 1250 dagpm-contours, black dashed lines in Figure 4), which can be traced back to day −10 (Figure 4). By day −4, the east boundary of the SAH reaches 125° E and remains around the coastal areas of China for several days.
North of the SAH, due to the development of mid-latitude negative height anomalies of more than 1.0 σ below normal, the upper-level westerly jet (shadings in Figure 4) gradually displaces equatorward and remains in the region immediately north of the YRV and east of Japan. Uccellini and Kocin [37] indicated that the accelerating westerly jet can cause upper-level divergence in the entrance region. It is notable that the YRV is located beneath the southern section of the westerly jet.
From day 0 onward, an anomalous mid-latitude cyclone originates from eastern China to Japan. During the following four days, as the SAH extends east of 120° E, strong northerlies prevail upstream of the YRV. The anomalous mid-latitude cyclone embedded in these northerlies strengthens substantially, with a zonally elongated structure. Thus, deepening of the anomalous mid-latitude cyclone results in a sharper meridional height gradient from the YRV to the vicinity of Japan (blue contours in Figure 4), stimulating further acceleration of the westerly jet, which can significantly enhance and maintain upper-level divergence throughout the EAP/SR-C events [38]. An anomalous cyclone/anticyclone/cyclone pattern can be clearly identified along the Asian jet during the period from day 0 to day 6, which indicates the formation and preservation of the Silk Road teleconnection pattern related to the EAP/SR-C events.
Figure 5 presents the corresponding distribution of divergent winds and vorticity at 200 hPa during the EAP/SR-C events. It shows anomalous upper-level divergence (vectors) over the YRV, with a more significant positive velocity potential center (red contours), which originates from southeastern China and begins to migrate eastward from day 2 onward. Holton [39] noted that extra positive vorticity can also trigger upper-level divergent winds. Correspondingly, positive vorticity (blue contours) advection toward the regions of divergence by means of the northerlies related to the anomalous mid-latitude cyclone in the upper troposphere maintains the upper-level divergence from day 0 to day 6. From day 6 onward, with the deceleration of the westerly jet, both the divergence and positive velocity potential centers shift to the east of 130° E and weaken slightly due to dissipation of positive vorticity advection from mid-latitudes, which is corresponding to the termination of PEP in the YRV (Figure 2d).
Upper-level divergence, in particular, is not evident during either EAP-S or SR-S events, due to the relatively weaker westerly jet. Divergent winds and significant positive velocity potential cannot be clearly observed during these events (figure not show). Moreover, upper-level divergent winds may be highly beneficial for the development of ascending motion responsible for PEP in the YRV during EAP/SR-C events [30,35], which will be discussed in Section 4.3.

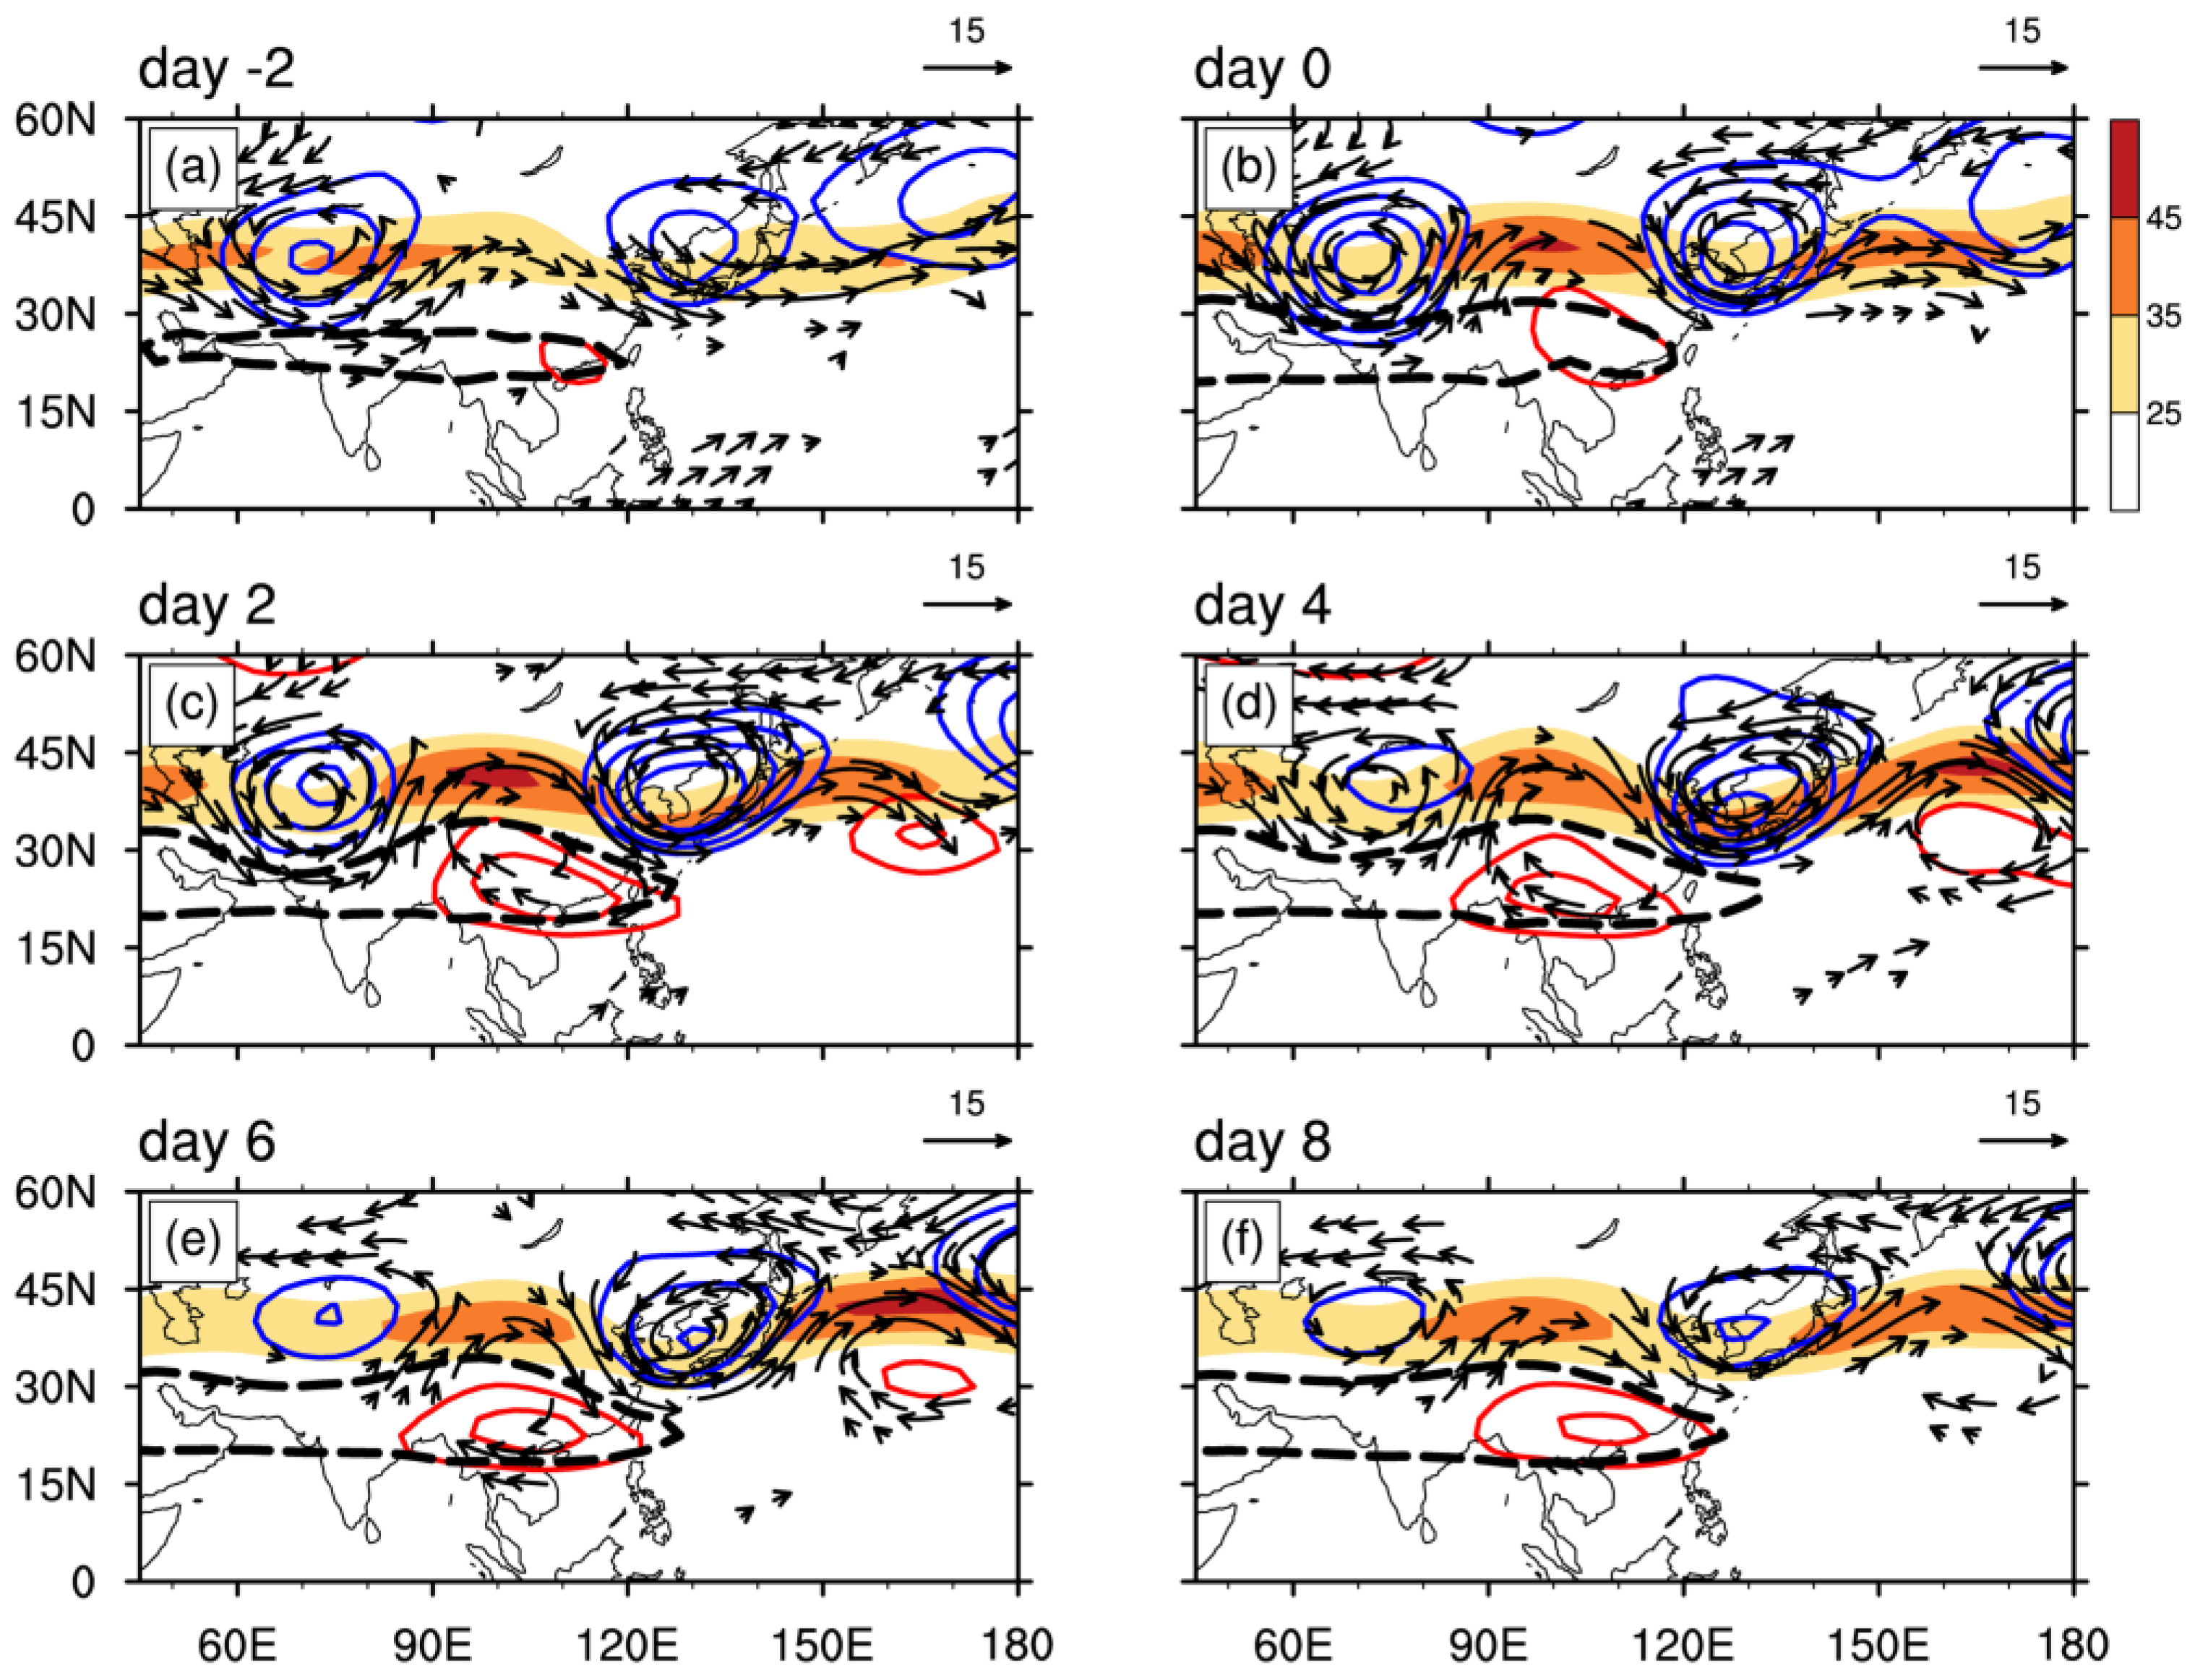
4.2. Anomalous Circulation in the Middle Troposphere

Prior to the onset of typical EAP/SR-C events, the most significant feature of the large-scale circulation at 500 hPa is the gradual westward extension of the WPSH, which can be traced back to day −10 (Figure 6). During the following four days, the westward extension of the WPSH accelerates obviously. By day −4, the western boundary of the WPSH reaches 120° E. Concurrently, the SAH stretches eastward, encountering the western boundary of the WPSH. A similar zonal advance between the SAH and WPSH has been widely used as an important precursor for precipitation during boreal summer in various studies [40,41,42]. During EAP/SR-C events, an overlap between the WPSH and SAH remains over the coastal region of southeastern China for several days. From day 6 onward, the WPSH and SAH diverge from each other in opposite directions and retreat to their normal positions, reflecting the decay of PEP in the YRV.
In addition to the concurrent anomalous behavior of the WPSH and SAH, an anomalous mid-latitude trough forms above the downstream area of the YRV from day 0, consistent with the mid-latitude action center of the EAP pattern [5]. Subsequently, the mid-latitude trough deepens substantially, thereby steering the northerlies from the mid-latitudes towards the YRV, contributing to southward intrusion of cold/dry air from mid-latitudes in the middle troposphere [35].
Similarly, a distinct zonal advance between the WPSH and SAH can also be identified during EAP-S events (red lines in Figure 6), and both the WPSH and SAH displace more to the north than during EAP/SR-C events, providing favorable conditions for precipitation in the YRV (Figure 2b). However, from day 2 onward, the WPSH and SAH depart from each other towards the opposite directions. Owing to a relatively shorter duration of the overlap between these two key systems related to EAP-S events, precipitation persists for a shorter period (from day 0 to day 4) than during combined events. As for SR-S events, the SAH remains in its normal position, and the relatively weaker WPSH remains in an unfavorable position for precipitation (Figure 7c), resulting in less rainfall in Southern China [41].
This analysis indicates that such a coupling of the EAP and SR teleconnection patterns plays a vital role in the zonal advance and preservation between the WPSH and SAH, resulting in a stronger-than-normal precipitation increase in the YRV. This reveals that their combined effect on precipitation is more efficient than that of a single pattern [23,24]. Moreover, the obvious zonal advance between the SAH and WPSH occurs in both EAP/SR-C and EAP-S events. The absence of concurrent behavior between them in SR-S events (Figure 7c) implies that EAP teleconnection patterns are an essential factor for zonal advance between these two key systems, favoring the development of precipitation [25].

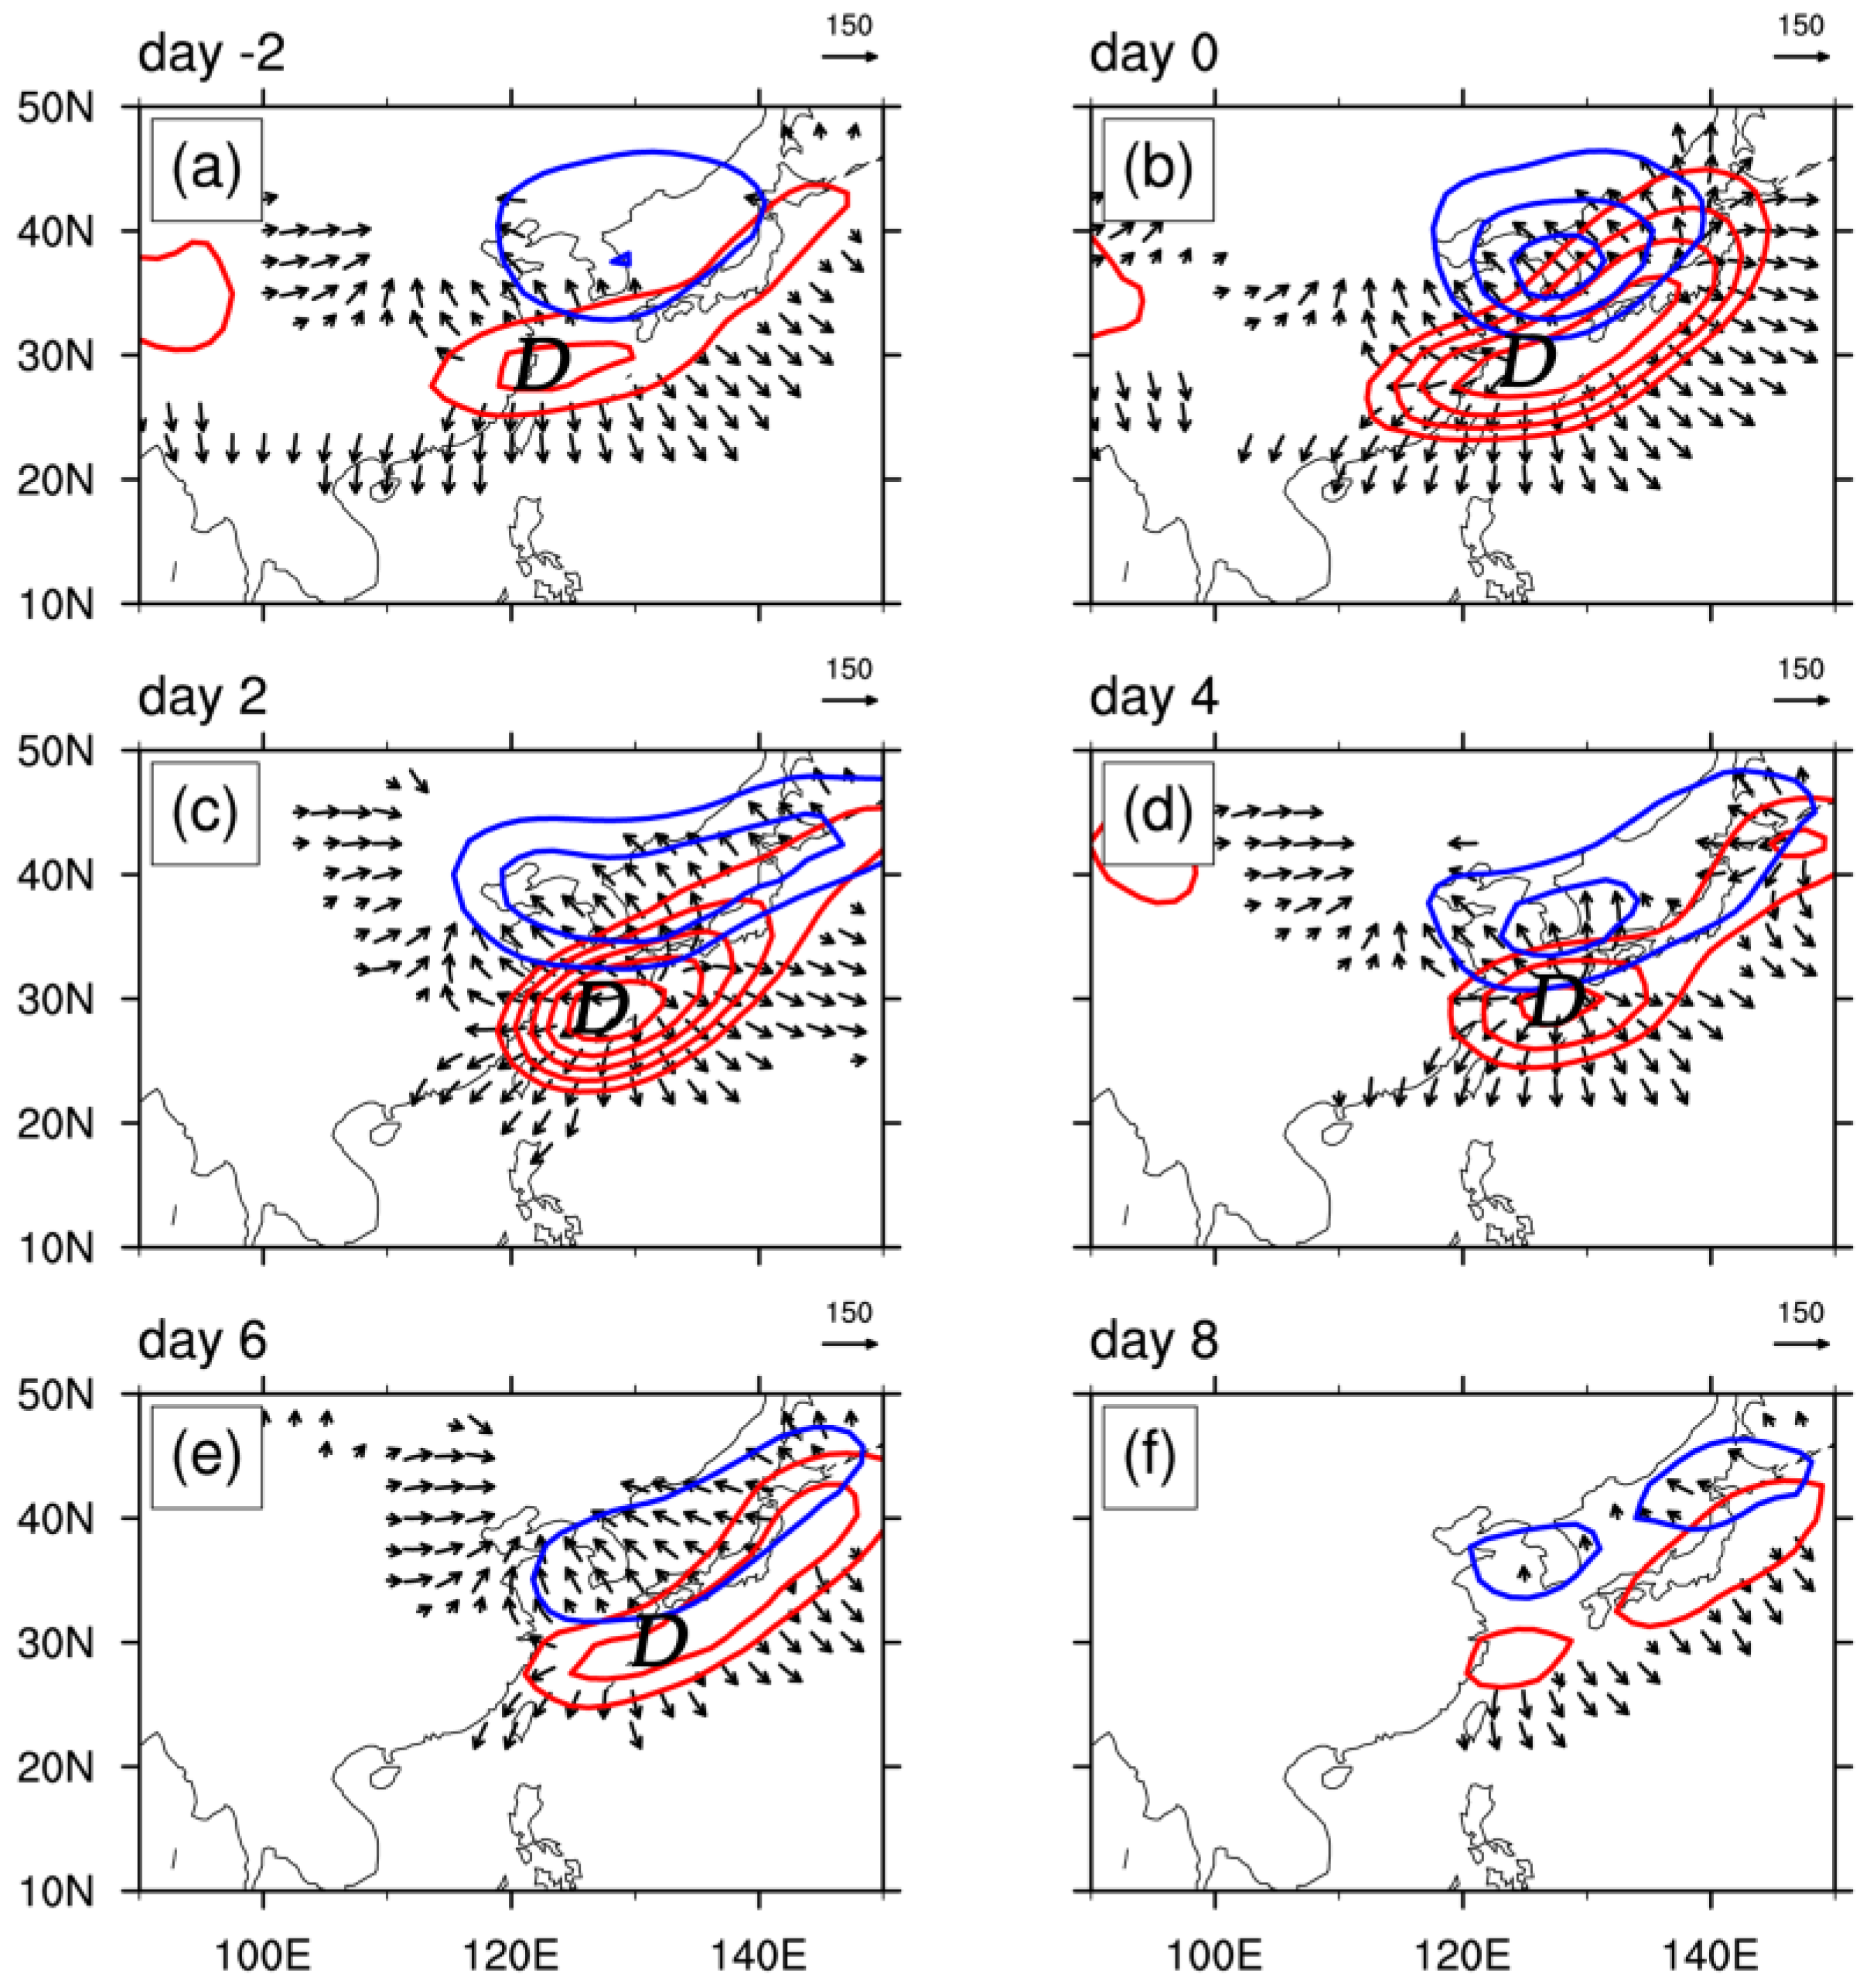
4.3. Low-Level Moisture Transport and Vertical Motion

In the lower troposphere, an anomalous cyclone/anticyclone pair (‘C/A’ in Figure 8a) related to EAP/SR-C events can be identified along the East Asian coast, shifting westward and strengthening simultaneously from day −4 onward (Figure 9). By day −2, the western boundary of the anomalous low-latitude anticyclone reaches west of 125° E. During typical EAP/SR-C events, owing to the further intensification and westward extension of the WPSH, the greatly enhanced low-level southwesterlies to the northern flank of the low-latitude anticyclone advect anomalously abundant moisture toward the YRV, resulting in a more significant moisture flux with a magnitude anomaly more than 1.0 σ above normal. This diagnosis of moisture conditions during EAP/SR-C events indicates that moisture transport is primarily ascribed to the anomalous anticyclone associated with the westward-extended WPSH, rather than the southwesterlies from the Bay of Bengal [43].
Moreover, accompanying development of the anomalous mid-latitude cyclone are northerlies from mid-latitudes (45° N), which prevail in the upstream of the YRV and strengthen significantly from day 0 onward, steering the low-level cold and dry air required by the frontogenesis into the YRV [25]. Accordingly, the confluence between southwesterlies to the northern flank of the low-latitude anticyclone and these northerlies induces enhanced moisture convergence over the YRV during EAP/SR-C events (Figure 8d). The time-latitude section shows that both the moisture flux with a magnitude anomaly more than 1.0 σ above normal, and strong moisture convergence in the YRV can persist from day 2 to day 8. Such accumulation and preservation of the moisture flux and convergence satisfy the moisture supply for PEP.
As reported previously, relatively marked humidity and temperature gradients are widely used to depict the Mei-Yu front [28,42]. Within the strong moisture convergence region, a thick and moist layer (indicated by the specific humidity in Figure 10) forms in the lower troposphere (below 600 hPa) from day −2 onward, with a significantly enhanced temperature gradient in the northern YRV, resembling a quasi-stationary Mei-Yu front. Subsequently, the moist layer tends to be thicker. During EAP/SR-C events, the quasi-stationary front persists over the YRV for a longer period, providing unstable conditions for PEP.
Similar abundant moisture is primarily transported by anomalous low-level southwesterlies during EAP-S events, with a similar moisture convergence center in the YRV, which is characterized by a moisture flux with a magnitude more than 1.0 σ above normal to the northern flank of the WPSH. However, the WPSH weakens rapidly and retrogrades to its normal position, decelerating the southwesterlies. In contrast to the long duration of the significant moisture flux and strong moisture convergence during EAP/SR-C events, due to the weakening of southwesterlies [43], both the moisture flux and convergence within region-2 rapidly weaken to dissipation during EAP-S events (Figure 8e), terminating the precipitation process. Correspondingly, the daily normalized domain-averaged precipitation of 1.0 σ above normal shows a relatively shorter duration (from day 0 to day 4). This may explain why EAP-S events cannot induce PEP in Southern China. Owing to the relatively weaker WPSH and the absence of an anomalous low-latitude anticyclone during the SR-S events, the southwesterlies originating from the Bay of Bengal account for moisture transport to the coastal areas of southeastern China (Figure 8c). This implies that the anomalous anticyclone/cyclone pair associated with the EAP teleconnection pattern is an essential factor for moisture transport in the YRV [25,43].
Such strong moisture convergence may enhance atmospheric instability and local ascent [44]. During EAP/SR-C events, such leading moisture convergence triggers an important characteristic of vertical motion, with pronounced ascent around the anomalously abundant moisture flux areas along the quasi-stationary front (Figure 11). From day 0 onward, anomalous descents are also observed to the immediate south and north of the YRV. In addition, a well-organized wave-like pattern of anomalous Q (shading) with reverse signs can be identified over East Asia, consisting of heating anomalies in the YRV between 25° N and 30° N (region-1 in Figure 2a), and cooling anomalies in the regions immediately south and north of the YRV. The diabatic heating anomalies and vertical velocity display almost out-of-phase variations, with the pronounced ascent of warm and moist air prevailing well over the YRV, and the descent of cold air between 10° N and 22.5° N in the coastal areas of southeast China. Currently, these above-mentioned ascending and descending motions, low-level strong southwesterlies to the northern flank of the WPSH (Figure 9), and upper-level northerlies to the northeast periphery of the SAH (Figure 4), form an anomalous thermal-inducing vertical circulation cell over East Asia [28,45]. This vertical circulation cell may be highly beneficial for the development and preservation of precipitation in the YRV [25,28]. From day 2 onward, although the descent to the north of 35° N shows a sharp decrease due to the dissipation of diabatic cooling anomalies, the anomalous vertical circulation cell maintains its strong ascent over the YRV throughout the EAP/SR-C events, contributing to the persistence of extreme precipitation.
During the decay of EAP/SR-C events, with the eastward retreat and weakening of the WPSH, the anomalous anticyclone/cyclone pair shifts eastward and rapidly weakens to dissipation, indicating the disappearance of EAP pattern, which therefore weakens the southwesterlies required by the moisture transportation [38]. Consequently, both the anomalously abundant moisture transport towards the YRV and the corresponding moisture convergence vanish simultaneously from day 6 onward, resulting from the dissipation of the southwesterlies. In addition, the well-organized tripole structure of Q anomalies fades away gradually, and the diabatic heating anomalies disappear in the YRV, leading to a decay of the ascent along the quasi-stationary front [28]. Thus, these factors result in the termination of PEP in the YRV.

5. Discussion and Conclusions

In this study, the combined effects of the East Asia-Pacific (EAP) and Silk Road (SR) teleconnection patterns on summer precipitation in Southern China were investigated using ERA-Interim reanalysis daily data and daily precipitation from China’s Ground Precipitation 0.5° × 0.5° Gridded Dataset (V2.0) on synoptic to sub-monthly timescales. The main conclusions are summarized as follows, with a schematic diagram (Figure 12).
Typical event characteristics of single EAP (EAP-S), single SR (SR-S), and combined (EAP/SR-C) patterns were identified based on the daily indices. The results revealed marked differences among the three types of events according to both their spatial distribution and precipitation intensities in Southern China. Persistent Extreme Precipitation (PEP) was identified in the Yangtze River Valley (YRV) during EAP/SR-C events, with daily normalized domain-averaged precipitation of more than one standard deviation for several days. Furthermore, the precipitation intensity of EAP/SR-C events was much stronger than that of single events.
These differences are closely associated with the different anomalous circulation patterns of different events [25,42]. In the upper troposphere, prior to the onset of EAP/SR-C events, the westerly jet is gradually displaced equatorward and tends to remain to the immediate north of the YRV. Correspondingly, the YRV is located beneath the southern section of the westerly jet entrance region, where strong divergence exists (at 200 hPa in Figure 12). During typical EAP/SR-C events, with the development of the SR pattern, the intensification of an anomalous cyclone at mid-latitudes over East Asia contributes to further acceleration of the westerly jet and stronger upper-level divergence [37]. Meanwhile, the South Asia High (SAH) extends eastward of 120° E, inducing northerly flows to the northeast of the SAH, which prevail upstream of the YRV. The anomalous mid-latitude cyclone embedded in these northerlies promotes positive vorticity advection toward the immediate north of the YRV. Extra positive vorticities therefore trigger the eastward progression and preservation of upper-level divergent winds throughout the EAP/SR-C events, which provide favorable ascent for PEP [39].
The middle troposphere is characterized by a distinct zonal approach and advance between the SAH and Western Pacific Subtropical High (WPSH) prior to the onset of EAP/SR-C events (at 200 hPa and 500 hPa in Figure 12). Subsequently, both the SAH and WPSH remain in favorable positions for the development and preservation of precipitation [41,42]. Although a similar zonal advance between these two key systems can also be identified before and during typical EAP-S events, the SAH and WPSH rapidly retreat to their normal positions, which may inhibit the development of PEP. As for SR-S events, these two key systems always remain in unfavorable positions for precipitation in Southern China.
In the lower troposphere, an anomalous cyclone/anticyclone pair related to the EAP teleconnection pattern results in strong southwesterlies from low-latitudes [45], advecting anomalously abundant moisture toward the YRV for several days during EAP/SR-C events, resulting in a more significant moisture flux with a magnitude anomaly more than 1.0 σ above normal compared to single events (at 850 hPa in Figure 12). Meanwhile, northerly flows from the mid-latitudes, steered by the deep trough, prevail in the middle troposphere, promoting the southward intrusion of cooling/dry air from mid-high latitudes required by the frontogenesis into the YRV [43]. Therefore, the confluence of northerlies and southwesterlies contributes to stronger moisture convergence, enhancing atmospheric instability and local ascent [25,28]. Moreover, the well-organized pattern of anomalous diabatic heating (Q) maintains an anomalous thermal-inducing vertical circulation cell to the immediate south of the YRV. The strong ascent of warm/moist air along a quasi-stationary front persists throughout EAP/SR-C events, providing favorable and unstable conditions for PEP in the YRV [28].
After EAP/SR-C events, the decay of EAP and SR patterns weakens the anomalous mid-latitude cyclone, and the SAH retreats to its normal position, inducing the eastward movement of upper-level divergence. Subsequently, this divergence rapidly weakens to dissipation. Furthermore, the WPSH and SAH diverge from each other in opposite directions, and the low-level anticyclone/cyclone pair vanishes, with the decay of the southwesterlies required by moisture transport toward the YRV. Therefore, ascending motion along the quasi-stationary front in the YRV is largely suppressed and ultimately turns into a descending motion. Accordingly, such unfavorable conditions lead to the termination of PEP.
This study reveals that the EAP pattern is a key factor in inducing summer extreme precipitation in Southern China on the synoptic to sub-monthly timescales, and the SR pattern cannot cause extreme precipitation in Southern China directly. According to the above composite analyses, the SR pattern may contribute to the development and maintenance of the EAP pattern, thereby affecting the extreme precipitation indirectly. Particularly, the coexistence and combination of the EAP and SR patterns leads to summer persistent extreme precipitation in the YRV. Based on the interaction between these two teleconnection patterns, it is quite possible to take synoptic-scale patterns as precursors for the summer extreme precipitation in Southern China. As such, additional attention needs to be paid to the formation mechanism and prediction of this combination.

Acknowledgments

This work was jointly supported by the China Meteorological Administration Special Public Welfare Research Fund Province (GYHY201406024), the Major Program of the Natural Science Researches for Colleges and Universities in Jiangsu Province (14KJA170004), the National Natural Science Foundation of China (41575081), and Creative Program of the State Key Laboratory of Severe Weather (2015LASW-A03), and the Priority Academic Program Development of Jiangsu Higher Education Institutions (PAPD).

Author Contributions

Lijuan Wang conceived the research and provided logistics and technical guidance. Chao Wang analyzed the work and wrote the paper.

Conflicts of Interest

The authors declare no conflict of interest. The founding sponsors had no role in the design of the study; in the collection, analyses, or interpretation of data; in the writing of the manuscript, and in the decision to publish the results.

References

  1. Huang, R.H. The numerical simulation of the three-dimensional teleconnections in the summer circulation over the Northern Hemisphere. Adv. Atmos. Sci. 1985, 2, 81–92. [Google Scholar] [CrossRef]
  2. Nitta, T. Convective activities in the tropical western Pacific and their impact on the Northern Hemisphere summer circulation. J. Meteorol. Soc. Jpn. 1987, 65, 373–390. [Google Scholar] [CrossRef]
  3. Kurihara, K. A climatological study on the relationship between the Japanese summer weather and the subtropical high in the western North Pacific. Geophys. Mag. 1989, 43, 45–104. [Google Scholar]
  4. Kosaka, Y.; Nakamura, H. Structure and dynamics of the summertime Pacific–Japan teleconnection pattern. Q. J. R. Meteorol. Soc. 2006, 132, 2009–2030. [Google Scholar] [CrossRef]
  5. Bueh, C.; Shi, N.; Ji, L.R.; Wei, J.; Tao, S.Y. Features of the EAP events on the medium-range evolution process and the mid-and high-latitude Rossby wave activities during the Meiyu period. Chin. Sci. Bull. 2008, 53, 610–623. [Google Scholar] [CrossRef]
  6. Enomoto, T.; Hoskins, B.J.; Matsuda, Y. The formation mechanism of the Bonin high in August. Q. J. R. Meteorol. Soc. 2003, 129, 157–178. [Google Scholar] [CrossRef]
  7. Guan, Z.Y.; Yamagata, T. The unusual summer of 1994 in East Asia: IOD teleconnections. Geophys. Res. Lett. 2003, 30, 235–250. [Google Scholar] [CrossRef]
  8. Ding, Q.H.; Wang, B. Circumglobal teleconnection in the Northern Hemisphere summer. J. Clim. 2005, 18, 3483–3505. [Google Scholar] [CrossRef]
  9. Ding, Q.H.; Wang, B. Intraseasonal teleconnection between the summer Eurasian wave train and the Indian Monsoon. J. Clim. 2007, 20, 3751–3767. [Google Scholar] [CrossRef]
  10. Lau, K.M.; Kim, K.M.; Yang, S. Dynamical and boundary forcing characteristics of regional components of the Asian summer monsoon. J. Clim. 2000, 13, 2461–2482. [Google Scholar] [CrossRef]
  11. Huang, R.H.; Sun, F.Y. Impact of the convective activities over the western tropical Pacific warm pool on the intraseasonal variability of the East Asian summer monsoon. Chin. J. Atmos. Sci. 1994, 146, 289–296. (In Chinese) [Google Scholar]
  12. Lau, K.M.; Weng, H. Recurrent teleconnection patterns linking summertime precipitation variability over East Asia and North America. J. Meteorol. Soc. Jpn. 2002, 80, 1309–1324. [Google Scholar] [CrossRef]
  13. Kosaka, Y.; Chowdary, J.S.; Xie, S.P.; Min, Y.M.; Lee, J.Y. Limitations of seasonal predictability for summer climate over East Asia and the Northwestern Pacific. J. Clim. 2012, 25, 7574–7589. [Google Scholar] [CrossRef]
  14. Krishnan, R.; Sugi, M. Baiu rainfall variability and associated monsoon teleconnections. J. Meteorol. Soc. Jpn. 2001, 79, 851–860. [Google Scholar] [CrossRef]
  15. Ye, H.; Lu, R.Y. Subseasonal variation in ENSO-related East Asian rainfall anomalies during summer and its role in weakening the relationship between the ENSO and summer rainfall in eastern China since the late 1970s. J. Clim. 2011, 24, 2271–2284. [Google Scholar] [CrossRef]
  16. Hong, X.W.; Lu, R.Y. The meridional displacement of the summer Asian jet, Silk Road pattern, and tropical SST anomalies. J. Clim. 2016, 29, 3753–3766. [Google Scholar] [CrossRef]
  17. Lu, R.Y.; Oh, J.H.; Kim, B.J. A teleconnection pattern in upper-level meridional wind over the North African and Eurasian continent in summer. Tellus A 2002, 54, 44–55. [Google Scholar] [CrossRef]
  18. Wang, N.; Zhang, Y.C. Evolution of Eurasian teleconnection pattern and its relationship to climate anomalies in China. Clim. Dyn. 2015, 44, 1017–1028. [Google Scholar] [CrossRef]
  19. Saeed, S.; Lipzig, N.V.; Müller, W.A.; Saeed, F.; Zanchettin, D. Influence of the circumglobal wave-train on European summer precipitation. Clim. Dyn. 2014, 43, 503–515. [Google Scholar] [CrossRef]
  20. Wakabayashi, S.; Kawamura, R. Extraction of major teleconnection patterns possibly associated with the anomalous summer climate in Japan. J. Meteorol. Soc. Jpn. 2004, 82, 1577–1588. [Google Scholar] [CrossRef]
  21. Kosaka, Y.; Nakamura, H. Mechanisms of meridional teleconnection observed between a summer monsoon system and a subtropical anticyclone. Part I: The Pacific–Japan pattern. J. Clim. 2010, 23, 5085–5108. [Google Scholar] [CrossRef]
  22. Ogasawara, T.; Kawamura, R. Effects of combined teleconnection patterns on the East Asian summer monsoon circulation: Remote forcing from low-and high-latitude regions. J. Meteorol. Soc. Jpn. 2008, 86, 491–504. [Google Scholar] [CrossRef]
  23. Hsu, H.H.; Lin, S.M. Asymmetry of the tripole rainfall pattern during the East Asian summer. J. Clim. 2007, 20, 4443–4458. [Google Scholar] [CrossRef]
  24. Kosaka, Y.; Xie, S.P.; Nakamura, H. Dynamics of interannual variability in summer precipitation over East Asia. J. Clim. 2011, 24, 5435–5453. [Google Scholar] [CrossRef]
  25. Chen, Y.; Zhai, P.M. Synoptic-scale precursors of the East Asia/Pacific teleconnection pattern responsible for persistent extreme precipitation in the Yangtze River Valley. Q. J. R. Meteorol. Soc. 2015, 141, 1389–1403. [Google Scholar] [CrossRef]
  26. Choi, K.S.; Wu, C.C.; Cha, E.J. Change of tropical cyclone activity by Pacific-Japan teleconnection pattern in the western North Pacific. J. Geophys. Res. Atmos. 2010, 115. [Google Scholar] [CrossRef]
  27. Ogasawara, T.; Kawamura, R. Combined effects of teleconnection patterns on anomalous summer weather in Japan. J. Meteorol. Soc. Jpn. 2007, 85, 11–24. [Google Scholar] [CrossRef]
  28. Chen, Y.; Zhai, P.M. Mechanisms for concurrent low-latitude circulation anomalies responsible for persistent extreme precipitation in the Yangtze River Valley. Clim. Dyn. 2016, 47, 989–1006. [Google Scholar] [CrossRef]
  29. Dee, D.P.; Uppala, S.M.; Simmons, A.J.; Berrisford, P.; Poli, P.; Kobayashi, S.; Andrae, U.; Balmaseda, M.A.; Balsamo, G.; Bauer, P.; et al. The ERA-Interim reanalysis: Configuration and performance of the data assimilation system. Q. J. R. Meteorol. Soc. 2011, 137, 553–597. [Google Scholar] [CrossRef]
  30. Zhong, S.X.; Chen, Z.T. The Impacts of atmospheric moisture transportation on warm sector torrential rains over South China. Atmosphere 2017, 8, 116. [Google Scholar] [CrossRef]
  31. National Meteorological Information Center. Assessment Report of China's Ground Precipitation 0.5°  ×  0.5° Gridded Dataset (V2.0); Assessment Report of China’s Ground; National Meteorological Information Center: Beijing, China, 2010. [Google Scholar]
  32. Hutchinson, M.F. Interpolation of rainfall data with thin plate smoothing splines-part I: Two dimensional smoothing of data with short range correlation. J. Geogr. Inf. Decis. Anal. 1998, 2, 153–167. [Google Scholar]
  33. Grumm, R.H.; Hart, R.H. Standardized anomalies applied to significant cold season weather events: Preliminary findings. Weather Forecast. 2001, 16, 736–754. [Google Scholar] [CrossRef]
  34. Yanai, M.; Esbensen, S.; Chu, J.H. Determination of bulk properties of tropical cloud clusters from large-scale heat and moisture budgets. J. Atmos. Sci. 1973, 30, 611–627. [Google Scholar] [CrossRef]
  35. Ren, X.J.; Yang, X.Q.; Sun, X.G. Zonal oscillation of western Pacific subtropical high and subseasonal SST variations during Yangtze persistent heavy rainfall events. J. Clim. 2013, 26, 8929–8946. [Google Scholar] [CrossRef]
  36. Archambault, H.M.; Keyser, D.; Bosart, L.F. Relationships between large-scale regime transitions and major cool-season precipitation events in the northeastern United States. Mon. Weather Rev. 2010, 138, 3454–3473. [Google Scholar] [CrossRef]
  37. Uccellini, L.W.; Kocin, P.J. The interaction of jet streak circulations during heavy snow events along the east coast of the United States. Weather Forecast. 1987, 2, 289–308. [Google Scholar] [CrossRef]
  38. Liu, J.P.; Ren, H.L.; Li, W.J.; Zuo, J.Q. Remarkable impacts of Indian Ocean sea surface temperature on interdecadal variability of summer rainfall in Southwestern China. Atmosphere 2018, 9, 103. [Google Scholar] [CrossRef]
  39. Holton, J.R. An Introduction to Dynamic Meteorology, 4th ed.; Academic Press: Burlington, VT, USA, 2004; pp. 146–147. [Google Scholar]
  40. Lu, R.Y.; Lin, Z.D. Role of subtropical precipitation anomalies in maintaining the summertime meridional teleconnection over the western North Pacific and East Asia. J. Clim. 2009, 22, 2058–2072. [Google Scholar] [CrossRef]
  41. Jin, Q.; Yang, X.Q.; Sun, X.G.; Fang, J.B. East Asian summer monsoon circulation structure controlled by feedback of condensational heating. Clim. Dyn. 2013, 41, 1885–1897. [Google Scholar] [CrossRef]
  42. He, J.H.; Zhao, P.; Zhu, C.W.; Zhang, R.H.; Tang, X.; Chen, L.X. Discussions on the East Asian subtropical monsoon. Acta Meteorol. Sin. 2008, 66, 683–696. (In Chinese) [Google Scholar]
  43. Ren, H.L.; Ren, P.F. Impact of Madden–Julian Oscillation upon winter extreme rainfall in Southern China: Observations and predictability in CFSv2. Atmosphere 2017, 8, 192. [Google Scholar] [CrossRef]
  44. Wang, B.; Xie, X.S. Low-frequency equatorial waves in vertically sheared zonal flow. Part I: Stable waves. J. Atmos. Sci. 1996, 53, 449–467. [Google Scholar] [CrossRef]
  45. Chen, Y.; Zhai, P.M. Simultaneous modulations of precipitation and temperature extremes in Southern parts of China by the boreal summer intraseasonal oscillation. Clim. Dyn. 2017, 49, 3363–3381. [Google Scholar] [CrossRef]
Figure 1. Composite indices of (a) EAP/SR-C; (b) EAP-S; and (c) SR-S patterns. The numbers of X-coordinates represent the days leading (negative) and lagging (positive) the start date. Composite averaged normalized height anomalies at 500 hPa (shading) and averaged geopotential height anomalies at 200 hPa (contours are from −120 dagpm to 120 dagpm with interval of 20 dagpm) of (d) EAP/SR-C; (e) EAP-S; and (f) SR-S patterns. The dotted filled shadings denote that normalized height anomalies are statistically significant at the 0.05 level.
Atmosphere 09 00154 g001
Figure 2. Spatial distributions of total accumulated precipitation (units: mm) in Southern China of (a) EAP/SR-C; (b) EAP-S; and (c) SR-S events; (d) Daily normalized domain-averaged precipitation in the region-1 (114–120° E, 25–30° N, red line for EAP/SR-C events), region-2 (114–120° E, 28–33° N, blue line for EAP-S events), and region-3 (114–118° E, 22.5–27.5° N, black line for SR-S events) from day −10 to day 10. The numbers of X-coordinate in Figure 2d represent the same meaning of that in Figure 1.
Atmosphere 09 00154 g002
Figure 3. Days of extreme precipitation cases (red rectangle) and occurrence frequencies of PEP events (blue rectangle) within the YRV (region-1, 114–120° E, 25–30° N) in each summer (JJA) during 1979–2015. The percentage of summer extreme precipitation cases associated with the EAP/SR-C events to the total summer extreme precipitation cases are marked on each specific year.
Atmosphere 09 00154 g003
Figure 4. Composite 200 hPa horizontal wind anomalies (vector, units: m s−1), normalized height anomalies (contours are ±0.5, ±1.0, ±1.5, ±2.0 standard deviation, blue for negative and red for positive) and zonal wind speed (shading, units: m s−1) in EAP/SR-C events from day −2 to day 8 with interval of 2 days (af). The thick dashed lines (1250 dagpm-contour) portray the activities of the SAH at 200 hPa.
Atmosphere 09 00154 g004
Figure 5. Composite 200 hPa divergent components of wind field (vector, units: m s−1), velocity potential (red contours are from 2 × 10⁶ to 10 × 106 m2 s−1 with interval of 2 × 10⁶ m2 s−1) and positive vorticity (blue contours are from 2 × 10⁶ to 6 × 10⁶ s−1 with interval of 2 × 10⁶ s−1) in EAP/SR-C events from day −2 to day 8 with interval of 2 days (af). The letters ‘D’ represent the centers of upper-level divergence.
Atmosphere 09 00154 g005
Figure 6. Composite 500 hPa geopotential heights (black contours are from 552 to 588 dagpm with interval of 4 dagpm) and daily precipitation (shading, units: mm) in EAP/SR-C events from day −10 to day 8 with interval of 2 days (aj). The thick black dashed lines (1250 dagpm-contours) and thick black solid lines (588 dagpm-contours) portray the activities of the SAH at 200 hPa and the WPSH at 500 hPa related to EAP/SR-C events (red lines are for EAP-S events). The green lines represent the mid-latitude trough.
Atmosphere 09 00154 g006
Figure 7. Composite averaged horizontal wind anomalies at 500 hPa (vector; units: m s−1) and anomalous U-wind at 200 hPa (shading; units: m s−1) of (a) EAP/SR-C; (b) EAP-S; and (c) SR-S events. The dashed contours (1250 dagpm-contour) and thick black contours (588 dagpm-contours) denote the activities of the SAH at 200 hPa and WPSH at 500 hPa. The letters ‘C’ and ‘A’ represent anomalous cyclone and anticyclone, respectively.
Atmosphere 09 00154 g007
Figure 8. Composite averaged wind anomalies at 850 hPa (vector; units: m s−1), normalized anomalies of total moisture flux (shading, with interval of 0.5 standard deviation) and the convergence of moisture flux (red contours are from −3 × 10⁻⁸ to −6 × 10⁻⁸ s−1 with interval of −3 × 10⁻⁸ s−1) in (a) EAP/SR-C; (b) EAP-S; and (c) SR-S events. Time-latitude cross-section (115–125° E) of moisture flux (shading, with interval of 0.5 standard deviation) and moisture flux convergence (black dashed contours are from −2 × 10⁻⁸ to −6 × 10⁻⁸ s−1 with interval of −2 × 10⁻⁸ s−1) in (d) EAP/SR-C; (e) EAP-S; and (f) SR-S events from day −10 to day 10.
Atmosphere 09 00154 g008
Figure 9. Composite 850 hPa horizontal wind anomalies (vector, units: m s−1) and normalized anomalies of total moisture flux (shading, with interval of 0.5 standard deviation) in EAP/SR-C events from day −10 to day 8 with interval of 2 days (aj). The thick black lines (588 dagpm-contours) portray the activities of the WPSH at 500 hPa.
Atmosphere 09 00154 g009
Figure 10. Latitude-pressure cross-section (115–125° E) of specific humidity (contours are from 6 to 20 g kg−1 with interval of 2 g kg−1) and normalized temperature anomalies (shading; every 0.5 standard deviation) in EAP/SR-C events from day −2 to day 8 with interval of 2 days (af). The dotted filled shadings denote that the normalized temperature anomalies are statistically significant at the 0.05 level.
Atmosphere 09 00154 g010
Figure 11. Latitude-pressure cross-section (115–125° E) of vertical p-velocity (contour; units: hPa s−1) and significant anomalies of diabatic heating rate (shading; units: K day−1) in EAP/SR-C events from day −2 to day 8 with interval of 2 days (af). The dotted filled shadings denote that the anomalies of diabatic heating rate are statistically significant at the 0.05 level.
Atmosphere 09 00154 g011
Figure 12. Schematic diagrams for circulation anomalies of typical EAP/SR-C events responsible for PEP in the YRV. The letters ‘C’ (blue shadings) and ‘A’ (red shadings) represent the anomalous cyclone and anticyclone, respectively. The black solid lines at 200 hPa and 500 hPa denote the boundary of the South Asia High and western Pacific subtropical high. The thick black line at 200 hPa denotes the Asian jet Axis. Mid-latitude trough at 500 hPa is indicated by the green line. The red arrows represent northerly flows from mid-high latitudes. Bold black line with three triangles denotes the stationary front in the YRV. Green arrow at 850 hPa represents the transport of abundant moisture flux. The ascent and descent are presented as red and blue dashed lines. The dashed blank arrows portray the propagation of these key systems.
Atmosphere 09 00154 g012
Table 1. The years, start dates, and end dates of single EAP (EAP-S), single SR (SR-S), and combined EAP and SR (EAP/SR-C) events.
No.EAP-SSR-SEAP/SR-C
YearStart DateEnd DateYearStart DateEnd DateYearStart DateEnd Date
119792 July4 July19827 July9 July19798 June11 June
2198024 July31 July198529 June1 July198224 June28 June
3198013 August15 August199010 June14 June19835 July10 July
4198218 July24 July19928 August13 August198511 June13 June
5198327 June30 June199411 June17 June19879 June16 June
619866 July9 July199711 June15 June198816 June19 June
719914 July10 July19974 August6 August198916 June21 June
8199314 July21 July200018 July20 July199119 June25 June
9199819 July1 August20027 July17 July19927 June19 June
10199824 August31 August200510 June21 June19932 June5 June
11199914 July18 July200923 August25 August199523 June28 June
12201121 August23 August201022 June24 June199617 June20 June
13201210 July14 July201316 June20 June19989 June18 June
14201411 July16 July---199918 June20 June
15201410 August12 August---20006 June11 June
16201510 June13 June---200212 June18 June
17201530 June3 July---20068 June16 June
18------200910 June17 June
19------20105 July12 July
20------20128 June13 June
21------20149 June16 June

