Prediction Skill for the East Asian Winter Monsoon Based on APCC Multi-Models

Climate Services and Research Department, APEC Climate Center, Busan 48058, Korea
*
Author to whom correspondence should be addressed.
Atmosphere 2018, 9(8), 300; https://doi.org/10.3390/atmos9080300
Submission received: 31 May 2018
/
Revised: 30 July 2018
/
Accepted: 30 July 2018
/
Published: 31 July 2018
(This article belongs to the Special Issue Monsoons)
Abstract
:The prediction skill for the East Asian winter monsoon (EAWM) has been analyzed, using the observations and different climate models that participate in the APEC Climate Center (APCC) multi-model ensemble (MME) seasonal forecast. The authors first examined the characteristics of the existing EAWM indices to find a suitable index for the APCC seasonal forecast system. This examination revealed that the selected index shows reasonable prediction skill of EAWM intensity and well-represents the characteristics of wintertime temperature anomalies associated with the EAWM, especially for the extreme cold winters. Although most models capture the main characteristics of the seasonal mean circulation over East Asia reasonably well, they still suffer from difficulty in predicting the interannual variability (IAV) of the EAWM. Fortunately, the POAMA has reasonable skill in capturing the timing and strength of the EAWM IAV and reproduces the EAWM-related circulation anomalies well. The better performance of the POAMA may be attributed to the better skill in simulating the high-latitude forcing including the Siberian High (SH) and Artic Oscillation (AO) and the strong links of the ENSO to the EAWM, compared to other models.
1. Introduction
The East Asian winter monsoon (EAWM) is one of the most active climate systems in the northern hemisphere during the boreal winter and is driven by the thermal contrast between the cold Asian continent and the neighboring warm oceans [1]. The characteristics of EAWM are found as a strong Siberian high (SH), the East Asian trough (EAT) at 500 hPa, the East Asian jet stream (EAJS), the northwesterly wind over East Asia and frequent cold surges which exhibit strong interannual variations that affect the temperature and precipitation over the Asia region [2,3,4,5]. The EAWM plays a significant role in the economies of societies in the East Asia region and cause the potential occurrence of severe flooding and cold extreme disasters, such as extremely low temperatures, unexpected blizzards and freezing rain in Southeast Asian countries [6,7].
The variations of the EAWM are controlled not only by tropical forcing such as the El Nino-Southern Oscillation (ENSO) and the tropical Indian Ocean sea surface temperature [8,9] but also by high-latitude forcing such as Eurasian snow cover, the Siberian high and the Arctic Oscillation (AO) [10,11,12]. Many studies have explored the impact of the EAWM variability, focusing on the AO and/or ENSO. On the other hand, several studies have argued for a decreasing role of the ENSO [13] and an increasing role of other large-scale patterns, originating in the Northern Hemispheric mid-latitudes or the Arctic, in influencing East Asian winter temperatures [14,15,16]. Recent studies have suggested the combined effects of the AO and Western Pacific (WP) pattern [17] and the AO and Eurasian teleconnection (EU) [18] on East Asian winter temperatures and monsoons.
The EAWM index is often used efficiently to quantify the intensity of the EAWM and describing its climate impacts and responsible mechanisms. Therefore, many studies have applied different methods to construct a simple and representative EAWM index [4,19,20,21]. Most of the indices were primarily defined by the circulation variables of the EAWM, such as the land-ocean pressure contrast, the low-level wind, the East Asian trough and the upper zonal wind shear [22]. Recently, Wang and Chen [9] proposed a new sea level pressure (SLP)-based index considering both the east-west and the north-south pressure gradients. They suggested that the new index performs better in describing the surface air temperature variations over East Asia compared with previous indices. Meanwhile, some investigators use temperature to define the EAWM variability [1,23]. Wang et al. [1] identified two dominant temperature (the northern and southern) modes over the EAWM region, which explain much of temperature variability over the entire Asian region. They found that most of the existing EAWM indices tend to describe the southern temperature mode.
Through the past couple of decades [23,24,25,26,27], numerical climate models have been applied to the studies on the EAWM and even state-of-the-art models have shown a wide range of skills in predicting the EAWM-related circulation and air temperature anomalies. Zhang et al. [28] evaluated the Atmospheric Model Intercomparison Project (AMIP) models in simulating the EAWM, focusing on the synoptic-scale features such as cold surges. From their study, the most models could not capture the relationship between cold surges and tropical convection properly. Sohn et al. [29] analyzed the seasonal prediction models in the APEC Climate Center (APCC) multi-model ensemble (MME) seasonal forecast system. They found that the most models have difficulties in capturing the interannual variability of East Asian climate. Recently, Li and Wang [23] showed the enhanced prediction skill of EAWM by the models from the Development of the European Multimodel Ensemble System [30]. Jiang et al. [31] assessed the predictability of the EAWM by the National Centers for Environmental Prediction (NCEP) Climate Forecast System (CFS) version 2 and presented considerable skill of NCEP CFS v2 in predicting the EAWM. They emphasized the importance of ocean-atmosphere coupling in the simulation of the EAWM and suggested various monsoon-related physical processes. Gong et al. [32] assessed the climatology and interannual variations of the EAWM in the latest climate system models for Coupled Model Intercomparison Project phase 5 (CMIP5) models. They pointed out that models still suffer from biases in surface temperature and northeasterly anomalies over East Asia that are attributed to the ability of models in capturing the EAWM-related tropical-extratropical interactions. Despite the aforementioned studies, accurate prediction of the EAWM variability is still a challenge.
The APCC provides an important source of information on seasonal climate prediction for many Asian countries that are affected by the EAWM. With the recent progress in the participation of climate models in the APCC MME seasonal prediction, a comprehensive assessment for the prediction skill of EAWM variability was provided using the hindcast for 1983–2010, with a focus on interannual timescale. Since the EAWM variability has large meridional extent (is affected by a wide range) from the equator to the North Pole, it may represent different regional characteristics of EAWM depending on which index is chosen and may also affect its prediction skill. Therefore, we initially examined the characteristics of existing EAWM indices to find a suitable index in APCC seasonal forecast system and then explored the prediction skill of EAWM variability. The dataset and the characteristics of the EAWM index are described in Section 2. Model performance and application to seasonal forecast are documented in Section 3 and Section 4, respectively, while the summary and discussion follow in Section 5.
2. Data and Methodology
2.1. Data
Hindcast experiments from seasonal prediction models participating in the APEC Climate Center multimodel ensemble (APCC MME) seasonal forecast are employed to measure the variability of the EAWM. Eight out of eleven different models are selected because they cover a relatively long period of 25 years. Table 1 presents a brief summary of the description of the two two-tier (GDAPS and HMC) and six one-tier models (CANCM3, CANCM4, NASA, NCEP, PNU and POAMA). In this study, the multi-model ensemble (MME) is defined as a simple average of the model runs with equal weighting. The mean bias from each model is removed by forming anomalies with respect to each model’s own seasonal climatology. The hindcasts starting from November are used so that data from the entire winter are available. Each model has different ensemble members with different initial conditions. All model simulations examined in this study cover the common period of December, January and February (DJF) from 1983/1984 to 2007/2008 (25 years). Here, the winter of 1983 refers to the 1983/84 winter.
The observations used for model verification are from the Climate Anomaly Monitoring System-Outgoing Longwave Radiation Precipitation Index data (CAMS_OPI) [33], Sea Surface Temperature (SST) from the National Oceanic and Atmospheric Administration (OI SST) [34] and the atmospheric variables such as sea-level pressure, air temperature, winds and geopotential height from the National Centers for Environmental Prediction (NCEP) Department of Energy Atmospheric Model Intercomparison Project–II Reanalysis (hereafter referred to as NCEP-R2) [35], which covers the same common period. All data were interpolated to common 2.5° latitude × 2.5° longitude grids.
2.2. EAWM Index
The EAWM index is especially useful for monitoring and predicting the strength of EAWM at an operational climate center and understanding the EAWM-related circulation and temperature anomalies. In this study, a suitable index for the APCC forecast system is selected by comparing the existing indices found from the previous studies. The selection from the 11 indices listed in Table 2 has two criteria. First, the variables used in the definition are available from the outputs of the climate models listed in Table 1. Second, since the temperature is the most important concern for the seasonal forecast, the correlation coefficient between the index and the winter-mean surface air temperature averaged over East Asia exceeds −0.505 (99% confidence level based on Student’s t-test).
Figure 1 shows the interannual variation of the 11 normalized EAWM indices discussed in this paper. The signs of the indices are adjusted to reflect the strong EAWM winters corresponding to the positive index. It is obvious that all indices exhibit pronounced and coherent interannual variations in a given period. The correlation coefficients of each pair of the 11 EAWM indices have values from 0.52 to 0.98 (significant at the 99% confidence level). Using the 11 EAWM indices, the strong and weak EAWM years are defined by two criteria: (1) the interannual standard deviation of the EAWM index exceeds 0.5 and (2) the index number that has the same phase of EAWM is greater than six among the 11 indices. Based on these criteria, seven winters (1983, 1984, 1985, 1995, 1999, 2005 and 2007) are identified as strong EAWM years and seven winters (1988, 1989, 1991, 1992, 1997, 2001 and 2006) are classified as weak EAWM years. The classification of strong/weak year will be used to examine the characteristics of winter temperatures anomalies associated with EAWM variability.
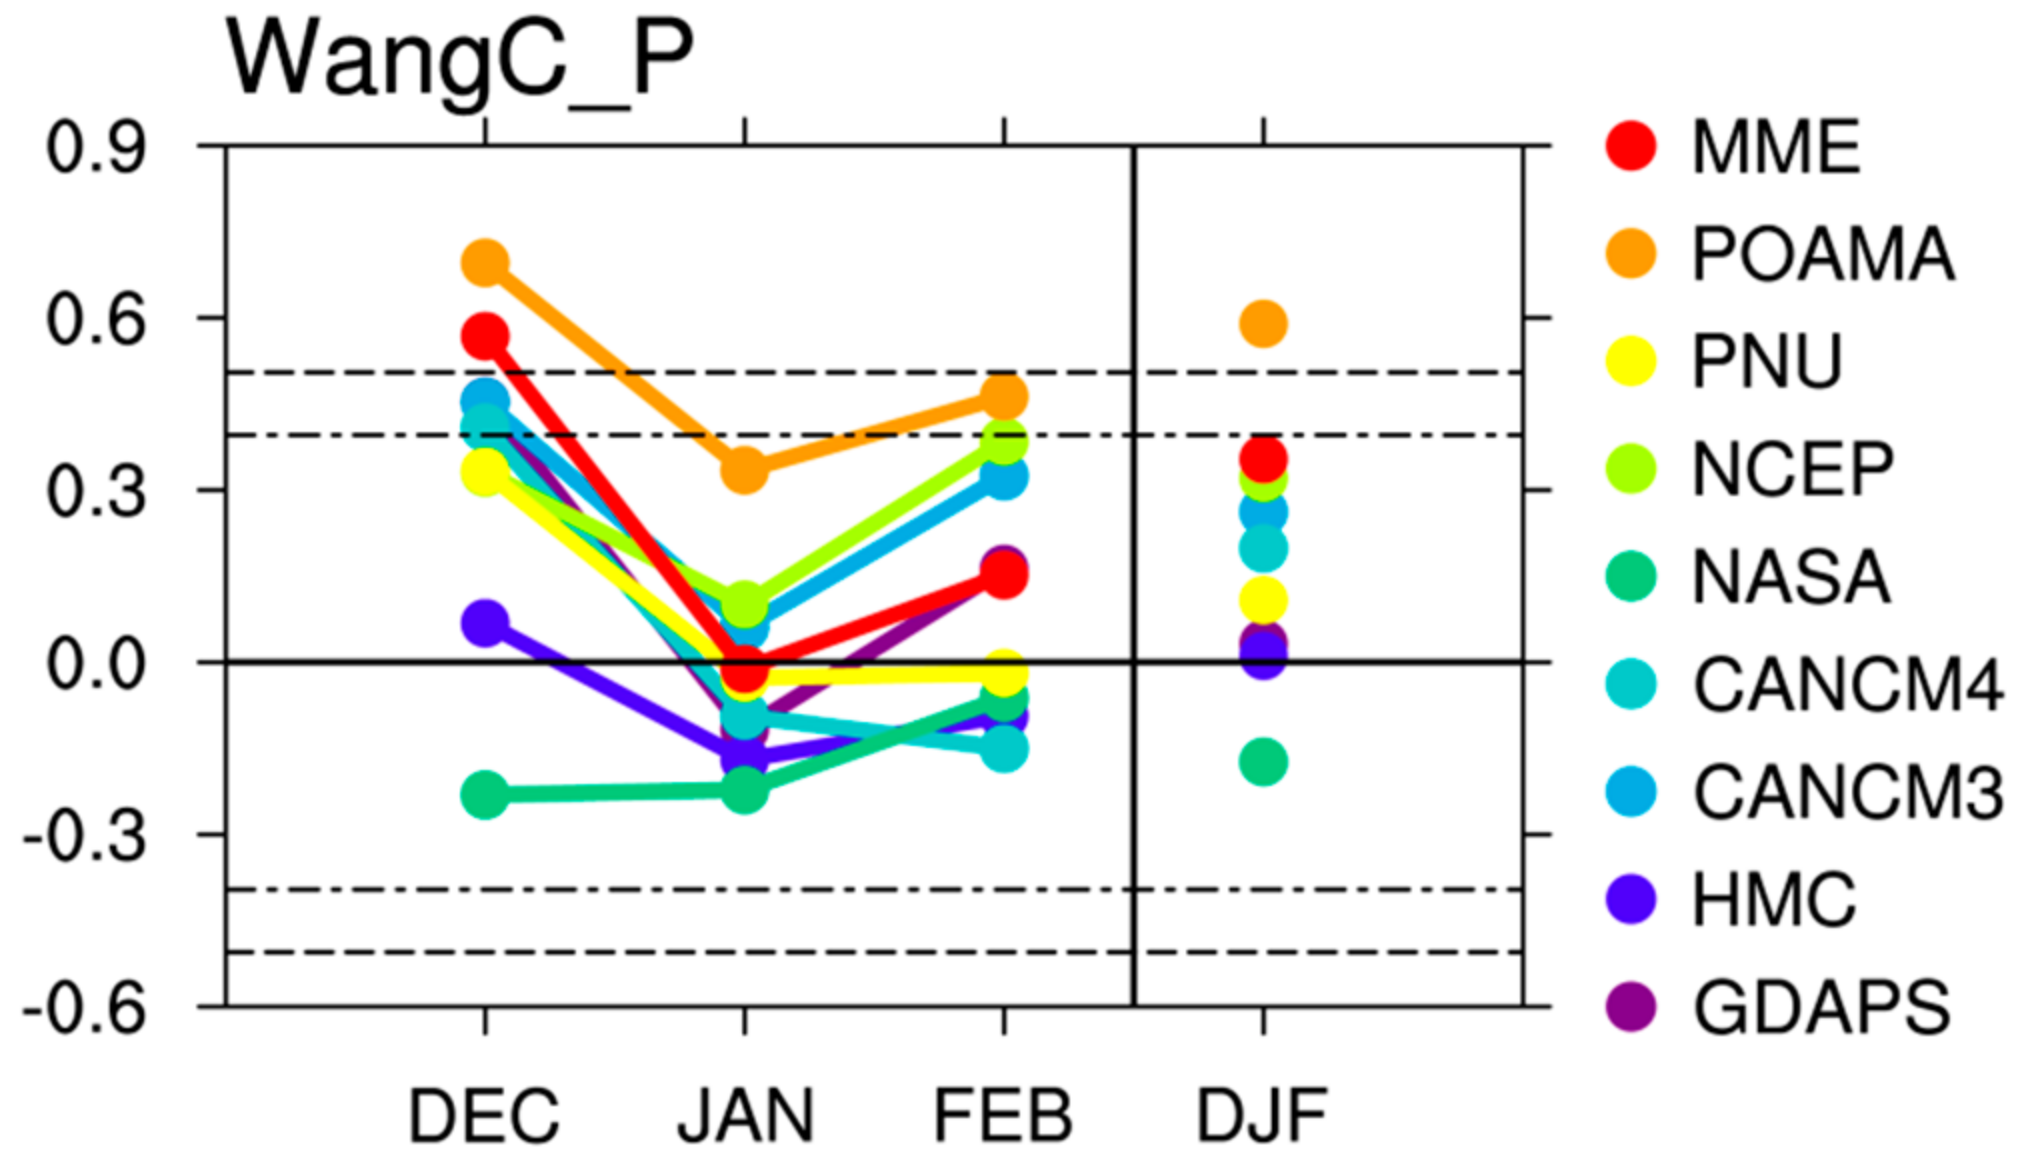
As the EAWM exhibits strong interannual variation (IAV, Figure 1), we assess how well the APCC MME forecast models can capture the IAV of the EAWM. Figure 2 shows the temporal correlation coefficients of normalized monthly mean EAWM indices between the observed and the individual model simulations as well as the MME. The results show that the prediction skill of the EAWM IAV depends not only on the model but also on the EAWM index. In other words, some indices such as WangC_P, Cui_Z and Li_U exhibit higher correlation than other indices and some models such as POAMA and NCEP reproduce better prediction skill than other models. In particular, the POAMA model captures significantly high score when WangC_P and Li_U indices are used. To select a best EAWM index among the candidate indices for APCC MME seasonal forecast, the prediction skill in climate models is an important criterion. In this regard, WangC_P and Li_U have an overwhelming advantage to be selected as the suitable index. It is evident that both indices have significant prediction skill, possibly due to the inclusion of both the tropical and the extratropical factors in their definitions. The other indices usually reflect only one aspect of both factors [22]. This result suggests that the EAWM index should include both the tropical and the extratropical processes in order to well-represent the nature of the EAWM, consistent with previous studies [2,41].
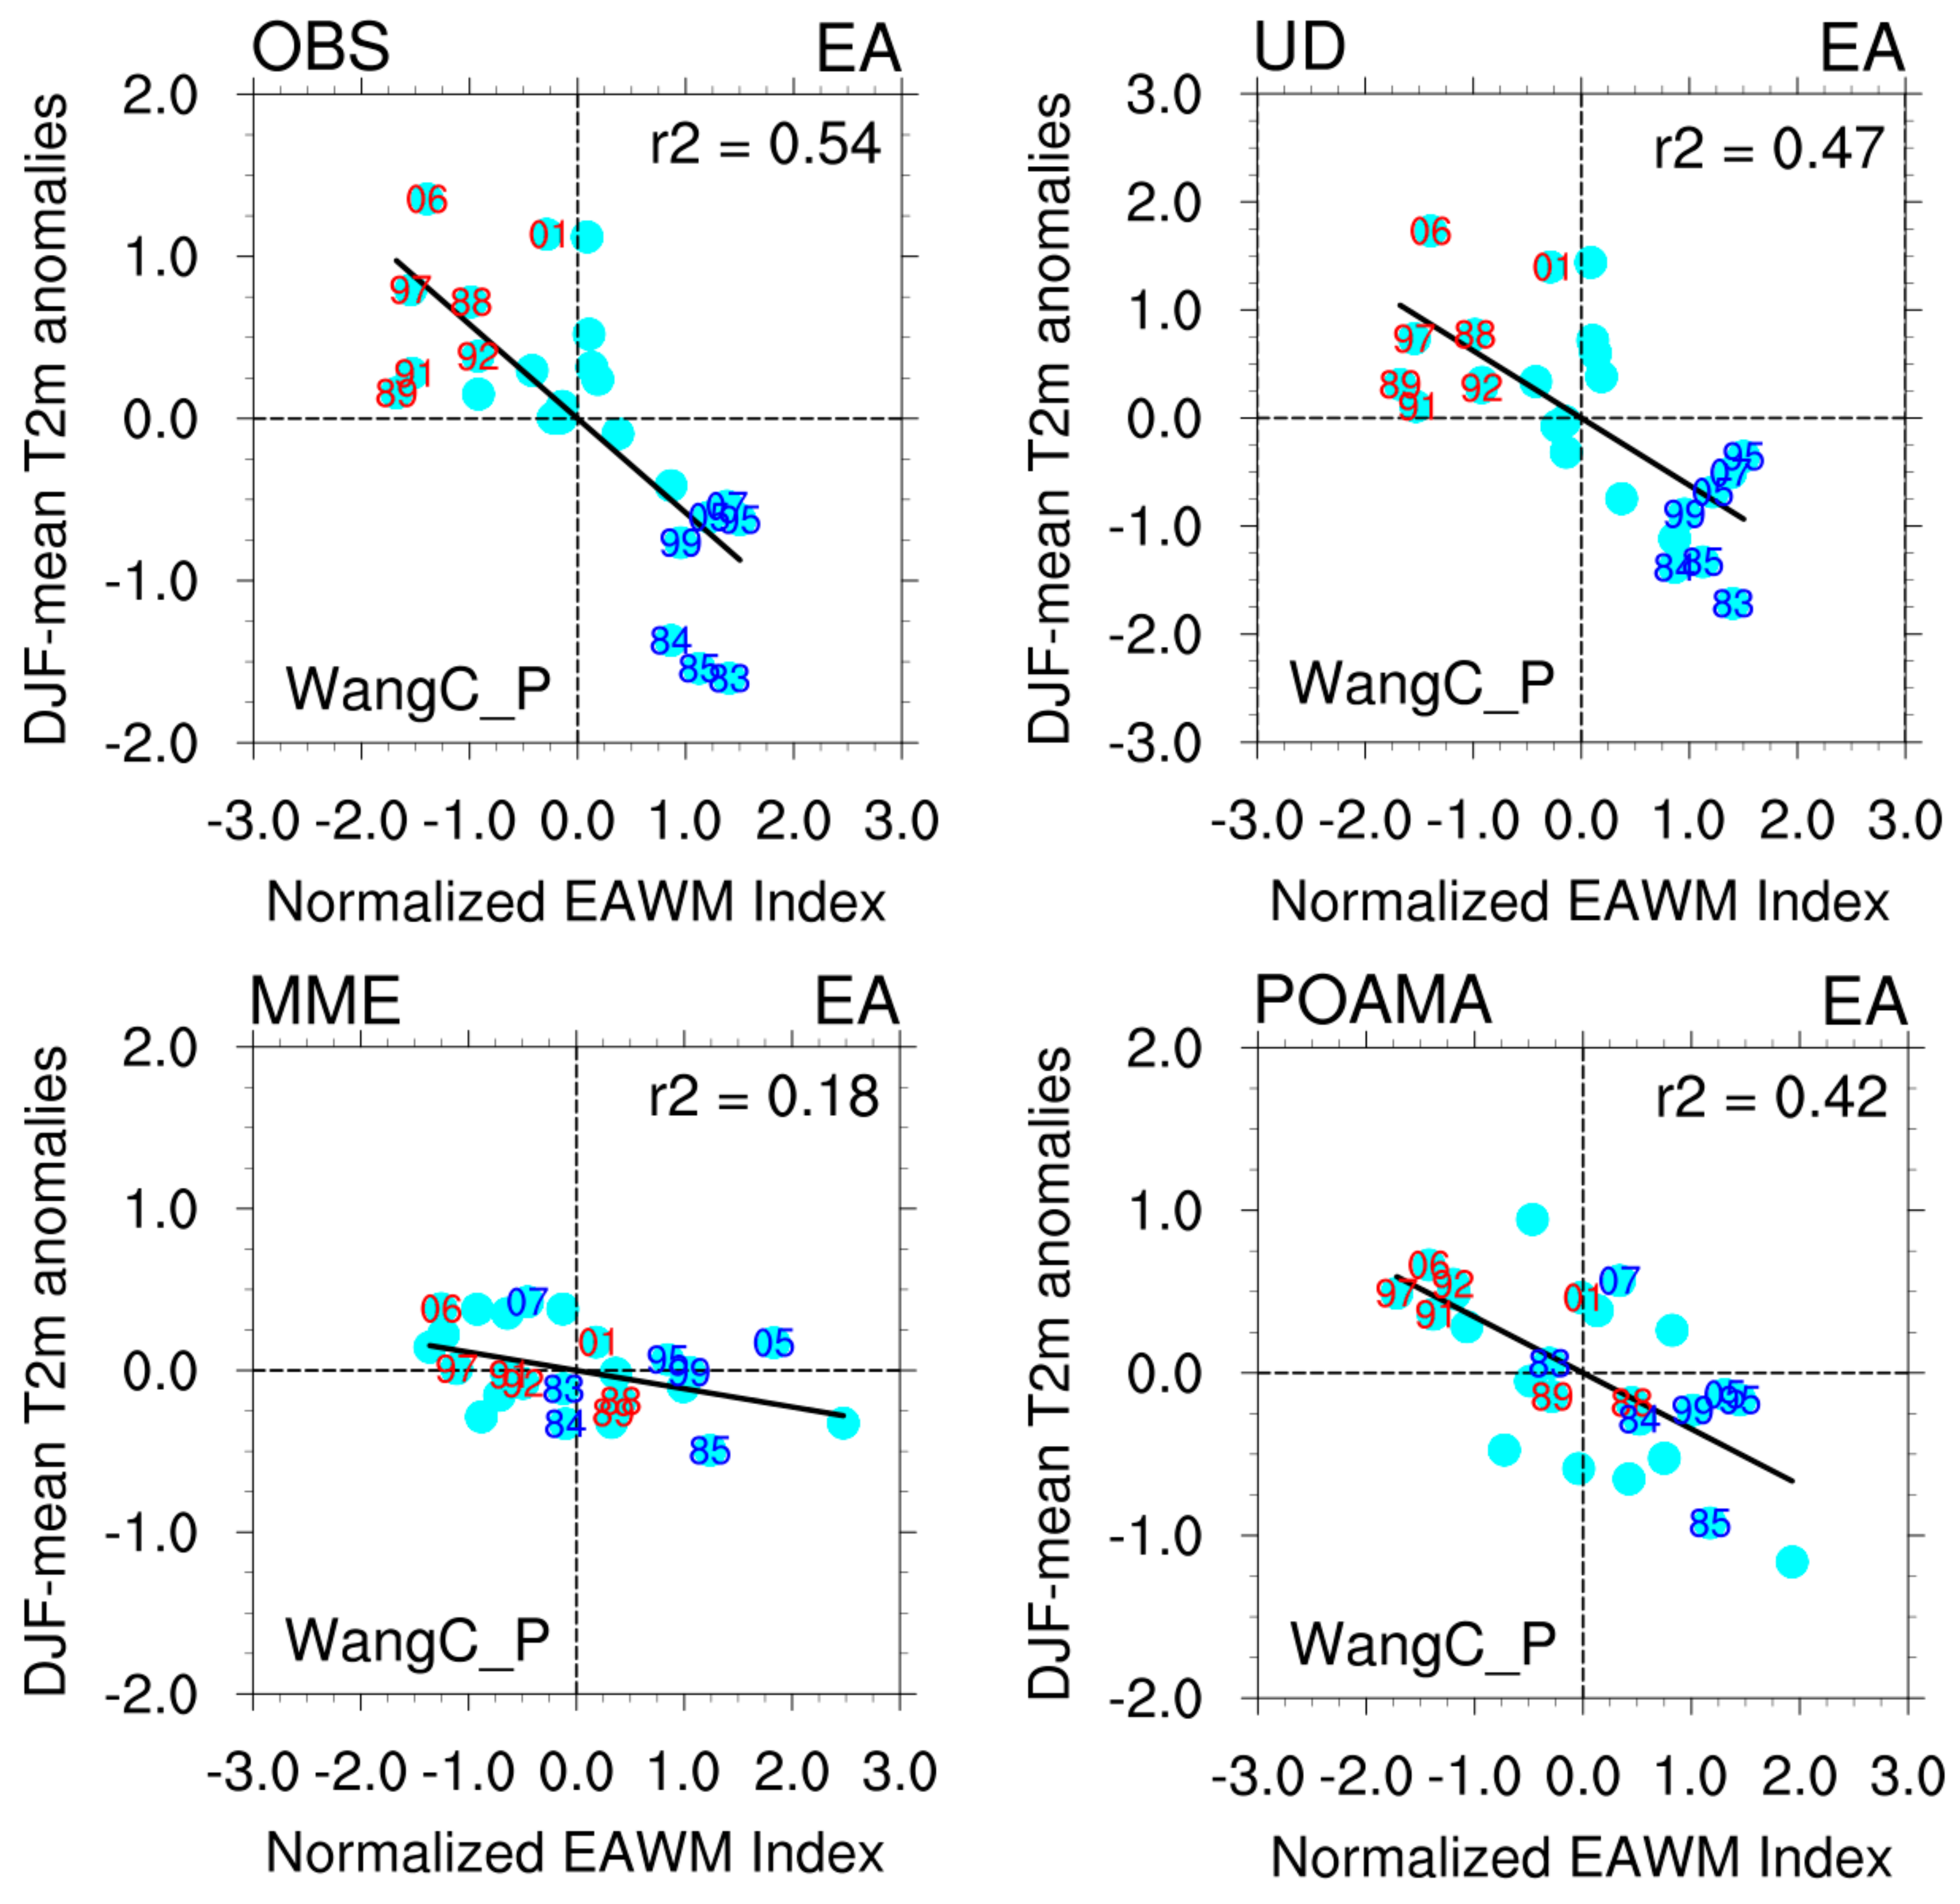
In order to assess a best fitted EAWM index in operational climate centers, another important criterion is how well the index can represent the surface air temperature anomalies associated with the EAWM. Therefore, we examine the performances of indices in representing DJF-mean temperatures variation over East Asia. Figure 3 shows the covariabilities of each EAWM index versus DJF-mean surface air temperature anomaly averaged over the region of East Asia (20°–50° N, 100°–145° E) [42]. The “R-squared” (r2), a standard way of measuring the proportion of variance we can explain in one variable, is inserted in the upper right corner of each plot. Among the 11 indices that participate in the comparison, five indices (Cui_Z, Wang_Z, Sun_Z, Gong_P, WangC_P) explain greater than 50% of the variance in DJF-mean temperature. Although the indices based on the geopotential height such as Cui_Z, Wang_Z and Sun_Z explain higher variance in temperature, they fail to capture the extreme cold winters associated with the strong EAWM. Taking a 0.5 standard deviation of EAWM index and 0.5 °C of temperature anomaly as a criterion, both Gong_P and WangC_P show reasonable performance in delineating the interannual variations of the EAWM including the extreme cold winters. For the 25-year period, the high (low) EAWM indices of Gong_P and WangC_P correspond to seven (three) extreme cold (warm) winters over East Asia. It is obvious that both Gong_P and WangC_P properly describe the relationship between the intensity of the EAWM and winter temperature extremes over East Asia. Meanwhile, the Li_U with high prediction skill for EAWM variation shows relatively lower performance in describing the East Asian temperature. Considering the criteria mentioned in Figure 2 and Figure 3, it is suggested that the WangC_P could be the best fit for monitoring and predicting the EAWM in the APCC MME seasonal forecast system.
To analyze how the EAWM index by WangC_P signifies the connection with synoptic activity over the tropical Asia, the EAWM index, the cold surge index [43] and DJF-mean 2m air temperature are displayed in Figure 4. The EAWM index is significantly correlated both with the temperature over East Asia and with the cold surge index as −0.74 and 0.71 at the 99.9% confidence level, respectively. When the EAWM is strong, the cold surges are active and cold anomalies over East Asia are dominant. The result from Figure 4 indicates that the selected index developed by Wang and Chen [9] is an effective way to describe the winter-mean surface air temperature variations connected with the EAWM, especially for extreme cold winters.
3. Characteristics of EAWM
3.1. Climatological Feature of EAWM
The EAWM is characterized by the strong Siberian high over the Eurasia region, the predominant low-level northeasterly flow over the northeastern Asia, the strong meridional temperature gradient and deep trough at 500 hPa over the East Asian coastal region and the strong jet stream just south of Japan at 200 hPa [2,3,4,5,7].
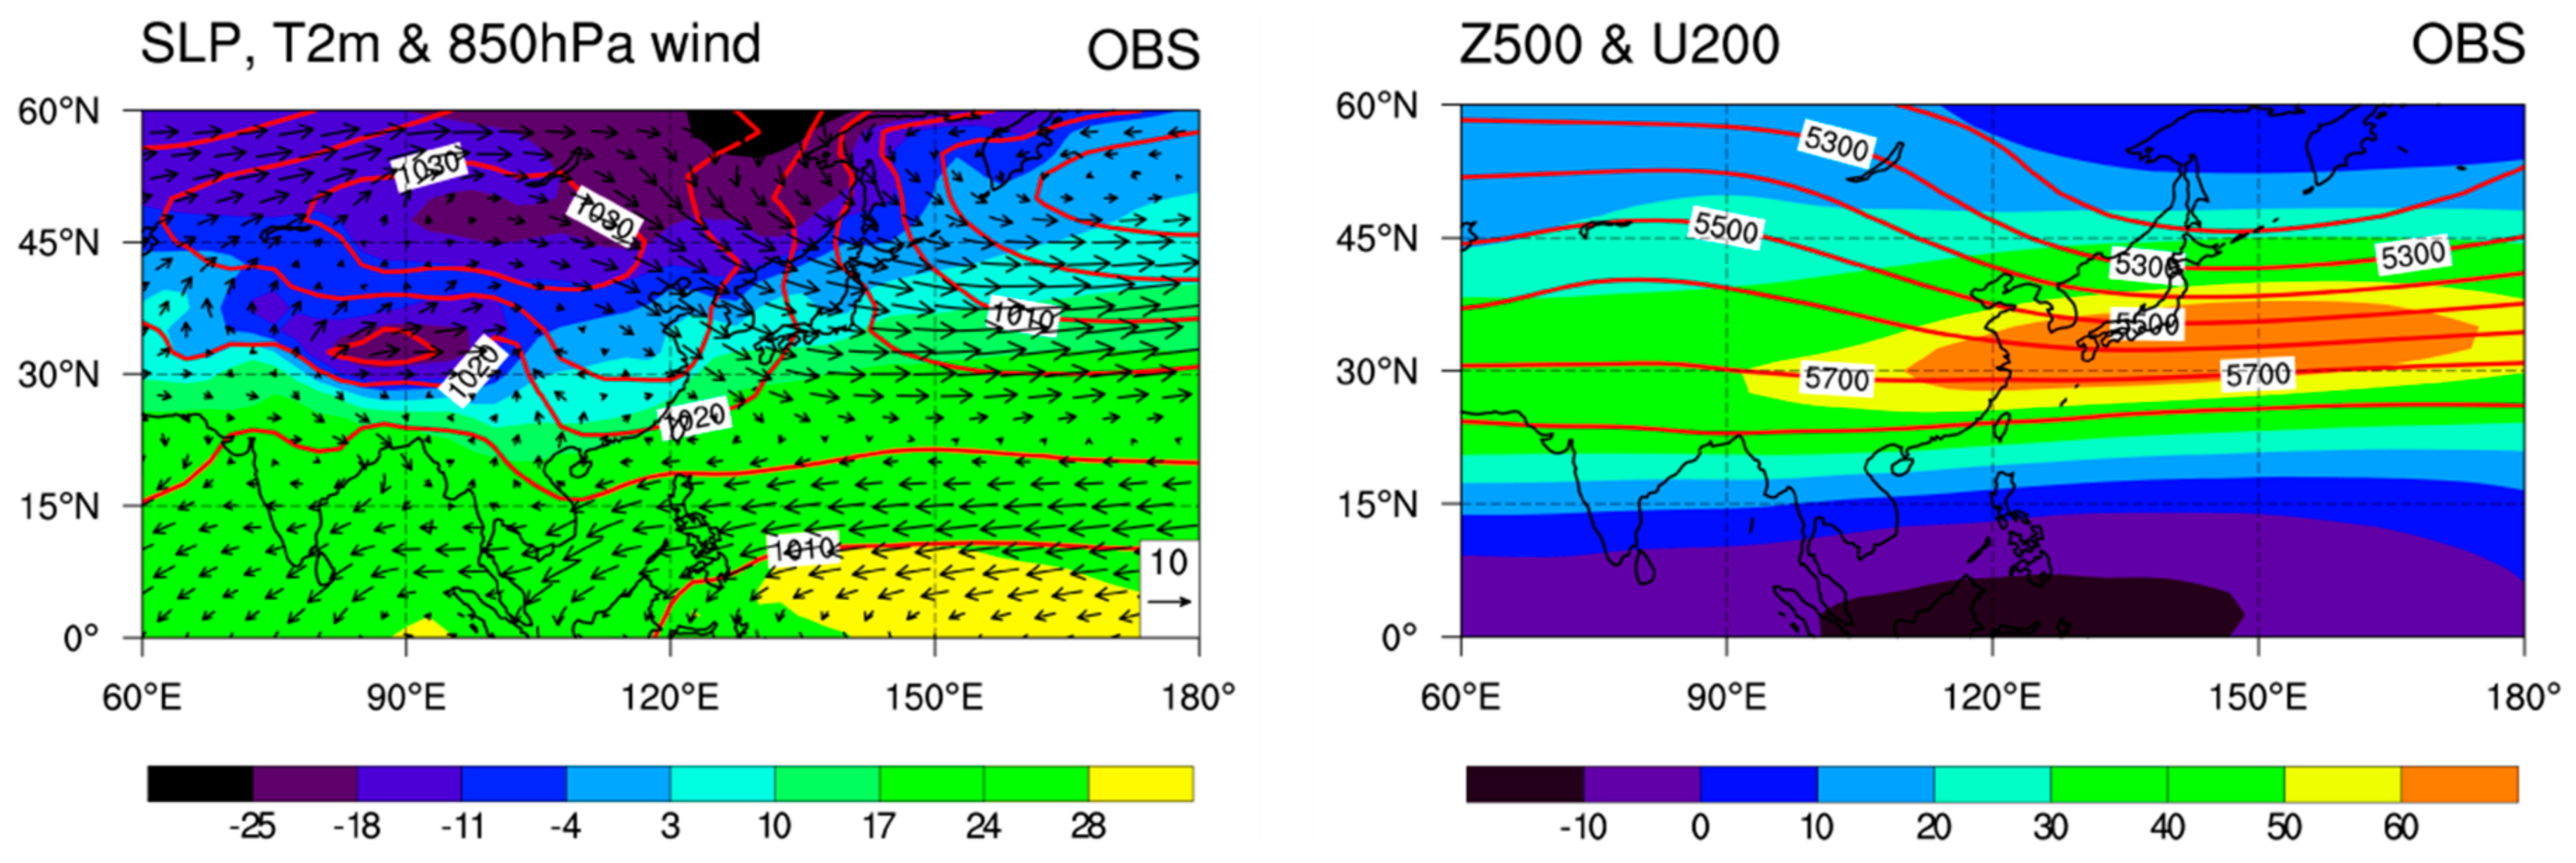
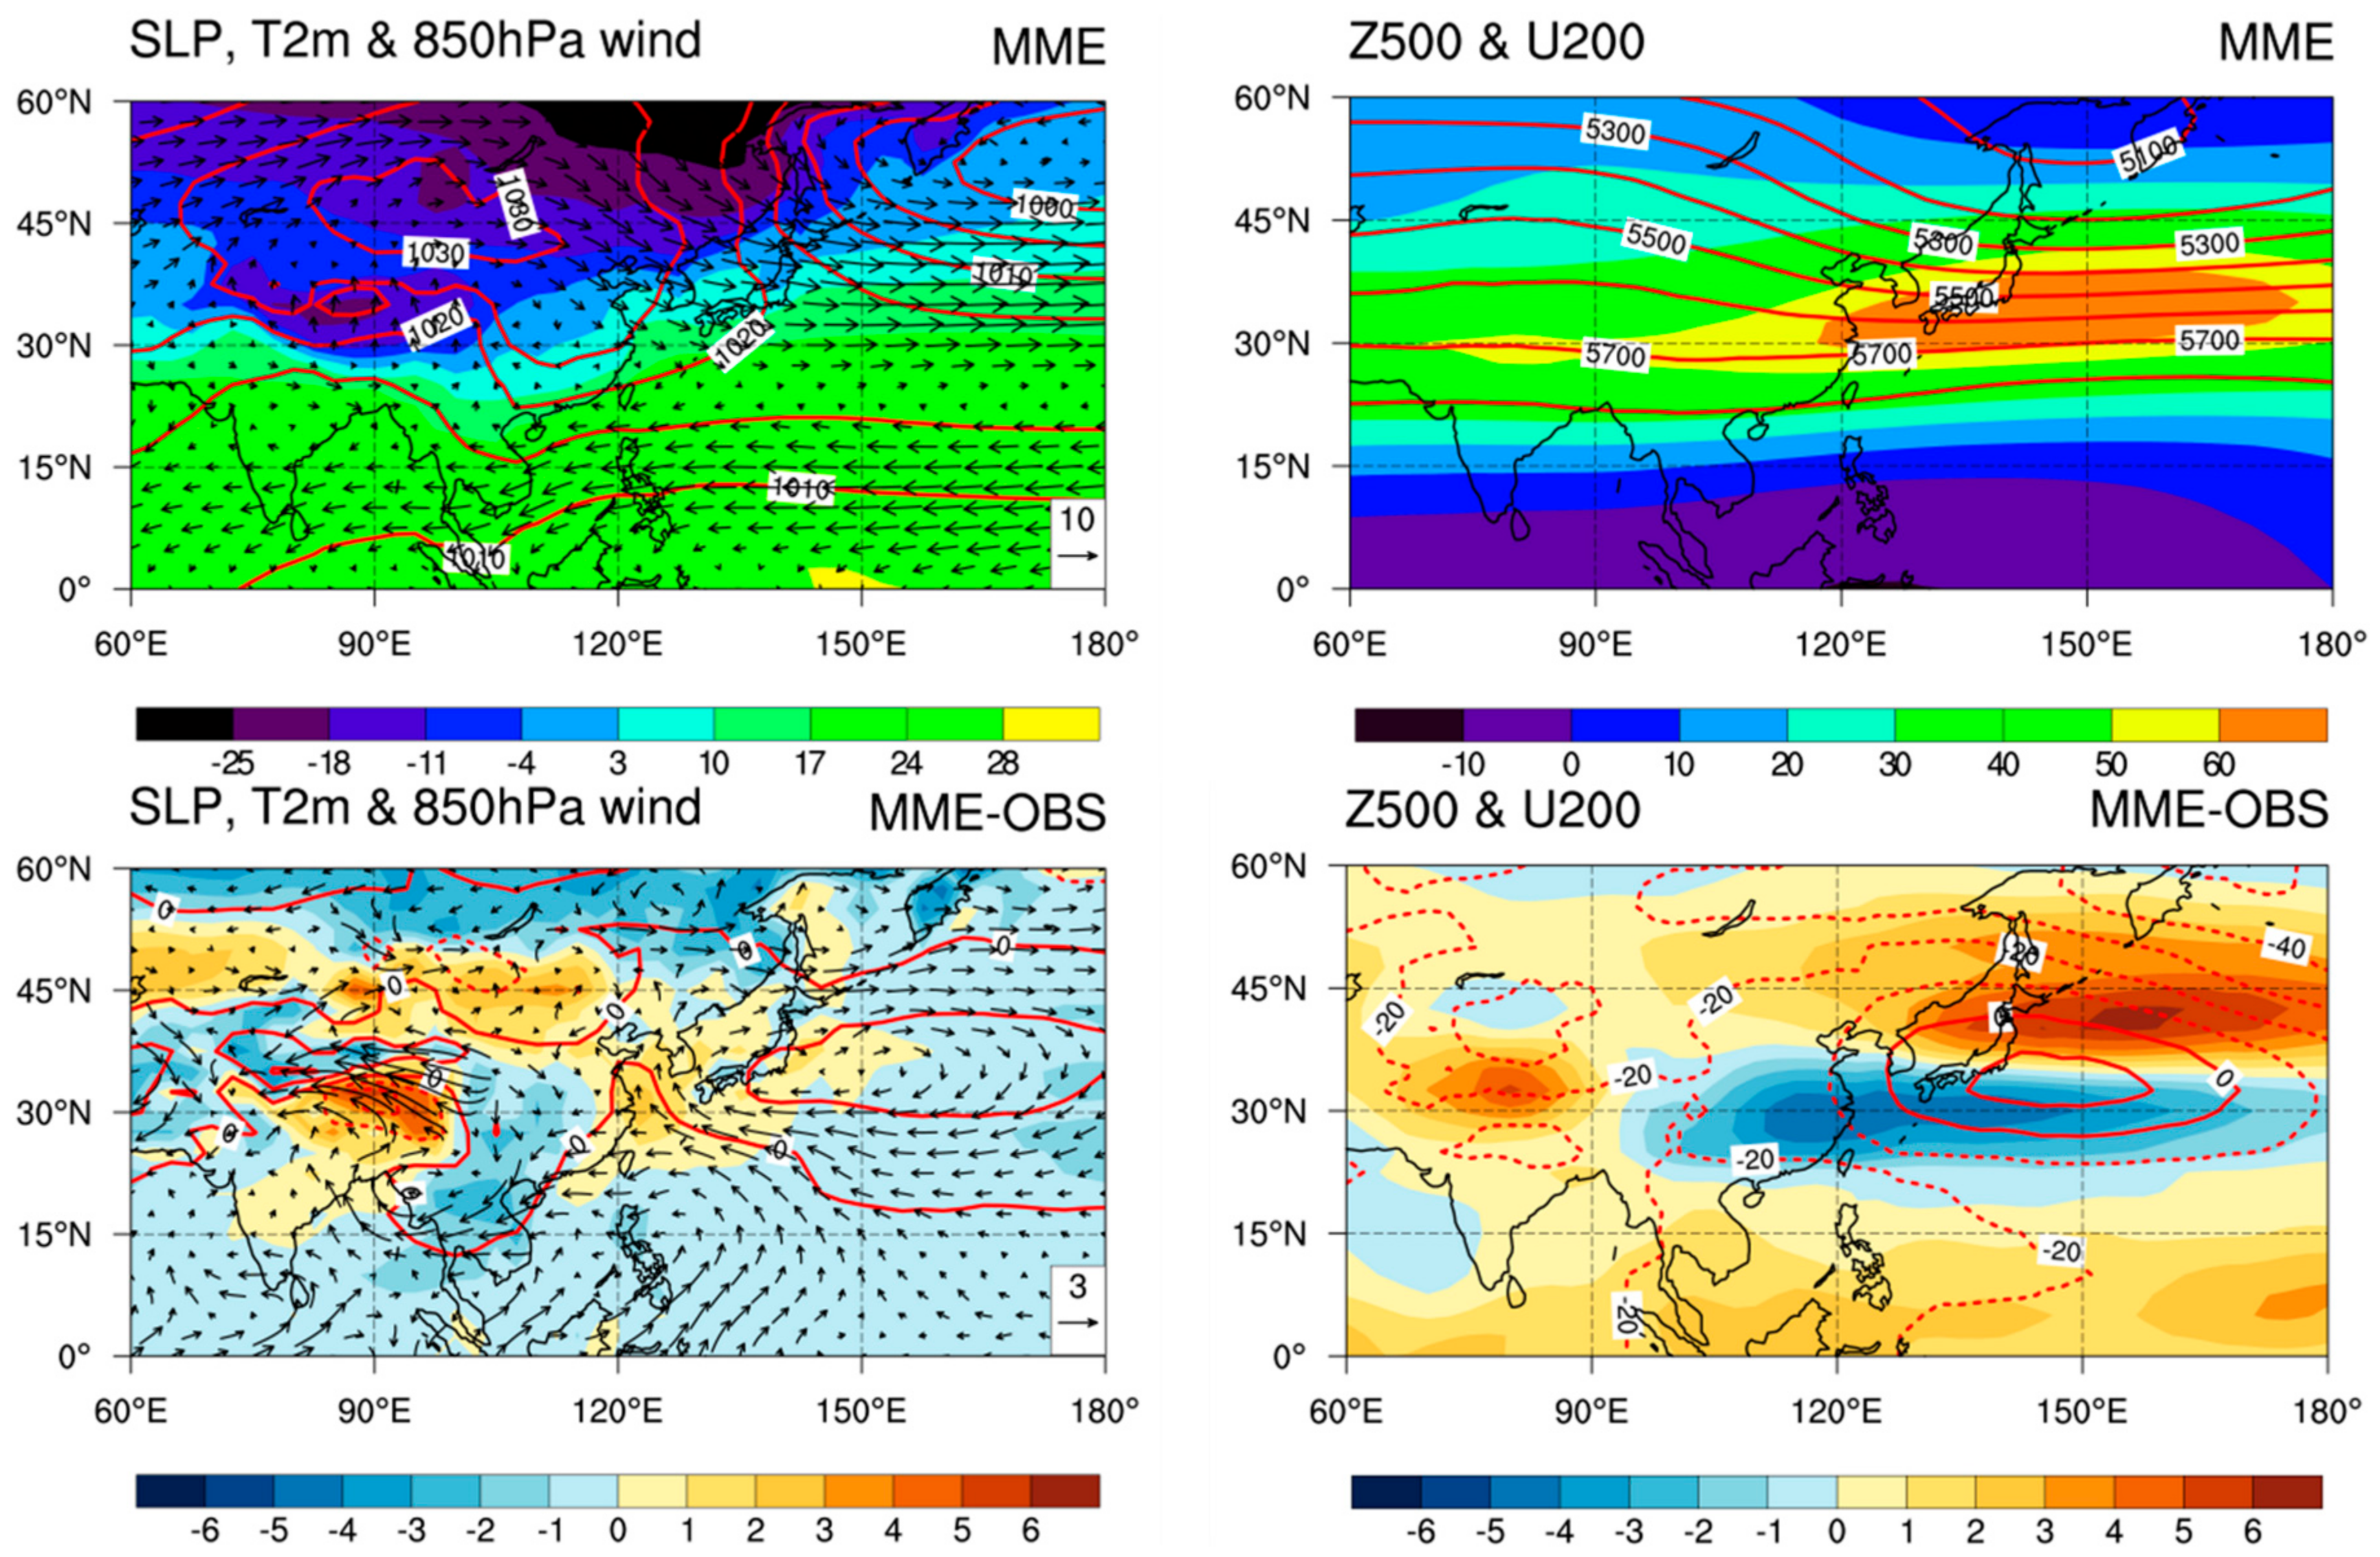
To evaluate the performances of models in representing the climatological features of EAWM, the DJF-mean circulation over East Asia based on the NCEP R2 dataset (hereafter referred to as “OBS”), the MME of eight individual models and their differences are plotted in Figure 5. The MME well-represents the major features of EAWM, such as pressure gradients between the Siberian high and the Aleutian and Australian lows, the prominent low-level northerly wind and the strong meridional temperature gradient over the eastern coastal region. Compared to observation, the Siberian high in the MME is displaced slightly to the south and weakened over northern Eurasia. In addition, the MME generally captures the strength and position of the East Asian trough and the mid- to upper troposphere jet stream over East Asia, although there are some deviations in the magnitude and the center locations. The model biases in MME can be explained reasonably as follows. The weak zonal pressure gradient between the Asian continent and the neighboring oceans leads to weakened northerly winds over northeastern Asia, which is directly related to the strength of the EAWM. As the northerly wind over northeastern Asia becomes weak, it brings less cold air advection from Arctic and produces a weaker meridional temperature gradient. Moreover, the weaker monsoon flow leads to a weaker polar jet stream over East Asia, which is closely related to the meridional temperature gradient at the surface with the thermal wind relationship.
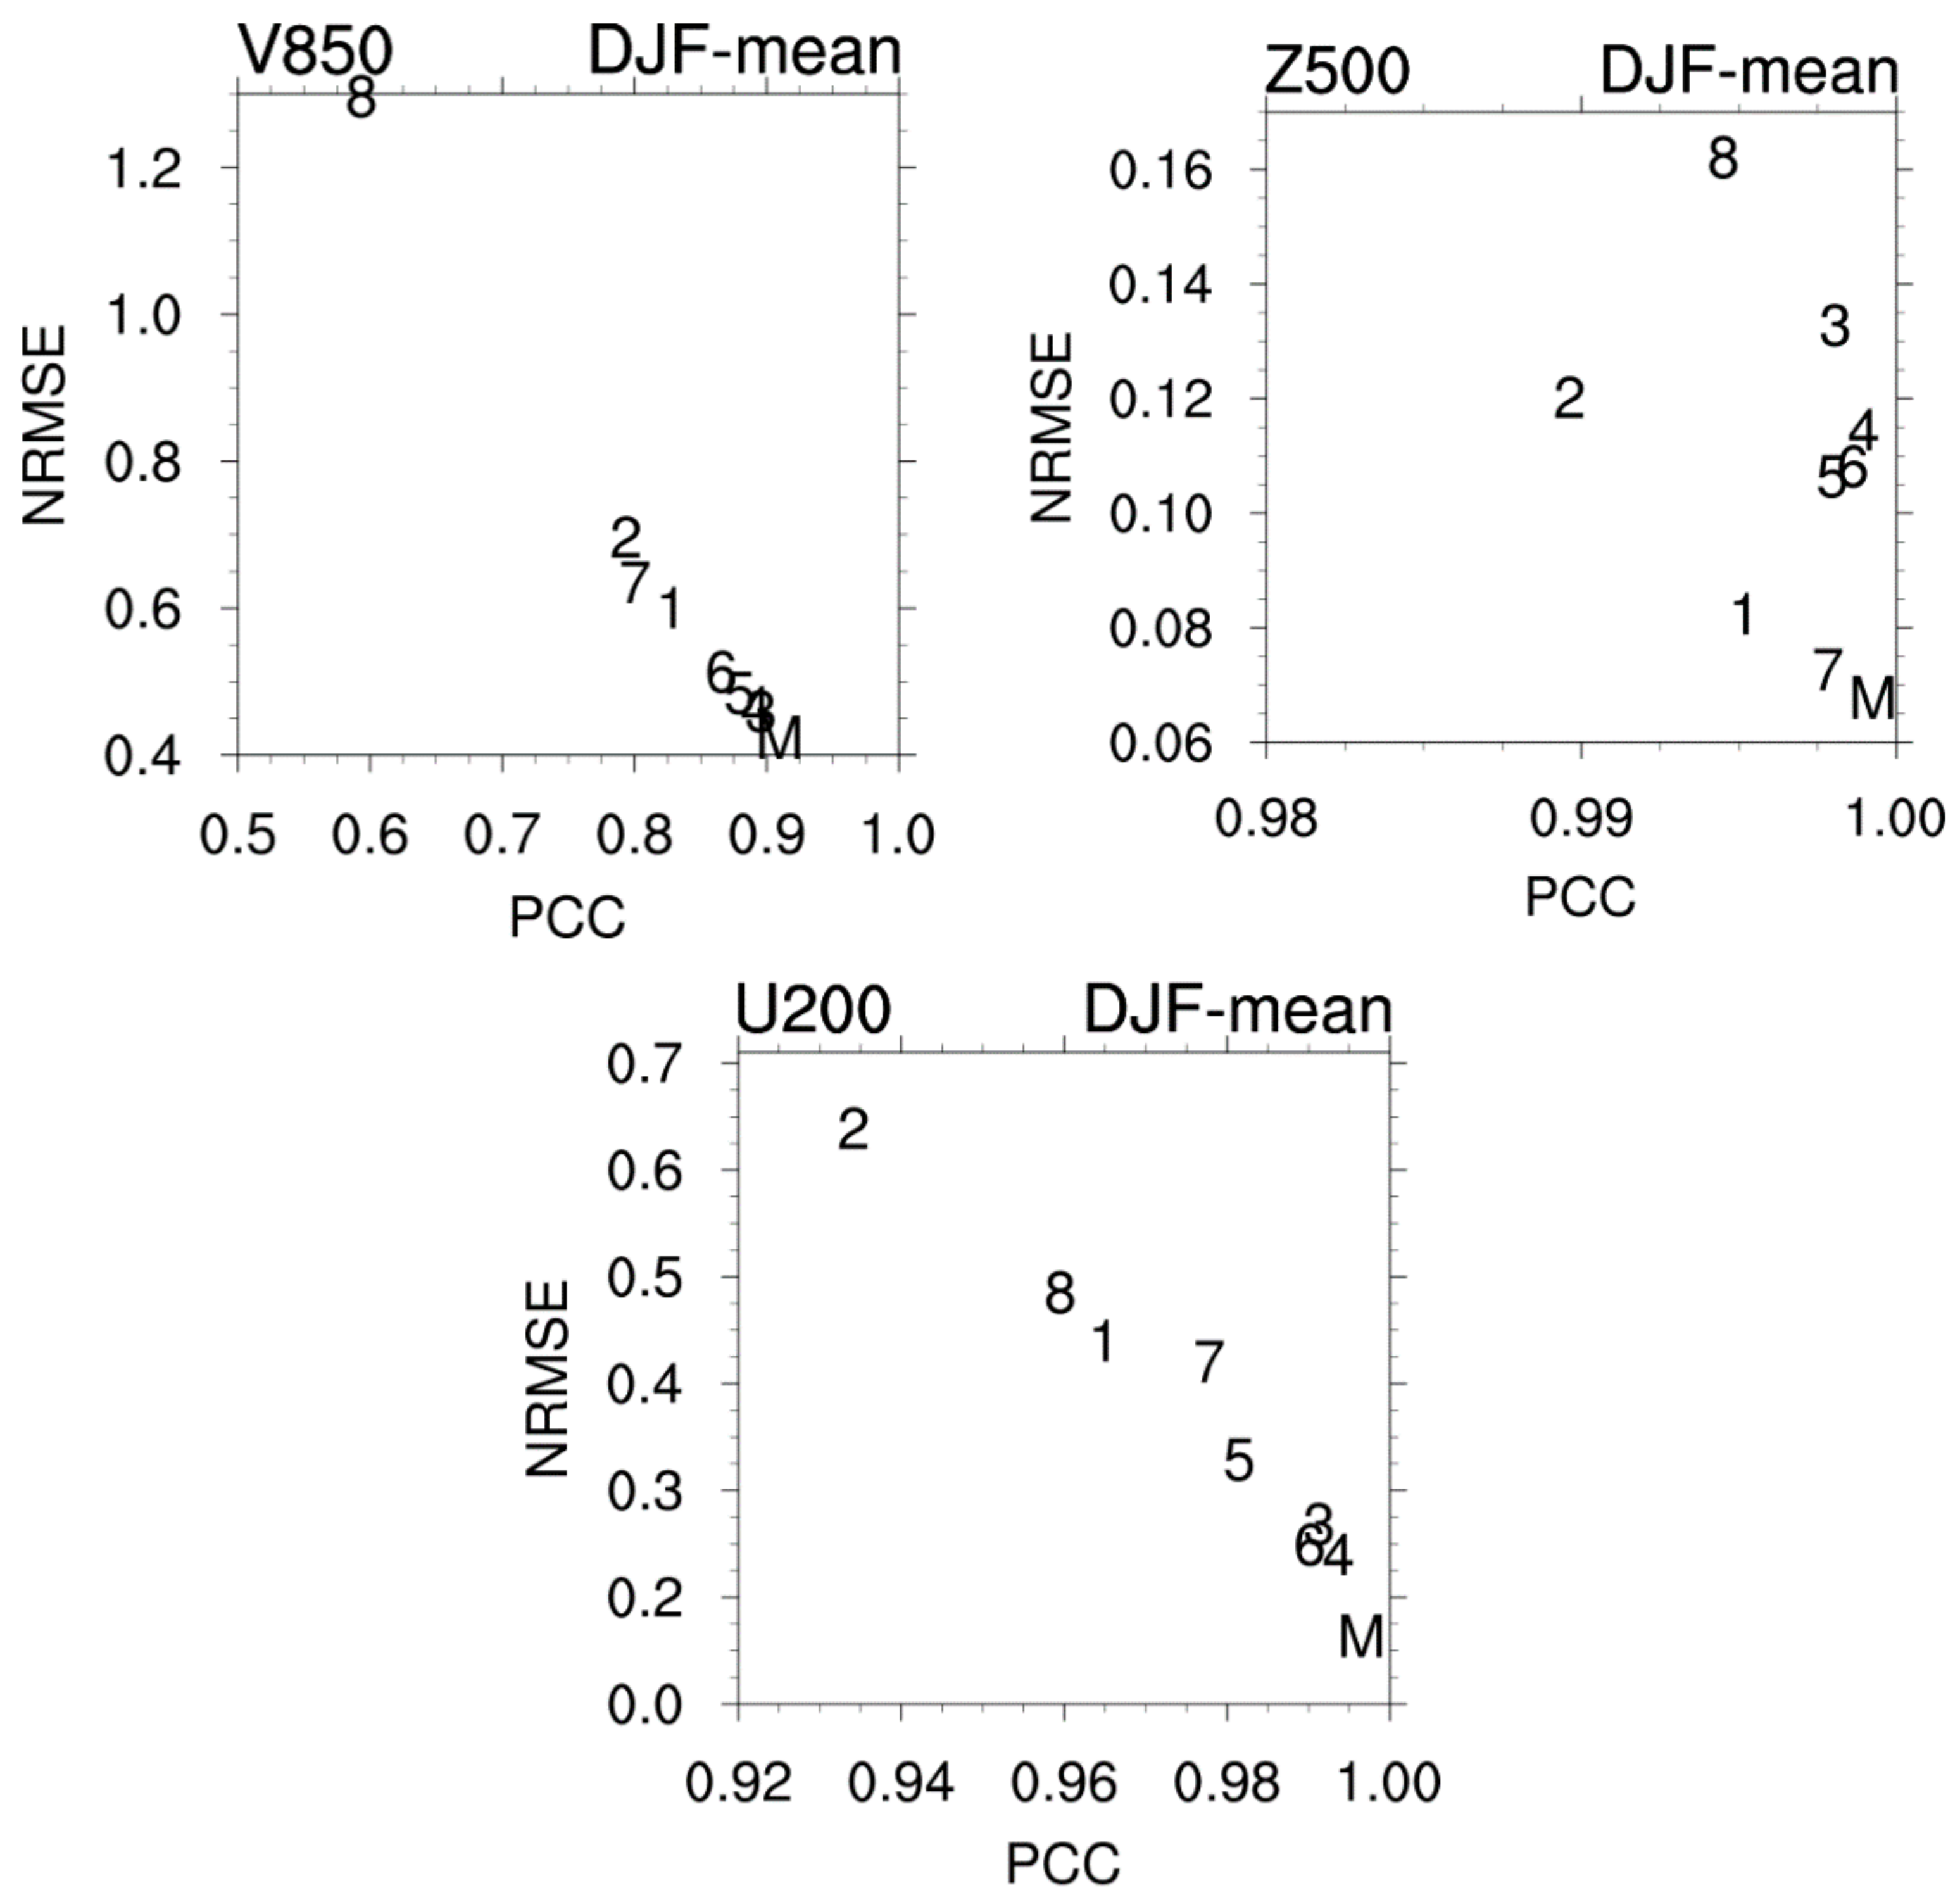
To objectively assess the performance of models in representing the climatological features of EAWM in more detail, we compare the pattern correlation coefficient (PCC) skill and normalized root mean square error (NRMSE) over the entire Asian region (Figure 6). The NRMSE is the RMSE normalized by the standard deviation, which is calculated based on the global average. Although there are different inter-model spreads depending on the variables, most individual models can realistically reproduce the observed climatology of EAWM. While some models demonstrate large inter-model spread in the SLP and V850, most models show high PCC over 0.95 and low NRMSE below 0.5 in the SLP, U200 and Z500. In addition, the MME simulates much better climatological features of the EAWM with a high fidelity than the individual models (MME shows the highest PCC and the lowest NRMSE in all variables), since the bias from the MME is smaller than that from the most of single models.
3.2. Interannual Variability of EAWM
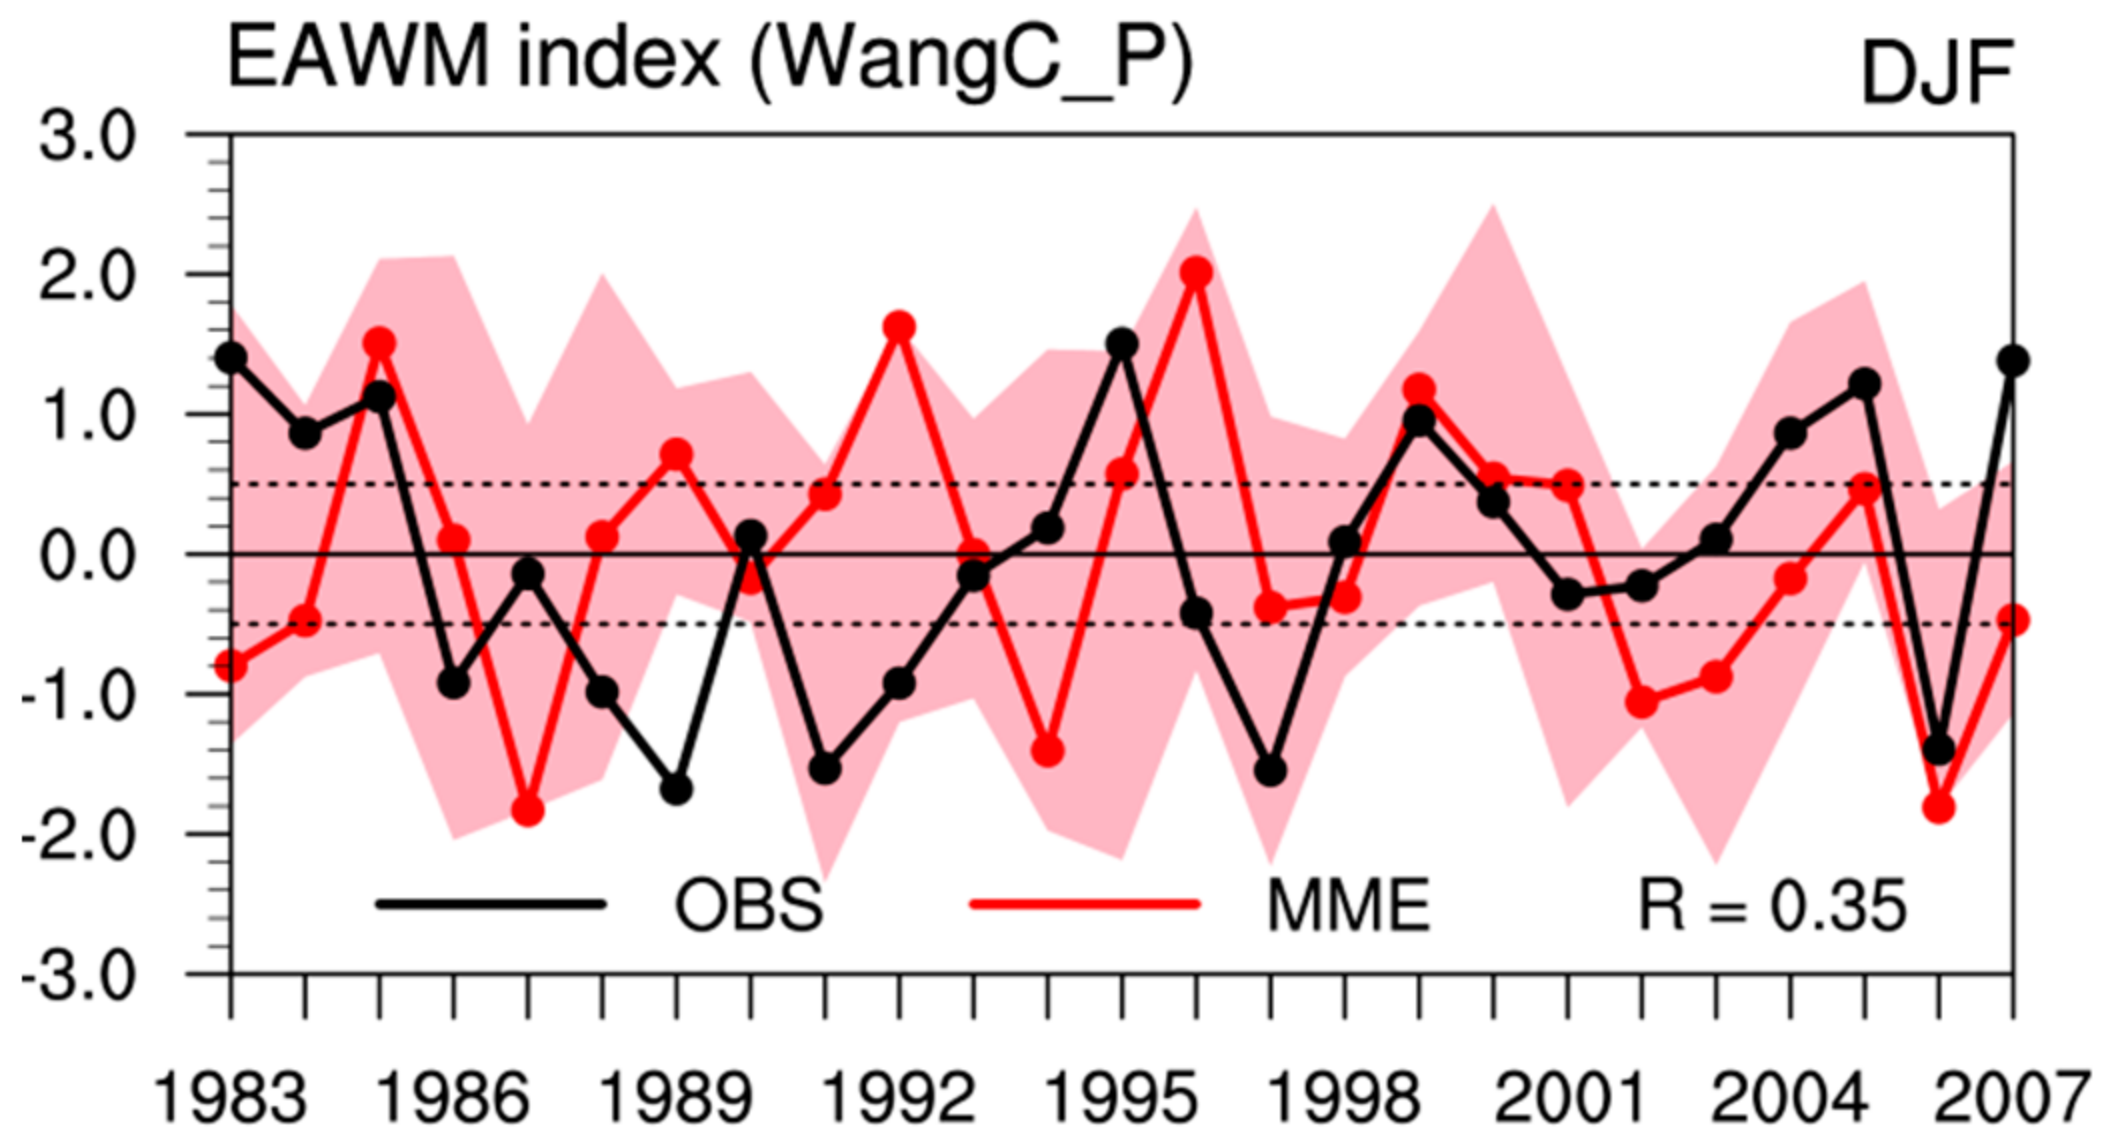
The above analysis indicates that the climate models used in this study are capable of capturing the major features of the DJF-mean circulation over East Asia. How well do the models predict the EAWM IAV? To answer this question, we use the index selected in Section 2.2 as an efficient way to describe the prediction skill of EAWM IAV. Figure 7 compares the temporal variation of the EAWM indices from OBS and MME. Both indices experience strong variability; however, they show different phases in most years. Although the correlation coefficient between the observed and predicted indices is 0.35 (significant at 90% confidence level), the MME fails to capture the observed intensity of EAWM especially in extreme winter years. The shading with pink color indicates the model spread of eight models and implies a wide range of prediction skill for EAWM intensity that exceeds one standard deviation of EAWM IAV in almost all years. Overall, the models are still quite diverse in simulating the EAWM IAV, even varying in the sign of EAWM intensity of each year. This result implies that there are still many uncertainties in predicting the EAWM IAV and accurate prediction of the EAWM variability is still a challenge, which is consistent with previous result [44]. On the other hand, it seems there is correlation shift before and after 1997. For the recent period (1998–2007), the MME exhibit relatively higher correlation skill, presumably due to the intensified ENSO-EAWM relationship in the observations and predictable component of EAWM influenced by ENSO (or relatively higher skill of the teleconnection to the EAWM by ENSO) [44].
To evaluate the prediction skill for EAWM IAV by individual models, we compare the temporal correlation coefficient of monthly mean EAWM index between the observed and each model with MME in Figure 8. The prediction skill of EAWM IAV varies substantially from one model to another. The prediction skill of individual models becomes diverse as the lead time increases, which leads to the reduction of the MME skill. While most individual models and the MME show low prediction skill, POAMA model has outstanding skill in describing the temporal variation of the EAWM IAV throughout the winter. Figure 9 shows the circulation anomalies of OBS, MME and POAMA model regressed onto the EAWM index. In the OBS, a strong EAWM is associated with significant cooling anomalies from central Siberia to East Asia and enhanced positive (negative) SLP anomalies over the Eurasian continent (North Pacific). Accompanied with the SLP anomaly, strengthened northerly winds are observed over northeastern Asia. Although the MME roughly captures the SLP anomalies, the thermal contrast between the cold Asian continent and adjacent warm oceans, is considerably weaker than observations. The MME reproduce weaker northerly anomalies over northeastern Asia and exaggerates the northeasterly anomalies through South China Sea to Southeast Asia. In addition, the cooling anomalies from central Siberia to East Asia is not captured from the MME. In the middle and upper troposphere, a remarkable feature is the negative geopotential height anomalies over the East Asia and northwestern Pacific and positive zonal wind anomalies along the East Asian jet stream. These features imply a deepened East Asian trough and accelerated East Asian jet stream in a strong EAWM. Although the MME reproduces these features roughly, the East Asian trough and jet stream are relatively weaker than observations. We also evaluate the individual models’ performance in representing the EAWM-related circulation anomalies (figures not shown). While some models (GDAPS, NCEP, PNU) generally reproduce the features of EAWM-related circulation anomalies, they fail to reproduce enhanced northerly winds and significant cooling anomalies over northeastern Asia, which are the prominent biases in most models. Among the forecast models used in this study, only the POAMA describes the spatial pattern of EAWM-related circulation anomalies considerably well, although there are some apparent biases over the Maritime Continents (MC) and the tropical eastern Indian Ocean (IO).
3.3. Predictability of POAMA
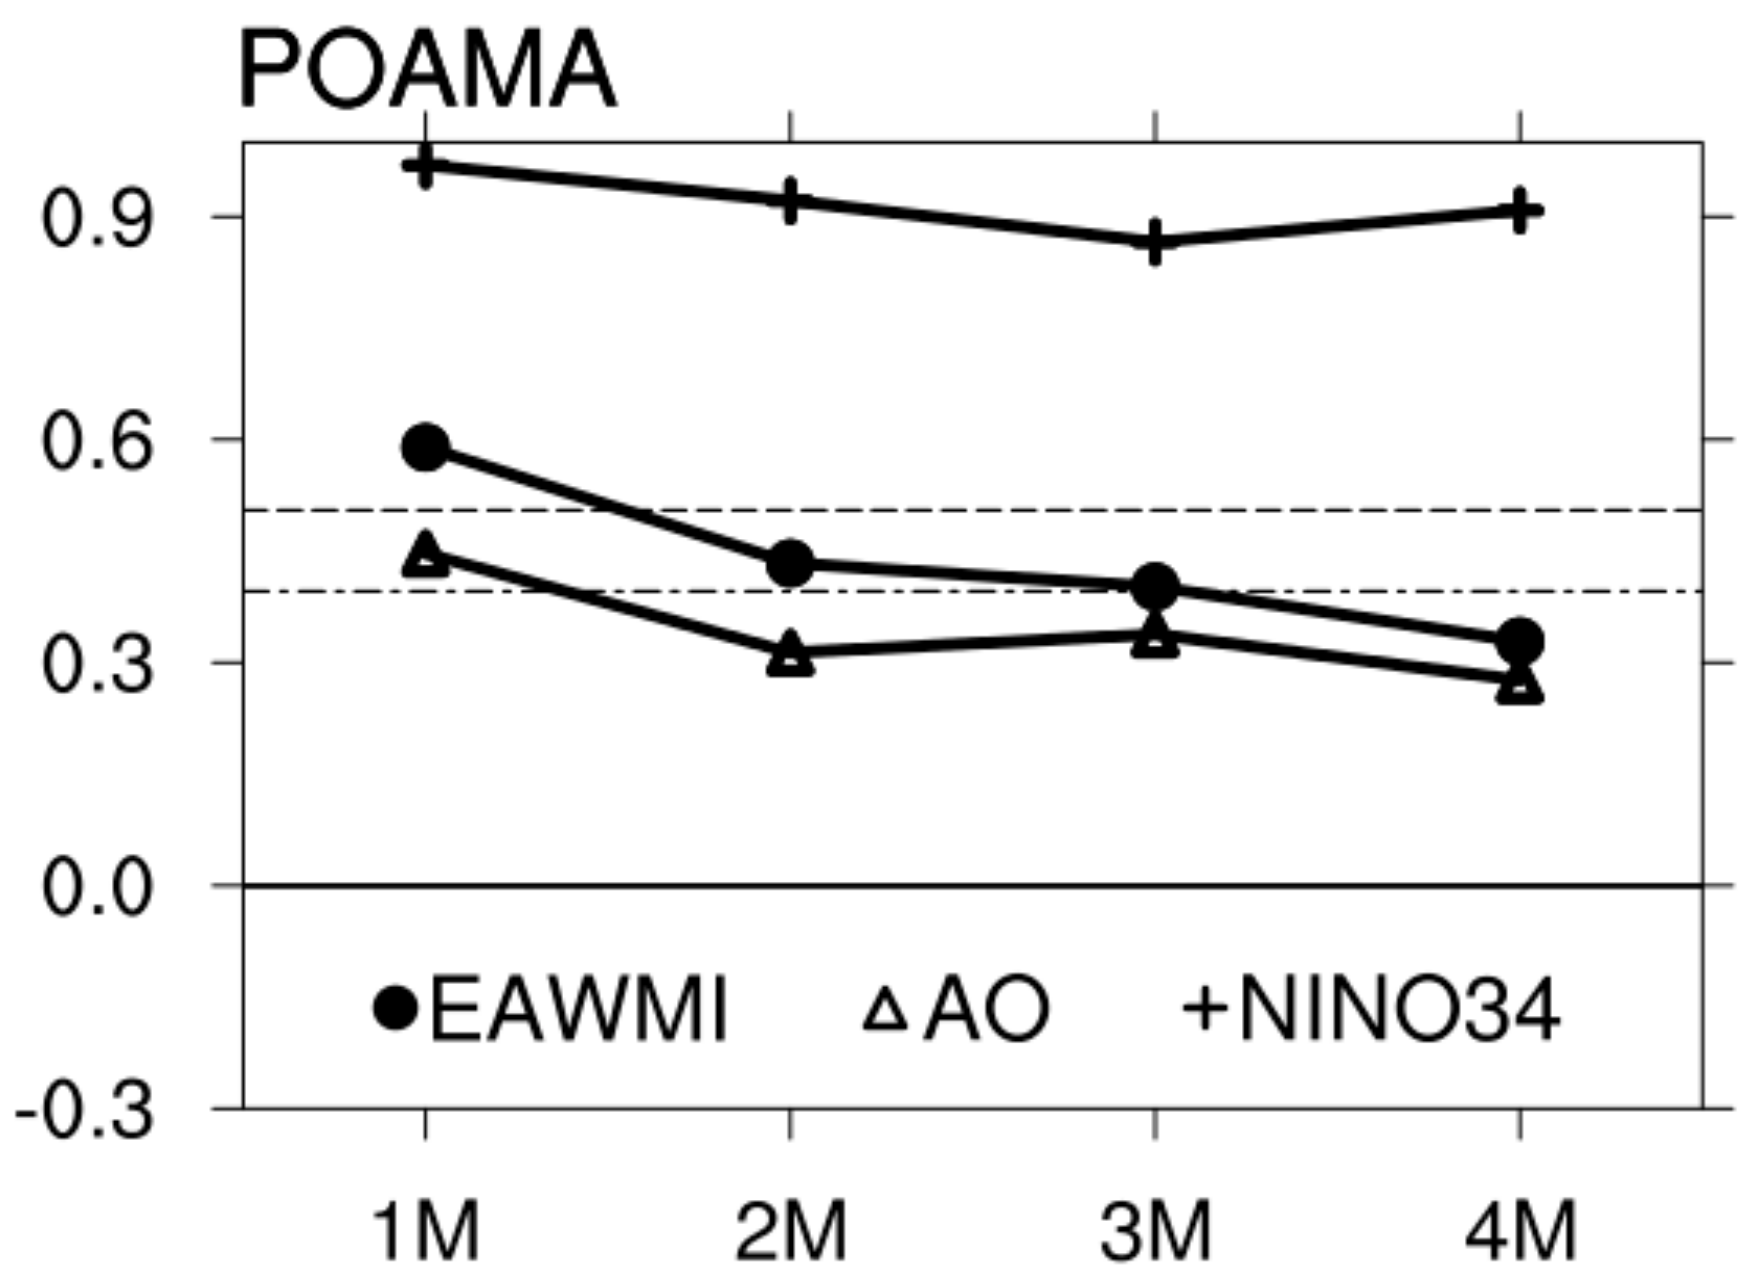
Figure 10 shows the correlations of the EAWM index, AO index and Nino 3.4 index between the OBS and the simulation by POAMA for different lead months. The skill of the EAWM decays persistently with lead time, which shows marginal skill for up to three months. Because of the significant impacts of the ENSO and AO on the prediction of EAWM, we also display the prediction skill of these factors. While the model predicts the variation of Nino 3.4 SST very well for all time leads, it shows marginal skill of the AO only for the one-month lead. The prediction skill of EAWM rapidly decreases from the one-month lead to the two-month lead and then slightly decreases with lead time.
To access which components of the EAWM appear to have a larger impact on the prediction skill, we analyze the EAWM-related circulation anomalies for different lead times (Figure 11). The anomalies in the one-month lead with high skill are more similar to the observations than longer lead months and their magnitudes gradually weaken with lead time. In particular, the predicted anomalies in the SLP, T2m and 850 hPa wind over the Asian continent vary sharply from the one-month lead to the two-month lead. The model does not capture the EAWM-related circulations over the Asian continent (north of 35° N), except for the one-month lead prediction. In the upper atmospheric circulation, the anomalies do not show consistent features for long leads. For example, the anomalies in Z500 and U200 of the three-month lead are relatively well represented than those of the one-month lead compared to the two- and four-months leads. This result indicates that the predictability of EAWM strongly depends on the skill in predicting the anomalies over Asian continent. Taking into account the significant link of the EAWM with the ENSO (AO), predictability of EAWM is also influenced by the model’s ability of the teleconnection to the EAWM by ENSO (AO). According to the previous analysis by Wang et al. [1] and Jiang et al. [32], the ENSO primarily affects the tropical components of the EAWM, while the AO affects the extratropical components of EAWM from the high latitude continent. The model only captures the AO-related circulation over the Ural Mountains and the North Pacific for the one-month lead, although the magnitude of the predicted circulation is weaker than the observation (not shown). This result supports that the POAMA can only predict the EAWM and partly is due to the skillful prediction of AO at one-month lead.
4. Seasonal Forecast
4.1. Winter Temperature
The EAWM IAV is a highly influential factor for the seasonal forecast in the wintertime; therefore, better prediction skill of the EAWM intensity, in turn, leads to a better skill of the seasonal forecast. In this section, we focus on the performance in simulating the temporal and spatial variations of surface air temperature anomalies over East Asia. As mentioned in Figure 9, significant cooling is observed from central Siberia to East Asia when the EAWM is strong. This feature is confirmed with other observation conducted by researchers at the University of Delaware (UD) [45], which also shows predominant cooling in southeast China and Korea (not shown). The POAMA successfully captures the spatial pattern of EAWM-related temperature anomalies, although the magnitude of the anomalies is relatively weaker than observations with the excessive cold bias over the Indochina Peninsula. Moreover, the POAMA shows advanced skill in reproducing the temporal variations of the DJF-mean surface air temperature anomalies, compared to other individual models and the MME. Figure 12 compares the covariability of the EAWM index with the DJF-mean surface air temperature anomaly averaged over East Asia using the OBS, MME and POAMA. Both observations (NCEP-R2 and UD) show a distinct extreme phase of surface air temperature according to the strength of the EAWM. The MME cannot delineate the variance in temperatures related to the EAWM nor the extreme phases of cold/warm winters over East Asia. On the other hand, the POAMA generally reproduces not only the variance in temperature but also the relationship between the strength of the EAWM and the surface air temperature extremes over East Asia.
4.2. A Tailored EAWM Index
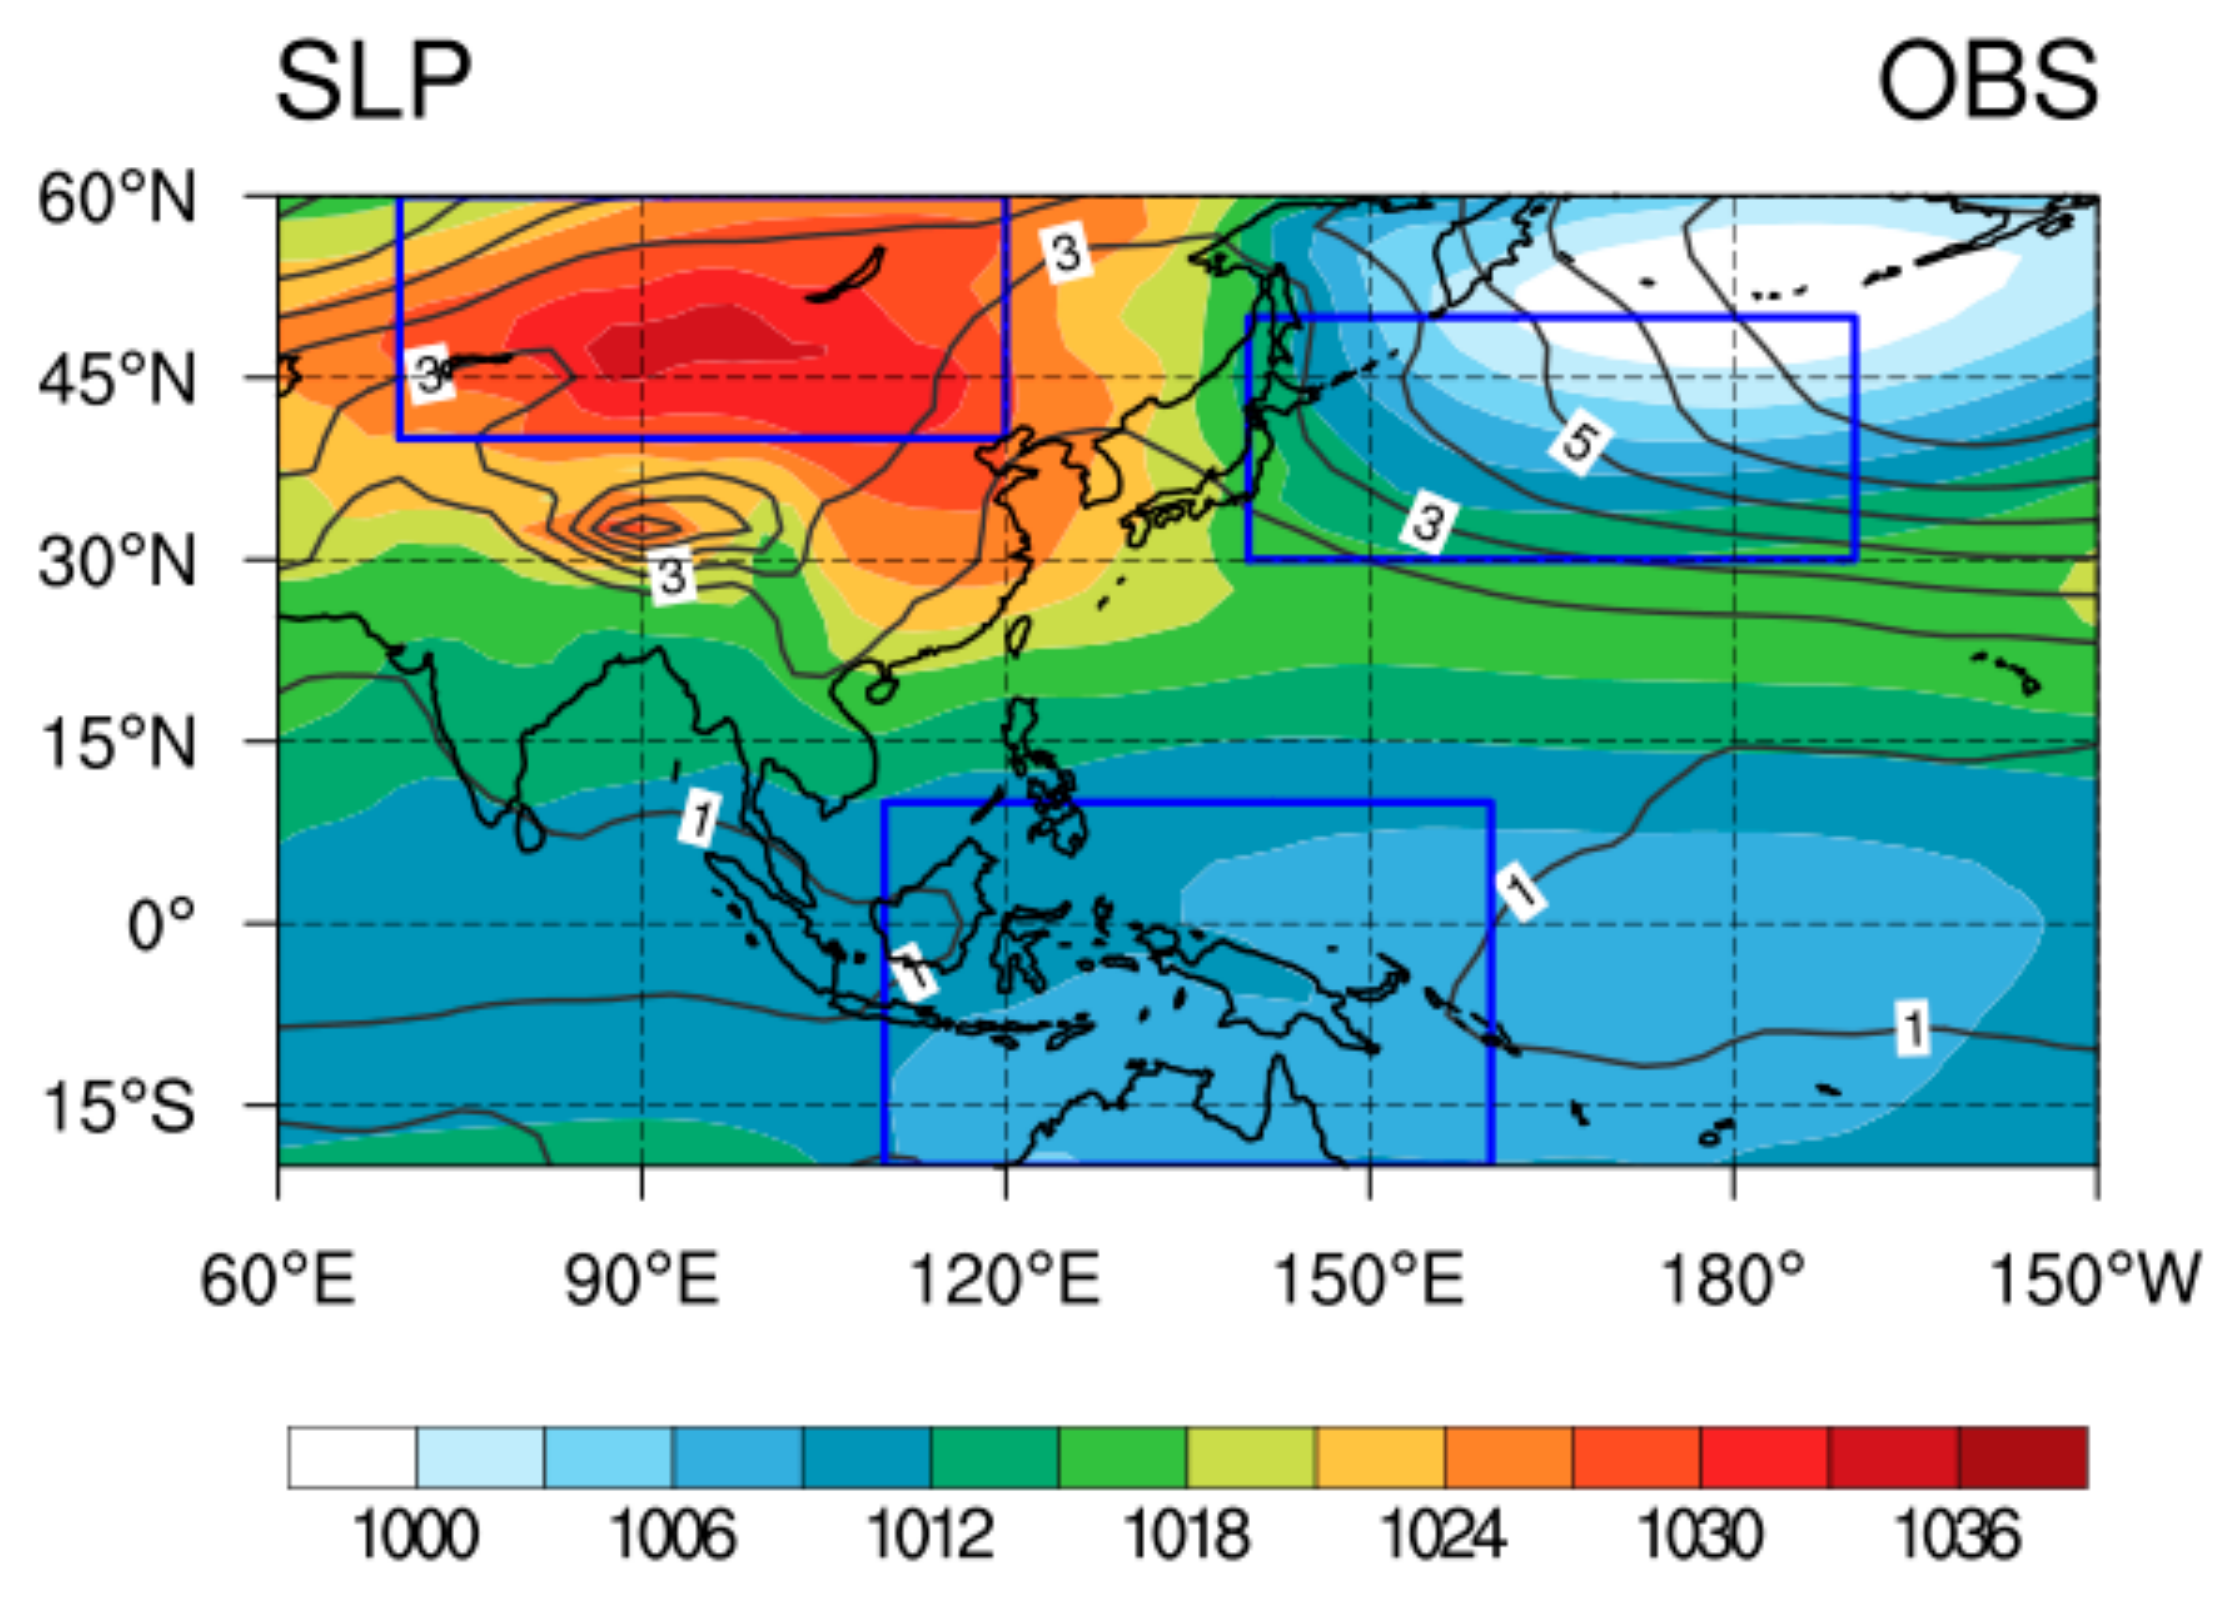
For the sake of a more reliable seasonal forecast of the winter season, efforts have been made to improve the forecasting techniques of EAWM intensity. We recommend the use of the modified EAWM index, which is newly calculated considering the model bias of POAMA. Figure 13 displays the SLP winter climatology with the SLP regions selected to define the original (blue color) and modified (red color) EAWM index. The original EAWM index developed by Wang and Chen [9] is calculated as follows:
The normalized SLP is used because the SLP variance is small in the tropical region compared to that in the midlatitudes. In Figure 13, we can find that the POAMA has systematic errors in simulating the location and variance of the pressure system, including the Siberian high, the Aleutian low and the MC low. The Siberian high given by the POAMA is displaced to the south compared to observations and Aleutian low and the MC low are also located further westward and northward compared to observations. These errors in the SLP system give rise to a failure in prediction of the EAWM IAV. Taking into account the model bias and TCC (Temporal Correlation Coefficient) skill of the SLP, the EAWM index is newly calculated based on the modified pressure areas as follows:
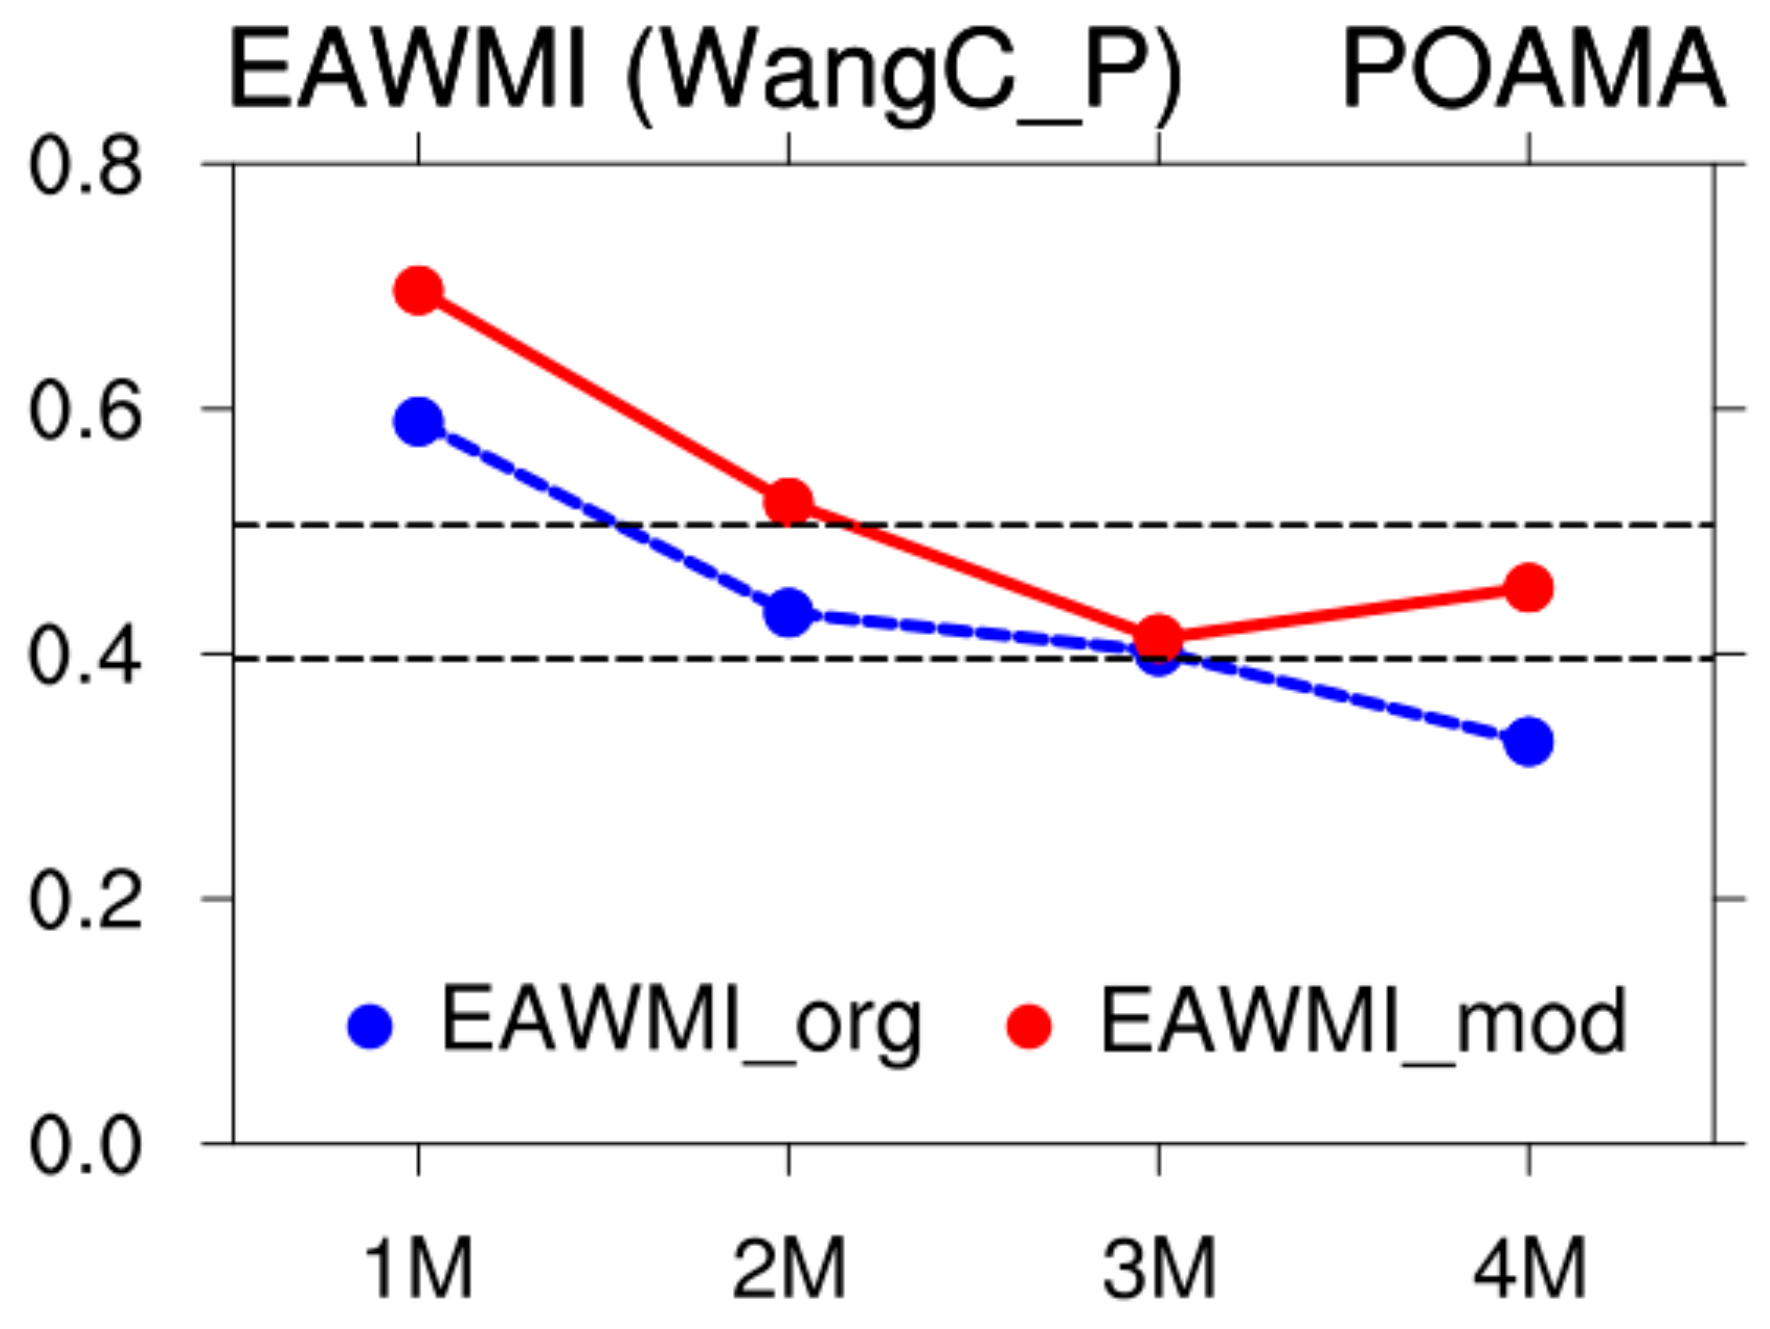
To evaluate the performance of the modified index, we compare the prediction skill of the original EAWM IAV with that of the modified index. The results show that the modified EAWM index improves the temporal and spatial variations of the EAWM IAV with higher fidelity than the original index (not shown). Moreover, the index based on the modified area shows better predictability than that based on the original areas and the prediction skill maintains statistically significant levels for most lead months (Figure 14).
5. Discussion and Summary
The present study provides a comprehensive assessment of the EAWM IAV by the seasonal prediction models participating in the APCC multi-model ensemble (MME) seasonal forecast. Firstly, the author evaluated the performances of the existing 19 EAWM indices to find a suitable index for the APCC seasonal forecast system. The criteria used to select the EAWM index is the following: the potential predictability of the EAWM in climate models and the representability of the wintertime temperature variations associated with the EAWM. The selected index, developed by Wang and Chen [9], not only predicts the EAWM IAV at a high level but also describes the variations of the wintertime temperature over East Asia, especially for the extreme cold winters. Using the selected EAWM index, the author evaluates the prediction skill of the EAWM IAV and the atmospheric circulation anomalies related with the EAWM.
Most of the models well represent the major mean circulation related with EAWM, such as the sea level pressure contrast between the cold Siberian high and the warm Aleutian and Australian lows, the prominent low-level northerly wind along the eastern coast, the strong East Asian trough and the upper troposphere jet stream over East Asia. The MME is evidently better than individual models in simulating climatological features of the EAWM with a high fidelity (MME shows the highest PCC and the lowest NRMSE in all variables, except for T2m). However, most individual models and the MME still suffer from the difficulty in predicting the interannual variability of the EAWM. This bias may arise from the shortcoming of the models in predicting the strong Siberian High and northerly winds over northeastern Asia in a strong EAWM. Fortunately, POAMA predicts the observed values of the EAWM intensity realistically, with a correlation coefficient of 0.59 between the observed and predicted indices. The pattern of the EAWM-related anomalies is also well-reproduced in POAMA, although the simulated anomalies are slightly weaker than the observations. The better performance of the POAMA may be due to the better skill to simulate the AO-related circulation over the Ural Mountains and the North Pacific and the strong links between ENSO and the EAWM.
For more reliable MME construction and seasonal forecasts for the winter season, efforts have been made to improve the forecasting techniques of the EAWM intensity. Taking into account model bias, the EAWM index is newly calculated according to the modified areas of the SLP. The modified EAWM index improves the phase of the EAWM IAV with higher fidelity than the original index and maintains statistically significant levels for most lead months.
Author Contributions
Writing—original draft, S.-H.S.; Writing—review & editing, J.-Y.M.
Funding
This research received no external funding.
Acknowledgments
This research was supported by the APEC Climate Center. The authors acknowledge the APCC MME Producing Centers for making their hindcast/forecast data available for analysis and the APEC Climate Center for collecting and archiving them and for organizing APCC MME prediction. The single-model and multimodel predictions used in the paper are available at the APCC Data Service System (ADSS, http://apcc21.sbis.co.kr/). However, some of models cannot be redistributed through the APCC due to their security issues (e.g., JMA).
Conflicts of Interest
The authors declare no conflicts of interest.
References
- Wang, B.; Wu, Z.; Chang, C.P.; Liu, J.; Li, J.; Zhou, T. Another look at interannual-to-interdecadal variations of the east Asian winter monsoon: The northern and southern temperature modes. J. Clim. 2010, 23, 1495–1512. [Google Scholar] [CrossRef]
- Chen, Z.; Wu, R.; Chen, W. Distinguishing interannual variations of the northern and southern modes of the East Asian winter monsoon. J. Clim. 2014, 27, 835–851. [Google Scholar] [CrossRef]
- Gong, D.Y.; Wang, S.W.; Zhu, J.H. East Asian winter monsoon and Arctic oscillation. Geophys. Res. Lett. 2001, 28, 2073–2076. [Google Scholar] [CrossRef]
- Jhun, J.G.; Lee, E.J. A new East Asian winter monsoon index and associated characteristics of the winter monsoon. J. Clim. 2004, 17, 711–726. [Google Scholar] [CrossRef]
- Wang, L.; Chen, W.; Zhou, W.; IIuang, R.I.I. Interannual variations of East Asian trough axis at 500 hPa and its association with the East Asian winter monsoon pathway. J. Clim. 2009, 22, 600–614. [Google Scholar] [CrossRef]
- Zhou, T.J.; Wu, B.; Wang, B. How well do atmospheric general circulation models capture the leading modes of the interannual variability of the Asian-Australiann monsoon? J. Clim. 2009, 22, 1159–1173. [Google Scholar] [CrossRef]
- Huang, R.H.; Chen, J.L.; Wang, L.; Lin, Z.D. Characteristics, processes and causes of the spatio-temporal variabilities of the East Asian monsoon system. Adv. Atmos. Sci. 2012, 29, 910–942. [Google Scholar] [CrossRef]
- Zhang, R.; Sumi, A.; Kimoto, M. Impact of El Nino on the East Asian monsoon: A diagnostic study of the ‘86/87 and ’91/92 events. J. Meteorol. Soc. Jpn. 1996, 74, 49–62. [Google Scholar] [CrossRef]
- Wang, L.; Chen, W. An intensity index for the East Asian winter monsoon. J. Clim. 2014, 27, 2361–2374. [Google Scholar] [CrossRef]
- Ding, Y.; Krishnamurti, T.N. Heat Budget of the Siberian High and the Winter Monsoon. Mon. Weather Rev. 1987, 115, 2428–2449. [Google Scholar] [CrossRef] [Green Version]
- Watanabe, M.; Nitta, T. Decadal changes in the atmospheric circulation and associated surface climate variations in the Northern Hemisphere winter. J. Clim. 1999, 12, 494–509. [Google Scholar] [CrossRef]
- Chen, W.; Kang, L.H. Linkage between the Arctic Oscillation and winter climate over East Asia on the interannual timescale: Roles of quasi-stationary planetary waves. Chin. J. Atmos. Sci. 2006, 30, 863–870. [Google Scholar]
- He, S.; Wang, H.; Liu, J. Changes in the relationship between ENSO and Asia-Pacific midlatitude winter atmospheric circulation. J. Clim. 2013, 26, 3377–3393. [Google Scholar] [CrossRef]
- Liu, J.; Curry, J.A.; Wang, H.; Song, M.; Horton, R.M. Impact of declining Argic sea ice on winter snowfall. Proc. Natl. Acad. Sci. USA 2012, 109, 4074–4079. [Google Scholar] [CrossRef] [PubMed]
- Liu, Y.; Wang, L.; Zhou, W.; Chen, W. Three Eurasian teleconnection patterns: Spatial structures, temporal variability and associated winter climate anomalies. Clim. Dyn. 2014, 42, 2817–2839. [Google Scholar] [CrossRef]
- Wang, N.; Zhang, Y. Evolution of Eurasian teleconnection pattern and its relationship to climate anomalies in China. Clim. Dyn. 2015, 44, 1017–1028. [Google Scholar] [CrossRef]
- Park, H.J.; Ahn, J.B. Combined effect of the Arctic Oscillation and the Western Pacific pattern on East Asia winter temperature. Clim. Dyn. 2016, 46, 3205–3221. [Google Scholar] [CrossRef]
- Lim, Y.K.; Kim, H.D. Comparison of the impact of the Artic Oscillation and Eurasian teleconnection on interannual variation in East Asian winter temperatures and monsoon. Theor. Appl. Climatol. 2016, 124, 267–279. [Google Scholar] [CrossRef]
- Guo, Q.Y. Relationship between the variations of East Asian winter monsoon and temperature anomalies in China. Q. J. Appl. Meteorol. 1994, 5, 218–225. [Google Scholar]
- Cui, X.; Sun, Z. East Asian winter monsoon index and its variation analysis. J. Nanjing Inst. Meteorol. 1999, 22, 321–325. [Google Scholar]
- Wang, H.J.; Jiang, D.B. A new East Asian winter monsoon intensity index and atmospheric circulation comparison between strong and weak composite. Quart. Sci. 2004, 24, 19–27. [Google Scholar]
- Wang, L.; Chen, W. How well do existing indices measure the strength of the East Asian winter monsoon? Adv. Atmos. Sci. 2010, 27, 855–870. [Google Scholar] [CrossRef]
- Li, F.; Wang, H. Predictability of the East Asian winter monsoon interannual variability as indicated by the DEMETER CGCMs. Adv. Atmos. Sci. 2012, 29, 441–454. [Google Scholar] [CrossRef]
- Kang, I.S.; Jin, K.; Wang, B.; Lau, K.M.; Shukla, J.; Krishnamurthy, V.; Schubert, S.; Wailser, D.; Stern, W.; Kitoh, A.; et al. Intercomparison of the climatological variations of Asian summer monsoon precipitation simulated by 10 GCMs. Clim. Dyn. 2002, 19, 383–395. [Google Scholar]
- Yang, S.; Zhang, Z.; Kousky, V.E.; Higgins, R.W.; Yoo, S.H.; Liang, J.; Fan, Y. Simulations and seasonal prediction of the Asian summer monsoon in the NCEP Climate Forecast System. J. Clim. 2008, 21, 3755–3775. [Google Scholar] [CrossRef]
- Wang, B.; Yang, J.; Zhou, T.; Wang, B. Interdecadal changes in the major modes of Asian-Australian monsoon variability: Strengthening relationship with ENSO since the late 1970s. J. Clim. 2008, 21, 1771–1789. [Google Scholar] [CrossRef]
- Zhou, L.; Tam, C.Y.; Zhou, W.; Chan, J.C.L. Influence of South China Sa SST and ENSO on wither Rainfall over South China. Adv. Atmos. Sci. 2010, 27, 832–844. [Google Scholar] [CrossRef]
- Zhang, Y.; Sperber, K.R.; Boyle, J.S. Climatology and interanuual variation of the East Asian winter monsoon: Results from the 1979-95 NCAR/NCEP reanalysis. Mon. Weather Rev. 1997, 125, 2605–2619. [Google Scholar] [CrossRef]
- Sohn, S.J.; Tam, C.Y.; Park, C.K. Leading modes of East Asian winter climate variability and their predictability: An assessment of the APCC Multi-Model Ensemble. J. Meteorol. Soc. Jpn. 2011, 89, 455–474. [Google Scholar] [CrossRef]
- Palmer, T.N.; Alessandri, A.; Andersen, U.; Cantelaube, P.; Davey, M.; Delécluse, P.; Déqué, M.; Diez, E.; Doblas-Reyes, F.J.; Feddersen, H.; et al. Development of a European multimodel ensemble system for seasonal-to interannual prediction (DEMETER). Bull. Am. Meteorol. Soc. 2004, 85, 853–872. [Google Scholar] [CrossRef]
- Jiang, X.; Yang, S.; Li, Y.; Kumar, A.; Wang, W.; Gao, Z. Dynamical prediction of the East Asian winter monsoon by the NCEP Climate Forecast System. J. Geophys. Res. Atmos. 2013, 118, 1312–1328. [Google Scholar] [CrossRef] [Green Version]
- Gong, H.; Wang, L.; Chen, W.; Wu, R.; Wei, K.; Cui, X. The Climatology and Interannual variability of the East Asian Winter Monsoon in CMIP5 Models. J. Clim. 2014, 27, 1659–1678. [Google Scholar] [CrossRef]
- Janowiak, J.E.; Xie, P. CAMS-OPI: A golbal satellite-raingauge merged product for real-time precipitation monitoring applications. J. Clim. 1999, 12, 3335–3342. [Google Scholar] [CrossRef]
- Reynolds, R.W.; Smith, T.M.; Liu, C.; Chelton, D.B.; Casey, K.S.; Schlax, M.G. Daily high-resolution blended analyses for sea surface temperature. J. Clim. 2007, 20, 5473–5496. [Google Scholar] [CrossRef]
- Kanamitsu, M.; Ebisuzaki, W.; Woolden, J.; Yang, S.K.; Hnilo, J.J.; Fiorino, M.; Potter, G.L. NCEP-DOE AMIP II Reanalysis (R-2). Bull. Am. Meteorol. Soc. 2002, 83, 631–643. [Google Scholar] [CrossRef]
- Chan, J.C.L.; Li, C.Y. The East Asia Winter Monsoon; East Asian Monsoon; Chang, C.P., Ed.; World Scientific: Singapore, 2004; pp. 54–106. [Google Scholar]
- Shi, N. Features of the East Asian winter monsoon intensity on multiple time scale in recent 40 years and their relation to climate. Quart. J. Appl. Meteorol. 1996, 7, 175–182. [Google Scholar]
- Wang, L.; Huang, R.; Gu, L.; Chen, W.; Kang, L. Interdecadal variations of the East Asian winter monsoon and their association with quasi-stationary planetary wave activity. J. Clim. 2009, 22, 4860–4872. [Google Scholar] [CrossRef]
- Wu, B.; Wang, J. Winter Arctic oscillation, Siberian high and east Asian winter. Geophys. Res. Lett. 2002, 29, 1897. [Google Scholar] [CrossRef]
- Sun, B.M.; Li, C.Y. Relationship between the disturbances of East Asian trough and tropical convective activity in boreal winter. Chin. Sci. Bull. 1997, 42, 500–504. [Google Scholar]
- Li, Y.; Yang, S. A dynamical index for the East Asian winter monsoon. J. Clim. 2010, 23, 4255–4262. [Google Scholar] [CrossRef]
- Boo, K.O.; Martin, G.; Sellar, A.; Senior, C.; Byun, Y.H. Evaluating the East Asian monsoon simulation in climate models. J. Geophys. Res. 2011, 116, D01109. [Google Scholar] [CrossRef]
- Chang, C.P.; Harr, P.A.; Chen, H.J. Synoptic disturbances over the equatorial South China Sea and western maritime continent during boreal winter. Mon. Weather Rev. 2005, 133, 489–503. [Google Scholar] [CrossRef]
- Kang, D.; Lee, M.I. ENSO influence on the dynamical seasonal prediction of the East Asian Winter Monsoon. Clim. Dyn. 2017, 49, 2147–2160. [Google Scholar] [CrossRef]
- Willmott, C.J.; Matsuura, K. Terrestrial Air Temperature and Precipitation: Monthly and Annual Time Series (1950–1999). Available online: http://climate.geog.udel.edu/~climate/html_pages/README.ghcn_ts2.html. (accessed on 10 July 2018).
Figure 1.
Normalized December, January and February (DJF)-mean East Asian winter monsoon (EAWM) indices for the period 1983–2007. Two dotted lines indicate 0.5 std dev.
Figure 1.
Normalized December, January and February (DJF)-mean East Asian winter monsoon (EAWM) indices for the period 1983–2007. Two dotted lines indicate 0.5 std dev.

Figure 2.
The temporal correlation coefficients between the observed and simulated normalized DJF-mean EAWM indices for the period 1983–2007. Dashed lines denote the threshold values for the 95% and 99% significance levels.
Figure 2.
The temporal correlation coefficients between the observed and simulated normalized DJF-mean EAWM indices for the period 1983–2007. Dashed lines denote the threshold values for the 95% and 99% significance levels.

Figure 3.
Scatter plots of the normalized EAWM index vs. DJF-mean surface temperature anomalies averaged over East Asia (100–145° E, 20–50° N) for the period 1983–2007 based on the EAWM index defined in 11 papers listed in the references. The abscissa (ordinate) of each dot in each diagram represents the amplitude and sign of the EAWM index (the temperature index) for an individual winter season. The “R-squared” in the upper right corner of each plot explain the proportion of variance in temperature. The strong (weak) EAWM year with cold (warm) winter defined in Section 2.2 is shown at the lower right (left) corner with blue (red) characters of each plot.


Figure 4.
Normalized time series of the DJF EAWM index defined by Wang and Chen (2014) (red solid line), the DJF mean air temperature at 2 m averaged over East Asia (100–145° E, 20–50° N) (blue dotted line) and the Southeast Asian cold-surge index defined by Chang et al. [43] (green dotted line).
Figure 4.
Normalized time series of the DJF EAWM index defined by Wang and Chen (2014) (red solid line), the DJF mean air temperature at 2 m averaged over East Asia (100–145° E, 20–50° N) (blue dotted line) and the Southeast Asian cold-surge index defined by Chang et al. [43] (green dotted line).

Figure 5.
Climatology (1983–2007) of the DJF mean (left panels) sea level pressure (contours, hPa), surface air temperature (shading, °C) and 850 hPa winds (vectors, m s−1) (right panels). The 500 hPa geopotential height (contours, gpm) and 200 hPa zonal wind (shading, m s−1). The upper panels are the observations based on NCEP/NCAR R2 data (OBS), the middle panels are results of the MME of the 9 forecast models (MME) calculated by taking the simple average of the climatology from each model and the lower panels are the differences between the MME and the OBS.


Figure 6.
Performance of forecasts models and their MME on DJF mean sea level pressure (SLP, hPa), 850 hPa meridional wind (V850, m s−1), surface air temperature (T2m, °C), 200 hPa zonal wind (U200, m s−1) and 500 hPa geopotential height (Z500, gpm). The abscissae and ordinates are the pattern correlation coefficient (PCC) and the domain-averaged RMSE normalized by the observed spatial standard deviation (NRMSE) of 8 models (marked by the model number in Table 1) and the MME (marked by “M”), respectively. The domain used is the region of 60–180° E, 0–60° N. Note that each plot has different axis.


Figure 7.
Interannual variation of the EAWM index for observations from NCEP-R2 (black line) and the ensemble means from the eight multi-models (red line). Dashed lines correspond to values of 0.5 and –0.5 std dev, respectively. Shading by pink denotes the range assessed from the individual model values used in MME.

Figure 8.
Correlation coefficients between the simulated and observed normalized DJF mean EAWM index and those based on monthly values within the whole December–February period. Dashed lines denote the threshold values for the 95% and 99% significance levels.
Figure 8.
Correlation coefficients between the simulated and observed normalized DJF mean EAWM index and those based on monthly values within the whole December–February period. Dashed lines denote the threshold values for the 95% and 99% significance levels.

Figure 9.
Regression onto the normalized EAWM index defined by Wang and Chen (2014) in the NCEP-R2 dataset of the DJF mean (left panels) sea level pressure (SLP, contours, hPa), surface air temperature (T2m, shading, °C) and 850 hPa winds (vectors, m s−1) (right panels) 500 hPa geopotential height (Z500, contours, gpm) and 200 hPa zonal wind (U200, shading, m s−1). The upper panels are for the observations based on NCEP-R2 (OBS) and the middle and bottom panels are for the MME and POAMA results, respectively. Only values exceeding the 95% confidence level are shown. Note that the shading and contours in MME are different to those in OBS and POAMA.

Figure 10.
Correlation coefficients between the observed indices and the indices derived from POAMA for different lead months. Values are shown for EAWM, AO and Nino 3.4. Two dashed lines denote the 95% and 99% confidence level, respectively. Here, the hindcast outputs were examined with different lead times from 1 to 4 months targeting for boreal winter (DJF), which were initialized near the first day of each month from Nov to Aug.

Figure 11.
Same as Figure 9 except for one-month (1M), two-months (2M), three-months (3M) and four-months lead (4M).
Figure 11.
Same as Figure 9 except for one-month (1M), two-months (2M), three-months (3M) and four-months lead (4M).

Figure 12.
Scatter plots of normalized EAWM index vs. DJF-mean temperature anomalies averaged over East Asia (100–145° E, 20–50° N) for the period 1983–2007 based on the EAWM index defined by Wang and Chen (2014).
Figure 12.
Scatter plots of normalized EAWM index vs. DJF-mean temperature anomalies averaged over East Asia (100–145° E, 20–50° N) for the period 1983–2007 based on the EAWM index defined by Wang and Chen (2014).

Figure 13.
The climatology and standard deviation of DJF mean SLP for the period 1983–2007. The three rectangles with blue and red colors indicate the areas used to define the original and modified EAWM index, respectively.
Figure 13.
The climatology and standard deviation of DJF mean SLP for the period 1983–2007. The three rectangles with blue and red colors indicate the areas used to define the original and modified EAWM index, respectively.


Figure 14.
Correlation coefficients between observed and simulated indices from POAMA for different lead months. Red solid line and blue dotted line indicate original and modified index, respectively. And two black dashed lines denote the 99% and 95% confidence level, respectively.
Figure 14.
Correlation coefficients between observed and simulated indices from POAMA for different lead months. Red solid line and blue dotted line indicate original and modified index, respectively. And two black dashed lines denote the 99% and 95% confidence level, respectively.


Table 1.
Seasonal prediction models used in this study.
| Model Acronym | Institute/Country | Number of Ensembles | SST Specification | |
|---|---|---|---|---|
| 1 | GDAPS | Korea Meteorological Administration/Korea | 20 | Predicted SST |
| 2 | HMC | Hydrometeorological Center of Russia/Russia | 20 | Persisted SST |
| 3 | CANCM3 | Meteorological Service of Canada/Canada | 10 | Predicted SST |
| 4 | CANCM4 | Meteorological Service of Canada/Canada | 10 | Predicted SST |
| 5 | NASA | National Aeronautics and Space Administration/USA | 11 | Predicted SST |
| 6 | NCEP | National Centers for Environmental Prediction/USA | 20 | Predicted SST |
| 7 | PNU | Pusan National University/Korea | 10 | Predicted SST |
| 8 | POAMA | Bureau of Meteorology/Australia | 33 | Predicted SST |
Table 2.
Description of the 11 EAWM indices used in this study. Here, SLP: sea level pressure, U: zonal winds and Φ: Geopotential height. Superscript * denotes the normalized field.
Table 2.
Description of the 11 EAWM indices used in this study. Here, SLP: sea level pressure, U: zonal winds and Φ: Geopotential height. Superscript * denotes the normalized field.
| Index | Defining Variable, Level and Regions | Reference |
|---|---|---|
| Chan_P | SLP gradient, (30–55° N, 100–120° E) − (30–55° N,150–170° E) | Chan and Li [36] |
| Gong_P | SLP, (40–60° N, 70–120° E) | Gong et al. [3] |
| Guo_P | SLP gradient, (10–60° N, 110° E) − (10–60° N, 160° E) | Guo [19] |
| Shi_P | SLP * gradient, (20–50° N, 110° E) − (20–50° N, 160° E) | Shi [37] |
| WangC_P | SLP * gradient, {2 × (40–60° N, 70–120° E) − (30–50° N, 140° E–170°W) − (20° S–10° N, 110–160° E)}/2 | Wang and Chen [9] |
| Wang_P | SLP * gradient, (40–70° N, 110° E) − (40–70° N, 160° E) | Wang et al. [38] |
| Wu_P | SLP * gradient, (20–70° N, 110° E) − (20–70° N, 160° E) | Wu and Wang [39] |
| Cui_Z | Φ *, 500 hPa, (35–40° N, 110–130° E) | Cui and Sun [20] |
| Sun_Z | Φ, 500 hPa, (30–40° N, 125–145° E) | Sun and Li [40] |
| Wang_Z | PC1 of Φ *, 500 hPa, (25–50° N, 100–180° E) | Wang et al. [5] |
| Li_U | U gradient, 200 hPa {[(30–35° N, 90–160° E) − (50–60° N, 70–170° E)] + [(30–35° N, 90–160° E) − (5° S–10° N,90–160° E)]}/2 | Li and Yang [41] |
© 2018 by the authors. Licensee MDPI, Basel, Switzerland. This article is an open access article distributed under the terms and conditions of the Creative Commons Attribution (CC BY) license (http://creativecommons.org/licenses/by/4.0/).
Share and Cite
MDPI and ACS Style
Shin, S.-H.; Moon, J.-Y. Prediction Skill for the East Asian Winter Monsoon Based on APCC Multi-Models. Atmosphere 2018, 9, 300. https://doi.org/10.3390/atmos9080300
AMA Style
Shin S-H, Moon J-Y. Prediction Skill for the East Asian Winter Monsoon Based on APCC Multi-Models. Atmosphere. 2018; 9(8):300. https://doi.org/10.3390/atmos9080300
Chicago/Turabian StyleShin, Sun-Hee, and Ja-Yeon Moon. 2018. "Prediction Skill for the East Asian Winter Monsoon Based on APCC Multi-Models" Atmosphere 9, no. 8: 300. https://doi.org/10.3390/atmos9080300
Note that from the first issue of 2016, this journal uses article numbers instead of page numbers. See further details here.