Difference in PM2.5 Variations between Urban and Rural Areas over Eastern China from 2001 to 2015
by
 , ,
, ,
Changqing Lin
1,2 ,
,
Alexis K. H. Lau
1,2,*,
Ying Li
3,
Jimmy C. H. Fung
2,4,
Chengcai Li
5,
Xingcheng Lu
2 and
Zhiyuan Li
2 1
Department of Civil and Environmental Engineering, The Hong Kong University of Science and Technology, Hong Kong, China
2
Division of Environment and Sustainability, The Hong Kong University of Science and Technology, Hong Kong, China
3
Department of Ocean Science and Engineering, Southern University of Science and Technology, Shenzhen 518055, China
4
Department of Mathematics, The Hong Kong University of Science and Technology, Hong Kong, China
5
Department of Atmospheric and Oceanic Sciences, School of Physics, Peking University, Beijing 100871, China
*
Author to whom correspondence should be addressed.
Atmosphere 2018, 9(8), 312; https://doi.org/10.3390/atmos9080312
Submission received: 1 June 2018
/
Revised: 15 July 2018
/
Accepted: 17 July 2018
/
Published: 10 August 2018
(This article belongs to the Special Issue Air Quality in China: Past, Present and Future)
Abstract
:To more effectively reduce population exposure to PM2.5, control efforts should target densely populated urban areas. In this study, we took advantage of satellite-derived PM2.5 data to assess the difference in PM2.5 variations between urban and rural areas over eastern China during the past three Five-Year Plan (FYP) periods (2001–2015). The results show that urban areas experienced less of a decline in PM2.5 concentration than rural areas did in more than half of the provinces during the 11th FYP period (2006–2010). In contrast, most provinces experienced a greater reduction of PM2.5 concentration in urban areas than in rural areas during the 10th and 12th FYP periods (2001–2005 and 2011–2015, respectively). During the recent 12th FYP period, the rates of decline in PM2.5 concentration in urban areas were more substantial than in rural areas by as much as 1.5 μg·m−3·year−1 in Beijing and 2.0 μg·m−3·year−1 in Tianjin. These results suggest that the spatial difference in PM2.5 change was conducive to a reduction in the population exposure to PM2.5 in most provinces during recent years.
1. Introduction
Long-term exposure to ambient PM2.5 (particulate matter with an aerodynamic diameter of smaller than 2.5 μm) is associated with a range of adverse health effects [1,2,3,4,5,6,7]. As one of the fastest developing and most heavily polluted countries in the world, China is suffering from much more severe PM2.5 exposure problems than the U.S. and Europe [8]. The population-weighted mean PM2.5 concentration in China was estimated to be 52 μg/m3 in 2014 [9]. In addition, in 2013, more than 96% of Chinese people lived in areas where PM2.5 concentrations exceeded the World Health Organization (WHO) Interim Target 1 (IT-1, 35 μg/m3, which is also the current Chinese National Ambient Air Quality Standard (NAAQS)) [10].
A decline in the mean PM2.5 concentration level is conducive to a reduction of the population’s exposure to PM2.5. During recent Five-Year Plan (FYP) periods, the Chinese government promulgated a series of control measures to reduce the PM2.5 concentration level in China [11,12,13]. Lin et al. [14] assessed the long-term variation in PM2.5 concentration over China during the past three FYP periods (2001–2015). Their results showed that the mean PM2.5 concentration increased in most provinces in southern China during the 10th FYP period (2001–2005) and then declined in most provinces in China during the 11th and 12th FYP periods (2006–2010 and 2011–2015, respectively).
For a more effective reduction in the population’s exposure to PM2.5, control efforts should target densely populated urban areas [15]. As a result, PM2.5 in urban areas will experience a more substantial reduction than in rural areas. This type of spatial difference in PM2.5 change helps to reduce the population’s exposure to PM2.5. To better guide future policy formulation, it is thus essential to assess the difference in PM2.5 variations between urban and rural areas in China.
To monitor the change in PM2.5 concentration, traditional studies have mostly relied on observations from ground monitoring networks [16]. However, such monitors are not able to fully capture the spatial variability in PM2.5 concentrations on a large scale [17]. In addition, national fixed-site monitoring of PM2.5 concentration in China has only been conducted since 2013. Satellite remote sensing of PM2.5 concentration has large spatial and temporal coverages and thus is an important step toward filling this data gap [18,19,20,21,22,23,24]. Han et al. [25] analyzed the PM2.5 data derived from satellite observations and demonstrated that PM2.5 concentrations in urban areas experienced a higher increase than those in rural areas in China from 1999 to 2011.
The lack of long-term spatially explicit PM2.5 data limits the assessment of PM2.5 concentrations in China. It is therefore of great value to derive more results using independent PM2.5 data. As many improved control measures have been enforced in China during the most recent FYP period, it is necessary to extend the assessment to the most recent FYP period. In the present study, we took advantage of a new satellite-derived PM2.5 dataset to characterize the long-term variation in PM2.5 concentration over eastern China. We then assessed the differences in PM2.5 trends between urban and rural areas for different provinces during the past three FYP periods (2001–2015).
2. Materials and Methods
2.1. Study Region
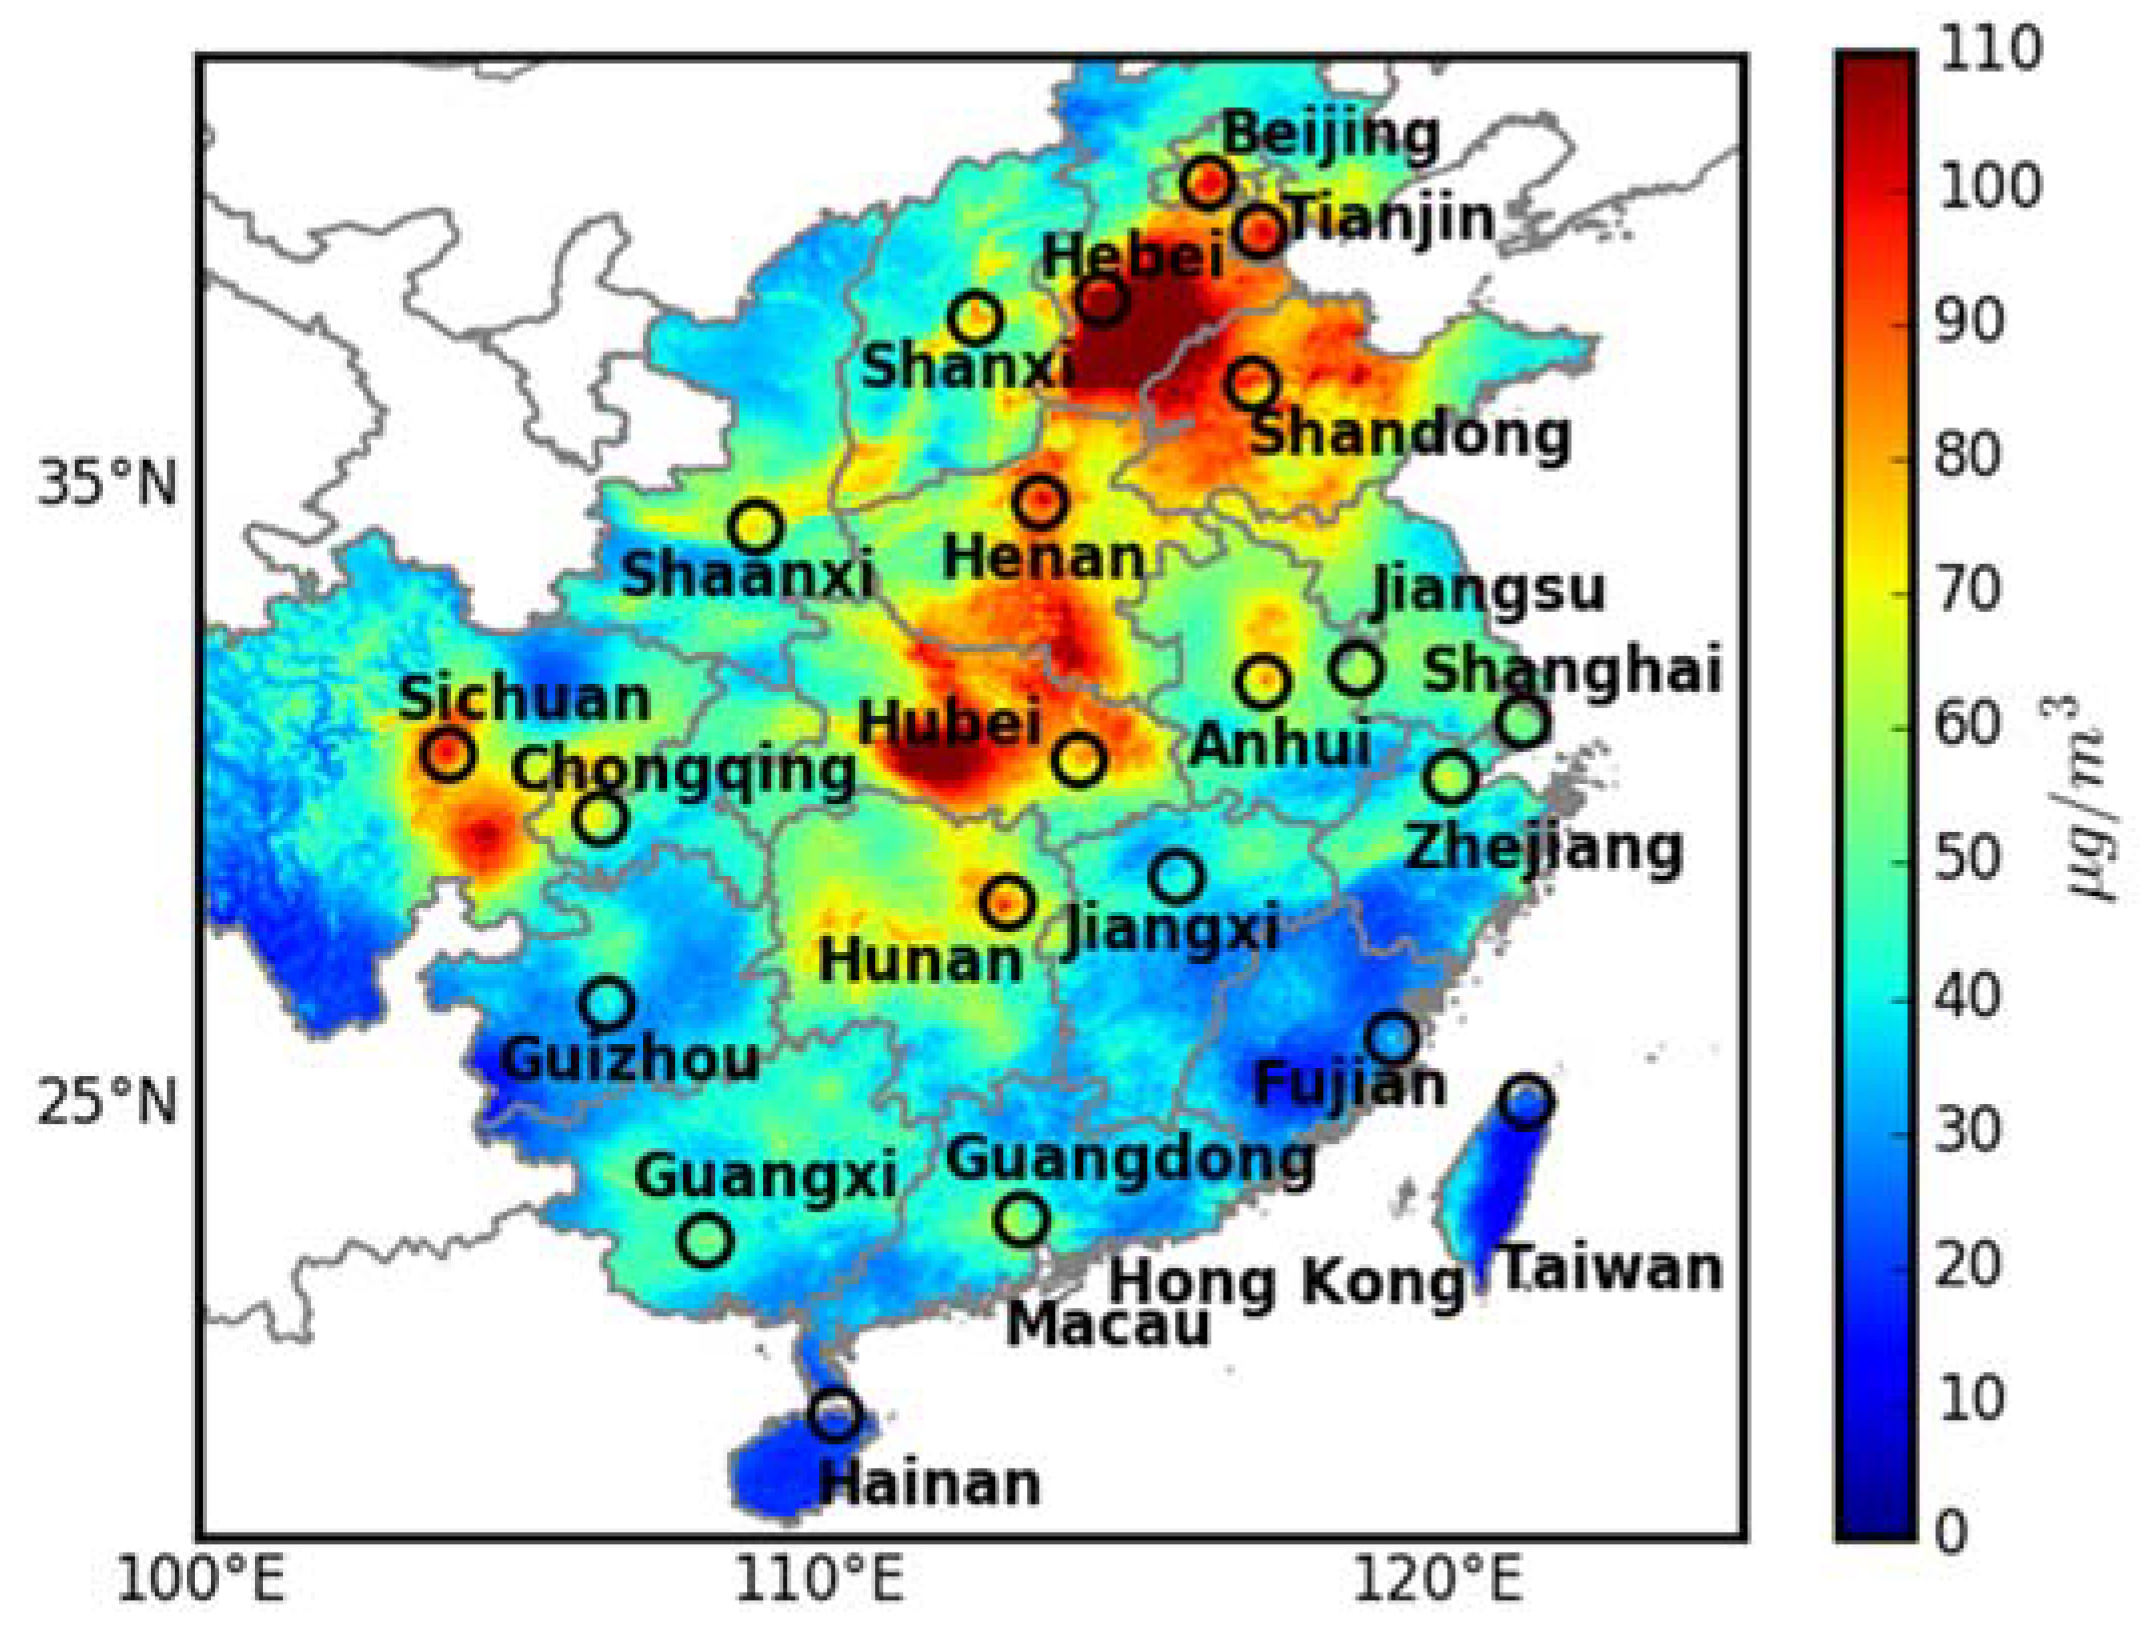
The study region, shown in Figure 1, covered a major part of the Greater China region. It contained 17 provinces (Hebei, Henan, Shandong, Shanxi, Shaanxi, Jiangsu, Zhejiang, Anhui, Hubei, Hunan, Jiangxi, Fujian, Guangdong, Guangxi, Sichuan, Guizhou, and Hainan) and four municipalities (Beijing, Tianjin, Shanghai, and Chongqing) in eastern China; two special administrative regions (Hong Kong and Macau); and Taiwan. We considered all 24 administrative regions as “provinces in eastern China” in this study.
2.2. Satellite-Derived PM2.5
Lin et al. [14] built a long-term PM2.5 dataset at a spatial resolution of 0.01° × 0.01° in the study region from 2001 to 2015 (http://envf.ust.hk/dataview/aod2pm/current). We took advantage of this satellite dataset to characterize the long-term variation of PM2.5 concentration in eastern China. Two steps were required to construct this satellite PM2.5 dataset. First, spectral data from the two Moderate Resolution Imaging Spectroradiometer (MODIS) instruments aboard the Terra and Aqua satellites were used to build aerosol optical depth (AOD) data at a resolution of 0.01° × 0.01° in eastern China [26]. Second, an observational data-driven algorithm, which took the ground-observed visibility and relative humidity data as inputs, was developed to derive the ground-level PM2.5 concentration from the AOD [14,27]. To validate the long-term satellite-derived PM2.5 concentration, we applied a method used in similar studies [28,29]. We obtained the available ground observations of PM2.5 concentration from multiple sources (e.g., national and regional ground monitoring networks, observations by the U.S. consulate, and a series of published papers) in the study region from 2001 to 2015. Evaluation of the satellite-derived PM2.5 concentration against the ground observations obtained a correlation coefficient of >0.9 and a mean absolute percentage error within ±20% [14]. In addition, the satellite-derived PM2.5 concentrations experienced consistent long-term variations with the ground observations in multiple metropolises (e.g., Beijing, Shanghai, Guangzhou, Hong Kong, and Taipei). Figure 1 plots the spatial distribution of the 15-year mean of PM2.5 concentration at a resolution of 0.01° × 0.01° in the study region. The 15-year mean PM2.5 concentrations in northern China were much higher than those in southern China, even exceeding 100 μg/m3.
2.3. Urban and Rural Areas
It is extremely difficult, if not impossible, to find a truly objective criterion to classify a geographical area as urban or rural. All classification methods require a choice of threshold, which is subjective to a certain extent. Thresholds of population size or population density, either as the sole criterion or in conjunction with others, have been used to identify urban areas in many countries. An elaborate approach has been proposed by the Organization for Economic Co-operation and Development (OECD). The OECD approach uses population size cutoffs (50,000 or 100,000 people depending on the country) and population density cutoffs (1000 or 1500 people/km2 depending on the country) to define urban cores [30]. The government of China has modified the standards for rural/urban classification many times. In 1999, the National Bureau of Statistics of China issued the “Stipulations on Statistical Classification for Rural and Urban Areas (Trial)” to classify urban and rural areas. This approach used a population density threshold of 1500 people/km2 together with other criteria (http://www.stats.gov.cn/tjsj/pcsj/rkpc/5rp/html/append7.htm). The ongoing stipulations for rural–urban classification in China were issued in 2008. The new approach was mainly based on criteria for functional urban areas, and was conceptually close to the method proposed by the OECD [30].
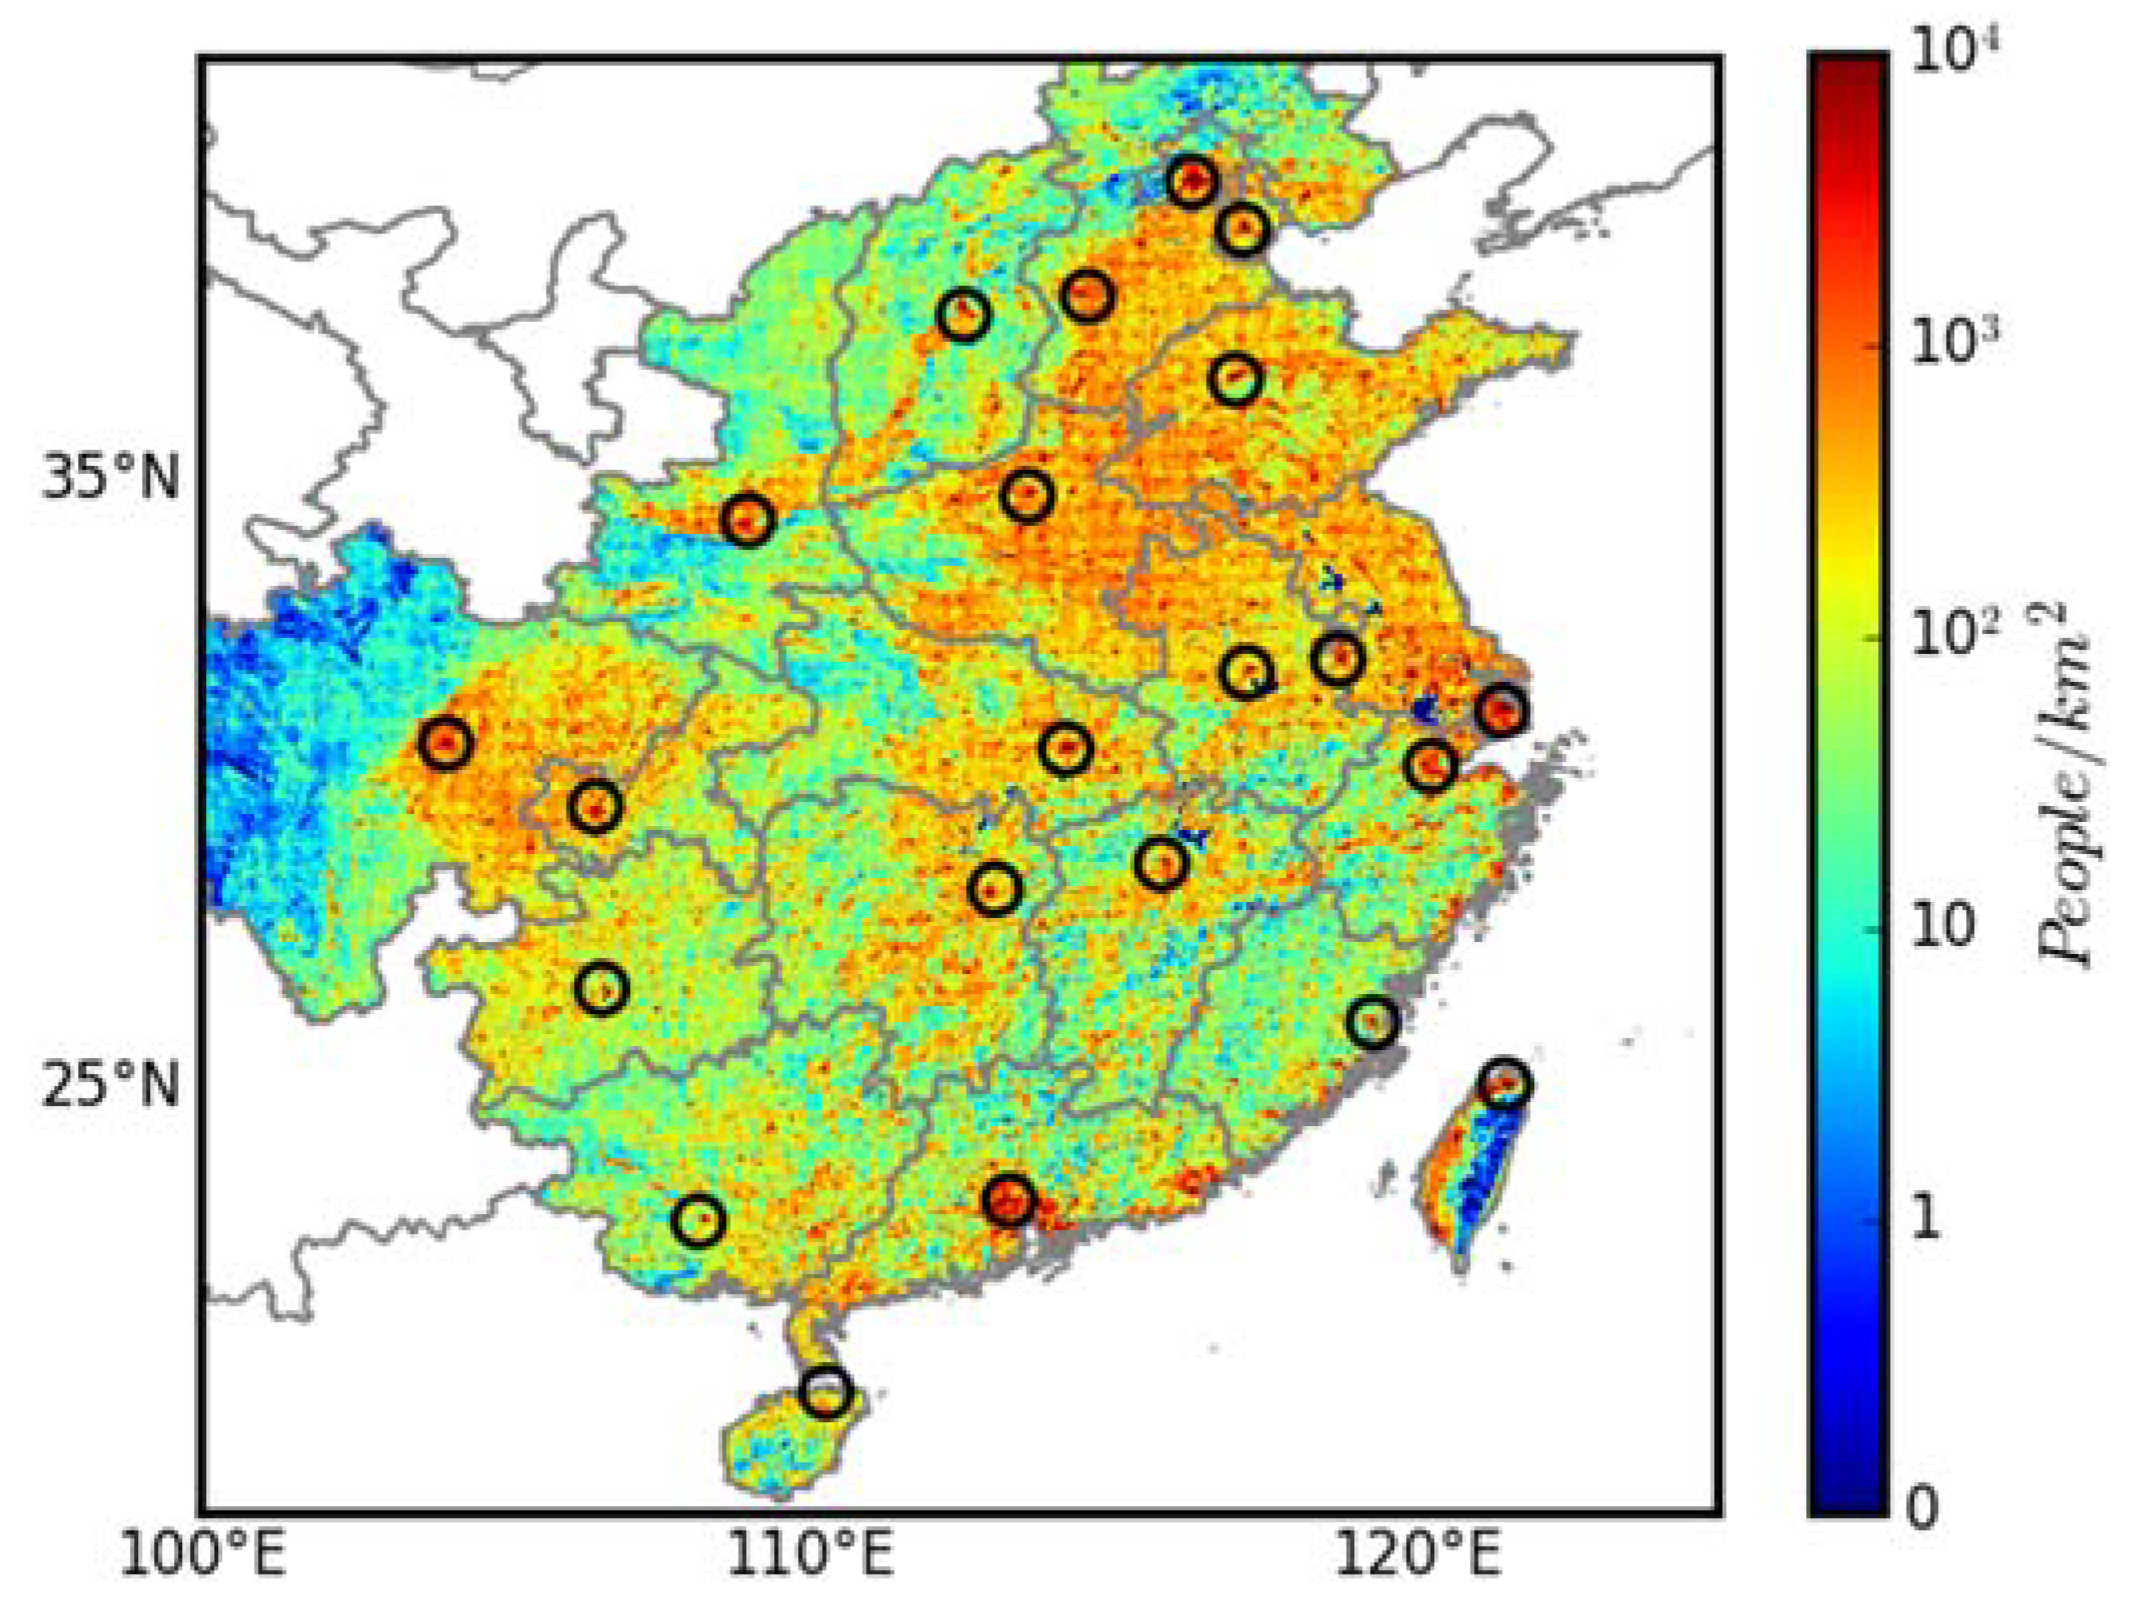
The use of a threshold based on population density has the obvious benefit of simplicity and performs well for many applications [30]. Following the OECD approach, we used the population density threshold of 1500 people/km2 for the classification of urban and rural areas in this study. The national census provides systematic population data by administrative region. However, the spatial matching of the census data and the gridded pollution data is difficult. Using gridded population data derived from a spatialization of the census data is an effective method to solve this issue. These gridded population data play an important role in social, economic, and environmental studies [31]. We acquired the gridded population density data at a spatial resolution of 1 km over the study region in 2008 from the LandScan population database, which was developed by the Oak Ridge National Laboratory (http://web.ornl.gov/sci/landscan/). The algorithm for the construction of the LandScan population data uses spatial data and imagery analyses to disaggregate census counts within administrative boundaries. The year 2008 was chosen as a representative year because it was in the middle of the study period and the population data for this year can be considered to represent the averaged population distribution during the study period. Figure 2 plots the spatial distribution of population density in the study region in 2008 at a resolution of 0.01° × 0.01°. Overall, the north China plain had higher population densities compared to southern China. The population densities in several capital cities of these northern provinces exceeded 104 people/km2.
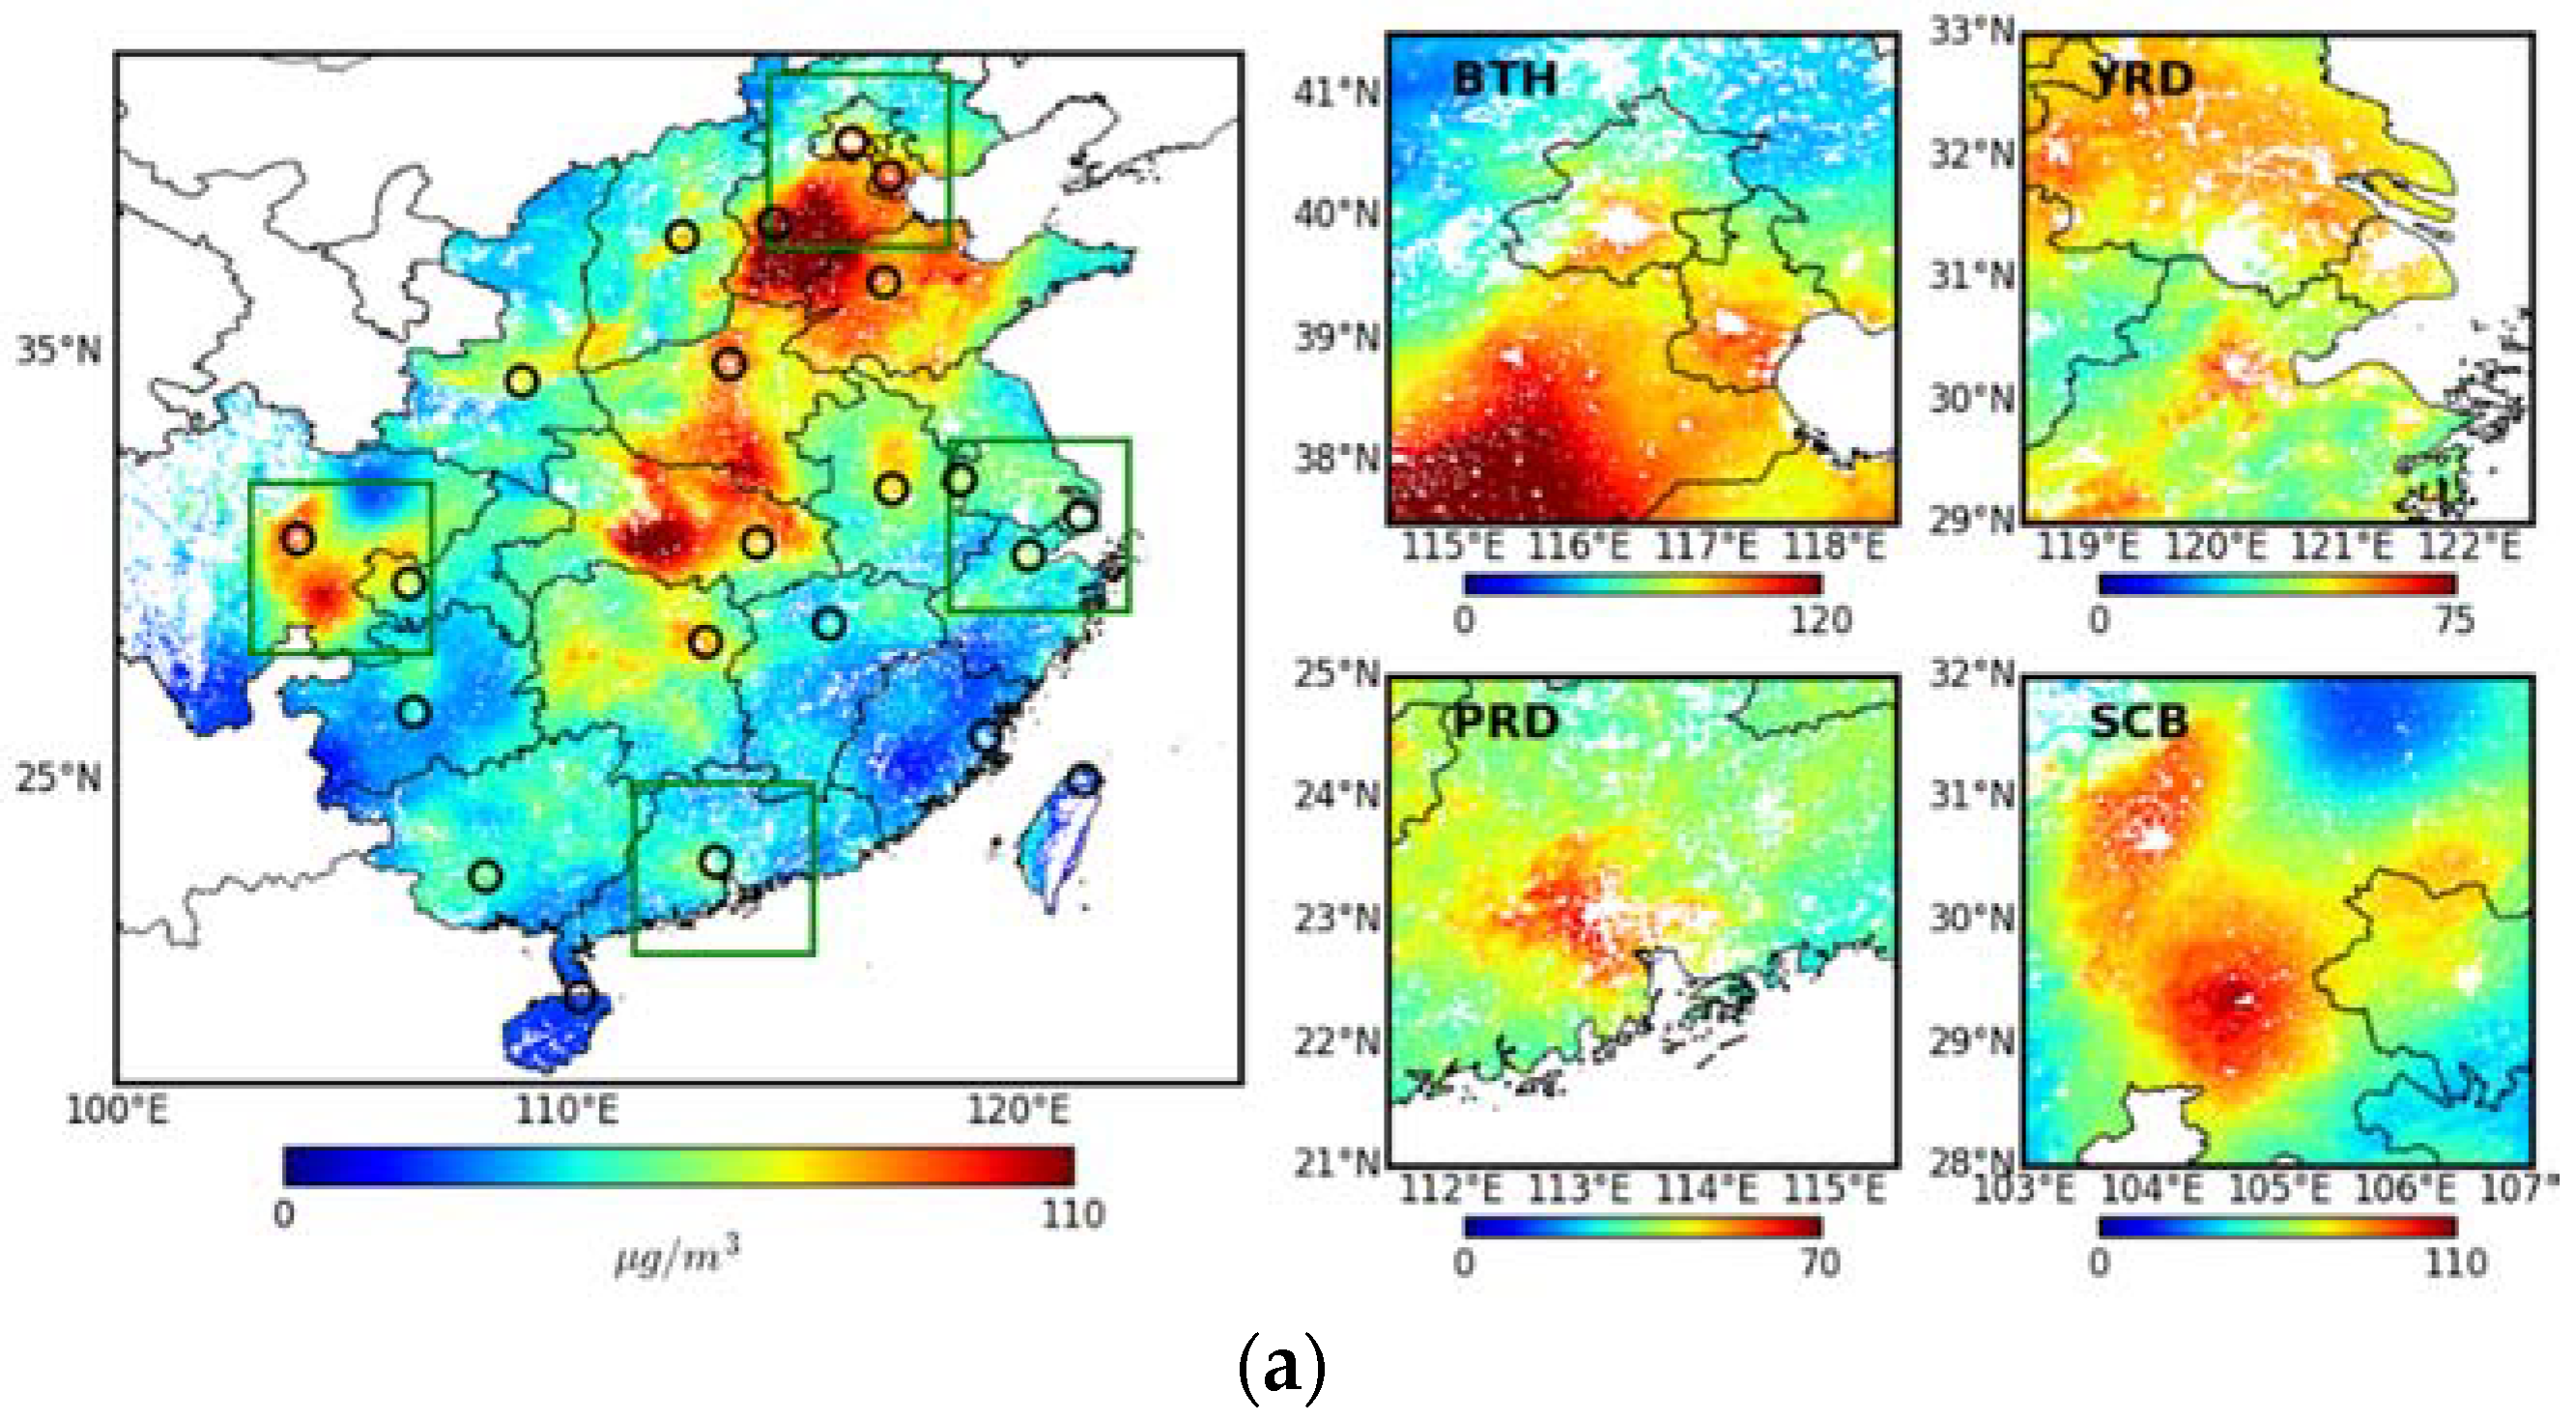
Areas such as remote mountains are not ideal residential locations and thus have low population densities. In this study, our assessments focused only on areas with population densities of >10 people/km2. Therefore, areas with population densities of <10 people/km2 (e.g., those in the eastern part of Taiwan and the western part of Sichuan) were not taken into account in our assessments. An area was classified as urban if its population density was ≥1500 people/km2 and rural if its population density was ≥10 people/km2 and <1500 people/km2. Figure 3 plots the spatial distributions of the 15-year means of PM2.5 concentrations in (Figure 3a) rural and (Figure 3b) urban areas in the study region and four major city clusters. The Beijing-Tianjin-Hebei (BTH) region contains Beijing, Tianjin, and Hebei; the Yangtze River Delta (YRD) region contains Jiangsu, Zhejiang, and Shanghai; the Pearl River Delta (PRD) region contains Guangdong, Hong Kong, and Macau; and the Sichuan Basin (SCB) region contains Sichuan and Chongqing. The urban and rural areas accounted for 5.1% (147,260 pixels) and 75.4% (2,192,736 pixels) of the study region, respectively. The remainder was identified as non-residential and was not taken into account in this study. The population density threshold explicitly distinguishes urban areas from rural areas.
3. Results
3.1. PM2.5 in Urban and Rural Areas
The blue and green bars in Figure 4 represent the 15-year averages of PM2.5 concentrations in rural (cr) and urban (cu) areas over the entire study region and in different provinces. The red bars show the differences between cr and cu. The 15-year averages of cr and cu for the entire study region were estimated to be about 52.7 μg/m3 and 61.0 μg/m3, respectively. The mean PM2.5 concentrations in both rural and urban areas for the study region were much higher than the WHO IT-1 (35 μg/m3).
Tianjin had the highest level of cr (80.2 μg/m3). The highest levels of cu were found in provinces in the BTH region: Beijing (cu = 87.0 μg/m3), Tianjin (cu = 87.3 μg/m3), and Hebei (cu = 93.1 μg/m3). PM2.5 concentrations in urban areas were higher than in rural areas in all provinces. The difference between cr and cu was >15 μg/m3 in Beijing (cu − cr = 18.1 μg/m3), Hebei (cu − cr = 19.4 μg/m3), and Sichuan (cu − cr = 15.3 μg/m3). The higher PM2.5 concentrations in urban areas are due to more human activities, greater energy consumption, and higher emissions of air pollutants [32,33]. The mean PM2.5 concentrations in both rural and urban areas exceeded the WHO IT-1 (35 μg/m3) and IT-2 (25 μg/m3) in most provinces and exceeded the WHO IT-3 (15 μg/m3) and air quality guideline (AQG, 10 μg/m3) in all provinces.
3.2. PM2.5 Trends in Urban and Rural Areas
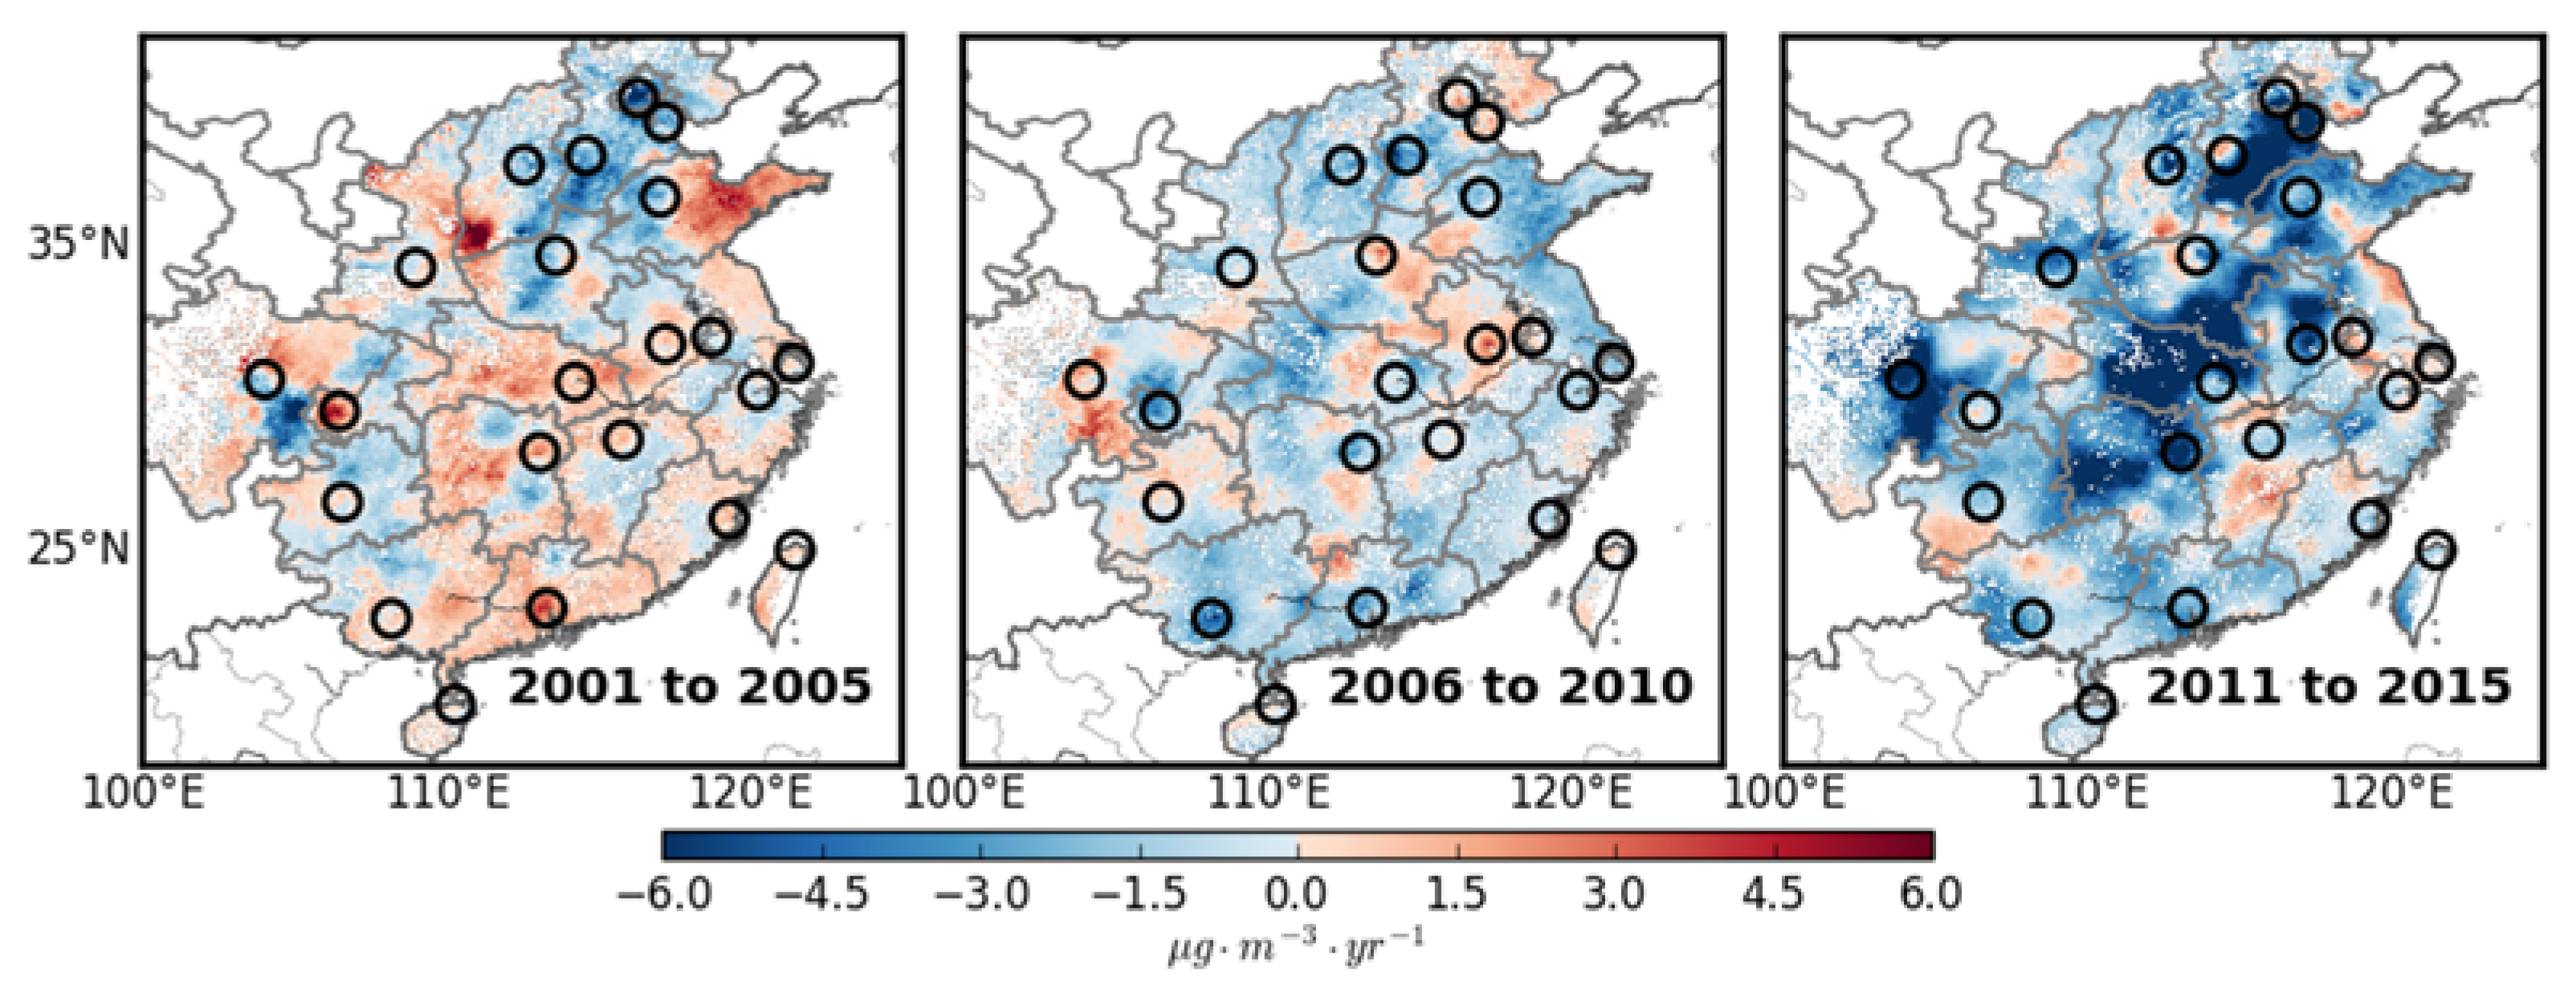
Figure 5 shows the spatial distributions of PM2.5 trends in the residential areas of the study region during the 10th (2001–2005), 11th (2006–2010), and 12th (2011–2015) FYP periods. PM2.5 concentrations declined substantially in northern China but increased extensively in southern China during the 10th FYP period. During the 11th FYP period, PM2.5 concentrations declined extensively in the study region. During the 12th FYP period, PM2.5 concentrations reduced substantially in the study region particularly in the BTH region and central China (e.g., Hubei and Hunan). Overall, northern China experienced a greater reduction in PM2.5 concentration than southern China did during the 10th and 12th FYP periods.
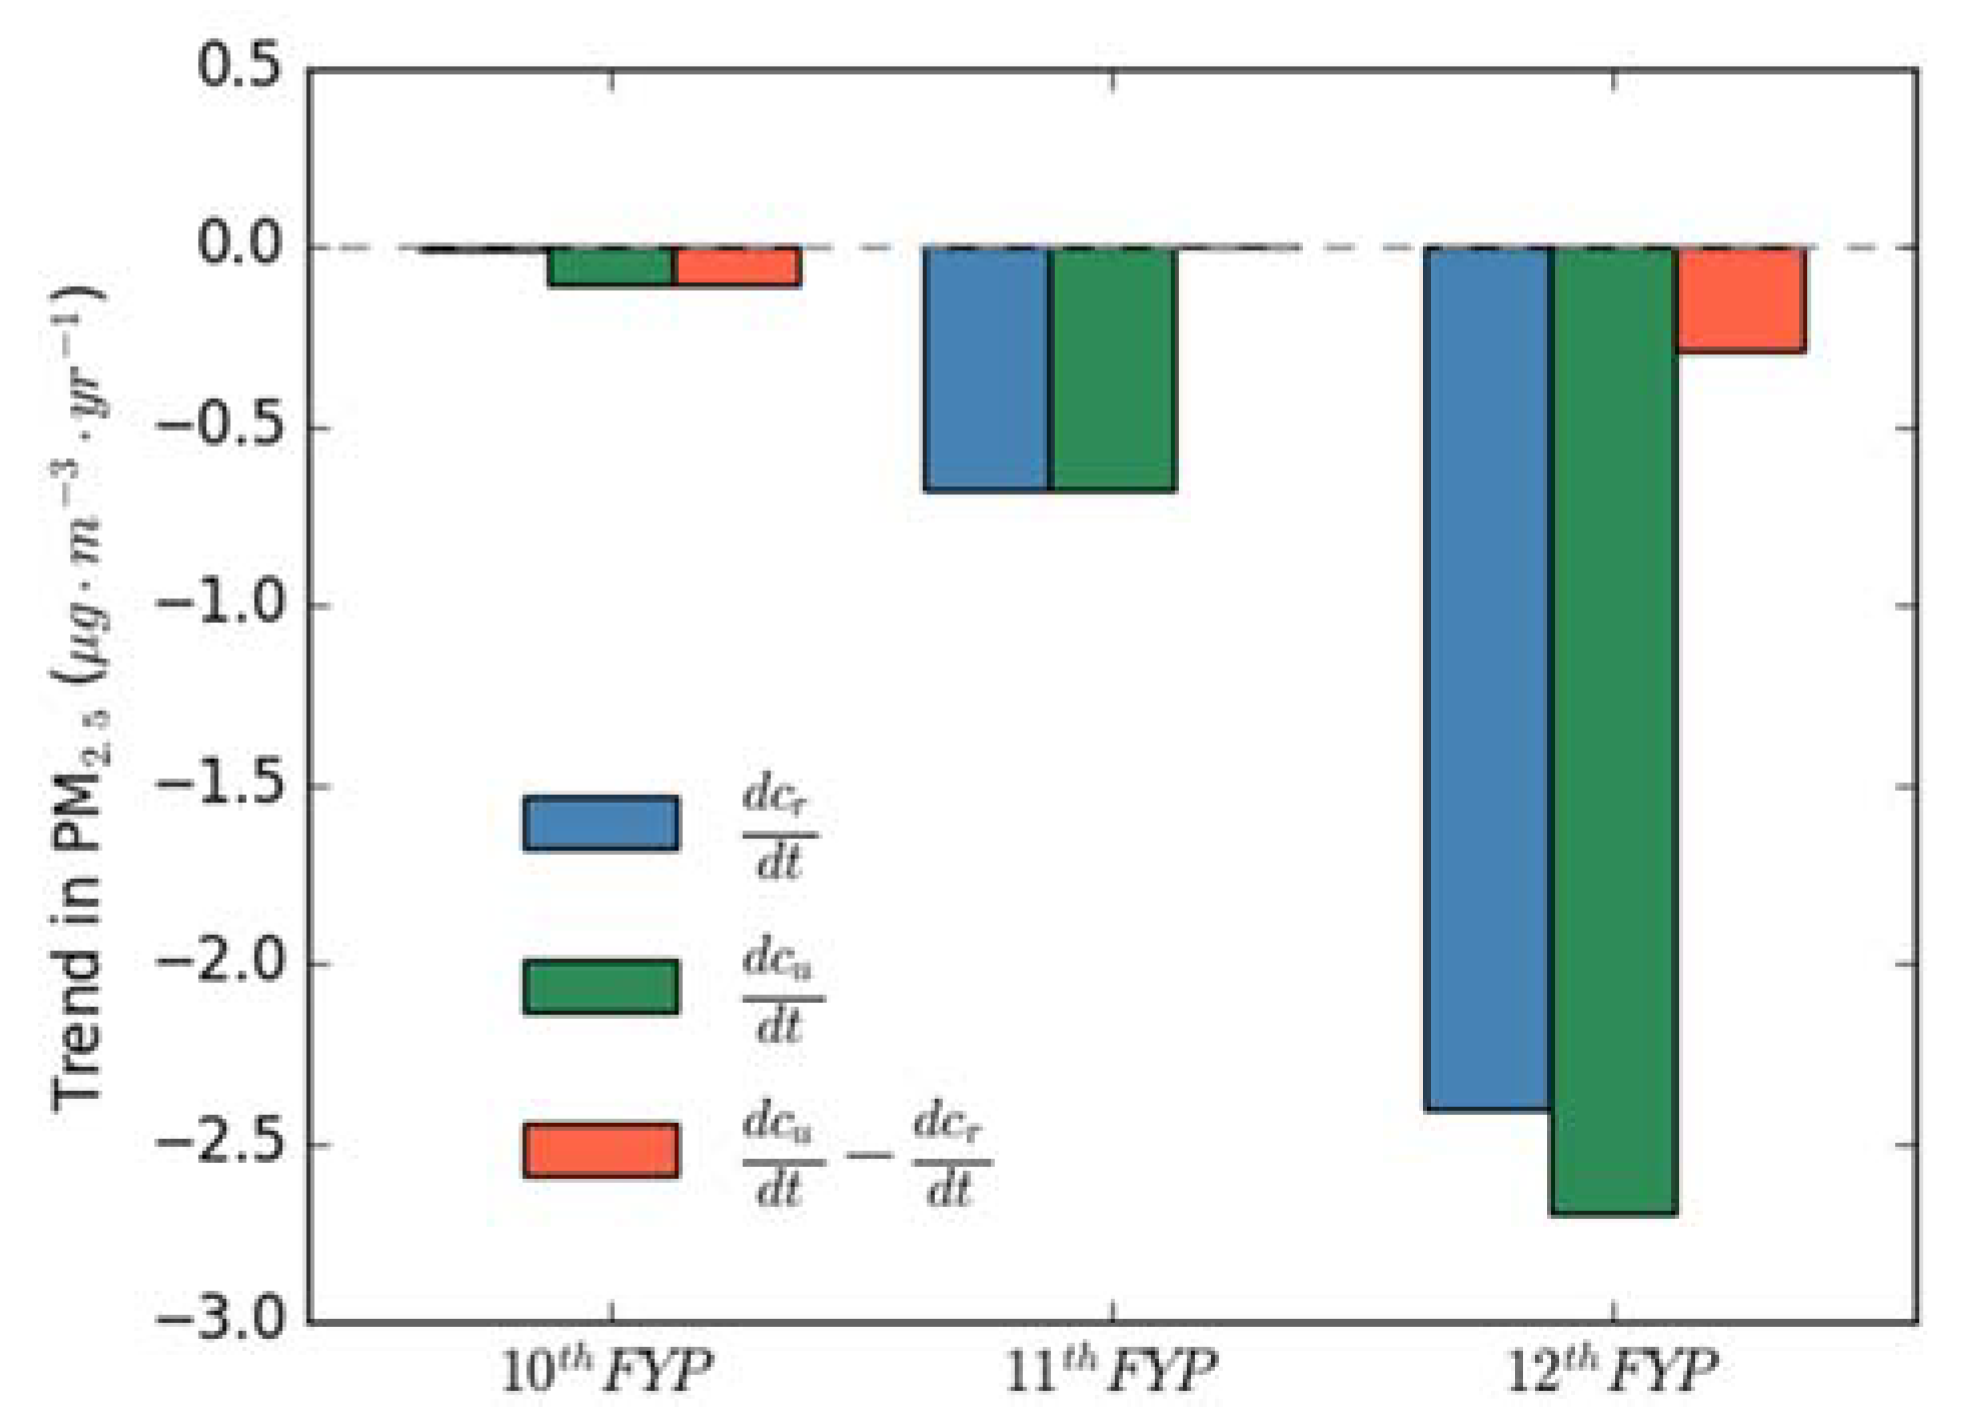
The blue and green bars in Figure 6 represent the averages of the PM2.5 trends in the rural (dcr/dt) and urban (dcu/dt) areas of the entire study region during the three FYP periods. The PM2.5 concentrations in rural areas remained steady during the 10th FYP period and declined by −0.68 μg·m−3·year−1 and −2.41 μg·m−3·year−1 during the 11th and 12th FYP periods, respectively. The PM2.5 concentrations in urban areas declined by −0.11 μg·m−3·year−1, −0.68 μg·m−3·year−1, and −2.70 μg·m−3·year−1 during the 10th, 11th, and 12th FYP periods, respectively. The red bars show the differences in the averaged PM2.5 trends between rural and urban areas (D = dcu/dt − dcr/dt) during the three FYP periods. Urban areas experienced greater reductions in PM2.5 than rural areas during the 10th and 12th FYP periods. During the 11th FYP period, the averaged PM2.5 reduction rates in the rural and urban areas of the entire study region were similar.
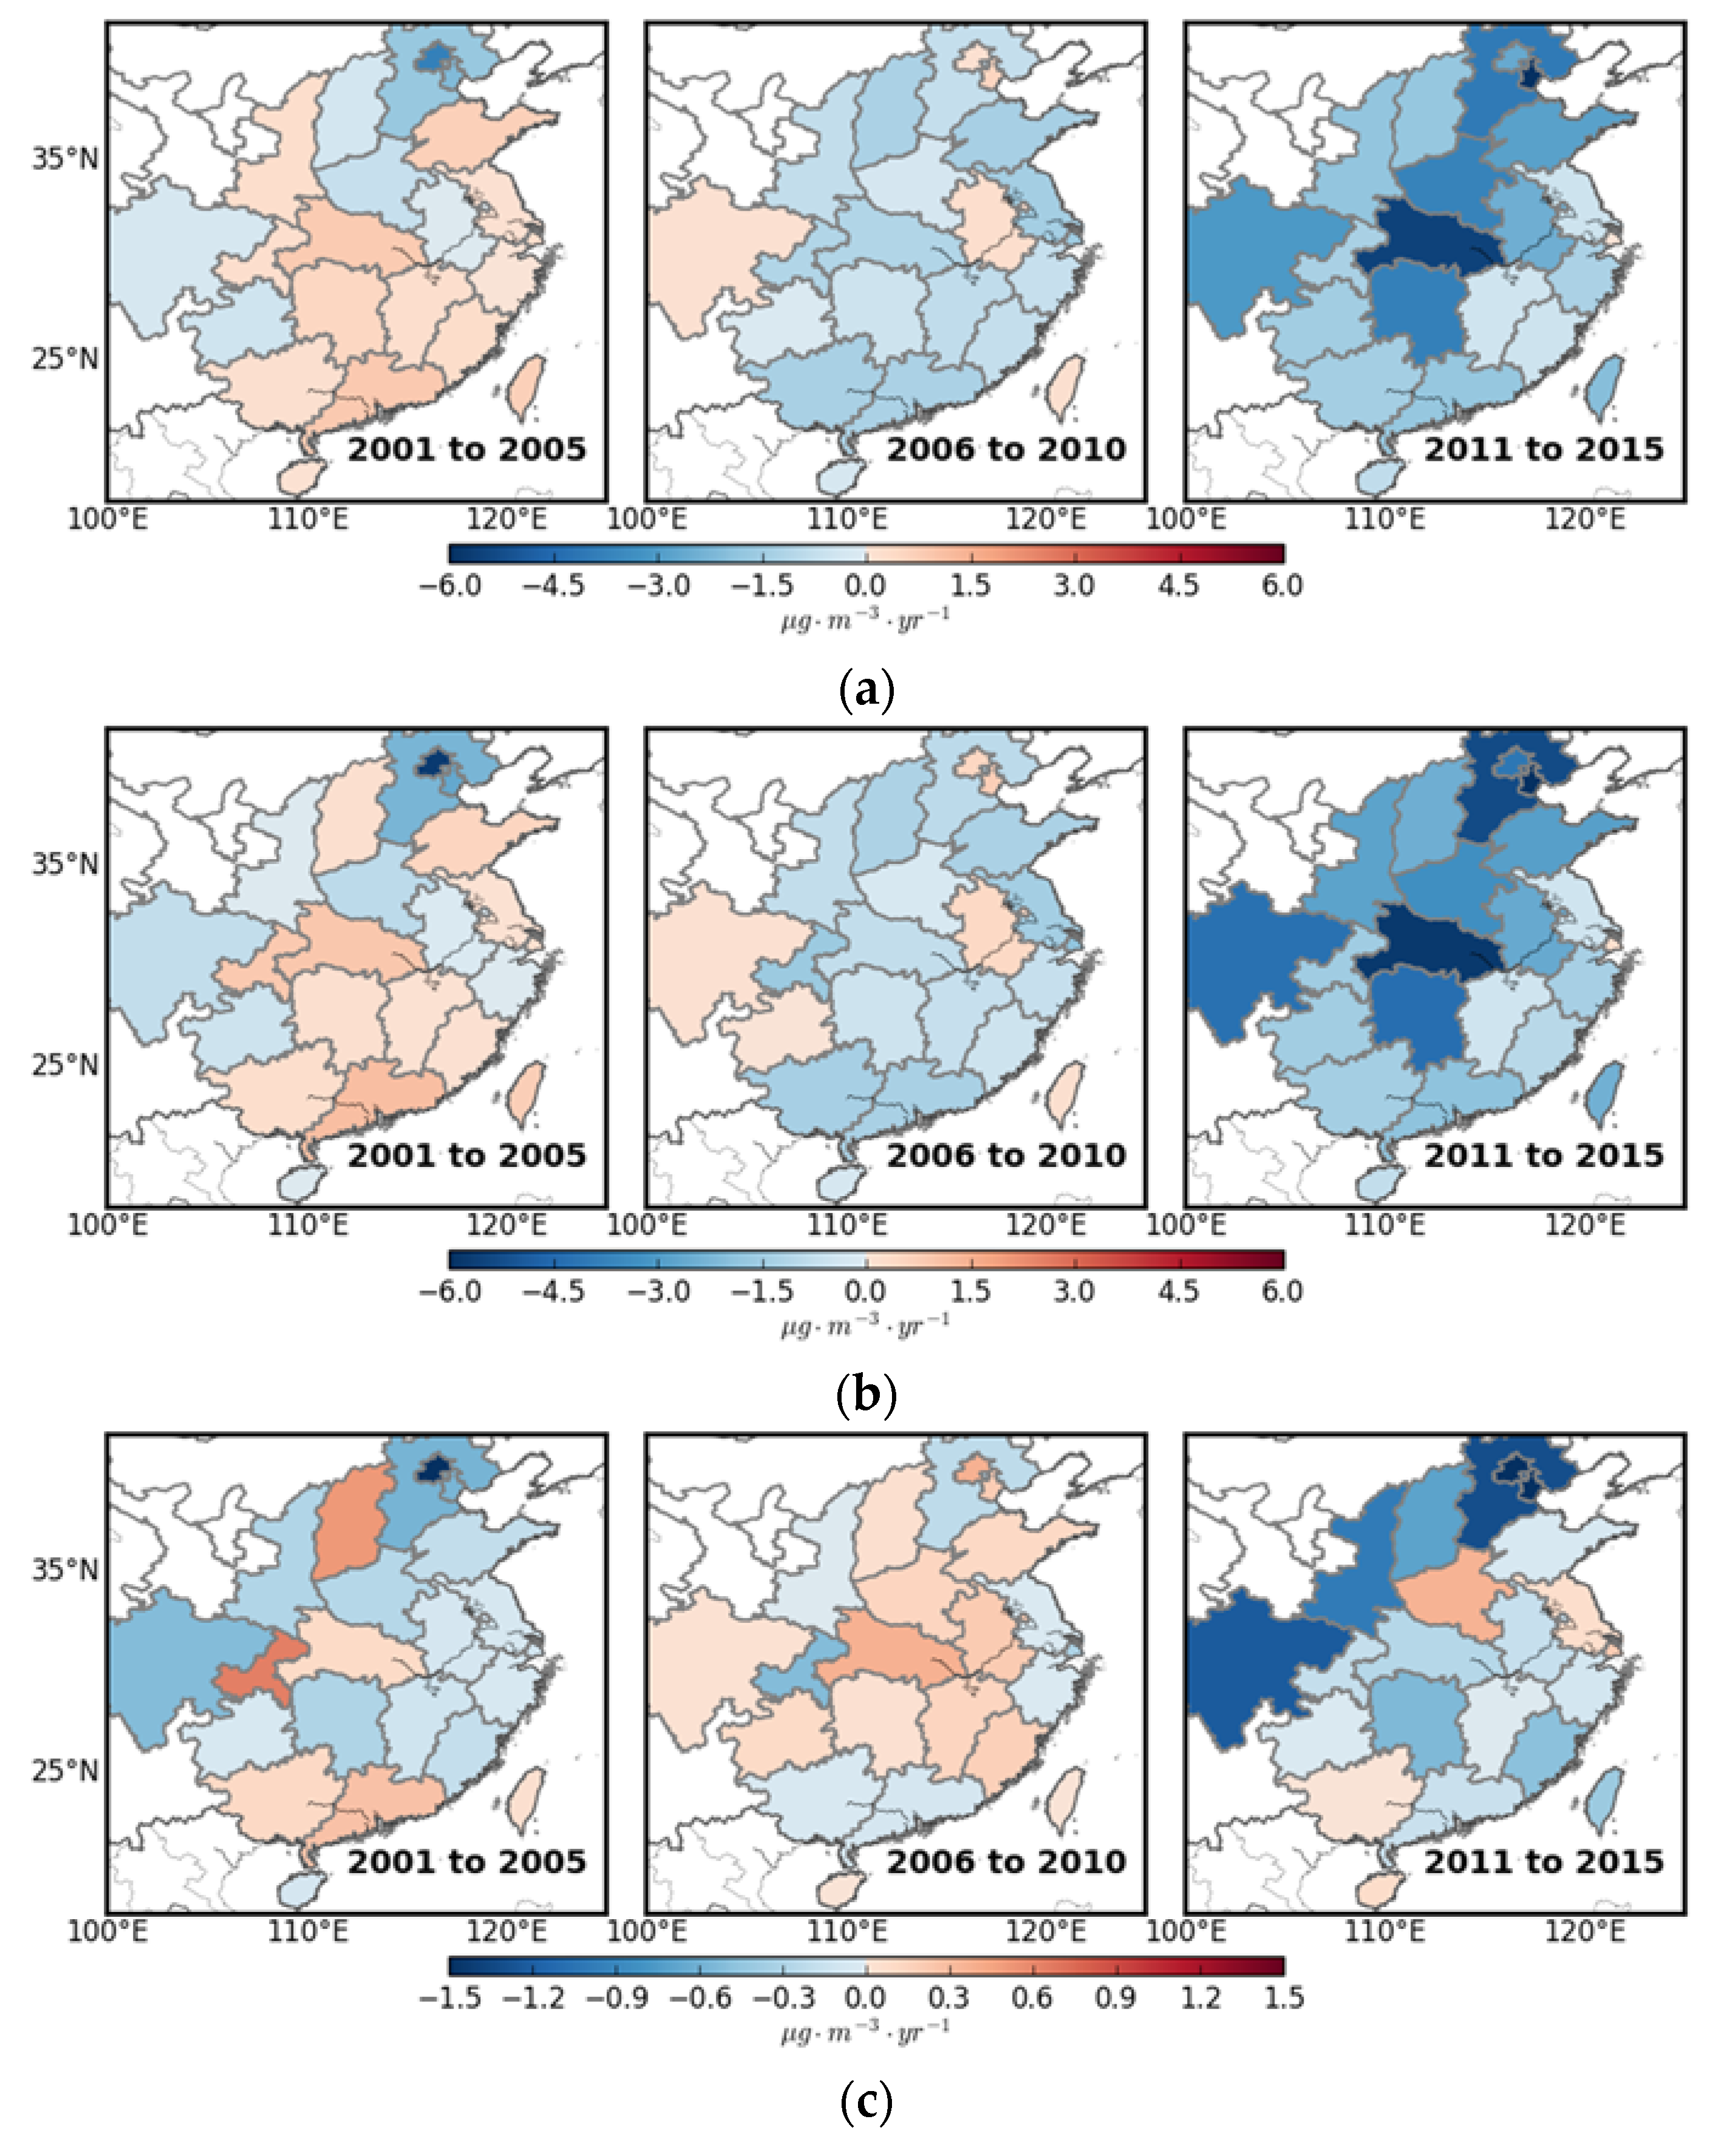
Figure 7a,b shows the averaged PM2.5 trends in rural and urban areas in different provinces during the three FYP periods. Figure 7c shows the differences in the averaged PM2.5 trends between rural and urban areas in different provinces during the three FYP periods. Despite a similar trend, substantial differences remained between PM2.5 trends in rural and urban areas. During the 10th FYP period, urban areas experienced more reductions in PM2.5 than rural areas in most provinces (17 out of 24). PM2.5 reductions in urban areas were more substantial than in rural areas in Beijing (by as much as 1.9 μg·m−3·year−1). During the 11th FYP period, PM2.5 in urban areas showed less of a reduction than in rural areas in more than half of the provinces (15 out of 24). During the 12th FYP period, PM2.5 in urban areas had more reductions than in rural areas in most provinces (19 out of 24). The rates of decline in PM2.5 concentration in urban areas were more substantial than in rural areas by as much as 1.5 μg·m−3·year−1 in Beijing and 2.0 μg·m−3·year−1 in Tianjin. In contrast, PM2.5 reductions in urban areas were less substantial than in rural areas by as much as 0.36 μg·m−3·year−1 in a few provinces such as Henan.
4. Discussion
Beyond the change in mean PM2.5 concentration, spatial differences in PM2.5 change also play an important role in reducing the population’s exposure to PM2.5. During the most recent FYP period, the spatial difference in PM2.5 change helped to reduce exposure to PM2.5 in most provinces. In contrast, the spatial difference in PM2.5 change remained unfavorable in a few provinces, such as Henan. We suggest that control efforts further target densely populated urban areas in these provinces.
Control strategies targeted at urban areas should be more cost effective than trying to reduce PM2.5 concentrations everywhere. The reduction of mean PM2.5 concentration will become more difficult when the mean PM2.5 concentration has dropped to a lower level. By that time, the targeted efforts will be more important in PM2.5 exposure management. The PM2.5 concentration in urban areas can be reduced through the control of anthropogenic emissions such as those from traffic and industrial sources and domestic fuel consumption. Beyond the control of emissions, we can also consider city planning measures such as moving pollution sources (e.g., industrial sources) away from densely populated urban areas and improving ventilation in street canyons surrounded by high-rise buildings.
The evaluation of satellite-derived PM2.5 concentrations against ground observations showed a mean percentage error within ±20%. This deviation is likely to result from the uncertainties of the satellite-based AOD and ground meteorological data (e.g., visibility and relative humidity) and from the assumption of steady aerosol characteristics (e.g., aerosol extinction efficiency). In addition, the satellites provide observations only during the daytime. This temporal limitation also contributed to the deviation of the satellite-derived PM2.5 concentration.
With the use of high-resolution data, further research can be conducted to make assessments at city or even district scales over China. Population exposure to PM2.5 is also affected by demographic change. Population exposure to PM2.5 declines if city planning moves people away from heavily polluted areas. However, because of the rapid urbanization in China during the past decade, many people have moved into polluted urban areas. This rural-to-urban migration tends to increase population exposure to PM2.5 in China. Further study could delineate these types of effect on population exposure to PM2.5.
5. Conclusions
This study assessed the difference in PM2.5 variations between urban and rural areas over eastern China during the past three FYP periods (2001–2015). The results of our analyses provide crucial information about pollution exposure over China. In addition, this long-term assessment is of great value in the formulation of future environmental policies and city planning. To better protect public health, it is suggested that control efforts further target densely populated urban areas and that city planning moves some pollution sources away from urban areas.
Author Contributions
Formal analysis, C.L.; Supervision, A.K.H.L.; Writing—original draft, C.L.; and Writing—review and editing, Y.L., J.C.H.F., C.L., X.L. and Z.L.
Funding
This work was supported by the National Natural Science Foundation of China (Grant No. 41575106) the Science and Technology Plan Project of Guangdong Province of China (Grant No. 2015A020215020), NSFC/RGC Grant N_HKUST631/05, and the Fok Ying Tung Graduate School (NRC06/07.SC01).
Acknowledgments
We thank the Ministry of Environmental Protection of China, the Hong Kong Environmental Protection Department, and US National Aeronautics and Space Administration (NASA) Data Center for provision of air-quality monitoring and satellite data.
Conflicts of Interest
The authors declare no conflict of interest. The funders had no role in the design of the study; in the collection, analyses, or interpretation of data; in the writing of the manuscript; or in the decision to publish the results.
References
- Dockery, D.W.; Pope, C.A.; Xu, X.; Spengler, J.D.; Ware, J.H.; Fay, M.E.; Ferris, B.G., Jr.; Speizer, F.E. An association between air pollution and mortality in six US cities. N. Engl. J. Med. 1993, 329, 1753–1759. [Google Scholar] [CrossRef] [PubMed]
- Guo, C.; Zhang, Z.; Lau, A.K.H.; Lin, C.Q.; Chuang, Y.C.; Chan, J.; Jiang, W.K.; Tam, T.; Yeoh, E.-K.; Chan, T.-C.; et al. Effect of long-term exposure to fine particulate matter on lung function decline and risk of chronic obstructive pulmonary disease in Taiwan: A longitudinal, cohort study. Lancet Planet. Health 2018, 2, e114–e125. [Google Scholar] [CrossRef]
- Lu, X.; Yao, T.; Fung, J.C.H.; Lin, C. Estimation of health and economic costs of air pollution over the Pearl River Delta region in China. Sci. Total Environ. 2016, 566–567, 134–143. [Google Scholar] [CrossRef] [PubMed]
- Lu, X.; Lin, C.; Li, Y.; Yao, T.; Fung, J.C.H.; Lau, A.K.H. Assessment of health burden caused by particulate matter in southern China using high-resolution satellite observation. Environ. Int. 2017, 98, 160–170. [Google Scholar] [CrossRef] [PubMed]
- Pope, C.A.; Burnett, R.T.; Thun, M.J.; Calle, E.E.; Krewski, D.; Ito, K.; Thurston, G.D. Lung cancer, cardiopulmonary mortality, and long-term exposure to fine particulate air pollution. JAMA 2002, 287, 1132–1141. [Google Scholar] [CrossRef] [PubMed]
- Zhang, Z.; Chang, L.-Y.; Lau, A.K.H.; Chan, T.-C.; Chieh Chuang, Y.; Chan, J.; Lin, C.; Kai Jiang, W.; Dear, K.; Zee, B.C.Y.; et al. Satellite-based estimates of long-term exposure to fine particulate matter are associated with C-reactive protein in 30,034 Taiwanese adults. Int. J. Epidemiol. 2017, 46, 1126–1136. [Google Scholar] [CrossRef] [PubMed]
- Zhang, Z.; Guo, C.; Lau, A.K.H.; Chan, T.-C.; Chuang, Y.C.; Lin, C.Q.; Jiang, W.K.; Yeoh, E.; Tam, T.; Woo, K.S.; et al. Long-term Exposure to Fine Particulate Matter, Blood Pressure, and Incident Hypertension in Taiwanese Adults. Environ. Health Perspect. 2018, 126, 017008. [Google Scholar] [CrossRef] [PubMed]
- Apte, J.S.; Marshall, J.D.; Cohen, A.J.; Brauer, M. Addressing Global Mortality from Ambient PM2.5. Environ. Sci. Technol. 2015, 49, 8057–8066. [Google Scholar] [CrossRef] [PubMed]
- Rohde, R.A.; Muller, R.A. Air Pollution in China: Mapping of Concentrations and Sources. PLoS ONE 2015, 10, e0135749. [Google Scholar] [CrossRef] [PubMed]
- Ma, Z.; Hu, X.; Huang, L.; Bi, J.; Liu, Y. Estimating Ground-Level PM2.5 in China Using Satellite Remote Sensing. Environ. Sci. Technol. 2014, 48, 7436–7444. [Google Scholar] [CrossRef] [PubMed]
- Lei, Y.; Zhang, Q.; He, K.B.; Streets, D.G. Primary anthropogenic aerosol emission trends for China, 1990–2005. Atmos. Chem. Phys. 2011, 11, 931–954. [Google Scholar] [CrossRef] [Green Version]
- Lu, Z.; Zhang, Q.; Streets, D.G. Sulfur dioxide and primary carbonaceous aerosol emissions in China and India, 1996–2010. Atmos. Chem. Phys. 2011, 11, 9839–9864. [Google Scholar] [CrossRef] [Green Version]
- Zhao, Y.; Zhang, J.; Nielsen, C.P. The effects of recent control policies on trends in emissions of anthropogenic atmospheric pollutants and CO2 in China. Atmos. Chem. Phys. 2013, 13, 487–508. [Google Scholar] [CrossRef]
- Lin, C.Q.; Liu, G.; Lau, A.K.H.; Li, Y.; Li, C.C.; Fung, J.C.H.; Lao, X.Q. High-resolution satellite remote sensing of provincial PM2.5 trends in China from 2001 to 2015. Atmos. Environ. 2018, 180, 110–116. [Google Scholar] [CrossRef]
- Lin, C.Q.; Li, Y.; Lau, A.K.H.; Deng, X.J.; Tse, K.T.; Fung, J.C.H.; Li, C.C.; Li, Z.Y.; Lu, X.C.; Zhang, X.G.; et al. Estimation of long-term population exposure to PM2.5 for dense urban areas using 1-km MODIS data. Remote Sens. Environ. 2016, 179, 13–22. [Google Scholar] [CrossRef]
- Zhong, L.; Louie, P.K.K.; Zheng, J.; Yuan, Z.; Yue, D.; Ho, J.W.K.; Lau, A.K.H. Science–policy interplay: Air quality management in the Pearl River Delta region and Hong Kong. Atmos. Environ. 2013, 76, 3–10. [Google Scholar] [CrossRef]
- Chen, C.-H.; Liu, W.-L.; Chen, C.-H. Development of a multiple objective planning theory and system for sustainable air quality monitoring networks. Sci. Total Environ. 2006, 354, 1–19. [Google Scholar] [CrossRef] [PubMed]
- Lao, X.Q.; Zhang, Z.; Lau, A.K.; Chan, T.-C.; Chuang, Y.C.; Chan, J.; Lin, C.; Guo, C.; Jiang, W.K.; Tam, T.; et al. Exposure to ambient fine particulate matter and semen quality in Taiwan. Occup. Envrion. Med. 2017. [Google Scholar] [CrossRef] [PubMed]
- Wong, N.S.; Leung, C.C.; Li, Y.; Poon, C.M.; Yao, S.; Wong, E.L.Y.; Lin, C.; Lau, A.K.H.; Lee, S.S. PM2.5 concentration and elderly tuberculosis: Analysis of spatial and temporal associations. Lancet 2017, 390, S68. [Google Scholar] [CrossRef]
- Zhang, Z.; Chan, T.-C.; Guo, C.; Chang, L.; Lin, C.; Chuang, Y.C.; Jiang, W.K.; Ho, K.F.; Tam, T.; Woo, K.S.; et al. Long-term exposure to ambient particulate matter (PM2.5) is associated with platelet counts in adults. Environ. Pollut. 2018, 240, 432–439. [Google Scholar] [CrossRef] [PubMed]
- Zhang, Z.; Hoek, G.; Chang, L.; Chan, T.-C.; Guo, C.; Chuang, Y.C.; Chan, J.; Lin, C.; Jiang, W.K.; Guo, Y.; et al. Particulate matter air pollution, physical activity and systemic inflammation in Taiwanese adults. Int. J. Hyg. Environ. Health 2018, 221, 41–47. [Google Scholar] [CrossRef] [PubMed]
- Li, Y.; Lin, C.; Lau, A.K.H.; Liao, C.; Zhang, Y.; Zeng, W.; Li, C.; Fung, J.C.H.; Tse, T.K.T. Assessing Long-Term Trend of Particulate Matter Pollution in the Pearl River Delta Region Using Satellite Remote Sensing. Environ. Sci. Technol. 2015, 49, 11670–11678. [Google Scholar] [CrossRef] [PubMed]
- Lin, C.Q.; Li, C.C.; Lau, A.K.H.; Yuan, Z.B.; Lu, X.C.; Tse, K.T.; Fung, J.C.H.; Li, Y.; Yao, T.; Su, L.; et al. Assessment of satellite-based aerosol optical depth using continuous lidar observation. Atmos. Environ. 2016, 140, 273–282. [Google Scholar] [CrossRef]
- Lin, C.Q.; Li, Y.; Lau, A.K.H.; Li, C.C.; Fung, J.C.H. 15-Year PM2.5 Trends in the Pearl River Delta Region and Hong Kong from Satellite Observation. Aerosol Air Qual. Res. 2018. [Google Scholar] [CrossRef]
- Han, L.; Zhou, W.; Li, W. Increasing impact of urban fine particles (PM2.5) on areas surrounding Chinese cities. Sci. Rep. 2015, 5, 12467. [Google Scholar] [CrossRef] [PubMed]
- Li, C.; Lau, A.K.H.; Mao, J.; Chu, D.A. Retrieval, validation, and application of the 1-km aerosol optical depth from MODIS measurements over Hong Kong. IEEE Trans. Geosci. Remote Sens. 2005, 43, 2650–2658. [Google Scholar] [CrossRef]
- Lin, C.Q.; Li, Y.; Yuan, Z.B.; Lau, A.K.H.; Li, C.C.; Fung, J.C.H. Using satellite remote sensing data to estimate the high-resolution distribution of ground-level PM2.5. Remote Sens. Environ. 2015, 156, 117–128. [Google Scholar] [CrossRef]
- Ma, Z.; Hu, X.; Sayer, A.M.; Levy, R.; Zhang, Q.; Xue, Y.; Tong, S.; Bi, J.; Huang, L.; Liu, Y. Satellite-Based Spatiotemporal Trends in PM2.5 Concentrations: China, 2004–2013. Environ. Health Perspect. 2016, 124, 184–192. [Google Scholar] [CrossRef] [PubMed]
- Van Donkelaar, A.; Martin, R.V.; Brauer, M.; Boys, B.L. Use of satellite observations for long-term exposure assessment of global concentrations of fine particulate matter. Environ. Health Perspect. 2015, 123, 135–143. [Google Scholar] [CrossRef] [PubMed]
- OECD. OECD Redefining “Urban”: A New Way to Measure Metropolitan Areas; OECD Publishing: Paris, France, 2012. [Google Scholar] [CrossRef]
- Bai, Z.; Wang, J.; Yang, F. Research progress in spatialization of population data. Prog. Geogr. 2013, 32, 1692–1702. [Google Scholar] [CrossRef]
- Chan, C.K.; Yao, X. Air pollution in mega cities in China. Atmos. Environ. 2008, 42, 1–42. [Google Scholar] [CrossRef]
- Han, L.; Zhou, W.; Li, W.; Li, L. Impact of urbanization level on urban air quality: A case of fine particles (PM2.5) in Chinese cities. Environ. Pollut. 2014, 194, 163–170. [Google Scholar] [CrossRef] [PubMed]
Figure 1.
The 24 provinces in the study region. The figure also plots the spatial distribution of the 15-year mean of PM2.5 concentration at a resolution of 0.01° × 0.01° in the study region. The locations of the provinces’ capital cities are marked by circles.
Figure 1.
The 24 provinces in the study region. The figure also plots the spatial distribution of the 15-year mean of PM2.5 concentration at a resolution of 0.01° × 0.01° in the study region. The locations of the provinces’ capital cities are marked by circles.

Figure 2.
Spatial distribution of population density at a resolution of 0.01° × 0.01° in the study region in 2008. The locations of the capital cities of the provinces are marked by circles.
Figure 2.
Spatial distribution of population density at a resolution of 0.01° × 0.01° in the study region in 2008. The locations of the capital cities of the provinces are marked by circles.

Figure 3.
Spatial distributions of the 15-year means of PM2.5 concentrations in (a) rural and (b) urban areas in the study region and four major city clusters (BTH (Beijing-Tianjin-Hebei), YRD (Yangtze River Delta), PRD (Pearl River Delta), and SCB (Sichuan Basin) regions). The locations of the capital cities of the provinces are marked by circles.


Figure 4.
Fifteen-year averages of PM2.5 concentrations in rural (cr, blue bars) and urban (cu, green bars) areas of the entire study region and in different provinces. The red bars show the difference between cr and cu. Provinces are ordered by their cr value. The WHO air-quality standards (IT-1, IT2, IT-3, and AQG (air quality guideline)) for annual PM2.5 are indicated by the dashed lines.
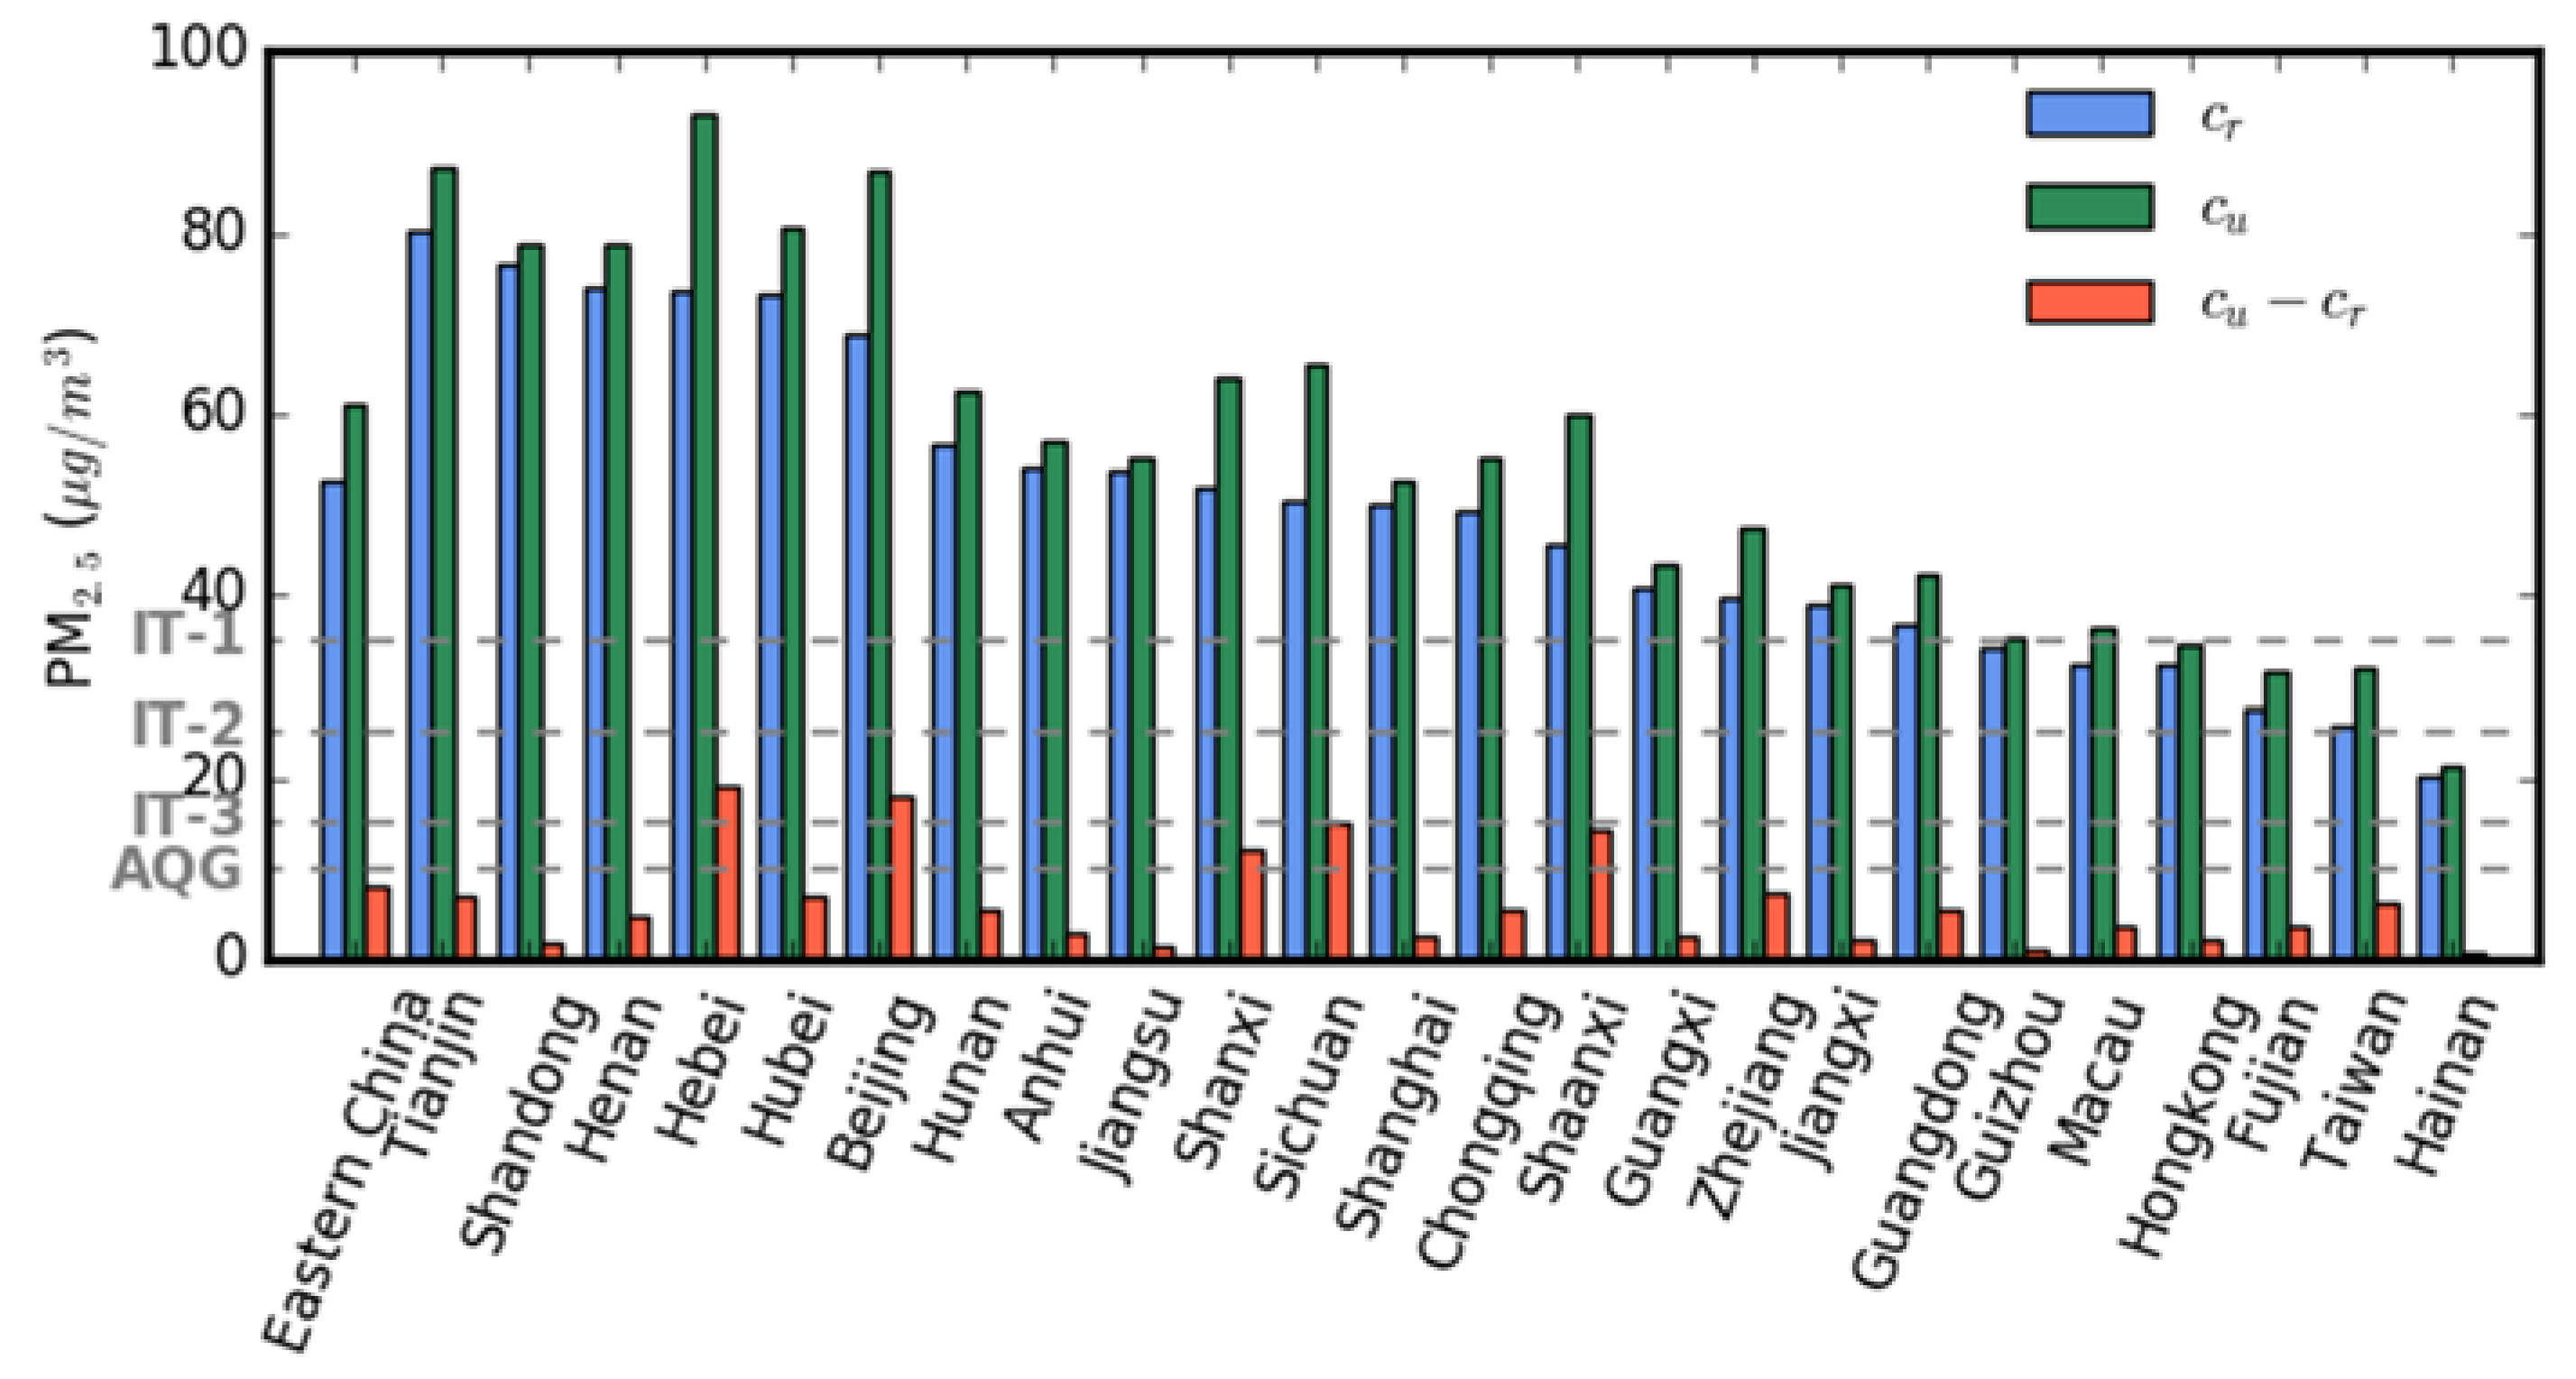
Figure 5.
Spatial distributions of PM2.5 trends in the residential area of the study region during the 10th, 11th, and 12th FYP periods. The locations of the capital cities of the provinces are marked by circles.
Figure 5.
Spatial distributions of PM2.5 trends in the residential area of the study region during the 10th, 11th, and 12th FYP periods. The locations of the capital cities of the provinces are marked by circles.

Figure 6.
Averages of PM2.5 trends in rural (dcr/dt) and urban (dcu/dt) areas (blue and green bars, respectively) across the entire study region during the three FYP periods. The red bars represent the difference in the averaged PM2.5 trends between rural and urban areas (D = dcu/dt − dcr/dt) during the three FYP periods.

Figure 7.
Averaged PM2.5 trends in (a) rural and (b) urban areas in different provinces during the three FYP periods. (c) The differences in the averaged PM2.5 trends between rural and urban areas in different provinces during the three FYP periods.
Figure 7.
Averaged PM2.5 trends in (a) rural and (b) urban areas in different provinces during the three FYP periods. (c) The differences in the averaged PM2.5 trends between rural and urban areas in different provinces during the three FYP periods.

© 2018 by the authors. Licensee MDPI, Basel, Switzerland. This article is an open access article distributed under the terms and conditions of the Creative Commons Attribution (CC BY) license (http://creativecommons.org/licenses/by/4.0/).
Share and Cite
MDPI and ACS Style
Lin, C.; Lau, A.K.H.; Li, Y.; Fung, J.C.H.; Li, C.; Lu, X.; Li, Z. Difference in PM2.5 Variations between Urban and Rural Areas over Eastern China from 2001 to 2015. Atmosphere 2018, 9, 312. https://doi.org/10.3390/atmos9080312
AMA Style
Lin C, Lau AKH, Li Y, Fung JCH, Li C, Lu X, Li Z. Difference in PM2.5 Variations between Urban and Rural Areas over Eastern China from 2001 to 2015. Atmosphere. 2018; 9(8):312. https://doi.org/10.3390/atmos9080312
Chicago/Turabian StyleLin, Changqing, Alexis K. H. Lau, Ying Li, Jimmy C. H. Fung, Chengcai Li, Xingcheng Lu, and Zhiyuan Li. 2018. "Difference in PM2.5 Variations between Urban and Rural Areas over Eastern China from 2001 to 2015" Atmosphere 9, no. 8: 312. https://doi.org/10.3390/atmos9080312
Note that from the first issue of 2016, this journal uses article numbers instead of page numbers. See further details here.