Article

Innovative Trend Analysis of Annual and Seasonal Rainfall Variability in Amhara Regional State, Ethiopia

1
College of Environmental Science & Engineering, Donghua University, Shanghai 200336, China
2
Department of NaRM, University of Gondar, Gondar 196, Ethiopia
3
State Key Laboratory of Simulation and Regulation of Water Cycle in River Basin, China Institute of Water Resource and Hydropower Research, Beijing 100038, China
*
Author to whom correspondence should be addressed.
Atmosphere 2018, 9(9), 326; https://doi.org/10.3390/atmos9090326
Submission received: 14 July 2018 / Revised: 12 August 2018 / Accepted: 14 August 2018 / Published: 21 August 2018
(This article belongs to the Section Meteorology)

Abstract

:
This study investigated the annual and seasonal rainfall variability at five selected stations of Amhara Regional State, by using the innovative trend analysis method (ITAM), Mann-Kendall (MK) and Sen’s slope estimator test. The result showed that the trend of annual rainfall was increasing in Gondar (Z = 1.69), Motta (Z = 0.93), and Bahir Dar (Z = 0.07) stations. However, the trends in Dangla (Z = −0.37) and Adet (Z = −0.32) stations showed a decreasing trend. As far as monthly and seasonal variability of rainfall are concerned, all the stations exhibited sensitivity of change. The trend of rainfall in May, June, July, August, and September was increasing. However, the trend on the rest of other months showed a decreasing trend. The increase in rainfall during Kiremt season, along with the decrease in number of rainy days, leads to an increase of extreme rainfall events over the region during 1980–2016. The consistency in rainfall trends over the study region confirms the robustness of the change in trends. Innovative trend analysis method is very crucial method for detecting the trends in rainfall time series data due to its potential to present the results in graphical format as well. The findings of this paper could help researchers to understand the annual and seasonal variability of rainfall over the study region and become a foundation for further studies.

1. Introduction

Water resource has become a prime concern for any development activities and planning including effective water resources management [1,2,3,4]. In recent years, the frequent occurrence of extreme climatic events such as flooding and drought became a global concern [5]. Since these phenomena negatively affect societies, water resources, ecosystem and the economy at large, all the concerned body should aware [6]. Rainfall variability is directly related to the occurrence of flooding and drought [7]. The change in precipitation and temperature are essential climatic variables indicating climate change [8].
Particularly, precipitation is the key climatic variable that affect both the spatial and temporal patterns of water resources [9]. Analyzing the long-term trends and variability of rainfall is very important for sustainable water resources management [1,10,11]. Studying the trends of precipitation and temperature have enormous use for researchers to describe the spatial and temporal variability and management of limited water resources for future development [12]. Trend analysis of rainfall is also essential to study the impacts of climate change for water resources planning and management [11,13,14,15,16,17,18]. Studies conducted so far suggested that the changes of precipitation shows a very diverse pattern in spatial-temporal trends at regional and national scales because of the natural resource disparity [19,20,21,22,23]. Additionally, these climatic variations will have unexpected consequences with respect to frequency and intensity of precipitation variability for many parts of the country.
Amhara Regional State is one of the nine regional states of Ethiopia with distinct geographical features, climate, and hydrological regimes. Previously, few studies tried to investigate rainfall and temperature trends across the region by using simple regression methods, but the results were not confirmed by the findings obtained by using integrative methods.
For effective water resource management, trend analysis of rainfall time series data is essential by Mann-Kendall (MK), Sen’s slope estimator, and multiple regression models. So far considerable studies have been conducted to detect the regional rainfall trends on annual, seasonal, and monthly bases using the non-parametric Mann-Kendall (MK) test, regression analysis, and Sen’s slope estimator test. For example, Caloiero et al. [24] used the Mann-Kendall (MK) and linear regression method to analyze annual and seasonal rainfall variability in Calabria, Southern Italy and obtained a decreasing trend in annual, autumn, and winter precipitation and an increasing trend in summer. The trends in annual mean precipitation show uniform uncertainty over nearly all of China, except for the northwest by using Mann-Kendall test [7]. Furthermore, significant increasing trends in annual and seasonal precipitation was observed in Northwest China from 1960–2013 using the MK test [1]. On the other hand, a significant increasing trend of annual rainfall was reported by using MK method by the researchers [6,25,26,27,28].
A recently introduced trend analysis method called innovative trend analysis method was introduced by Sen, 2014 [29] which has been implemented for water resources. Many researchers used the innovative trend analysis method to analyze the time series data together with MK method. For example, monthly trends of precipitation was analyzed in different parts of Turkey by innovative trend analysis method (ITAM) and four significant trends at two provinces and trends of monthly precipitation on 25 stations were investigated by ITAM and found a decreasing and increasing trend in Algeria on Macta watershed as indicated by [29]. Thus, innovative trend analysis method (ITAM) has widely used and applicable method in comparison to MK method. No study has been done so far over the region by using MK and ITAM method to analyze the trends of rainfall especially the seasonal and annual rainfall variability. Therefore, this paper analyzed the trends of seasonal and annual rainfall variability over the region by using innovative trend analysis method by comparing its result with MK and Sen’s slope estimator test.

2. Materials and Methods
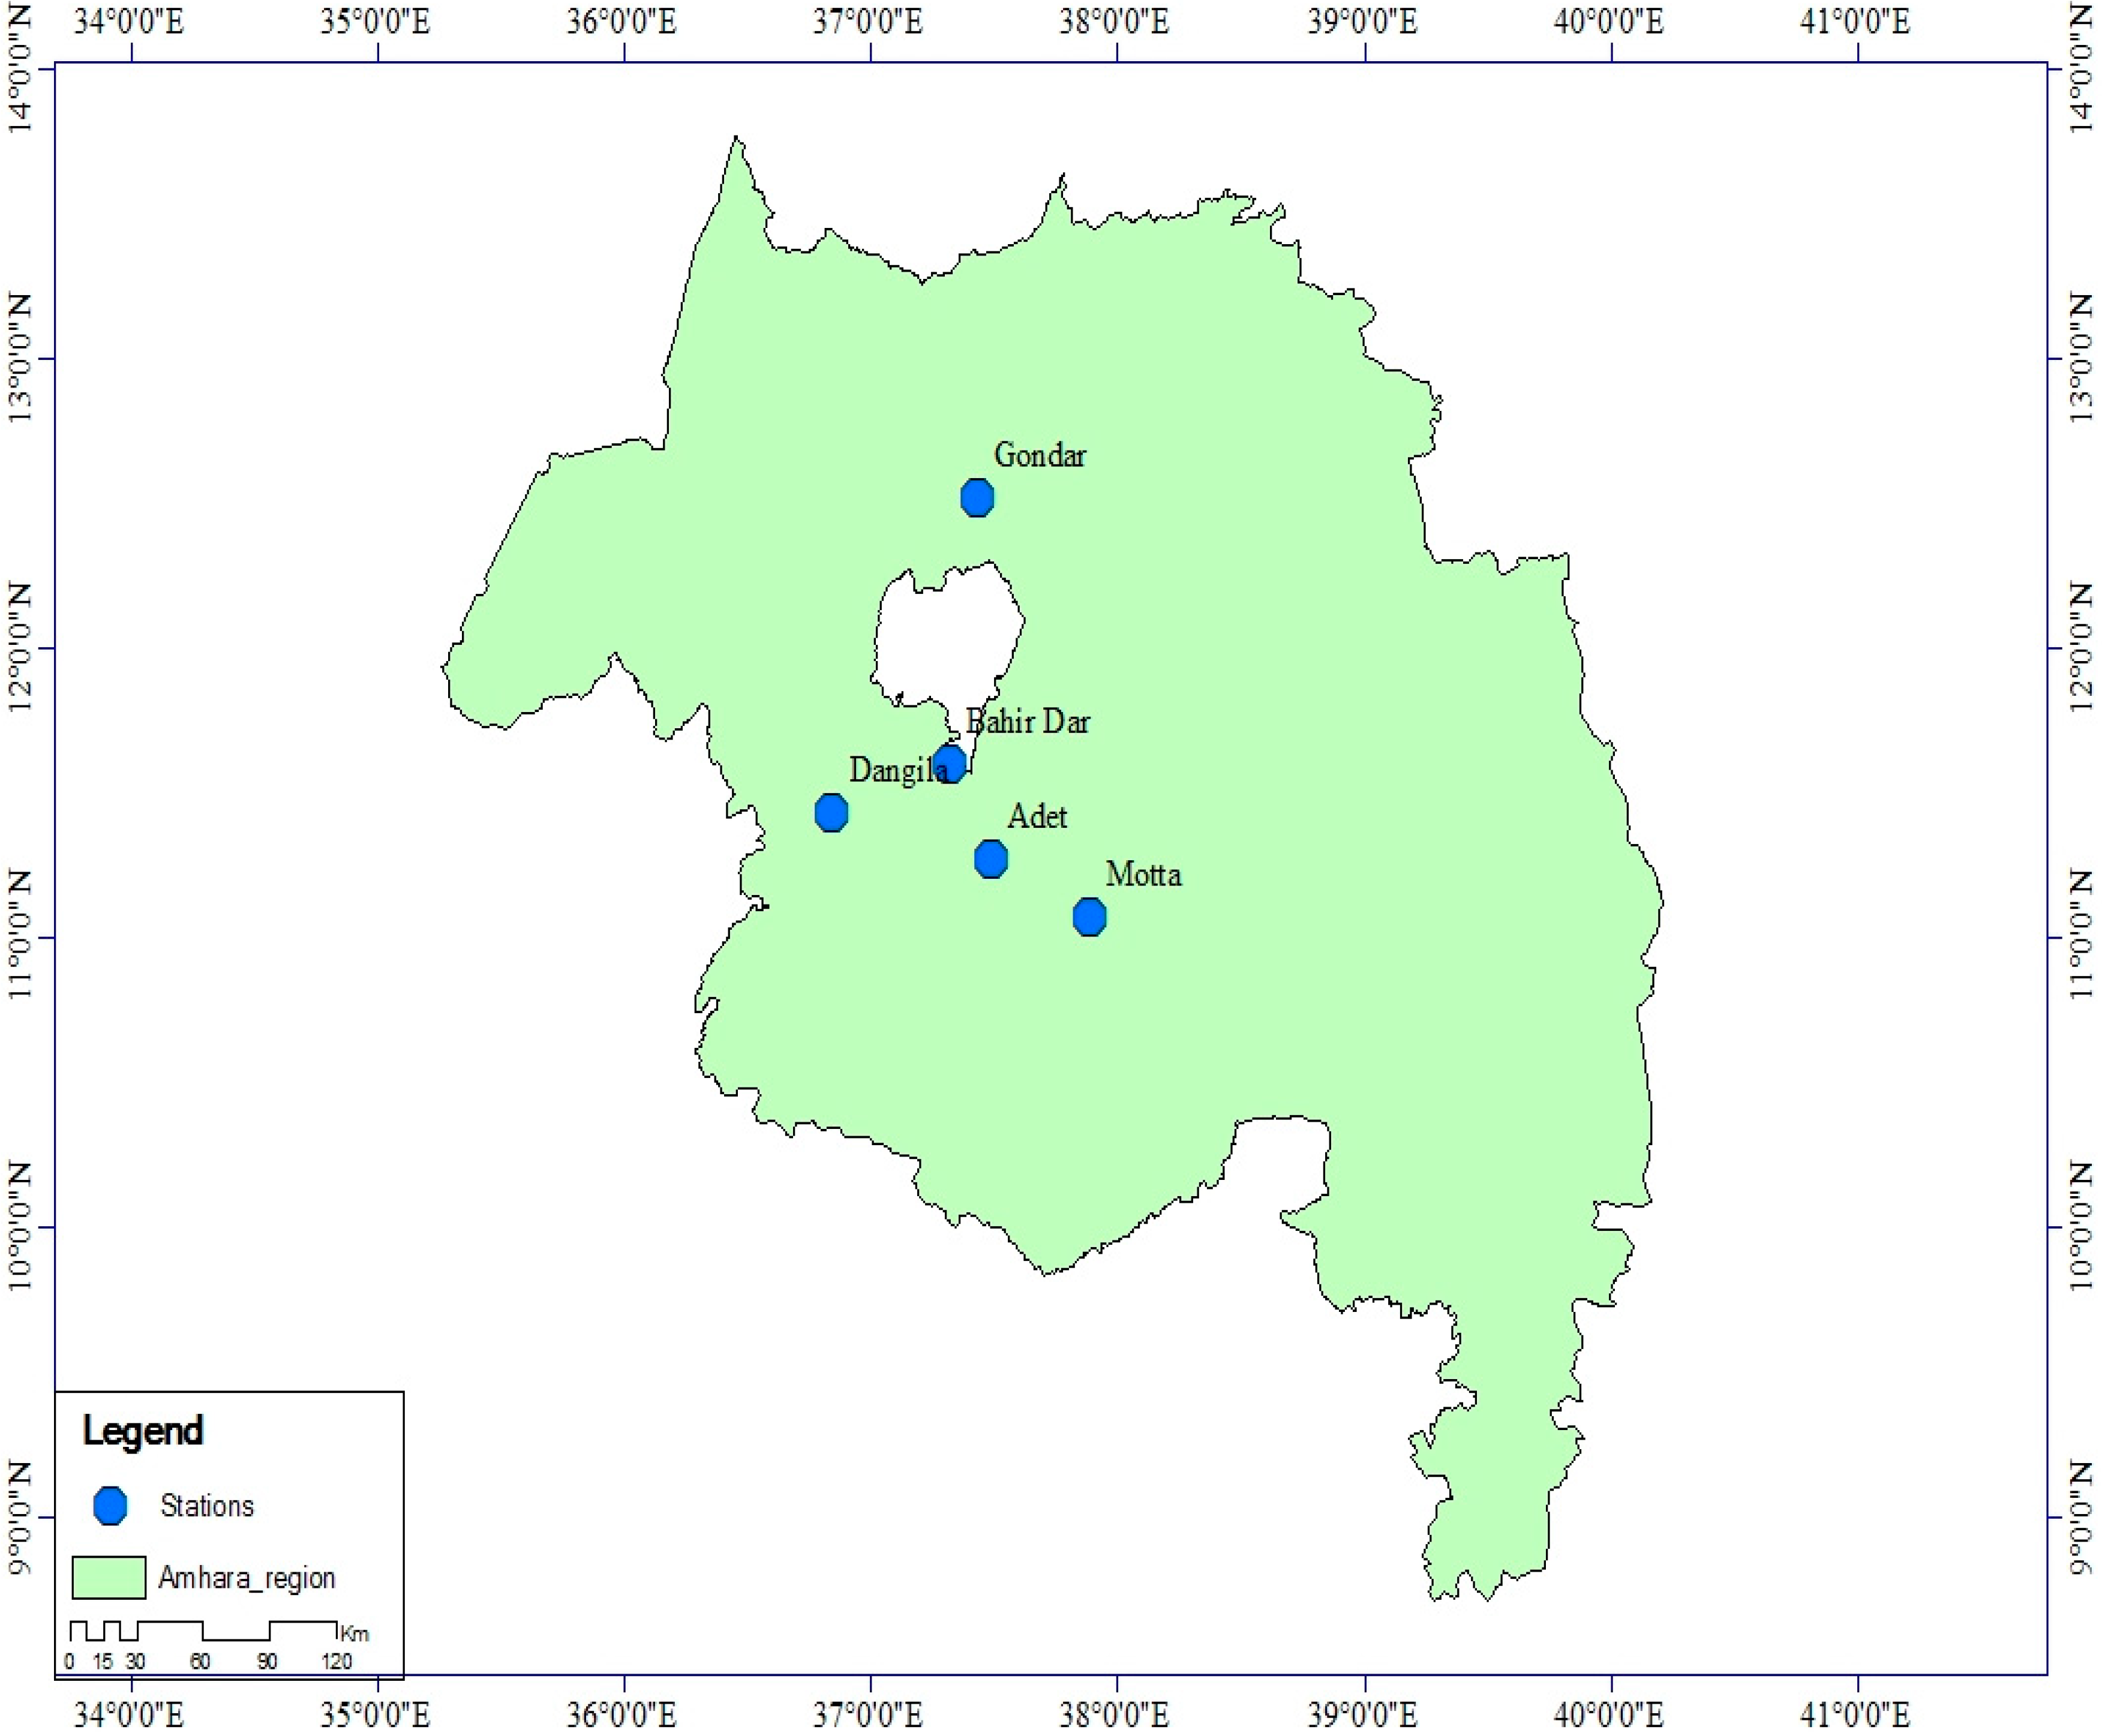
2.1. Study Area

Amhara regional state is found in north-west of Ethiopia lying between 9°–13°45′ north latitude, and 36°–40°30′ east longitude (Figure 1). It covers an estimated area of 170,150 km2. Its altitude ranges from 600 m to 4260 m above sea level. The annual mean temperature of the region ranges from 15 °C to 21 °C with high rainfall during summer season which starts from June to September [8].

2.2. Data Sources

Daily rainfall data were collected from five stations (Gondar, Adet, Bahir Dar, Dangla, and Motta) in the period of 1980–2016 from the National Meteorological Services Agency of Ethiopia (Table 1).

2.3. Methods

Trend analysis is used to investigate whether the trend is upward, downward, or no trend in data value points. The non-parametric Mann-Kendall (MK) test has been applied in most studies to detect the trends in hydrometeorological observations that does not need normal distribution of data points. This paper used innovative trend analysis method (ITAM) to detect the trends in rainfall time series data. To evaluate the reliability of ITAM, the results were compared with MK and Sen’s slope estimator test. In addition, annual and seasonal rainfall variability time series data were investigated by ITAM. The study region has four distinct seasons: Kiremt (June–August), Meher (September–November), Bega (December–February and Belg (March–May). Significance levels at 10%, 5%, and 1% were taken to assess the rainfall times series data by MK, ITAM, and Sen’s slope estimator method. 10% was considered as a threshold level to show a significant trend. The Kiremt season is characterized by heavy rainfall in the region.

2.3.1. Mann–Kendall Trend Test

The Mann Kendall (MK) test method is a ranked non-parametric test used to analyze trends of hydrometeorological series. The Mann–Kendall (MK) test method also shows upward and downward trends with statistical significance. The strength of the trend depends on the magnitude, sample size and variations of data series. The trends in MK test is not significantly affected by the outliers occurred in the data series since the MK test statistic depends on positive or negative signs [30].
Annual and seasonal data series are used for trend analysis in this study. The trends of monthly rainfall have been also analyzed separately.
Individual time series data of rainfall is compared with all corresponding time series data of the year. When the data point of later year is larger than the data point of previous year, the MK statistics is increased by one otherwise the MK statistics decreased by one. Thus, the MK statistics is the cumulative result of all the data values. The Mann-Kendall test statistics “S” is then equated as:
S = i = 1 n 1 . j = i + 1 n s g n (   X j X i )  
The trend test is applied to X i data values (i = 1, 2, …n − 1) and X j (j = i + 1, 2, …n). The data values of each X i is used as a reference point to compare with the data values of X j which is given as:
  s g n ( X j X i ) = { + 1   i f   ( X j X i ) > 0 0     i f   ( X j X i ) = 0 1   i f   ( X j X i ) < 0    
where X i and X j are the values in period i and j. When the number of data series greater than or equal to ten (n ≥ 10), MK test is then characterized by normal distribution with the mean E(S) = 0 and variance Var(S) is equated as [31]:
  E ( S ) =   0    
V a r ( S ) = n ( n 1 ) ( 2 n + 5 ) k = 1 m   t k ( t k 1 )   ( 2 t k + 5 ) 18  
where m is the number of the tied groups in the time series, and   t k is the number of ties in the kth tied group.
The test statistics Z is as follows:
Z = { S 1 δ   i f   S > 0   0   i f   S = 0   S + 1 δ   i f   S < 0  
When Z is greater than zero, it indicates an increasing trend and when Z is less than zero, it is a decreasing trend.

2.3.2. Innovative Trend Analysis Method (ITAM)

Innovative trend analysis method (ITAM) has been used in many studies to detect the hydrometeorological observations and its accuracy was compared with the results of MK method. In ITAM, the hydrometeorological observations were classified into two classes and then the data points arranged independently in increasing order. Then after, the two halves placed on a coordinate system ( X i : i = 1, 2, 3, ...n/2) on X-axis and ( X j : j = n/2 + 1, n/2 + 2, …n) on Y-axis. If the time series data on a scattered plot are collected on the 1:1 (45°) straight line, it indicates no trend. However, the trend is increasing when data points accumulate above the 1:1 straight line and decreasing trend when data points accumulate below the 1:1 straight line.
The mean value difference between X i and X j could give the trend magnitude of data series. The first observed data point was not considered in this study when classifying the time series data into X i and X j data plots since the total number of observed data points are 37 from 1980–2016. The direction of the trend is also affected by X i data series. The trend indicator of ITAM is multiplied by 10 to make the scale similar with the other two tests. The trend indicator is given as:
ɸ = 1 n i = 1 n 10   ( X j X i ) μ  
where ɸ   = trend indicator, n = number of observations in the subseries, X i   = data series in the first half subseries class, X j   = data series in the second half subseries class and μ   = mean of data series in the first half subseries class.
A positive value of ɸ indicates an increasing trend. However, a negative value of ɸ indicates a decreasing trend. However, when the scatter points closest around the 1:1 straight line, it implies the non-existence of significant trend.

2.3.3. Sen’s Slope Estimator Test

The trend magnitude is calculated by [28,32,33,34,35] slope estimator methods. The slope (Qi) between two data points is given by the equation:
  Q i =   X j X k j k ,   f o r   i = 1 , 2 , ... N  
where X j and X k are data points at time j and k (j > k), respectively. When there is only single datum in each time, then N = n ( n 1 ) 2 ; n is number of time periods. However, if the number of data in each year are many, then N < n ( n 1 ) 2 ; n total number of observations. The N values of slope estimator are arranged from smallest to biggest. Then, the median of slope (β) is computed as:
β = { Q [ ( N + 1 ) / 2 ] when   N   is   odd Q [ ( N / 2 ) + Q ( N + 2 ) / ( 2 ) / ( 2 ) ] when   N   is   even
The sign of β shows whether the trend is increasing or decreasing.

3. Results

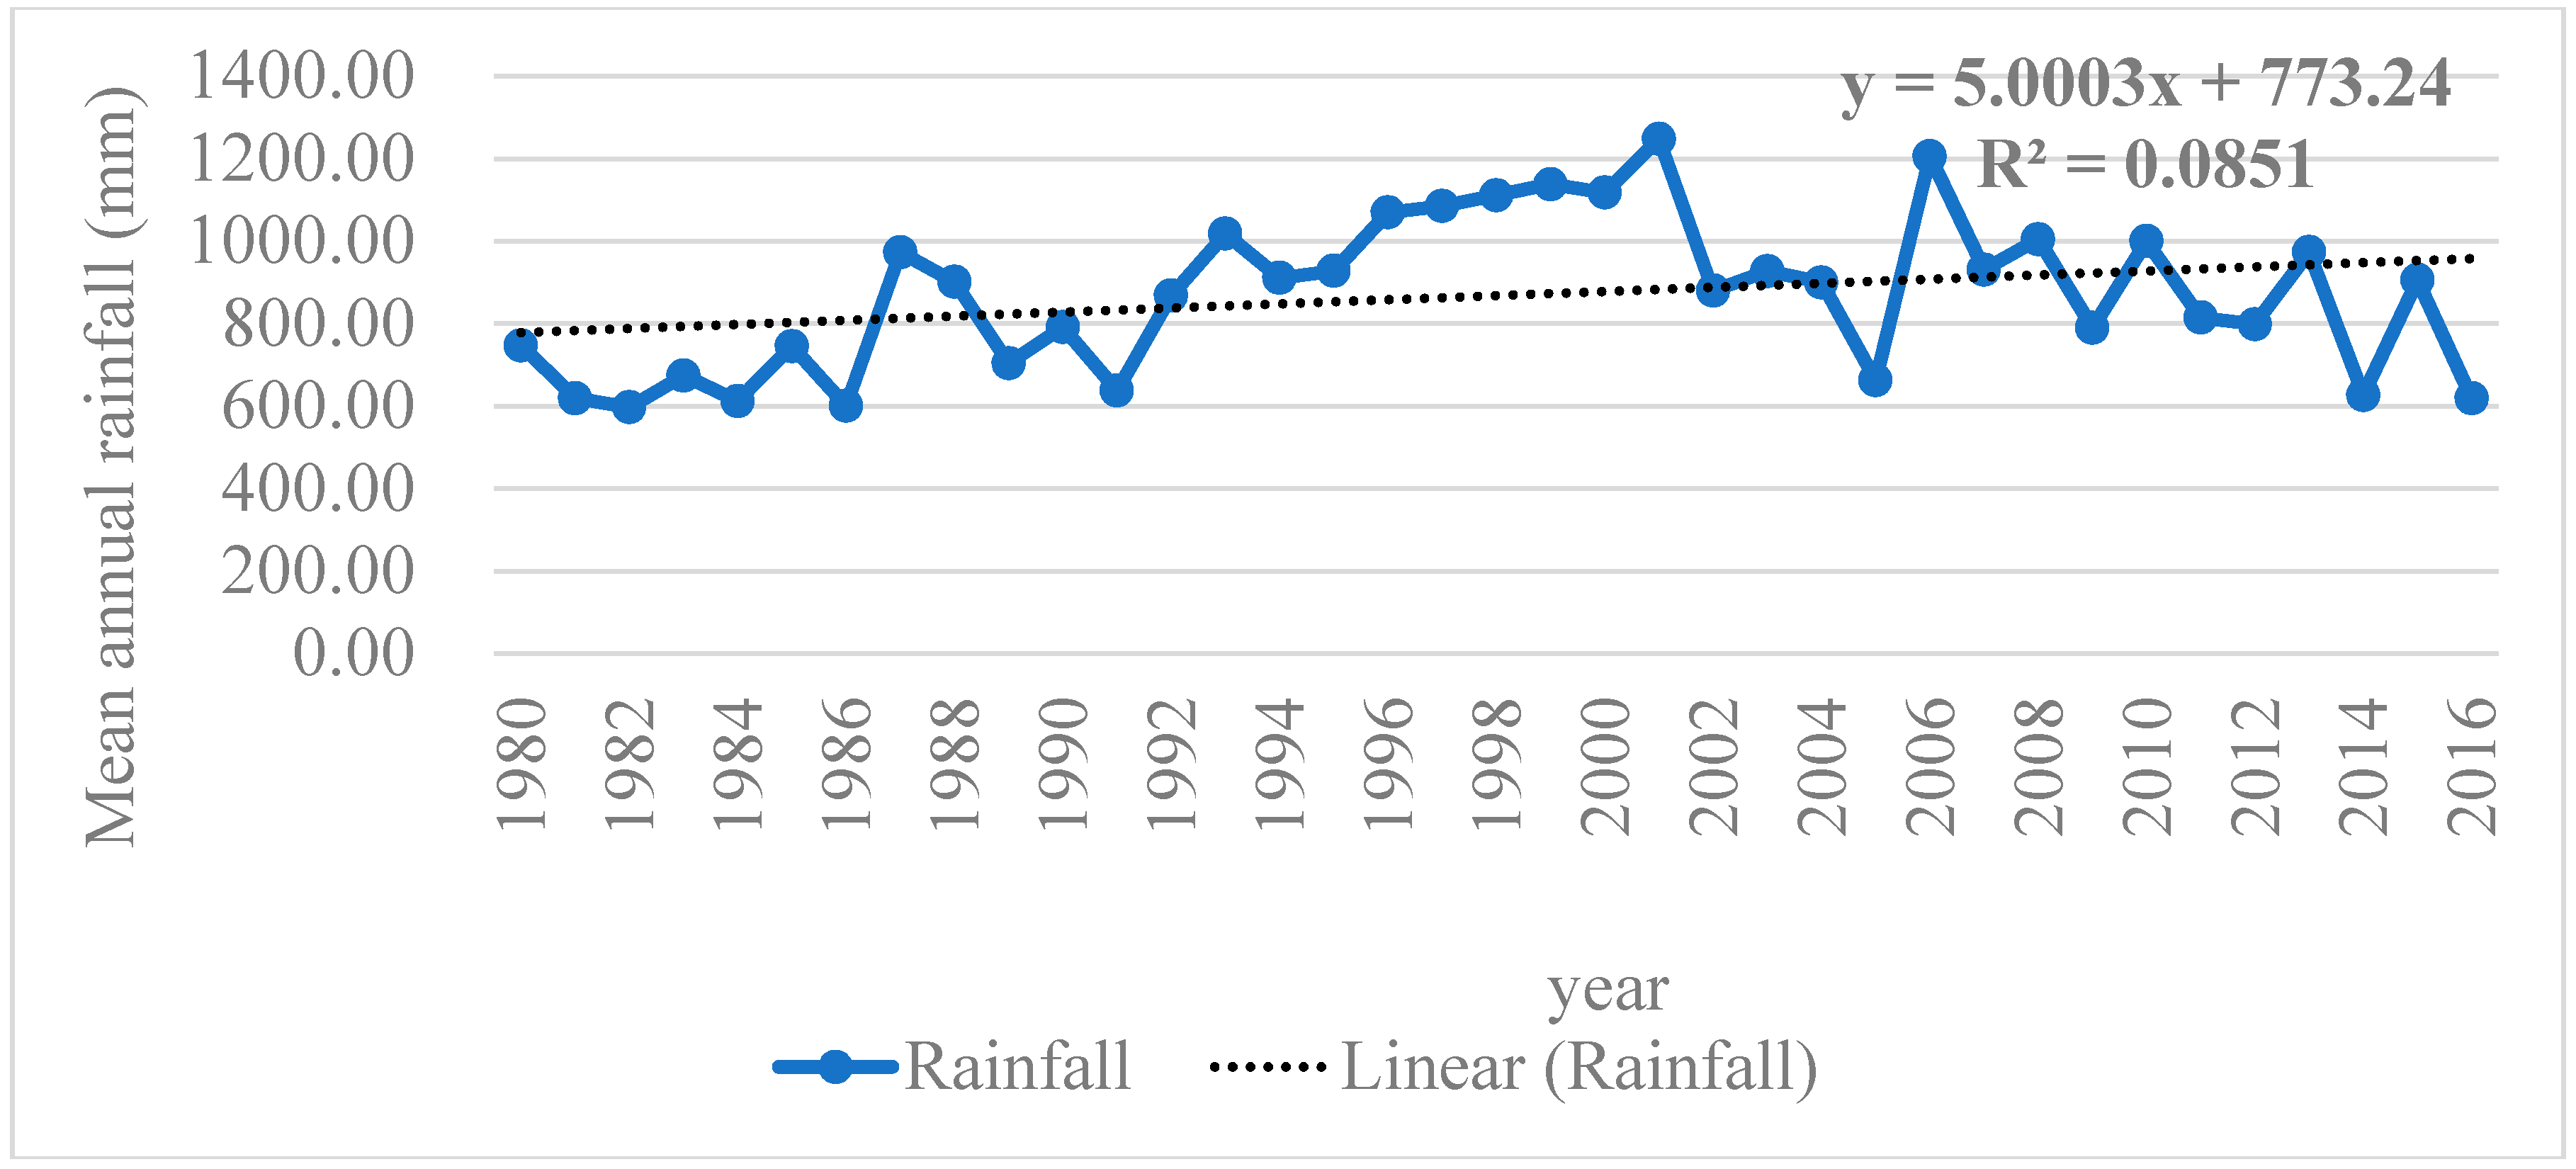
3.1. Analysis of Annual Rainfall

Annual mean precipitation of the study region from 1980–2016 was found to be 868.24 mm. The minimum and maximum recorded rainfall was 596.90 and 1247.74 mm per year, respectively. A dramatic decreasing of precipitation was observed in 1982 and 1986 (Figure 2). However, an increasing of precipitation was observed at (R2 = 0.09) in 2001.

3.2. Monthly and Seasonal Variability of Rainfall

The seasons of Amhara Regional State is divided into four distinct categories: Kiremt, Meher, Bega, and Belg seasons. The Kiremt season is characterized by heavy rainfall followed by Belg season. However, Meher, and Bega seasons are dry seasons. The seasonal rainfall varied from 146.10 to 237.50 mm (Kiremt), 13.67 to 102.83 mm (Meher), 2.42 to 4.12 mm (Bega) and 16.77 to 81.26 mm (Belg) (Table 2).

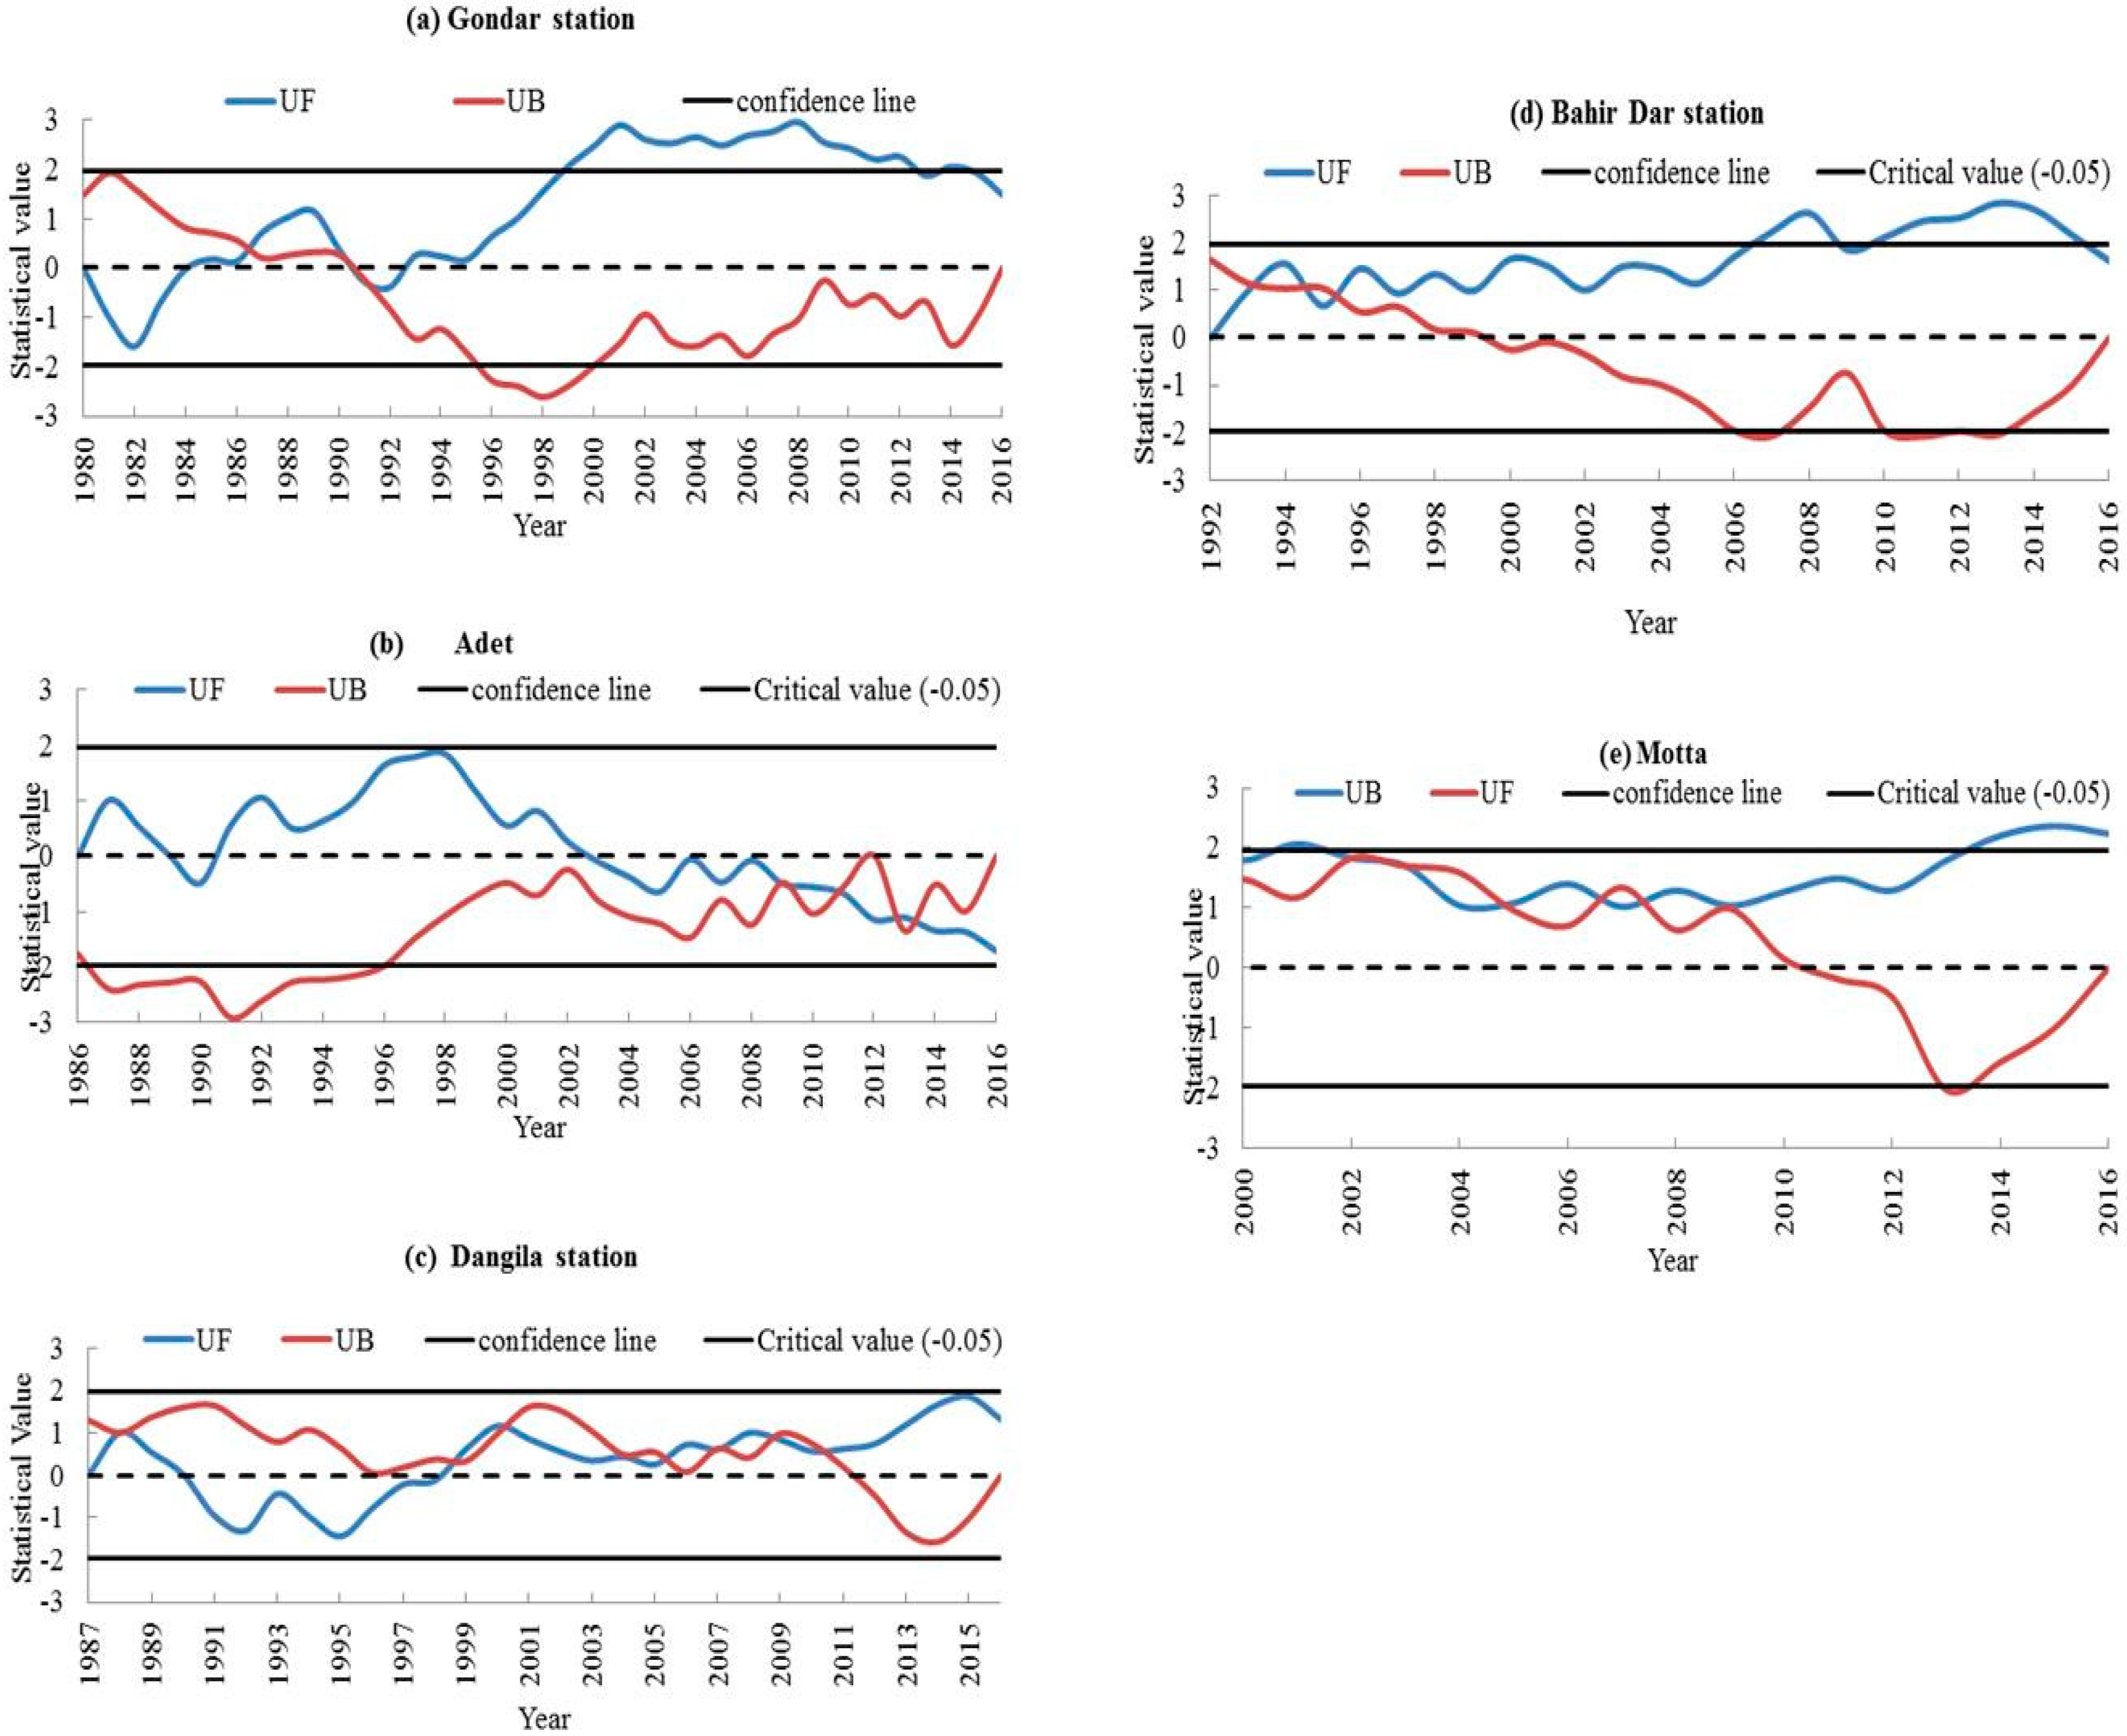
3.3. Seasonal and Annual Rainfall Trends

The MK curve annual precipitation (changing parameters) shows a significant increasing trend in Gondar from 1999 to 2012 (Z = 1.69), a sharp decreasing trend in Adet from 1998 to 2016 (Z = −0.32), a slightly decreasing trend observed in Dangla (Z = −0.37), in Bahir Dar a significant increasing trend was observed with (Z = 0.07) from 2007 to 2013 and finally a significant increasing trend was observed in Motta station (Z = 0.93) (Figure 3).
The annual trend analysis of rainfall in all stations using the Mann Kendall test, ITAM, and Sen’s slope estimator test results are presented in (Table 3). Significance levels at (α = 0.01, α = 0.05, α = 0.1) were taken to detect the trends in all five stations. The trends in ITAM test shows increasing trend in Gondar and Motta and a decreasing trend in Adet, Bahir Dar and Dangla stations. Hence, the increase and decrease in innovative trend analysis ( ɸ ) test value predict that the magnitude become strong and weak, respectively.
Monthly rainfall shows a decreasing trend in December, January, and February with strong magnitude largely in northeastern part of the region. Rainfall increased from June to September.

3.4. Comparison of the Trend Results

The results of ITAM is analyzed by comparing with the results of MK and Sen’s slope estimator test to check its reliability. Ten time series data show a significant trend at different stations. To compare the results of ITAM to check whether there is a significant trend or not, scattered plots were drawn between the statistic ɸ of ITAM and Z of MK test and between ɸ of ITAM results and β of Sen’s slope estimator test. The results presented showed that most of the estimated values had correlated each other. Thus, the constancy of the results in all three trend detection methods confirmed that ITAM is a reliable method for trend detection in time series data of hydrometeorology.

4. Discussion

The study region is characterized with maximum rainfall in Kiremt (June to August) and some in Belg (March to May) seasons. There is inter-annual variability of rainfall over the stations. The rainfall variability in Kiremt season is directly related to crop production over most parts of the region [9,36,37,38]. Gondar, Adet, and Bahir Dar stations exhibited a coefficient of variation (CV > 0.1) except Dangla and Motta stations. The results of this study is generally consistent with other research results which reported increased rainfall and non-uniform rainfall changes [37,39,40].
The MK, ITAM, and Sen’s slope estimator test analysis showed that decreasing and increasing trend of rainfall was observed across the stations. However, there is no statistically significant trend at 95% level in all stations. This result is also supported by [38] that expressed the seasonal trend analysis in most parts of the country was decreased by 30% to 40%. This variation may influence the regional climate systems as well as the hydrological cycle [38].
It was clearly seen that the decreasing of rainfall in winter season during the study period was probably caused by mainly the significant reduction of rainfall from December to February (p < 0.05) [38]. Some other months also showed slight decreasing trend such as November and March.
Increasing the number of sample stations improves the precision and accuracy of the results for practical implementation. However, this paper will serve as a reference for water resources managers, practitioners and policy-makers for successful achievements in water sector.

5. Conclusions

In the present study, the variability of rainfall on monthly, seasonal, and annual basis were analyzed for five representative meteorological stations of Amhara Regional State. The temporal trend of rainfall was also determined for the study years. Seasonal variability of rainfall was investigated in all stations. Significant increasing trend was observed in Gondar station in Kiremt and Belg seasons, whereas other stations almost show uniform increasing trend. The rainfall in Bega season is significantly decreased in Bahir Dar and Dangla stations.
There was conformity in the results obtained from the Mann-Kendall, ITAM test, Sen’s slope estimator test and the trend line for all stations during the specified study period. The trend line shows the increasing and decreasing of rainfall for stations. The trend in precipitation observed for each station could imply that the changes are more pronounced for certain locations and less for others. The cause of these changes requires further study to link the observed trends with climate variability. Thus, the change in trends of rainfall become an evidence across the study region to reach on conclusion.

Author Contributions

M.G. made substantial contributions to the design, idea generating, analysis, interpretation and drafting of the manuscript. D.Y. assisted and commented the draft manuscript and supervised the whole work. H.W. advising and operated the MK test for data analysis and is a resource person. T.Q. programmed the ArcGIS software. A.G., A.A. and D.B. are participated in the design of the study and supervised all methodologies utilized. The final manuscript before submission was checked and approved by all the authors. This research was supported by the National Key Research and Development Project (grant No. 2016YFA0601503).

Funding

This research was funded by National Key Research and Development Project (grant No. 2016YFA0601503).

Acknowledgments

The authors would like to thank the National Meteorological Service Agency of Ethiopia for providing the raw meteorological data. We also thank the China Institute of Water Resources and Hydropower Research for financing this research.

Conflicts of Interest

The authors declare no conflict of interest.

References

  1. Yang, P.; Xia, J.; Zhang, Y.; Hong, S. Temporal and spatial variations of precipitation in Northwest China during 1960–2013. Atmos. Res. 2017, 183, 283–295. [Google Scholar] [CrossRef]
  2. Burgess, C.P.; Taylor, M.A.; Stephenson, T.; Mandal, A. Frequency analysis, infilling and trends for extreme precipitation for Jamaica (1895–2100). J. Hydrol. Reg. Stud. 2015, 3, 424–443. [Google Scholar] [CrossRef]
  3. Chatterjee, S.; Khan, A.; Akbari, H.; Wang, Y. Monotonic trends in spatio-temporal distribution and concentration of monsoon precipitation (1901–2002), West Bengal, India. Atmos. Res. 2016, 182, 54–75. [Google Scholar] [CrossRef]
  4. Panthi, J.; Dahal, P.; Shrestha, M.L.; Aryal, S.; Krakauer, N.Y.; Pradhanang, S.M.; Lakhankar, T.; Jha, A.K.; Sharma, M.; Karki, R. Spatial and Temporal Variability of Rainfall in the Gandaki River Basin of Nepal Himalaya. Climate 2015, 3, 210–226. [Google Scholar] [CrossRef] [Green Version]
  5. Li, J.; Zhu, Z.; Dong, W. A new mean-extreme vector for the trends of temperature and precipitation over China during 1960–2013. Meteorol. Atmos. Phys. 2016, 129, 273–282. [Google Scholar] [CrossRef]
  6. Toride, K.; Cawthorne, D.L.; Ishida, K.; Kavvas, M.L.; Anderson, M.L. Science of the Total Environment Long-term trend analysis on total and extreme precipitation over Shasta Dam watershed. Sci. Total Environ. 2018, 626, 244–254. [Google Scholar] [CrossRef] [PubMed]
  7. Li, J.; Zhu, Z.; Dong, W. Assessing the uncertainty of CESM-LE in simulating the trends of mean and extreme temperature and precipitation over China. Int. J. Climatol. 2017, 37, 2101–2110. [Google Scholar] [CrossRef]
  8. Adugna, B.T.; Goshu, G. Integrating aquaculture with traditional farming system: Socioeconomic assessment in the Amhara region, Ethiopia. Ecohydrol. Hydrobiol. 2010, 10, 223–230. [Google Scholar] [CrossRef]
  9. Girma, E.; Tino, J.; Wayessa, G. Rainfall trend and variability analysis in Setema-Gatira area of Jimma, Southwestern Ethiopia. Afr. J. Agric. Res. 2016, 11, 3037–3045. [Google Scholar] [CrossRef]
  10. Wagesho, N.; Goel, N.K.; Jain, M.K. Investigation of non-stationarity in hydro-climatic variables at Rift Valley lakes basin of Ethiopia. J. Hydrol. 2012, 444–445, 113–133. [Google Scholar] [CrossRef]
  11. Liao, W.; Wang, X.; Fan, Q.; Zhou, S.; Chang, M.; Wang, Z.; Wang, Y.; Tu, Q. Long-term atmospheric visibility, sunshine duration and precipitation trends in South China. Atmos. Environ. 2015, 107, 204–216. [Google Scholar] [CrossRef]
  12. Xu, M.; Kang, S.; Wu, H.; Yuan, X. Detection of spatio-temporal variability of air temperature and precipitation based on long-term meteorological station observations over Tianshan Mountains, Central Asia. Atmos. Res. 2018, 203, 141–163. [Google Scholar] [CrossRef]
  13. Lappas, I.; Tsioumas, V.; Zorapas, V. Spatial—Temporal Analysis, Variation and Distribution of Precipitation in the Water District of Central—Eastern Greece. Bull. Geol. Soc. Greece 2013, XLVII, 740–749. [Google Scholar] [CrossRef]
  14. Hamisi, J. Study of Rainfall Trends and Variability Over Tanzania a Research Project Submitted in Partial Fulfilment of the Requirements for the Postgraduate Diploma in Meteorology. Ph.D. Thesis, University of Nairobi, Nairobi, Kenya, August 2013. [Google Scholar]
  15. Feizi, V.; Mollashahi, M.; Frajzadeh, M.; Azizi, G. Spatial and Temporal Trend Analysis of Temperature and Precipitation in Iran. Ecopersia 2015, 2, 727–742. [Google Scholar]
  16. Jakob, D.; Walland, D. Variability and long-term change in Australian temperature and precipitation extremes. Weather Clim. Extrem. 2016, 14, 36–55. [Google Scholar] [CrossRef]
  17. Duhan, D.; Pandey, A. Statistical analysis of long term spatial and temporal trends of precipitation during 1901–2002 at Madhya Pradesh, India. Atmos. Res. 2013, 122, 136–149. [Google Scholar] [CrossRef]
  18. Sharma, C.S.; Panda, S.N.; Pradhan, R.P.; Singh, A.; Kawamura, A. Precipitation and Temperature Changes in Eastern India by Multiple Trend Detection Methods. Atmos. Res. 2016, 180, 211–225. [Google Scholar] [CrossRef]
  19. Diop, L.; Bodian, A. Spatiotemporal Trend Analysis of the Mean Annual Rainfall in Senegal. Eur. Sci. J. 2016, 12, 231–245. [Google Scholar]
  20. Sarricolea, P.; Martín-Vide, J. Spatial analysis of rainfall daily trends and concentration in Chile Análisis espacial de las precipitaciones diarias y sus tendencias de concentración en Chile. Investig. Geogr. 2014, 53–66. [Google Scholar] [CrossRef]
  21. Toggweiler, J.; Key, R. Ocean circulation: Thermohaline circulation. Encycl. Atmos. Sci. 2001, 4, 1549–1555. [Google Scholar]
  22. Wang, Z.; Luo, Y.; Liu, C.; Xia, J.; Zhang, M. Spatial and temporal variations of precipitation in Haihe River Basin, China: Six decades of measurements. Hydrol. Process. 2011, 25, 2916–2923. [Google Scholar] [CrossRef]
  23. Sahu, R.K.; Khare, D. Spatial and temporal analysis of rainfall trend for 30 districts of a coastal State (Odisha) of India. Int. J. Geol. Earth Environ. Sci. 2015, 5, 40–53. [Google Scholar]
  24. Caloiero, T.; Coscarelli, R.; Mancini, M. Trend detection of annual and seasonal rainfall in Calabria (Southern Italy). Int. J. Climatol. 2011, 31, 44–56. [Google Scholar] [CrossRef]
  25. Theobald, A.; Mcgowan, H.; Speirs, J. Trends in synoptic circulation and precipitation in the Snowy Mountains region, Australia, in the period 1958–2012. Atmos. Res. 2016, 169, 434–448. [Google Scholar] [CrossRef] [Green Version]
  26. Yang, F.; Lu, C. Catena Spatiotemporal variation and trends in rainfall erosivity in China’s dryland region during 1961–2012. Catena 2015, 133, 362–372. [Google Scholar] [CrossRef]
  27. Onyutha, C.; Tabari, H.; Taye, M.T.; Nyandwaro, G.N.; Willems, P. Analyses of rainfall trends in the Nile River Basin. J. Hydro-Environ. Res. 2015, 13, 36–51. [Google Scholar] [CrossRef]
  28. Gocic, M.; Trajkovic, S. Analysis of changes in meteorological variables using Mann-Kendall and Sen’s slope estimator statistical tests in Serbia. Glob. Planet. Chang. 2013, 100, 172–182. [Google Scholar] [CrossRef]
  29. Ahmad, I.; Zhang, F.; Tayyab, M.; Anjum, M.N.; Zaman, M.; Liu, J.; Farid, H.U.; Saddique, Q. Spatiotemporal analysis of precipitation variability in annual, seasonal and extreme values over upper Indus River basin. Atmos. Res. 2018, 213, 346–360. [Google Scholar] [CrossRef]
  30. Asfaw, A.; Simane, B.; Hassen, A.; Bantider, A. Variability and time series trend analysis of rainfall and temperature in northcentral Ethiopia: A case study in Woleka sub-basin. Weather Clim. Extrem. 2017, 19, 29–41. [Google Scholar] [CrossRef]
  31. Ma, X.; He, Y.; Xu, J.; Van Noordwijk, M.; Lu, X. Catena Spatial and temporal variation in rainfall erosivity in a Himalayan watershed. Catena 2014, 121, 248–259. [Google Scholar] [CrossRef]
  32. Gu, X.; Zhang, Q.; Singh, V.P.; Shi, P. Changes in magnitude and frequency of heavy precipitation across China and its potential links to summer temperature. J. Hydrol. 2017, 547, 718–731. [Google Scholar] [CrossRef]
  33. Laurent, J.S.; Mazumder, A. Influence of seasonal and inter-annual hydro-meteorological variability on surface water fecal coliform concentration under varying land-use composition. Water Res. 2013, 48, 170–178. [Google Scholar] [CrossRef] [PubMed]
  34. Wang, H.; Zhang, M.; Zhu, H.; Dang, X.; Yang, Z.; Yin, L. Hydro-climatic trends in the last 50 years in the lower reach of the Shiyang River Basin, NW China. Catena 2012, 95, 33–41. [Google Scholar] [CrossRef]
  35. Mbungu, W.; Ntegeka, V.; Kahimba, F.C.; Taye, M.; Willems, P. Temporal and spatial variations in hydro-climatic extremes in the Lake Victoria basin. Phys. Chem. Earth 2012, 50–52, 24–33. [Google Scholar] [CrossRef]
  36. Tekleab, S.; Mohamed, Y.; Uhlenbrook, S. Hydro-climatic trends in the Abay/Upper Blue Nile basin, Ethiopia. Phys. Chem. Earth 2013, 61–62, 32–42. [Google Scholar] [CrossRef]
  37. Angassa, A.; Oba, G. Relating long-term rainfall variability to cattle population dynamics in communal rangelands and a government ranch in southern Ethiopia. Agric. Syst. 2007, 94, 715–725. [Google Scholar] [CrossRef]
  38. Seleshi, Y.; Zanke, U. Recent changes in rainfall and rainy days in Ethiopia. Int. J. Climatol. 2004, 24, 973–983. [Google Scholar] [CrossRef] [Green Version]
  39. Yenehun, A.; Walraevens, K.; Batelaan, O. Spatial and Temporal Variability of Groundwater Recharge in Geba Basin, Northern Ethiopia. J. Afr. Earth Sci. 2017, 134, 198–212. [Google Scholar] [CrossRef]
  40. Tsidu, G.M. High-resolution monthly rainfall database for Ethiopia: Homogenization, reconstruction, and gridding. J. Clim. 2012, 25, 8422–8443. [Google Scholar] [CrossRef]
Figure 1. Map of the study region.
Atmosphere 09 00326 g001
Figure 2. Annual mean precipitation of the study region (1980–2016).
Atmosphere 09 00326 g002
Figure 3. Trends of annual rainfall across stations (note: UB and UF are changing parameters where UB = −UF).
Atmosphere 09 00326 g003
Table 1. Meteorological stations’ information.
S/NoStationsElevation (m)Latitude (N)Longitude (E)Area (km2) Annual Mean Precipitation (mm)
1Gondar197337.431912.521222,319.111102.15
2Adet217937.493111.274522,914.24515.75
3Bahir Dar182737.32211.602726,750.85656.75
4Dangila211636.84611.433717,802.441276.00
5Motta241737.8911.07416,362.481142.95
Table 2. Monthly and seasonal rainfall across stations.
MonthsGondarAdetBahirdarDanglaMottaRainfall (mm)Z-Score
January 5.21 2.58 1.05 1.13 2.15 2.42 (0.90)
February14.13 2.61 0.38 1.24 2.08 4.09 (0.88)
March38.52 14.62 10.81 9.07 10.82 16.77 (0.72)
April96.76 27.08 13.04 17.28 18.65 34.56 (0.49)
May193.90 70.13 44.27 67.22 30.79 81.26 0.09
June347.19 93.30 122.39 122.71 44.93 146.10 0.91
July426.07 192.44 281.82 165.16 122.03 237.51 2.06
August283.65 159.35 212.53 167.60 119.15 188.46 1.44
September129.95 96.72 112.33 107.66 67.48 102.83 0.37
October64.87 65.31 44.83 49.38 41.91 53.26 (0.26)
November21.10 14.16 5.44 14.72 12.93 13.67 (0.75)
December5.70 5.76 2.70 2.18 4.27 4.12 (0.87)
Kiremt352.30148.37205.58151.83286.11228.84571.15
Meher71.9858.7354.2057.2540.7756.59168.85
Bega8.353.651.381.522.833.559.72
Belg109.7337.2822.7131.1920.0944.20131.68
Note: The number in bracket indicates a decreasing trend.
Table 3. Results of Z-statistic of MK, ITAM ( ɸ ), and Sen’s slope estimator test (β).
S/No.Name of Stations Z (MK) ɸ   βChange (%)
1Gondar1.69 **0.541.84 **0.93
2Adet−0.32−0.793.502.20
3Bahir Dar−0.07 *−23.511.80 *1.36
4Dangla−0.36−0.391.261.27
5Motta0.93 ***1.480.63 ***0.79
* Trends at 0.1 significance level; ** Trends at 0.05 significance level; *** Trends at 0.01 significance level.

