Article

Impacts of Atmospheric Rivers in Extreme Precipitation on the European Macaronesian Islands

by
Alexandre M. Ramos
1,*,
Ricardo M. Trigo
1,
Ricardo Tomé
1 and
Margarida L. R. Liberato
1,2
1
Instituto Dom Luiz (IDL), Faculdade de Ciências, Universidade de Lisboa, 1749-016 Lisboa, Portugal
2
Escola de Ciências e Tecnologia, Universidade de Trás-os-Montes e Alto Douro, 5001-801 Vila Real, Portugal
*
Author to whom correspondence should be addressed.
Atmosphere 2018, 9(8), 325; https://doi.org/10.3390/atmos9080325
Submission received: 27 July 2018 / Revised: 10 August 2018 / Accepted: 14 August 2018 / Published: 20 August 2018
(This article belongs to the Special Issue Atmospheric Rivers)

Abstract

:
The European Macaronesia Archipelagos (Azores, Madeira and Canary Islands) are struck frequently by extreme precipitation events. Here we present a comprehensive assessment on the relationship between atmospheric rivers and extreme precipitation events in these three Atlantic Archipelagos. The relationship between the daily precipitation from the various weather stations located in the different Macaronesia islands and the occurrence of atmospheric rivers (obtained from four different reanalyses datasets) are analysed. It is shown that the atmospheric rivers’ influence over extreme precipitation (above the 90th percentile) is higher in the Azores islands when compared to Madeira or Canary Islands. In Azores, for the most extreme precipitation days, the presence of atmospheric rivers is particularly significant (up to 50%), while for Madeira, the importance of the atmospheric rivers is reduced (between 30% and 40%). For the Canary Islands, the occurrence of atmospheric rivers on extreme precipitation is even lower.

1. Introduction

Extreme precipitation events (EPEs) occurring in the western Atlantic coast of the Iberian Peninsula (IP) during the winter months have been historically linked to major socio-economic impacts such as flooding, landslides, extensive property damage and human casualties. These events are usually associated to the presence of low pressure systems of Atlantic origin [1,2,3].
The analysis of the contribution of atmospheric rivers (ARs) to EPEs has been restricted to a few areas of the world, with a strong focus on the eastern North Pacific and their associated impacts on the contiguous North American west coast [4,5,6]. ARs are characterized for being shallow (1–2.5 km in height) and narrow (~300–500 km in width) plumes with high water vapour content, stretching over distances of at least 2000 km, and are often associated with the pre-cold-frontal region of extratropical cyclones in the region of the warm conveyor belt [7]. In addition, for the North Pacific, it was shown the role of the East Asian jet stream which exhibits a strong linkage with the total frequency of ARs that make landfall on the western United States [8]. Over Europe, the large amount of water vapour (WV) that is usually transported by these ARs can also lead to EPEs and flooding as described for a few specific extreme events [3,9]. Likewise, ARs also play an important role in a climatological context [10,11], showing, in particular, that there is a strong relationship between ARs and the occurrence of annual maxima precipitation days in Western Europe [12]. This relationship is especially strong along the Western European seaboard, with some areas having eight of their top 10 annual maxima precipitation days related to the occurrence of ARs.
A close look at the work by [13], shows that the frequency of ARs in the North Atlantic basin is one of the highest in the globe (>12% percent of time steps) with a mean duration ranging from 14 h (in the mid to high latitudes of North Atlantic) to 20 h (in the tropical part of the North Atlantic Ocean). Therefore, it is expected that the ARs have a measurable impact in the European Macaronesian Archipelagos EPEs.
The European Macaronesian region consists of the Portuguese Archipelagos of Azores and Madeira and the Spanish Archipelago of Canary (Figure 1). The three Archipelagos share regional features: a volcanic origin, a contrasting landscape and a gentle climate. The Azores Islands consist of nine islands located in the middle of the North Atlantic Ocean between 31.5° W and 25° W and 39.2° N and 36.8° N, while the Madeira Islands are located further south-east (near 17° W and 32.5° N). The Canary Archipelago, in the south-eastern European Macaronesian region, are located close to the African coast between 18° W and 13.5° W and 29.5° N and 27.5° N. There are very few studies looking simultaneously into several of these Macaronesian Archipelagos, although it is worth noticing the studies that do [14,15].
Despite the possible impact of the ARs in EPEs in the European Macaronesian Archipelagos, as far as we are aware, there is only one study that systematically analysed the association between EPEs and ARs in the Madeira Islands [16] for a 10 year period derived from satellite imagery. However, several studies have looked in depth into the atmospheric circulation conditions, including ARs, that led to the 20 February 2010 flash flood in the Madeira Islands, with a death toll of near 50 (e.g., [17]).
Therefore, it is of paramount interest to have a long-term systematic study of the influence of ARs in the EPEs in the three European Macaronesian Archipelagos. To do so, we use a precipitation dataset covering several stations located in various islands of each Archipelago. In addition, a global AR database using different reanalyses is used in order to access the days of occurrence of the ARs in each Archipelago. The main objectives of this work are to evaluate the occurrence and impact of ARs in EPEs on the European Macaronesian Archipelagos for a 30 year period and to evaluate its sensitivity to the AR tracking algorithm when using different reanalyses datasets with different spatial resolutions.

2. Materials and Methods

2.1. Precipitation Dataset

The precipitation dataset includes daily accumulated data from 31 climatological weather stations representative of the three European Macaronesian Archipelagos (Azores, Madeira and Canary) covering the 1980 and 2010 period (for the extended winter months, October to March). The extended winter of a certain year n corresponds to October–November–December (OND) of year n − 1 and January–February–March (JFM) of year n. Overall, the chosen stations were based on a combination of tests for data length, completeness, quality and homogeneity, as in [18,19]. Concerning the Madeira and Azores Islands, the datasets were retrieved from the Portuguese Met Office (IPMA), while the Canary dataset was retrieved from the Spanish Met Office (AEMET).
For each weather station, we have calculated the deciles of the available data (disregarding values below 1 mm/day). These deciles are divided into ten equally spaced bins for later comparison with the ARs datasets.

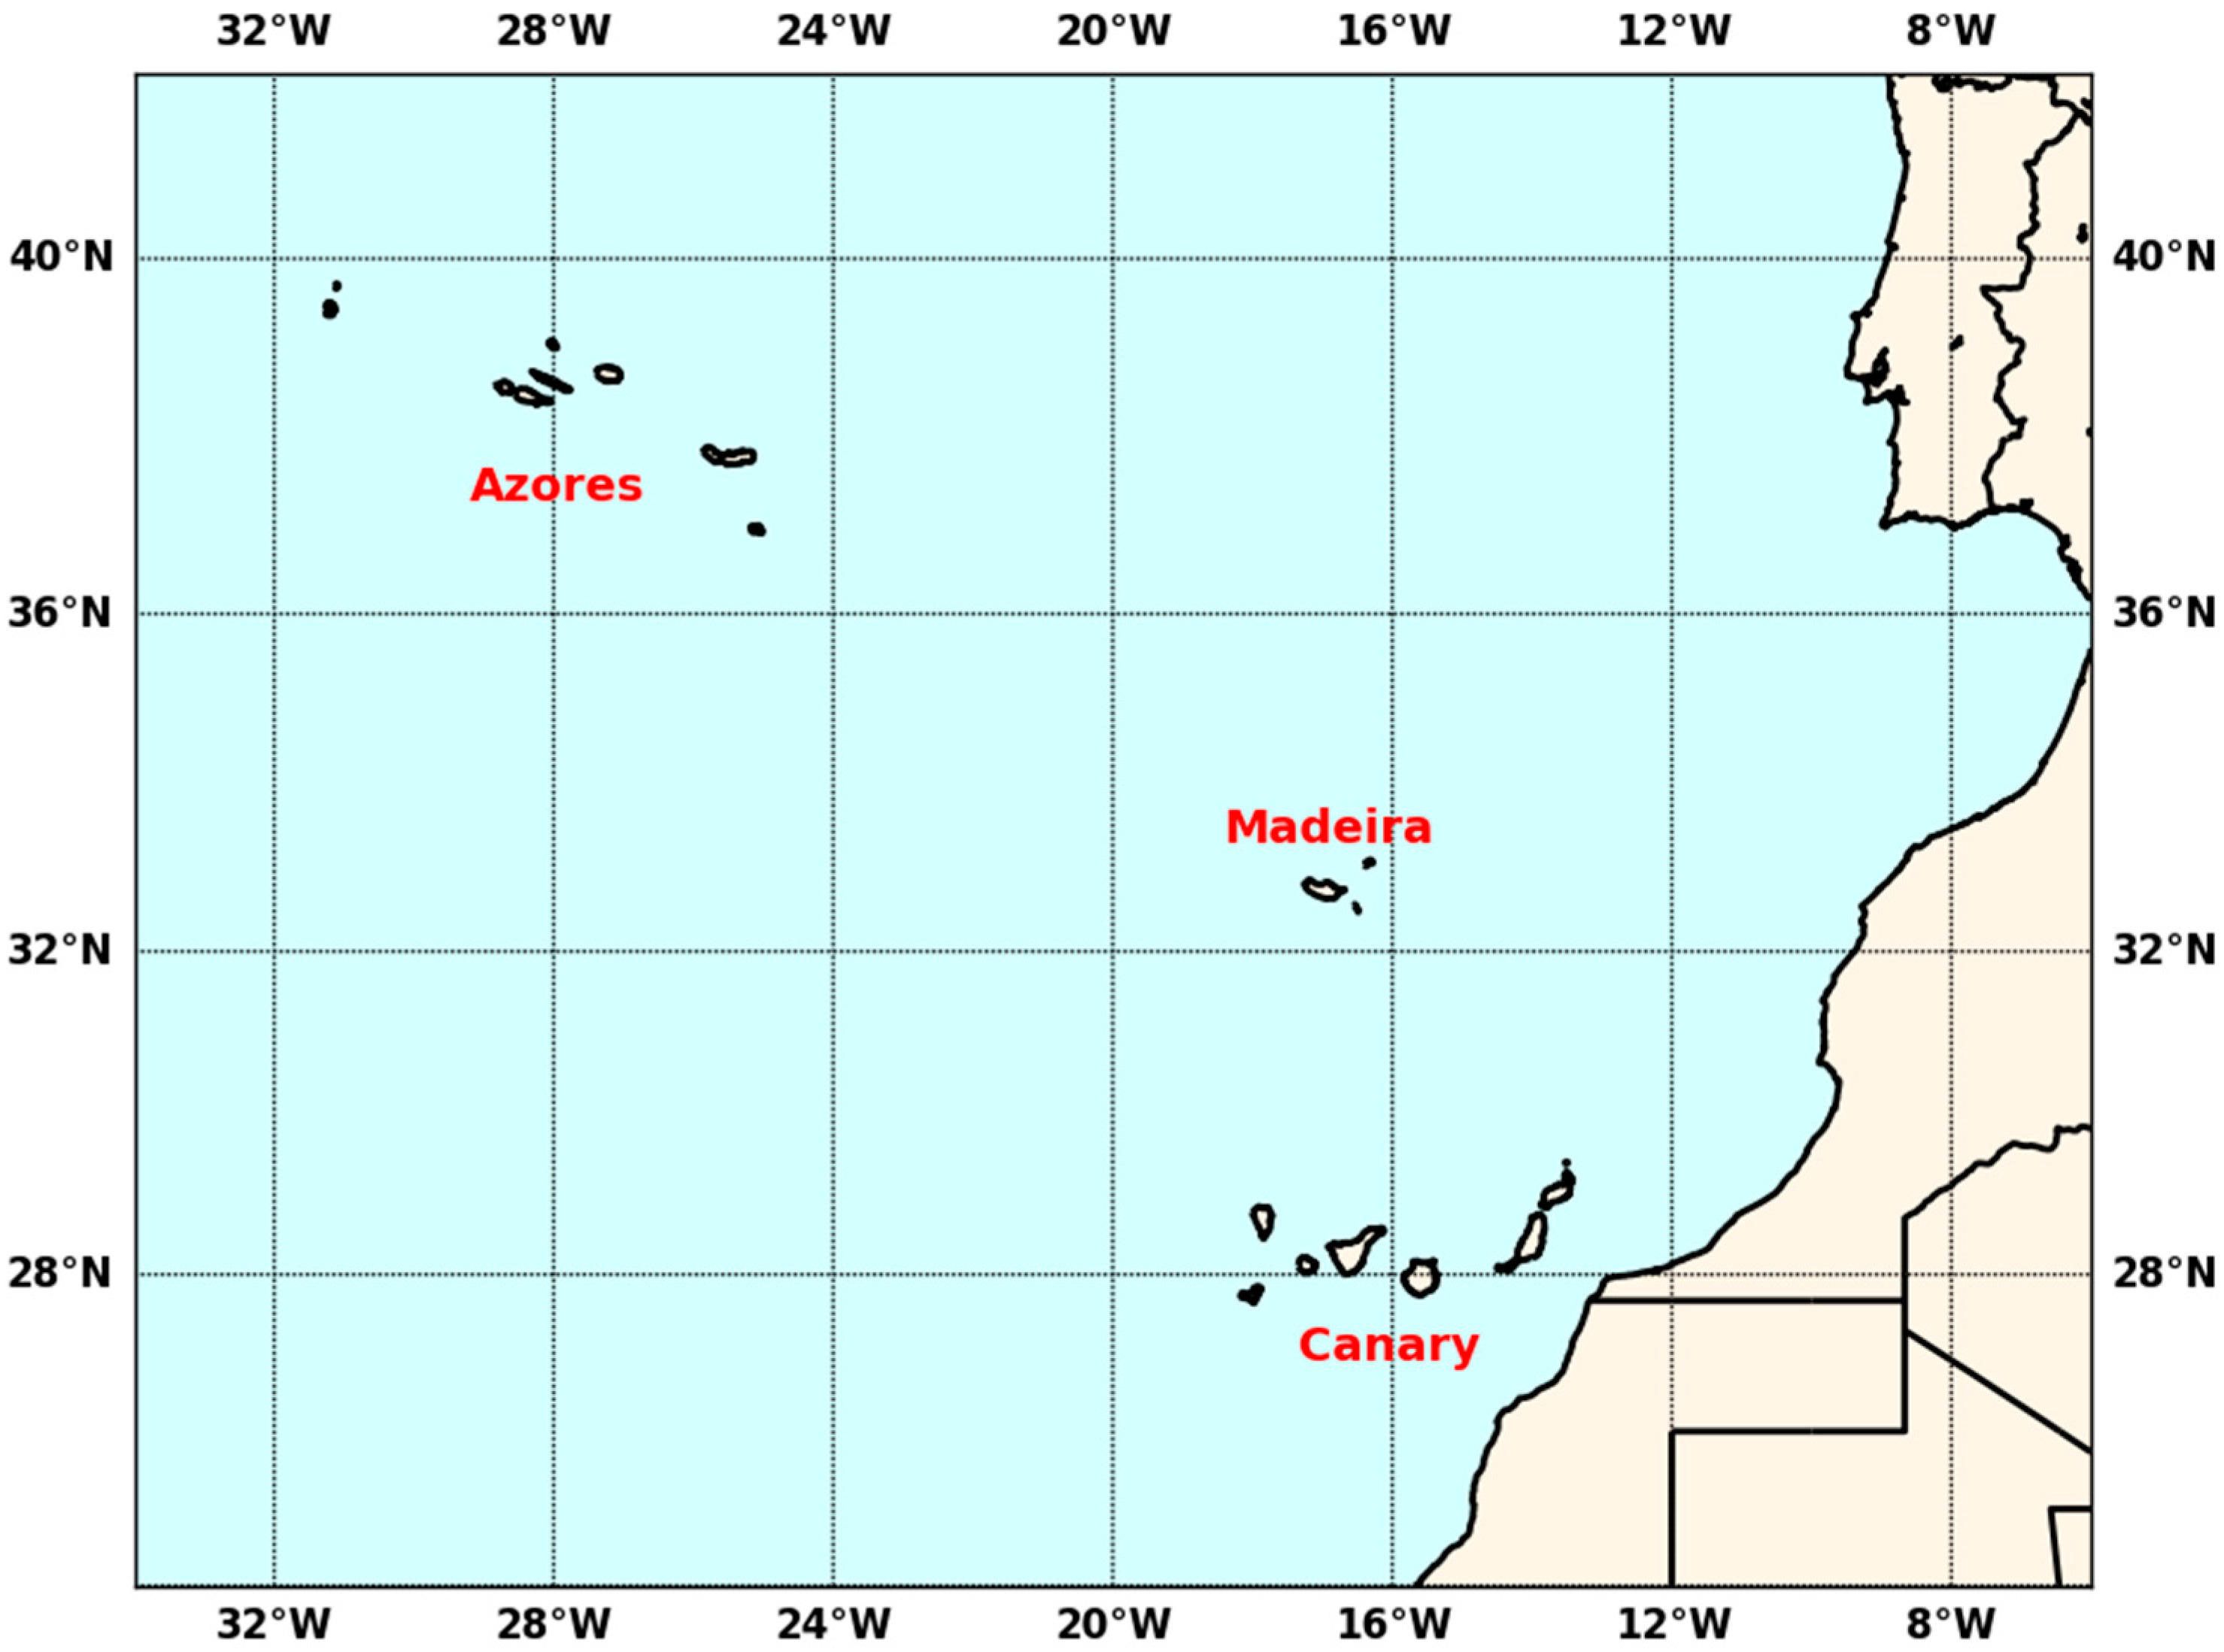
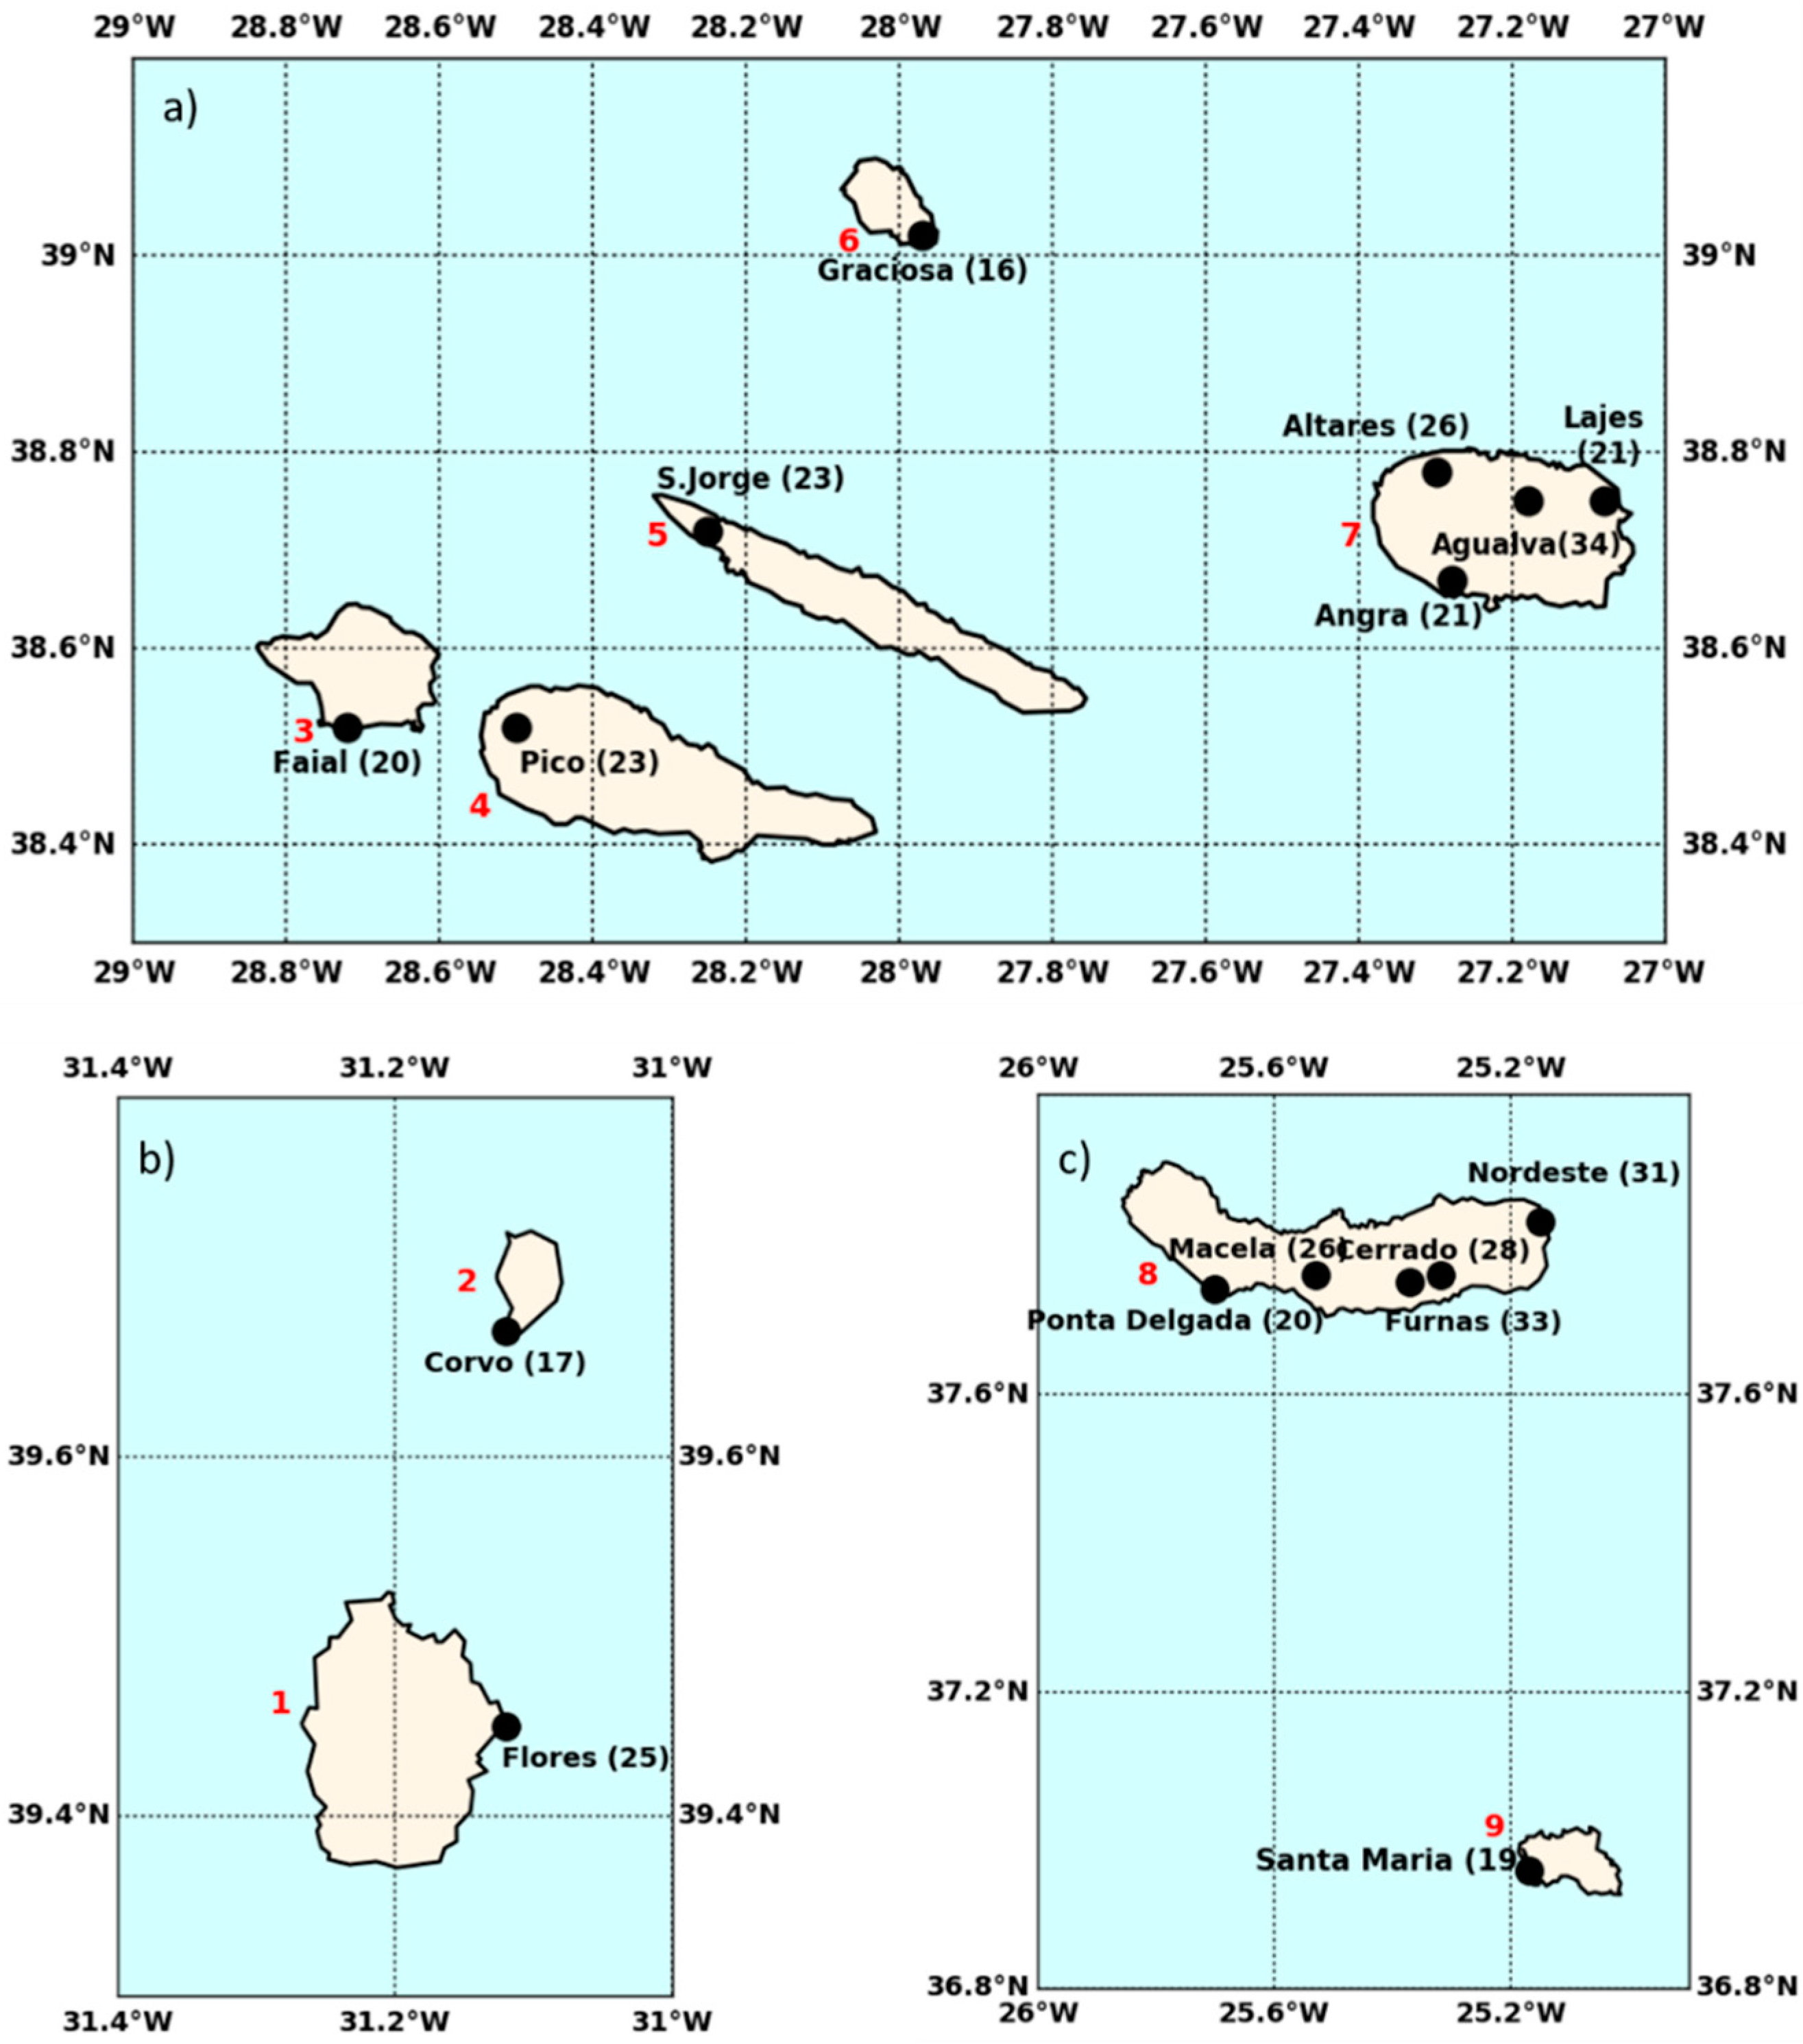
2.1.1. Azores Archipelago

Regarding the Azores (Figure 2, Supplementary Table S1), 16 weather stations were used embracing all nine islands. From the central group, including the islands Faial, Pico, São Jorge, Graciosa and Terceira, we managed to retrieve eight weather stations (Figure 2a).
From the western group of the Azores, with two islands (Flores and Corvo), the weather stations located at each airport were used (Figure 2b), while from the eastern group of the Azores, including the islands of São Miguel and Santa Maria, six weather stations were analysed (Figure 2c). Despite its important orographic features, none of the weather stations analysed in the different islands were located above 600 m, due to the lack of data with sufficient long-term series.

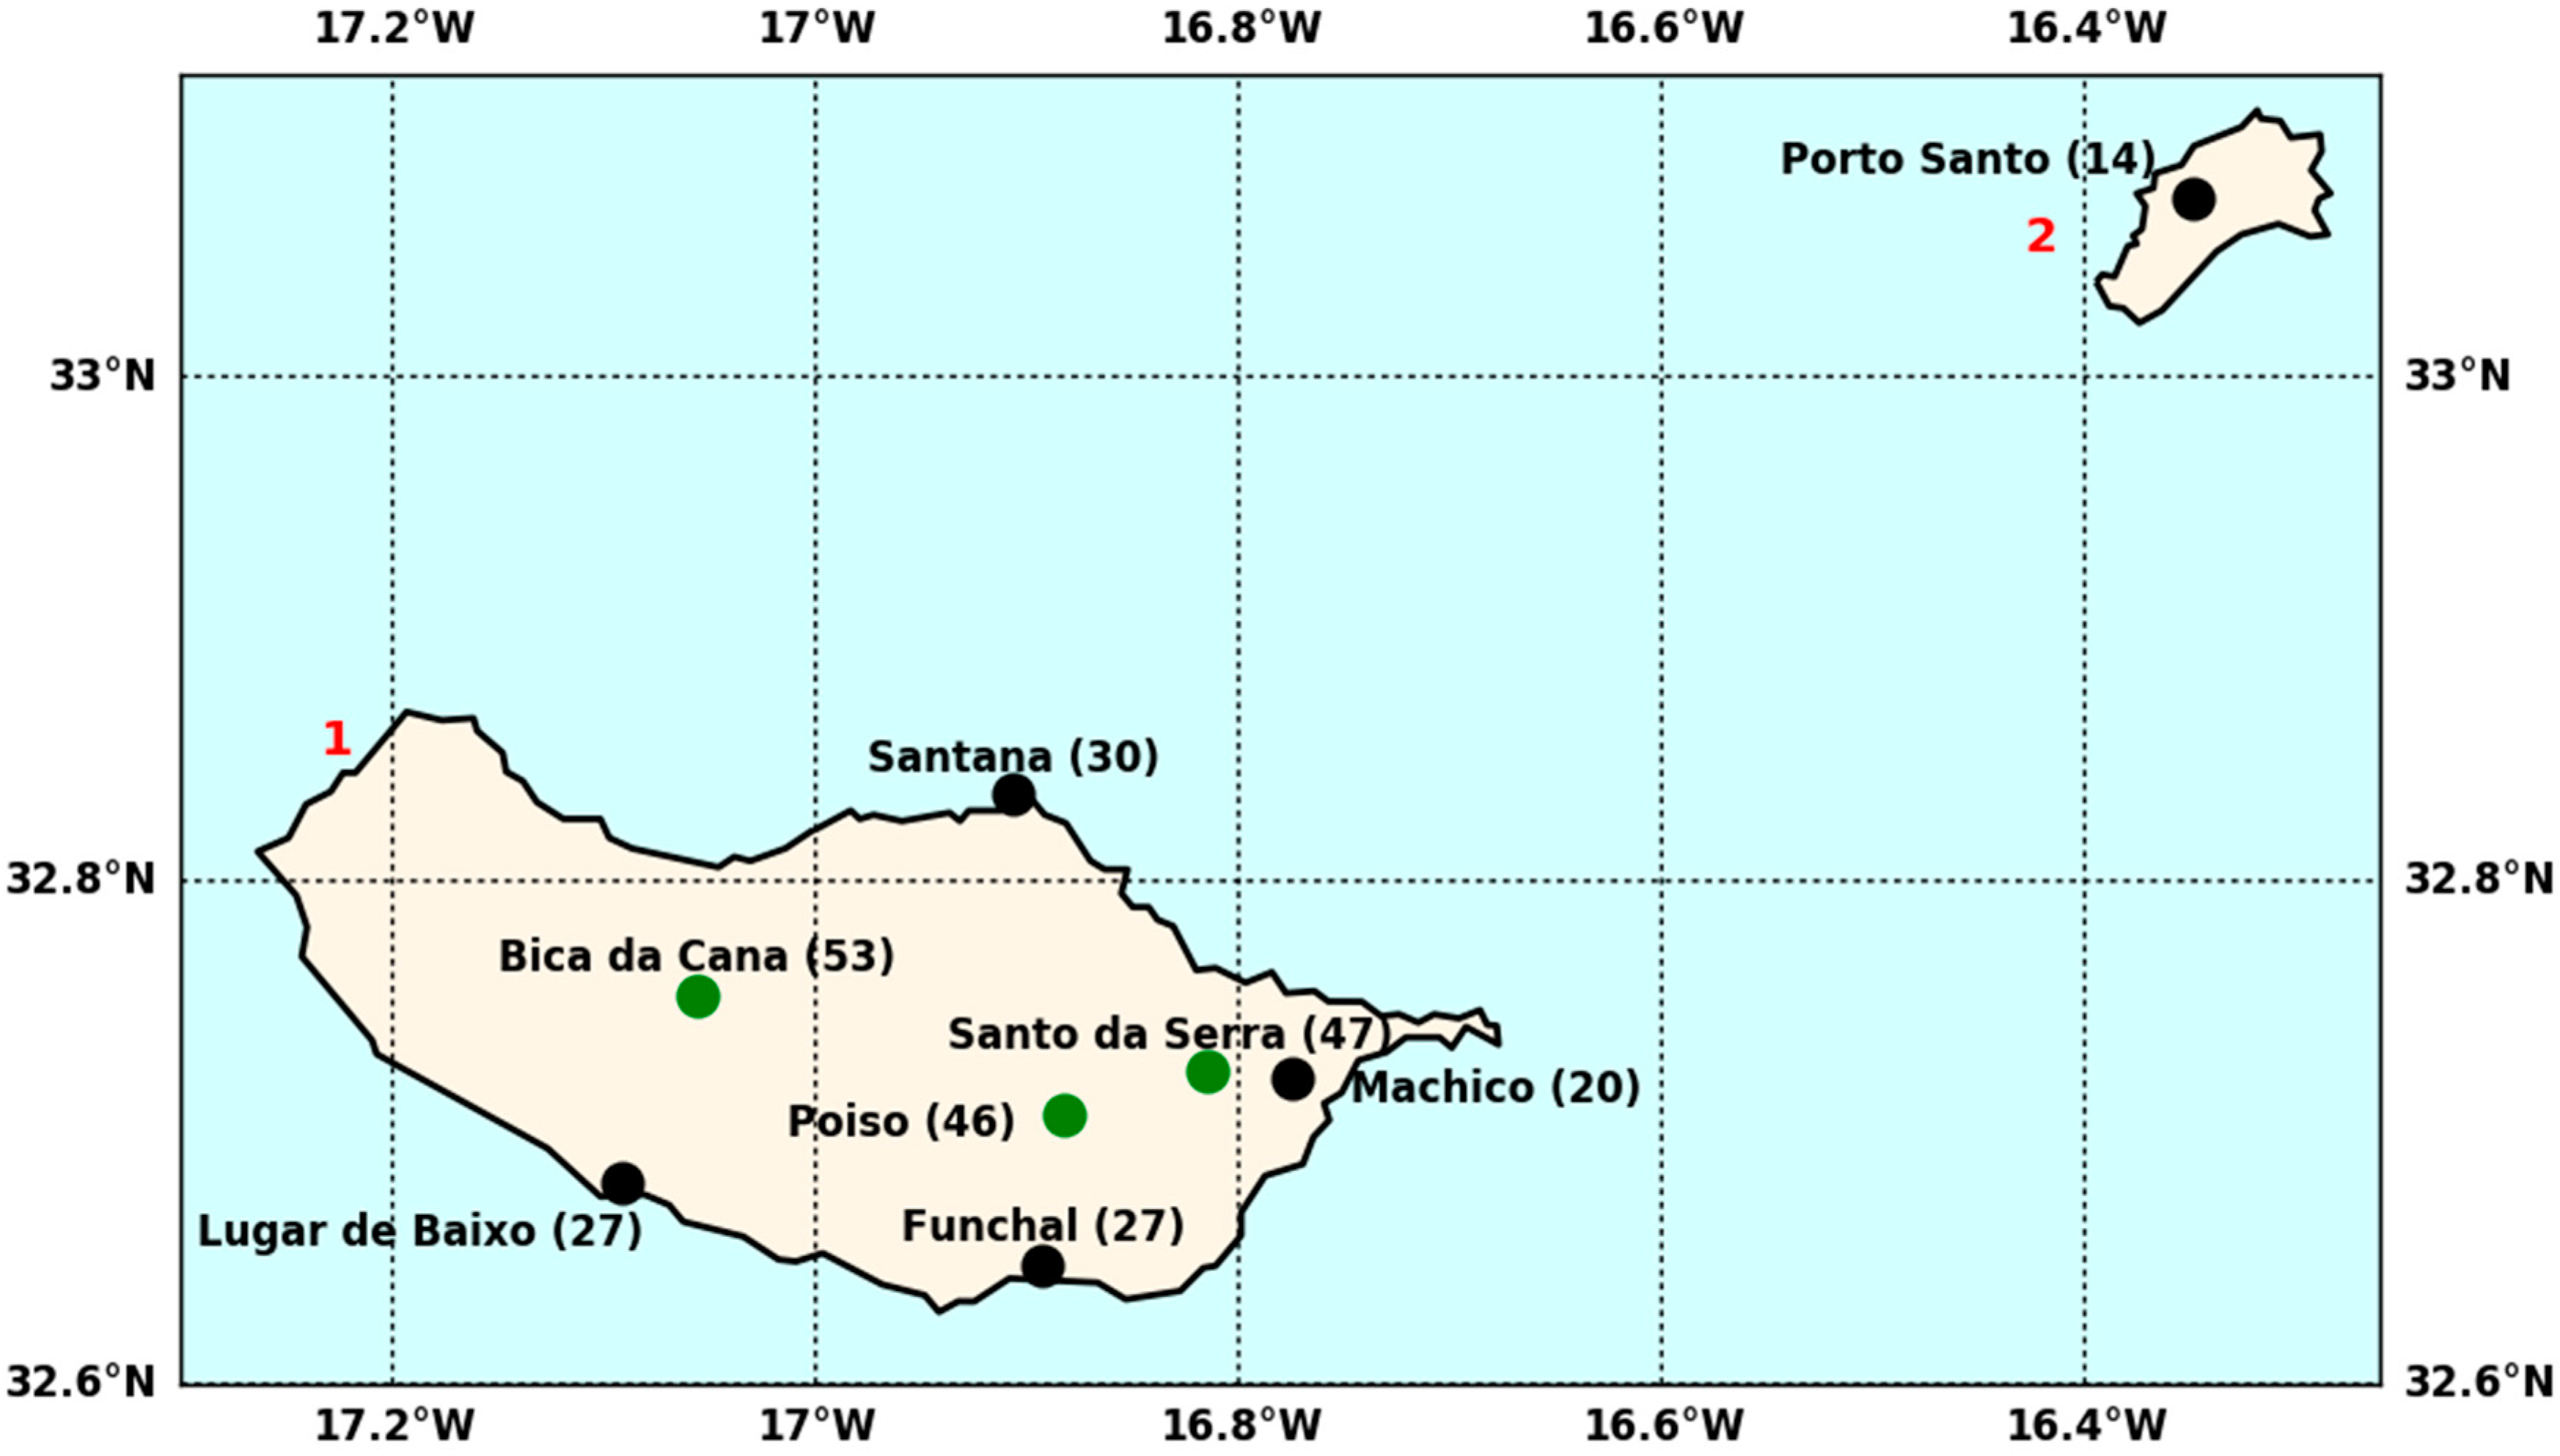
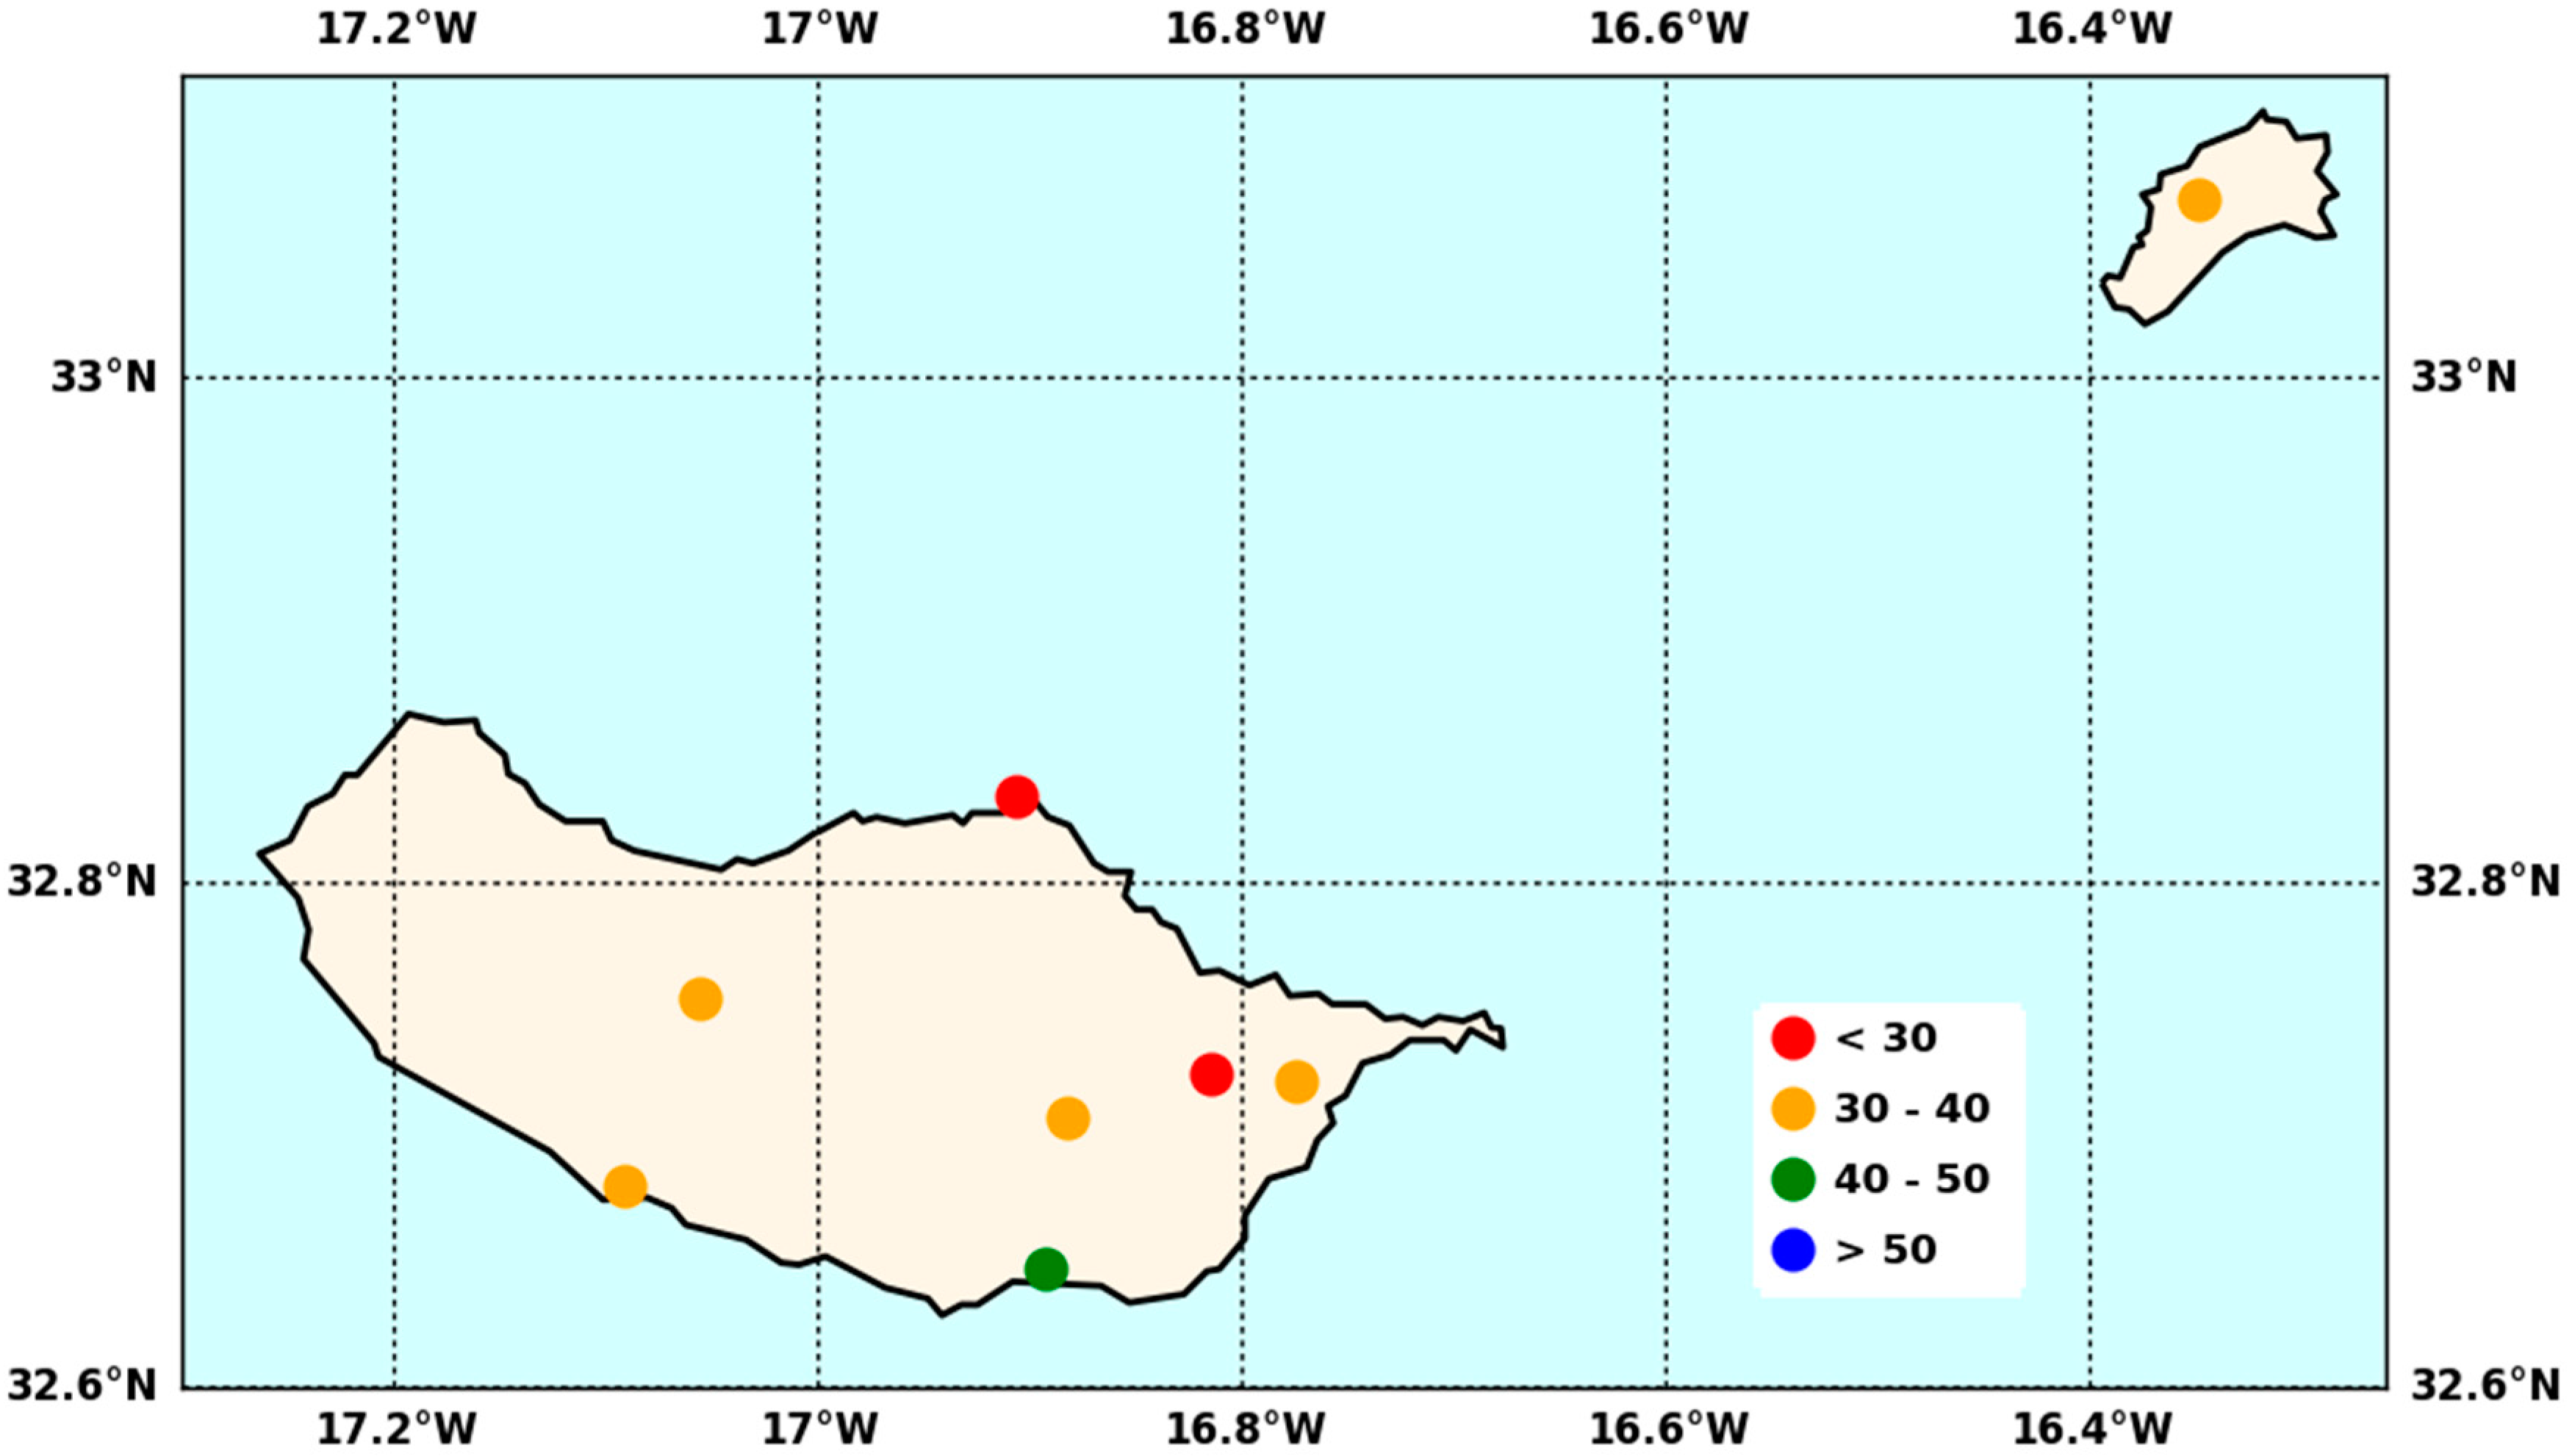
2.1.2. Madeira Archipelago

For the Madeira Archipelago (Figure 3, Supplementary Table S2) we have used eight weather stations (seven in Madeira Island and one in Porto Santo). In the case of the Madeira Islands, three weather stations are placed above 600 m—Bico da Cana (1582 m), Poiso (1360 m) and Santo da Serra (668 m), which are located in the centre of Madeira Island and the highest peak at 1862 m. The island has a mean altitude of 1220 m with a complex orography with steep terrain, and therefore the inclusion of stations at higher altitudes is particularly important to better characterise the impact of ARs.

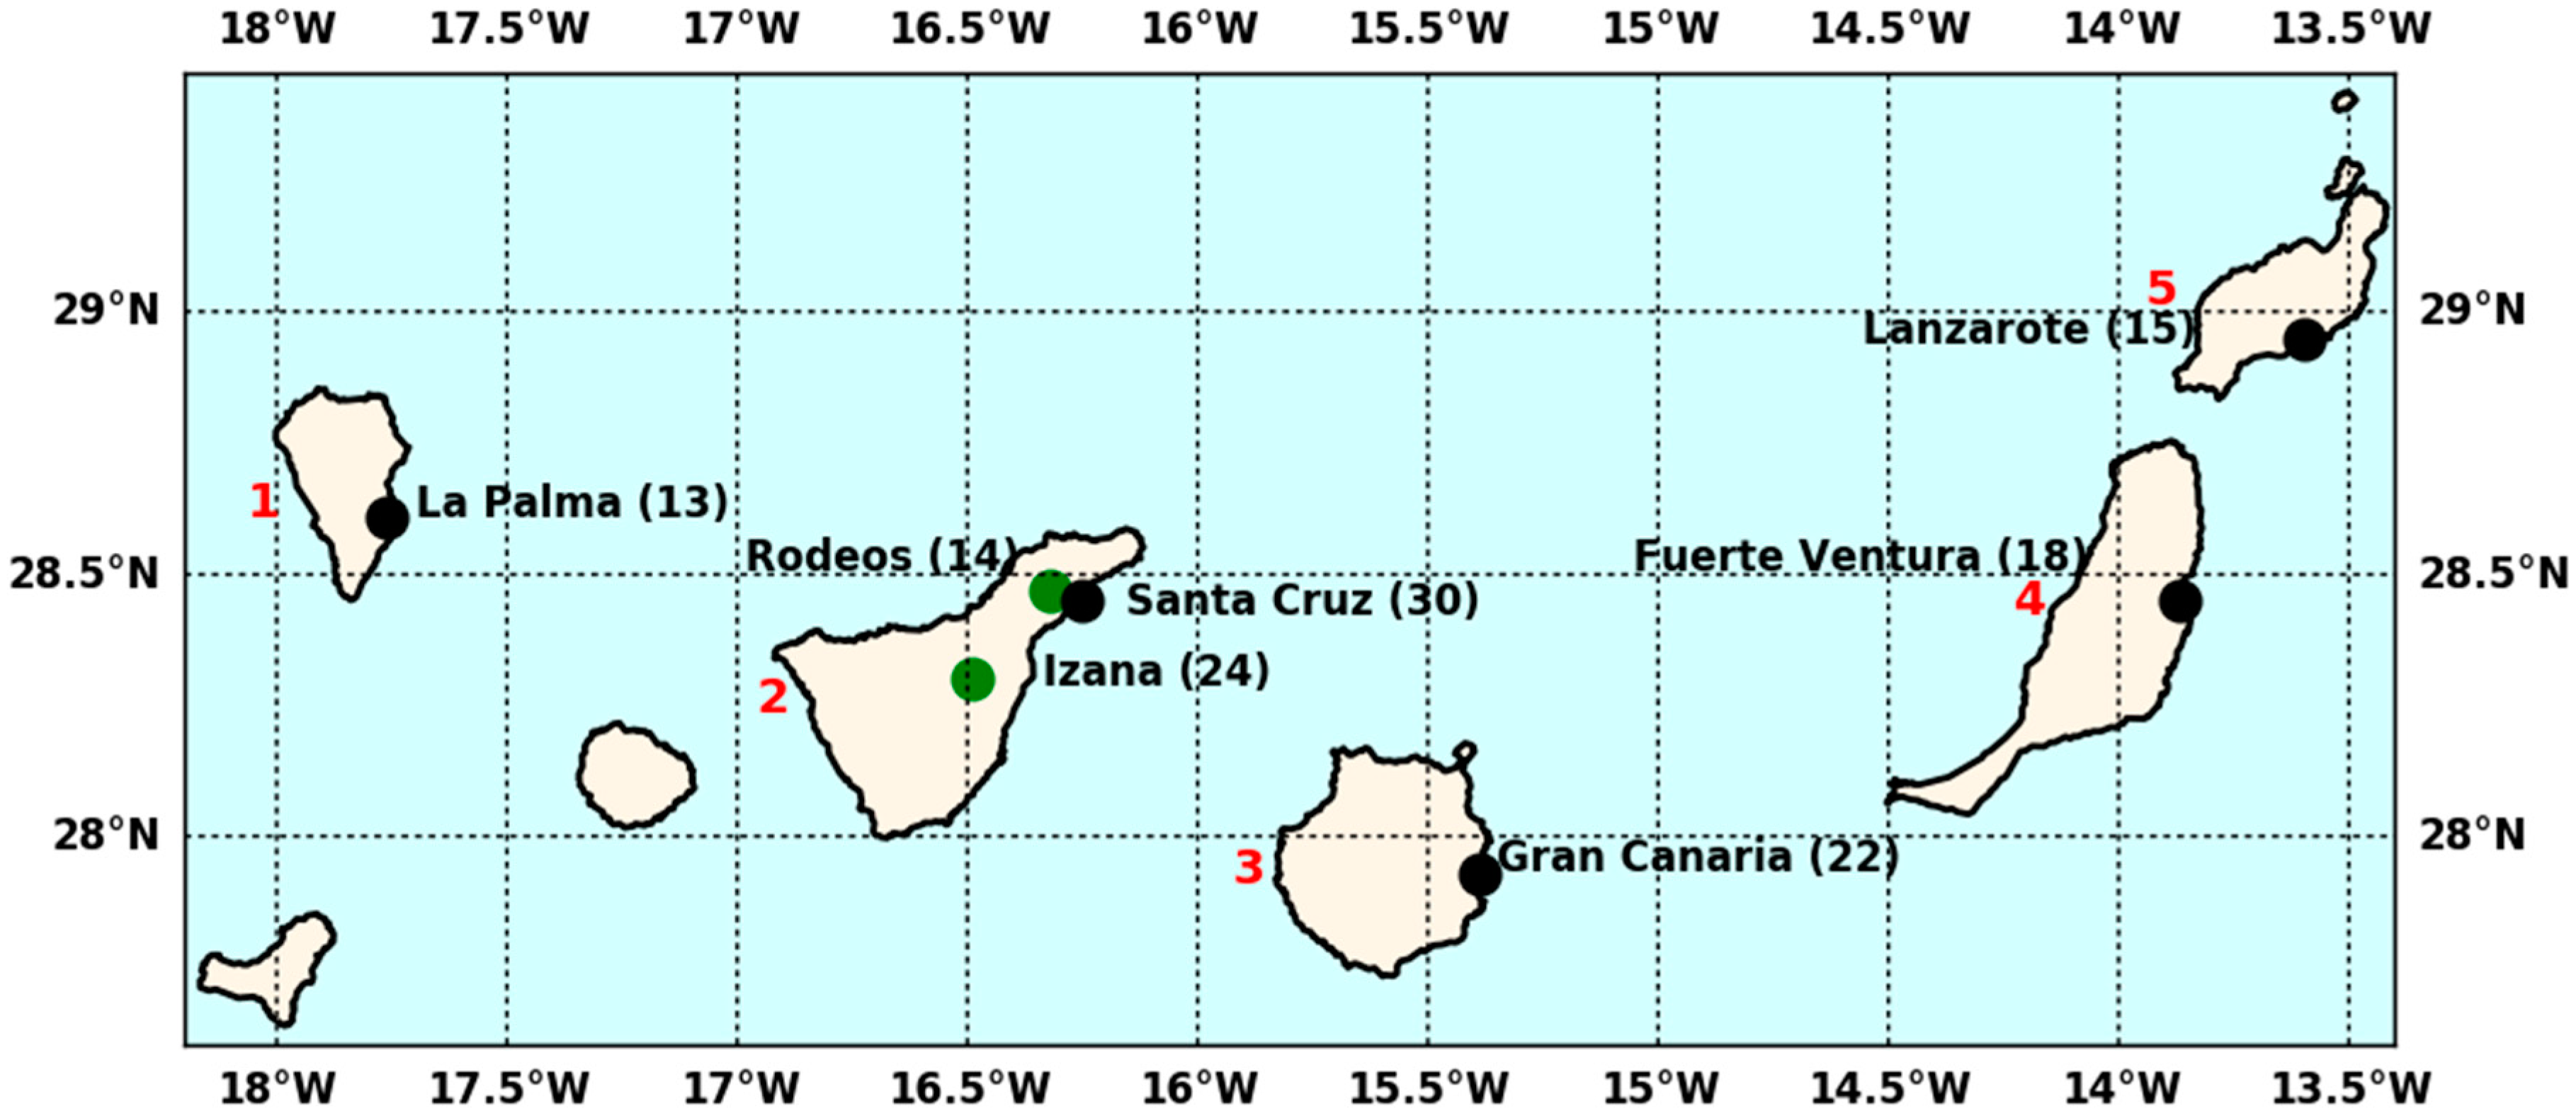
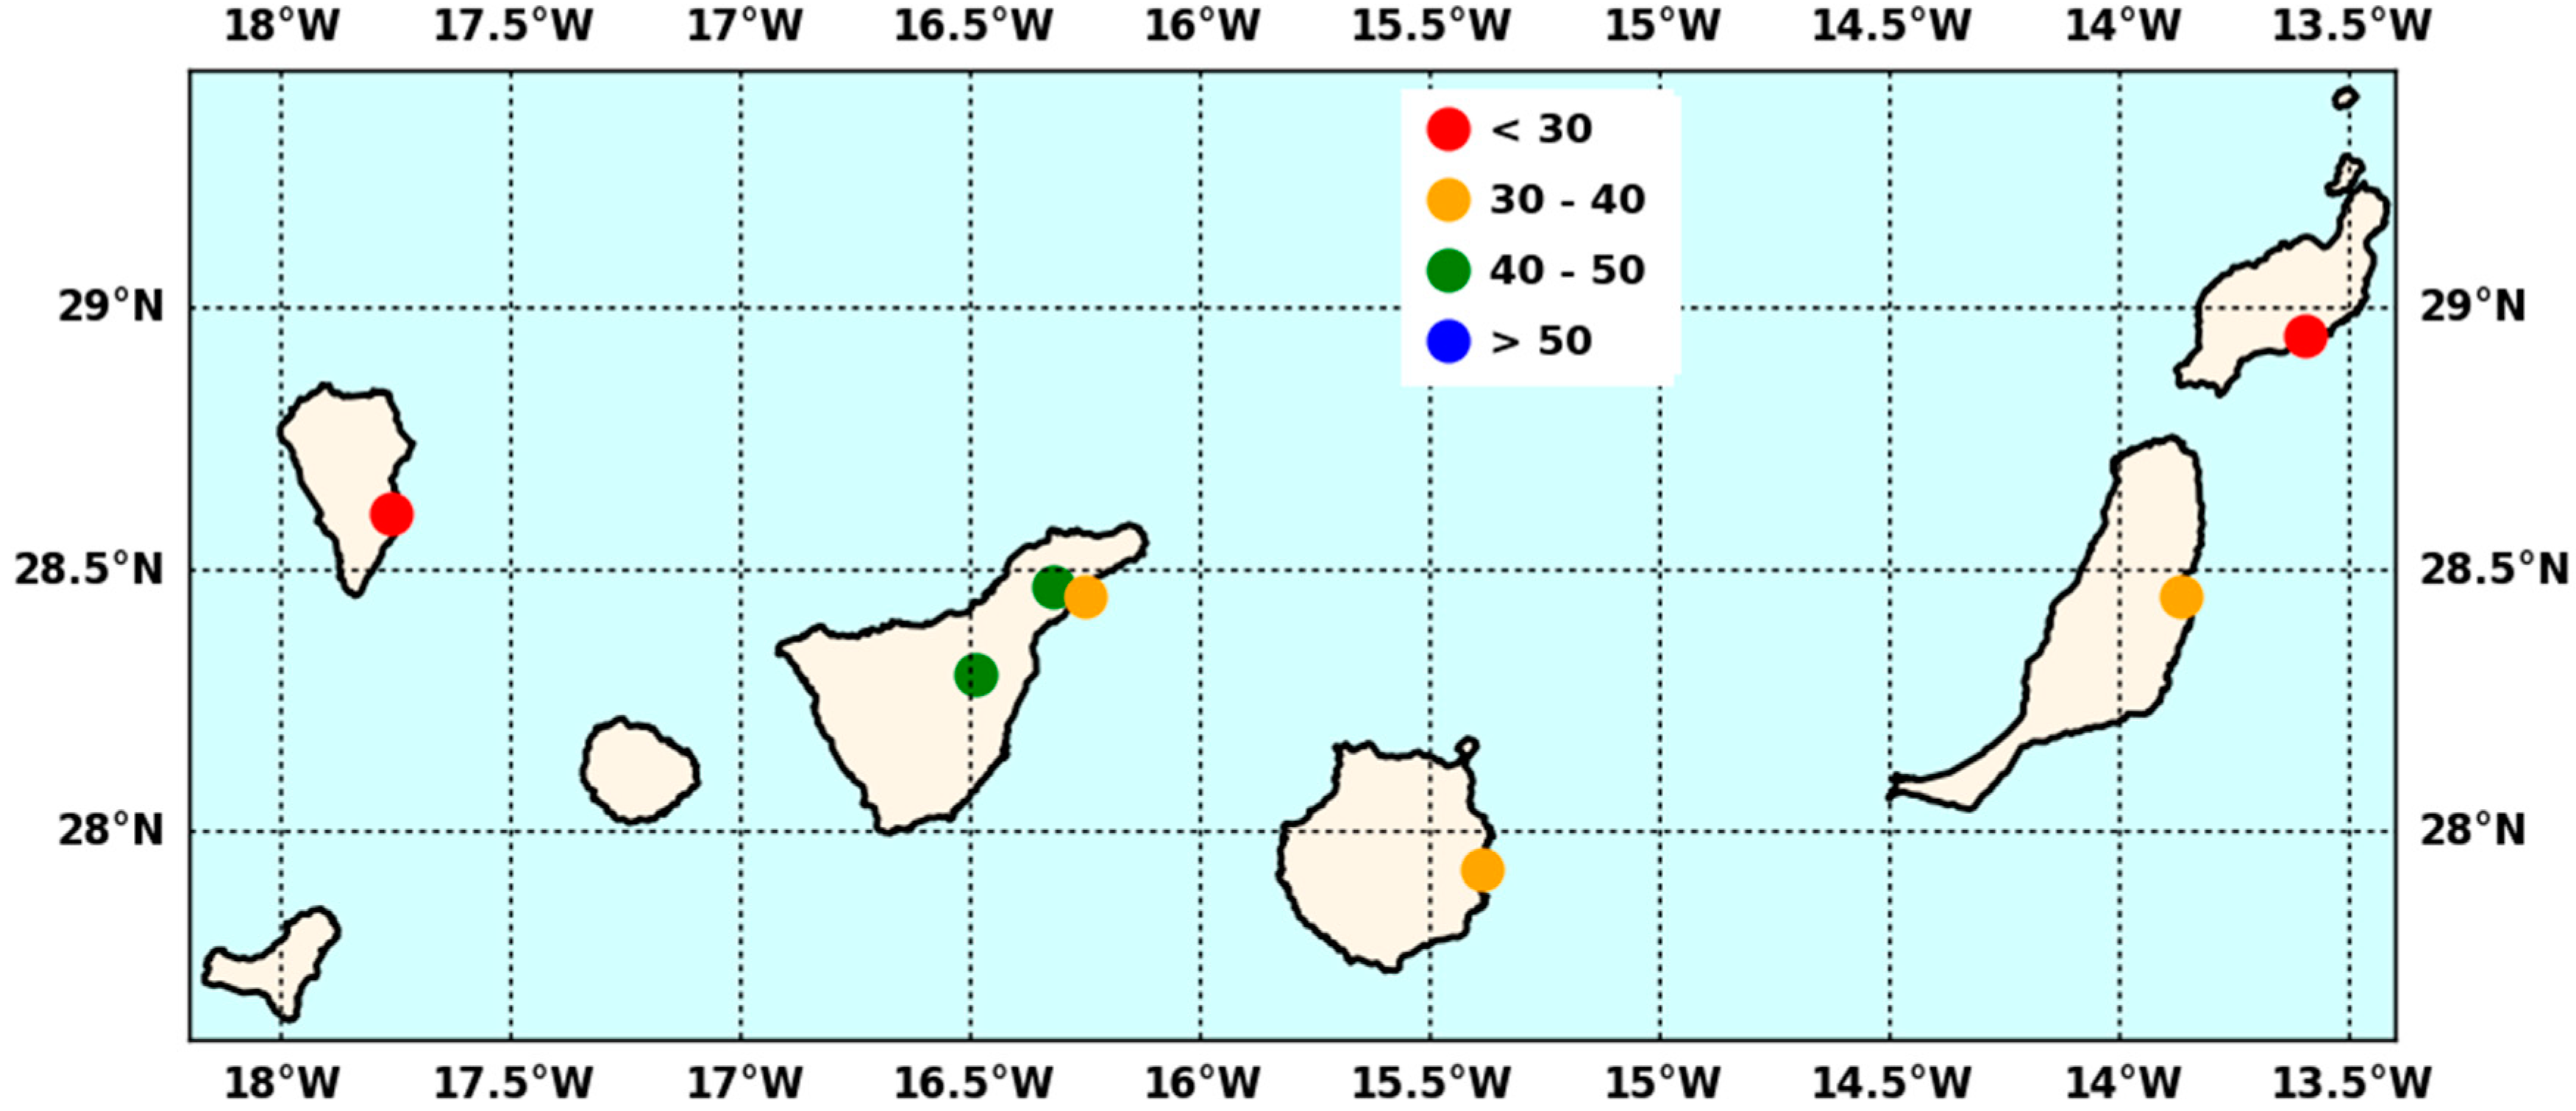
2.1.3. Canary Archipelago

Finally, the Canary dataset (Figure 4, Supplementary Table S3) consists of six weather stations from the five largest islands (La Palma; Tenerife; Gran Canaria; Fuerte Ventura and Lanzarote). Similarly to the Azores, most of the weather stations are located at the airports, namely in La Palma, Gran Canaria, Fuerte Ventura and Lanzarote. However, the Island of Tenerife is characterized by a large volcano mountain (Teide) with maximum height of 3718 m, and we had access to three weather stations (Santa Cruz, Izanã and Rodeos), where two of them are located above 600 m: Izaña (2367 m) and Rodeos (617 m).

2.2. Atmospheric Rivers Dataset

The ARs detection scheme developed at the global scale by [13] is used here. For this method, there is no need for a reference starting point to search for the ARs; instead, the method isolates contiguous regions of the world with enhanced vertically integrated horizontal water vapour transport (IVT) exceeding a certain IVT threshold (>85th percentile or 100 kg m−1 s−1, whichever is greater). Each of these regions are subsequently analysed to verify if they fulfil the geometry requirements of length >2000 km, length/width ratio >2 and other considerations indicative of AR conditions. For additional information regarding the methodology, please refer to [13]. The databases used here were kindly provided by these authors.
The global ARs database consists of four different sets, each one corresponding to the application of the method of [13] to four different reanalyses: (ERA-Interim with 1.5° × 1.5° spatial resolution; Climate Forecast System Reanalysis (CFSR) with 0.5° × 0.5° spatial resolution; Modern-Era Retrospective analysis for Research and Applications, Version 2 (MERRA-2) with 0.625° × 0.5° spatial resolution and NCEP/NCAR with 2.5° × 2.5° spatial resolution) between 1980 and 2010 for the winter extended months (October to March) at a six-hourly temporal resolution. The use of multiple reanalyses is advisable, instead of recurring to a single reanalysis, in order to ensure more robust results. In fact, unlike the large Mediterranean Islands, the European Macaronesian Islands are relatively small and therefore changes in the resolution of the reanalyses datasets, among others, could influence the results. It is also important to highlight that despite using two high resolution reanalyses (MERRA2 and CFSR), most of the islands in the different Archipelagos are not resolved by the four reanalyses, limiting the discussion regarding the impacts at higher altitudes [11,20] or even the AR axis orientation [21].

2.3. Relationship between Atmospheric Rivers and Precipitation

In order to extract the ARs that influence each island, we have located the nearest grid point of the different reanalyses datasets relative to the centre of each island. Afterwards, for each six-hourly time step between 1980 and 2010, we check if that grid point was classified as an AR, obtaining a list of days for each island that was under the influence of ARs.
Regarding the precipitation days, as mentioned in Section 2.1, we have divided the precipitation distribution for each weather station in deciles (ten equally spaced percentile bins, ignoring values below 1 mm/day). So the first decile bin would include the days that have precipitation between the 0 percentile and 9 percentile, while the second bin would include precipitation days falling between 10th percentile and 19th percentile, until the last decile bin which will include the most extreme precipitation days, i.e., days with precipitation ≥90th percentile. For each weather station, and for each decile bin, we cross-check the dates between the precipitation dates within each bin, and if they are associated to an AR day for each of the four reanalyses.
Finally, and due to the large amount of results, we have also computed the mean and the standard deviation of the four reanalyses for the most extreme days in the ≥90th percentile in order to summarise the most important results.

3. Results and Discussion

This section is organized into three main sub-sections. Section 3.1 provides a brief overview regarding the EPEs in the Macaronesian Archipelagos, while Section 3.2 focuses on the extended winter ARs frequency between 1980 and 2010. Finally, Section 3.3 summarises the relationship between ARs and EPEs, especially for the most extreme precipitation days (≥90th percentile).

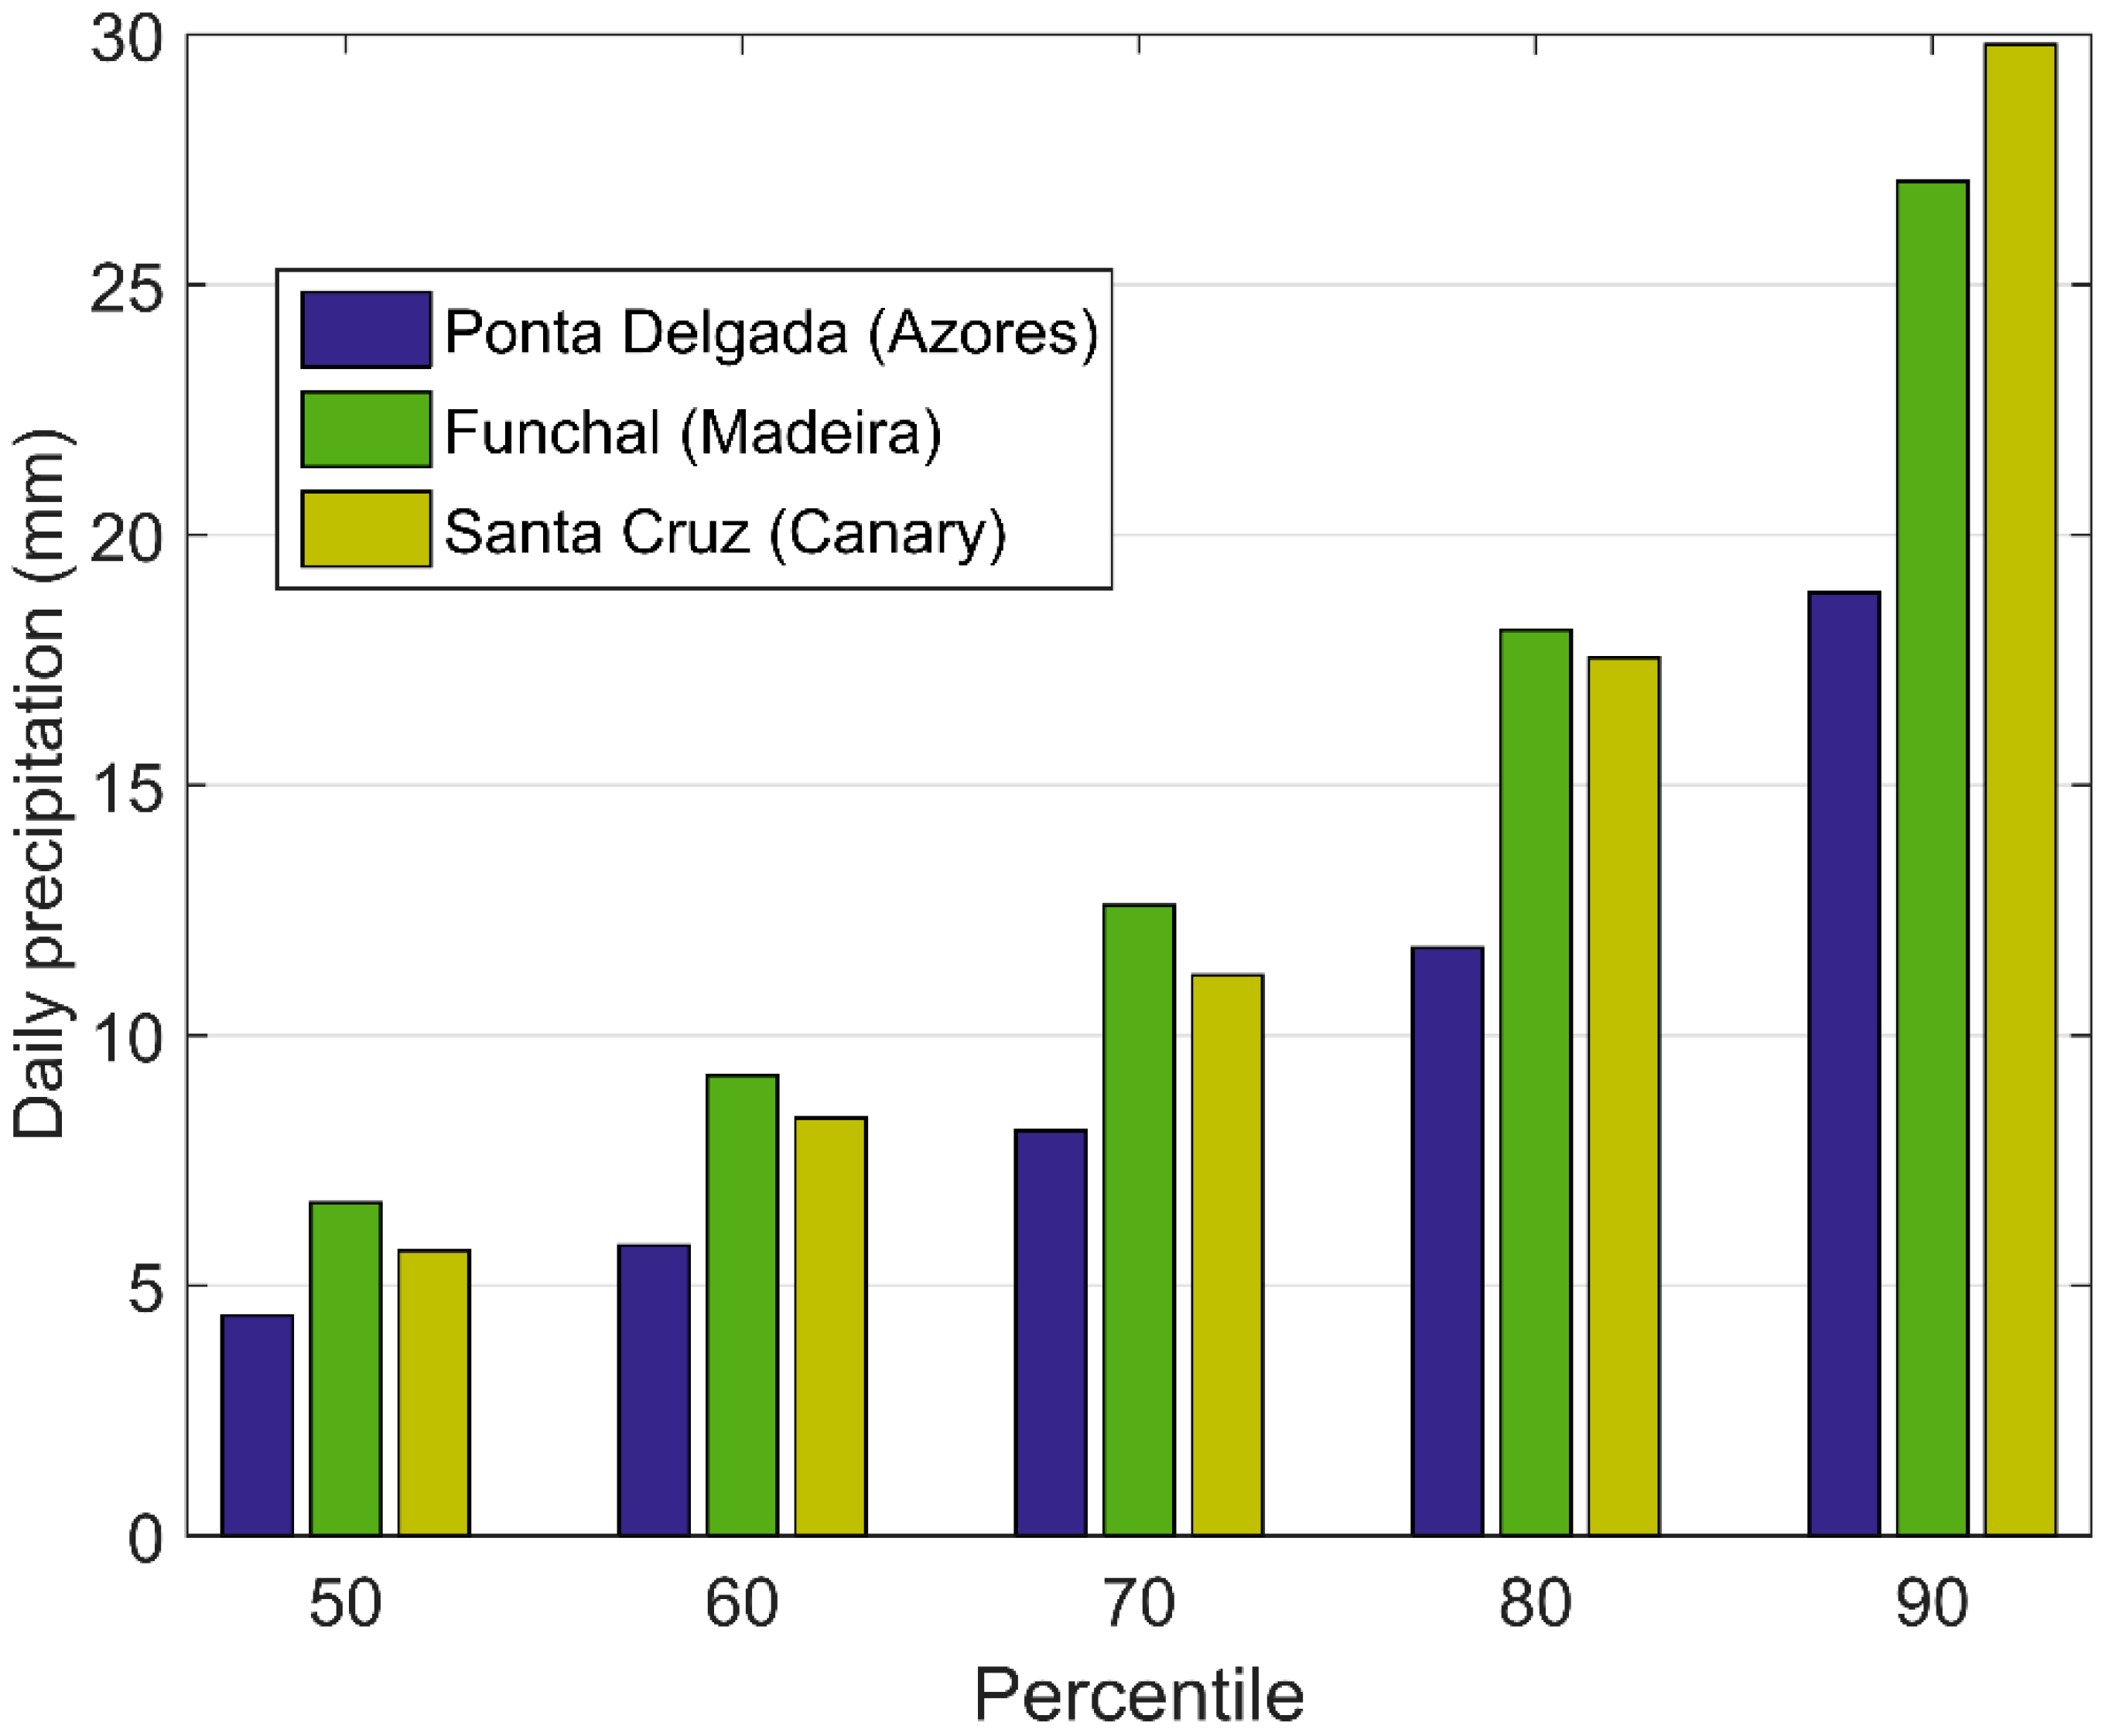
3.1. Precipitation Extremes

In order to give a sense of the magnitude of the EPEs in each of the weather stations, we have computed the deciles of the distribution, being divided into ten equally spaced bins. An example of the daily precipitation (mm) distribution of the 50th, 60th, 70th, 80th and 90th percentiles (respectively 5th, 6th, 7th, 8th and 9th decile) for three selected locations in each Archipelago (Ponta Delgada in Azores, Funchal in Madeira and Santa Cruz in Canary) are shown in Figure 5. One can see that for the extended winter (October to March), the 50th percentile (5th decile), which corresponds to the median of the distribution, is just short of 5 mm in Ponta Delgada, and slightly above 5 mm in Funchal and Santa Cruz.
As expected, when higher deciles are evaluated, it is possible to observe a substantial increase in the value of the precipitation. When analysing the 90th percentile (9th decile) there is a difference of more than 10 mm between Ponta Delgada (near 19 mm) and Santa Cruz (near 30 mm), probably due to the different nature of the EPEs occurring in each region [15]. While the Azores is located in the middle of the North Atlantic Ocean, and therefore its precipitation is associated with the main storm track [22,23], the location of the Canary, on the tropical region, is more prone to convective precipitation even in winter [24].
In order to synthesize the EPE information, we have included in Figure 2, Figure 3 and Figure 4 the information regarding the 90th percentile (in mm) of each weather station in brackets in its location. Regarding the Azores Islands (Figure 2), the 90th percentile of the precipitation distribution ranges from 16 mm in Graciosa airport (10 m) to 33 mm in Furnas, São Miguel (290 m). Regarding São Miguel and Terceira Island (where we have several stations), it is important to mention the orographic effect due to the volcano cones usually located in the centre of the island. These orographic features lead to generally higher values of the 90th percentile in locations with higher altitudes.
When analysing the Madeira Archipelago (Figure 3), a similar picture emerges with the orographic effect also playing a role on the 90th percentile of the precipitation distribution. While the higher altitude locations have values for this percentile that vary between 46 mm and 53 mm, the locations near the coast reveal lower values between 27 mm in the southern coast and 30 mm in the northern coast, with the lowest value being found in Machico (20 mm).
Once again, the vast majority of the weather stations in the Canary (Figure 4) are located near sea level, with the exception of Izaña and Rodeus (>600 m), located in the Tenerife Island. In this case, the 90th percentile of the precipitation distribution is relatively low in La Palma, Lanzarote and Fuerte Ventura with values below 20 mm. Regarding Tenerife, the direct effect of orography seems not to play a role when analysing the 90th percentile at higher altitude locations of Izaña (14 mm) and Rodeus (24 mm) when compared with Santa Cruz (30 mm), probably due to Izaña and Rodeus being located downstream of the Vulcano Teide, and therefore in the shadow and protected from the warm and humid winds from the west and north-west.

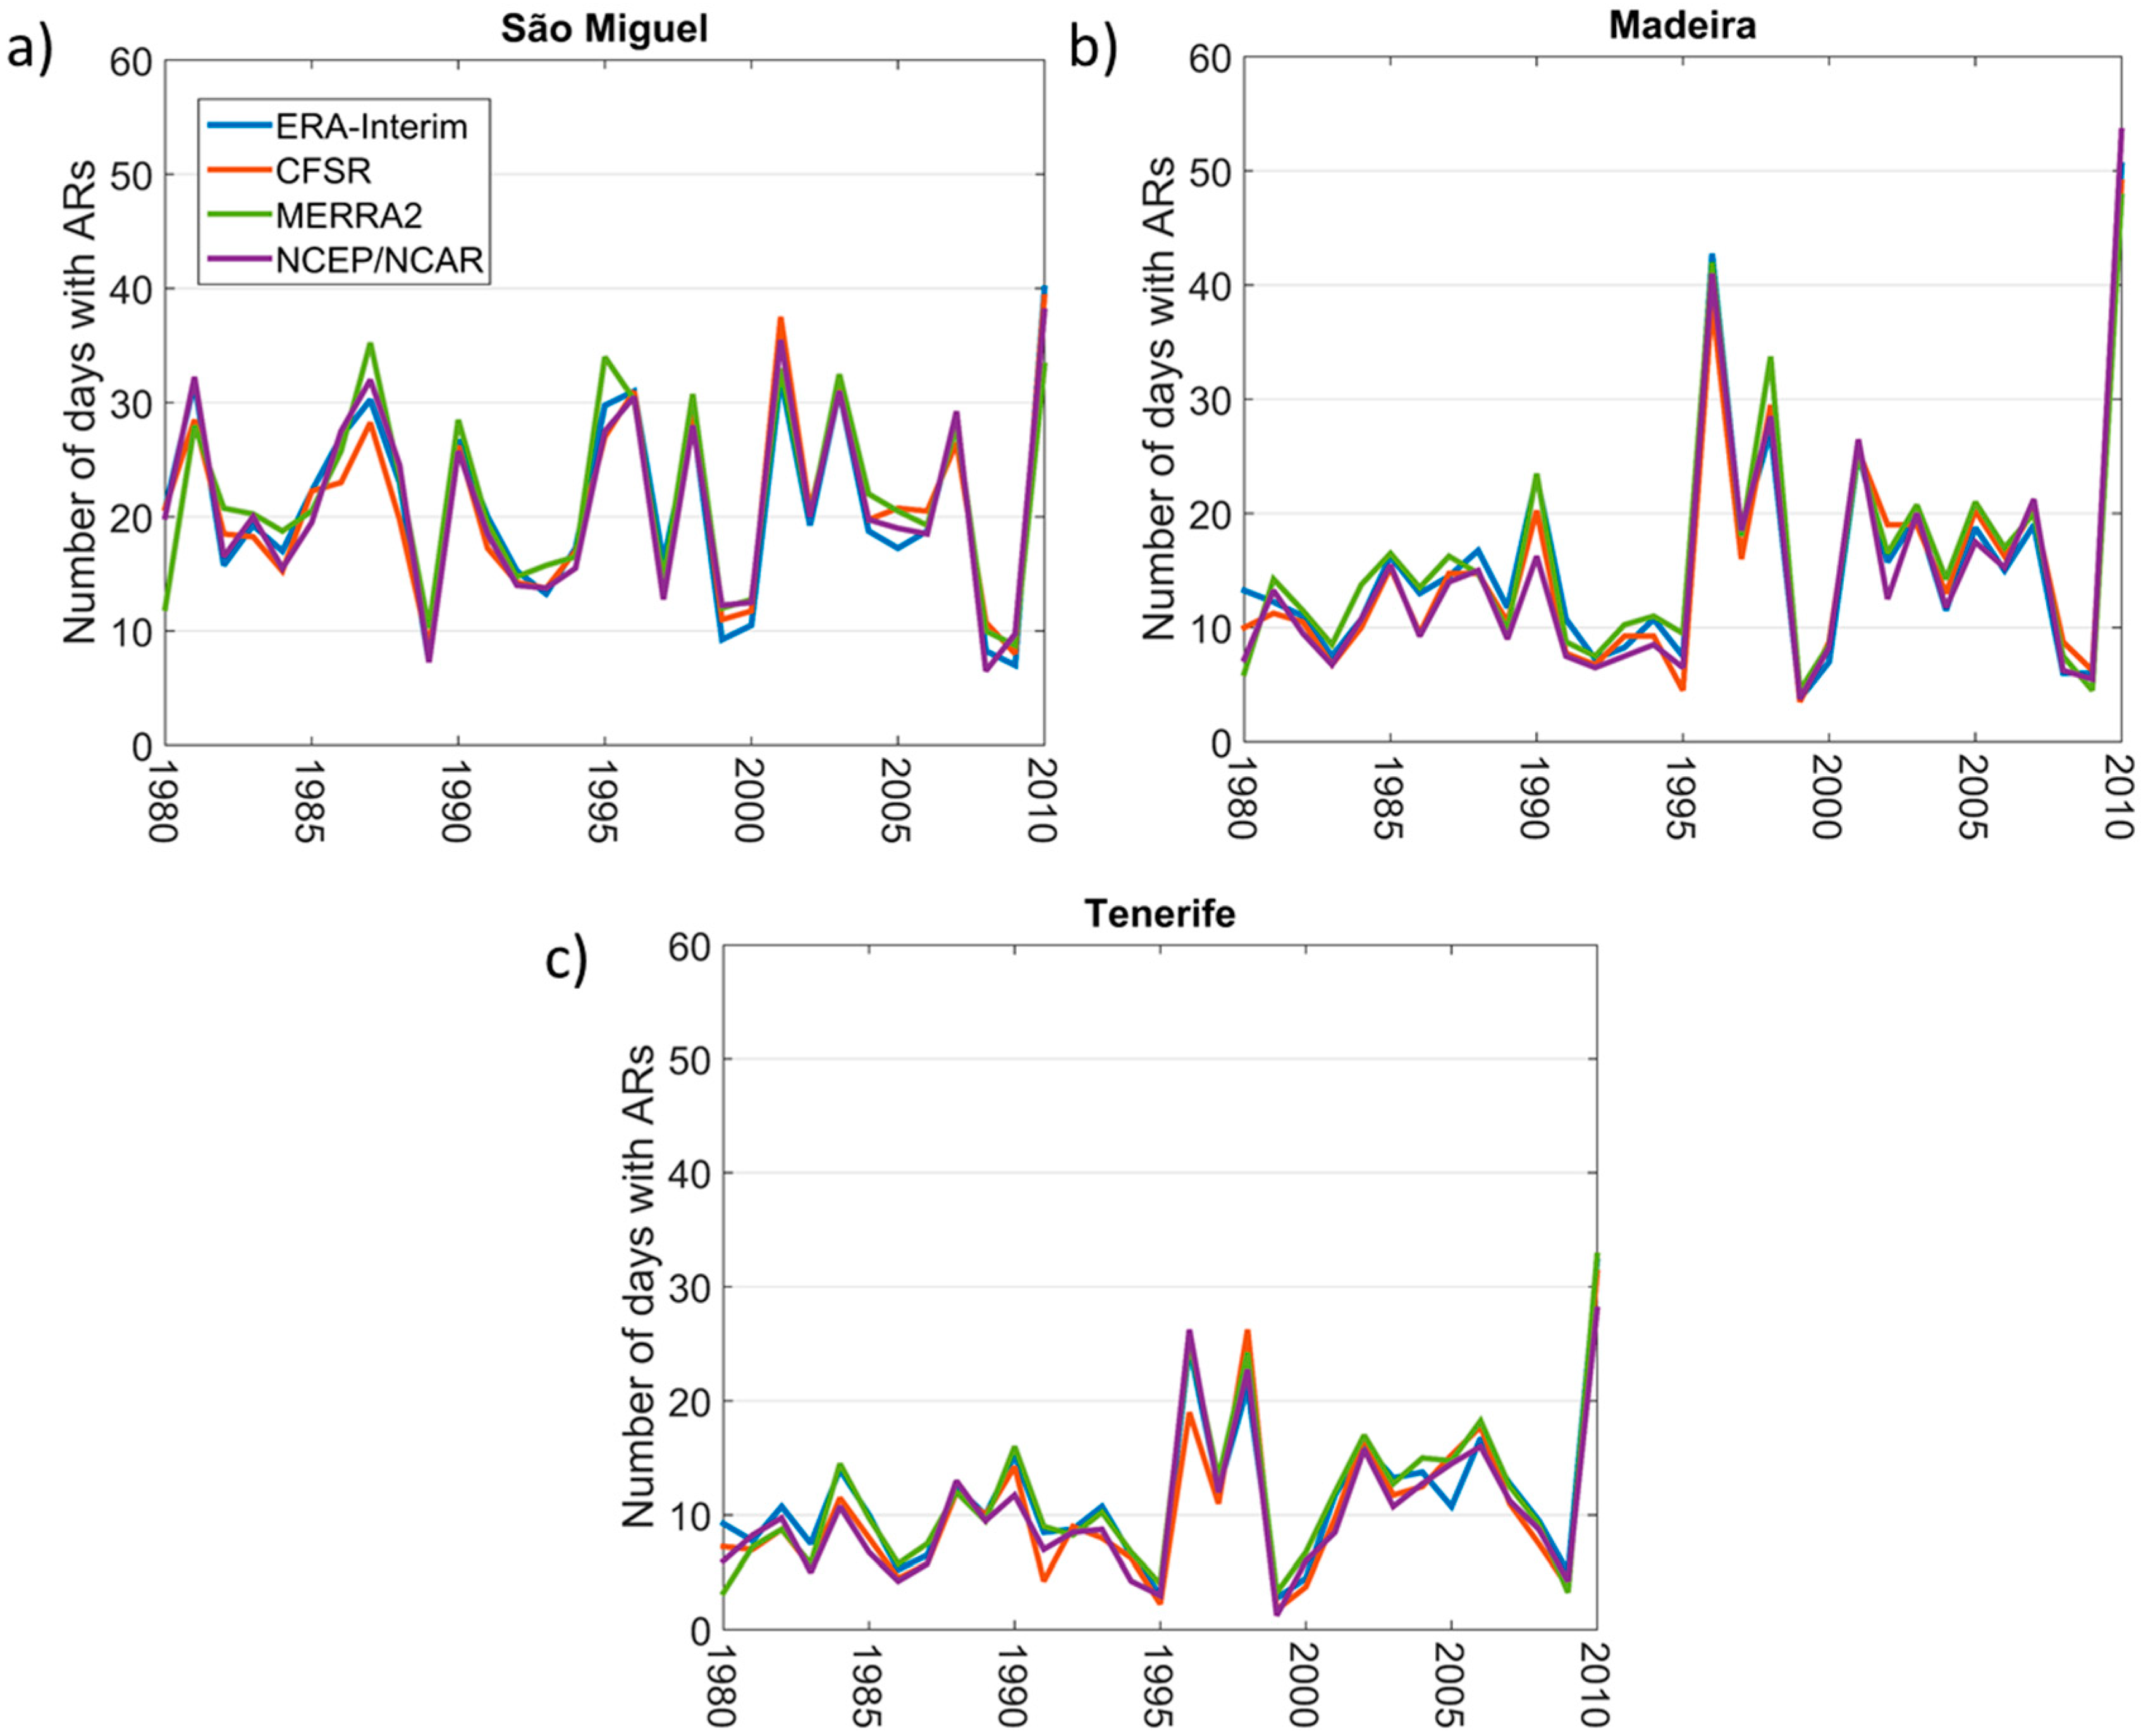
3.2. Atmospheric River Frequency

For each island, we have extracted the number of AR time steps relative to each reanalysis, taking into account the closest point of each gridded dataset to the corresponding island (see Section 2.3). In order to evaluate the number of days under the influence of ARs, the number of AR time steps was divided by four (corresponding to six-hourly time steps). For the sake of simplicity, the time evolution of the results from the winter months is summarised in Figure 6 for the islands of São Miguel, Madeira and Tenerife. On average, São Miguel presents a higher frequency of AR days compared to both Madeira and Tenerife.
It is possible to observe strong inter-annual variability on the occurrence of ARs for all three islands, with a maximum/minimum spanning between circa 10 and 40 AR days for the extended winter months (180 days) in São Miguel Island, corresponding approximately to 5.5% to 22% of the winter days. For the eastern Archipelagos (e.g., Madeira and Tenerife), the inter-annual variability is also noticeable, with a clear ARs maximum activity in the 2010 extended winter peaking to near 45 in Madeira (25% of the winter days) and near 40 AR days in Tenerife (40% of the winter days).
Moreover, when analysing the results of Figure 6 and Table S4, it is possible to state that the distinct spatial resolution of the four different reanalyses (ERA-Interim (blue line); CFSR (red line); MERRA2 (green line) and NCEP/NCAR (purple line)) may influence the frequency of the AR frequencies, not only in the example given in Figure 6, but also at the different islands of the Archipelagos (Table S4). A closer look at Table S4 shows that for the Azores Archipelago, the ARs mean frequency using the NCEP/NCAR reanalysis is in the same range as for the other three reanalyses. However, in the Madeira and Canary Archipelagos, the ARs mean frequency is lower than the results obtained with the other three reanalyses. Therefore, the coarsest grid resolution of the NCEP/NCAR seems to have more impact in the ARs frequency at the southern Archipelagos (Madeira and Canary) than in the northern Archipelago (Azores).
The influence of large scale teleconnections and other climate variability factors on the frequency of ARs over the Macaronesian Islands have not been studied in detail. However, over southern (northern) Europe during the negative (positive) phase of the North Atlantic Oscillation (NAO), there is an increase in the number of ARs [9,10]. In contrast, Ramos et al. [11] showed that the NAO pattern is not correlated with the number of ARs over the Iberian Peninsula but, instead, it is significantly associated with the East Atlantic (EA) pattern. Regarding the precipitation in the European Macaronesian Islands, Cropper and Hanna [15] show that the winter NAO correlates negatively with precipitation across the Azores, Madeira and western and central Canary Islands. In addition, Cropper [14] show that not only do the teleconnection patterns play a role in the climate of the European Macaronesian Islands, but also the semi-permanent Azores subtropical high-pressure system, trade winds and also (extra-/sub-) tropical storms.

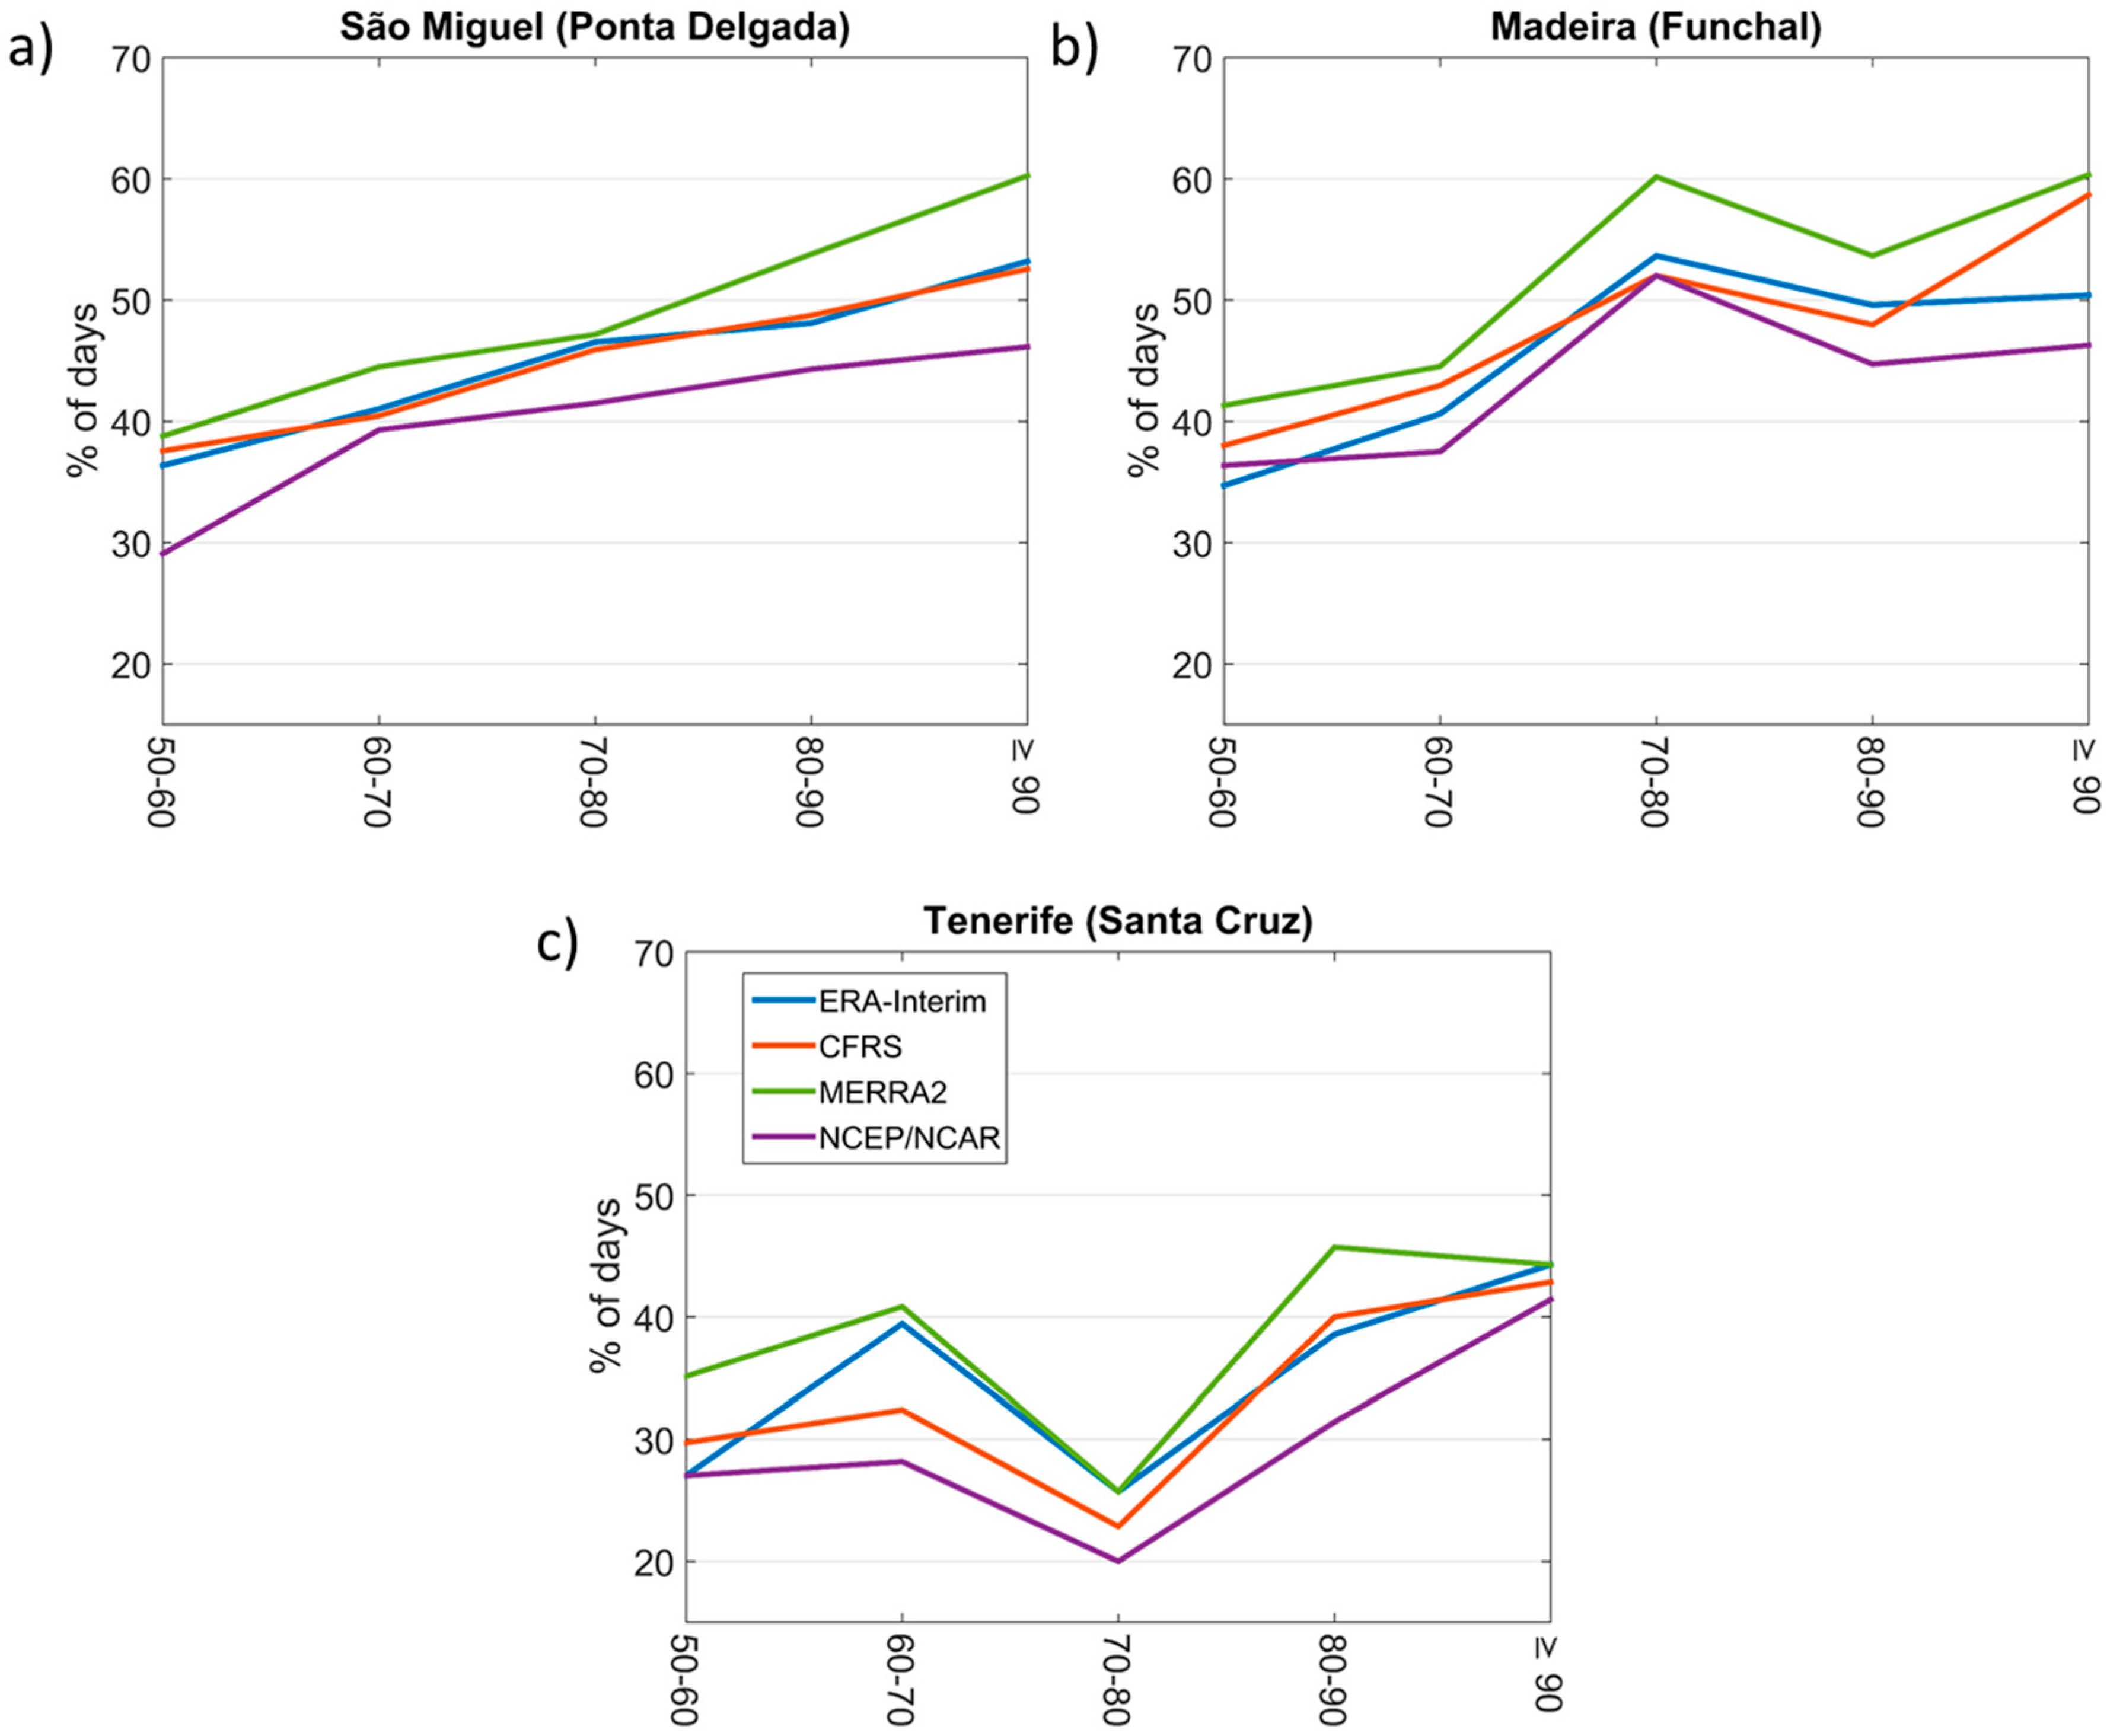
3.3. Influence of Atmospheric Rivers on Extreme Precipitation

The relationship between ARs and EPEs is analysed for each individual weather station, taking into account the closest grid point of each reanalysis and applying a similar analysis to the previous works developed by some of us for Iberia [11] and South Africa [25]. To do so, we associate the ARs occurrence and the precipitation in the 31 weather stations of the three Archipelagos (see Section 2.3) for the top decile precipitation bins, starting on the 6th decile (50th–59th percentiles) and concluding in the most extreme precipitation days in the last decile (≥90th percentile). Due to the huge amount of results obtained using the many different datasets (31 weather stations times four reanalyses), we made an effort to synthesize without compromising the main results. Therefore, we focus on a representative example for three selected weather stations located in the three different Archipelagos (Figure 7): Ponta Delgada in São Miguel (Azores); Funchal in Madeira Island and Santa Cruz in Tenerife (Canary).
For Ponta Delgada in São Miguel Island (Azores, Figure 7a), the analysis shows that in the 6th decile bin, the percentage of precipitation days associated with ARs occurrence falls between circa 30% (NCEP/NCAR) and 40% (ERA-Interim, CFRS and MERRA2). These values increase steadily for the higher decile (≥90th percentile) bin of precipitation, reaching values ranging from 45% (NCEP/NCAR) to 60% (MERRA2) of the most extreme precipitation days being associated with ARs.
A similar analysis performed for the Funchal station (Madeira, Figure 7b) depicts a similar level of impact of ARs on extreme precipitation to the Ponta Delgada in São Miguel, with values up to 60% in the last decile (≥90th percentile). As for Ponta Delgada, it must be stressed that the results for Funchal are partially dependent on the use of different reanalyses, especially in the last decile bin, with values ranging from 45% in the NCEP/NCAR to 60% in the MERRA2.
In the case of Santa Cruz in Tenerife (Canary Archipelago, Figure 7c), the relationship between ARs and precipitation is lower than that found for both Ponta Delgada and Funchal. However, an overall similar increasing dependence of precipitation for higher deciles is also observed. A weak relationship between ARs and precipitation is found for the lower deciles, and a stronger relationship is found for the higher deciles. Values vary between 30% in the lower decile bins and can reach values over 50% in the bins with the highest precipitation days in the last decile (≥90th percentile).
From the analysis of Figure 7 and from the results of the remaining islands (not shown), it is apparent that the NCEP/NCAR reanalysis have, in general, a slightly lower correspondence between EPEs and AR days. This can be related to the coarser resolution of the NCEP/NCAR reanalysis when comparing to the other three reanalyses. On one hand, we have a lower frequency of AR days in the NCEP/NCAR reanalysis, especially on the Madeira and Canary Archipelagos as discussed in Section 3.2. On the other hand, the finer resolution reanalyses allow for grid points closer to the respective islands. The mean distance of the closest grid point to the island shows that the NCEP/NCAR presents the highest distance between them (~116 km), while the CFSR (~17.4 km) and the MERRA2 (~18.5 km) presents the lowest distance. Therefore, the use of a coarse resolution reanalysis like NCEP/NCAR may influence the results both in terms AR frequency (lower frequencies), as well as a worse representation of the ARs that strike each island, since the closest grid point analysed is located further from the island when compared with higher resolution reanalysis.
In order to summarise the main results, we have computed for each weather station the mean percentage of days (Figure 8, Figure 9 and Figure 10) and the respective standard deviations (Supplementary Figures S1–S3) associated with ARs using the all reanalyses for the most extreme precipitation days (≥90th percentile), allowing us to synthesize without compromising the main results.
Regarding the Azores Archipelago (Figure 8), the association between ARs and EPEs (≥90th percentile) is higher, with values in the range of 30% and >50% of the days. Focusing on the central group (Figure 8a), for Faial, Pico and a couple of locations in Terceira, more than 50% of extreme precipitation days are associated with ARs. However, for all other locations, the impact of ARs remains below 40%. On the western group (Figure 8b), the values attained in Corvo and Flores are in line with the ones found for the central group. Regarding the eastern group (Figure 8c), the importance of the ARs in the EPEs seems to be higher in Santa Maria (>50%) but somewhat lower in the main island of São Miguel, with values always below <50% of the days with ARs.
A similar analysis performed on the Madeira Archipelago (Figure 9) reveals that the impact of the ARs for the extreme precipitation days (above the 90th percentile) is significantly lower when compared with the Azores. In this case, the percentage of extreme days associated with ARs always remains below 50%, with the highest value being found for Funchal (between 40% and 50%). The higher altitude stations of Bico da Cana and Poiso have their values ranging between 30% and 40%, while the northern locations present values below 30% on the days associated with ARs.
Finally, the results for the Canary Islands are shown in Figure 10, where the range of results is similar to those obtained for Madeira. For both islands of La Palma and Lanzarote, results show that the ARs importance reduces to less than 30% of extreme precipitation days, while for Gran Canaria and Fuerte Ventura, this value stays between 30% and 40% on those days. Focusing on Tenerife Island, where three datasets from three stations are available, results show that the higher altitude locations of Rodeus and Izana present the highest values in terms of importance of ARs in EPEs (between 40% to 50%) not only in Tenerife, but also when compared with the other locations in the Canary Archipelago. In this case, it seems that the effect of orography plays a relevant role since Rodeus (617 m) and Santa Cruz (36 m) are only a few km apart.

4. Conclusions

The main goal of this work was to evaluate the impacts of ARs in EPEs on the European Macaronesian Archipelagos between 1980 and 2010 for the extended winter months (October to March). To achieve this objective, we have used daily precipitation series covering most of the islands of the three Archipelagos in order to access the dates where EPEs occurred, taking into account the decile bins. Moreover, four AR global databases [13] corresponding to the different reanalyses were used: ERA-Interim; CFSR; MERRA2 and NCEP/NCAR between 1980 and 2010 at a six-hourly temporal resolution.
The number of ARs that strike each Archipelago is different, with higher frequencies in the Azores and lower frequencies in the Madeira and Canary Islands. The Azores are located in the middle of the North Atlantic basin, being often affected by the passage of cold fronts associated with the storm track in the North Atlantic [26]. Since the ARs are usually associated with the low-level jet stream ahead of the cold front of an extratropical cyclone [5], they can therefore be highly relevant when explaining most EPEs.
Regarding the Madeira and Canary Archipelagos, the frequency of ARs is relatively lower when compared with the Azores due to the fact that the storm track is weaker than the one found in the Azores sector whatever the storm track climatology used [27]. In addition, given its southern location, both Archipelagos are also under the influence of other synoptic systems that can be responsible for intense precipitation, including mesoscale convective systems or cut off low systems [28]. Nevertheless, it was shown by [16] that for a 10 year period (September 2002 to November 2012) in the Madeira Islands, the ARs sometimes contribute to the occurrence of EPEs with high socio-economic impact (e.g., [29]).
EPEs in Western Europe during the extended winter months have major socio-economic impacts such as floods, landslides, extensive property damage, and loss of lives (e.g., [1,3,9,10,11,12,30,31]). Regarding the European Macaronesian Archipelagos, no comprehensive characterisation studies have been done until now between ARs and EPEs.
We then investigated the relationship between ARs and EPEs between 1980 and 2010 on the European Macaronesian Islands. Regarding the Azores, our results are novel and clearly indicate that the presence of ARs plays a major role in explaining the occurrence of EPEs, particularly in the central and western groups.
Regarding Madeira, our results confirm those found by [16], namely that the island is sometimes struck by an AR capable of producing EPEs, especially for the capital city of the island (Funchal). The inter-annual variability of AR frequency also shows that the winter of 2010 was highly unusual for the Madeira, with many more ARs than the usual range of variability. In addition, the 2010 winter was also one of the wettest in Madeira, culminating with the ARs event in February 2010 that was responsible for numerous landslides and flash flood events in the urban area of Funchal, provoking a death toll of near 50 [16,29].
In the case of the Canary Archipelago, the results obtained are in line with those found for Madeira. However, when analysing the different locations on Tenerife Island, the importance of the ARs in explaining the EPEs is clearly stronger in stations located at higher altitudes (Rodeos and Izana) then in Santa Cruz, probably due to the orography effect associated with these stations.
To conclude, we have developed here the first systematic assessment of the influence of the ARs in the EPEs in the European Macaronesian Islands between 1980 and 2010. This study intends to shed light on quantifying to what extent EPEs observed in these Islands are associated with ARs. This is relevant when analysing past and present EPEs with wide socio-economic impacts in the European Macaronesian Islands, such as the case of February 2010 in Madeira. Likewise, it is also important to take into account when considering the foreseen increment of the occurrence of ARs in the North Atlantic basin under most likely representative climate change scenarios [32].

Supplementary Materials

The following are available online at https://www.mdpi.com/2073-4433/9/8/325/s1, Figure S1. Standard deviation of the mean percentage of days, using the four reanalyses, associated with atmospheric rivers for the most extreme precipitation days (≥90th percentile) in the Azores Archipelago: (a) central group, (b) western group and (c) eastern group; Figure S2. Standard deviation of the mean percentage of days, using the four reanalyses, associated with atmospheric rivers for the most extreme precipitation days (≥90th percentile) in the Madeira Archipelago; Figure S3. Standard deviation of the mean percentage of days, using the four reanalyses, associated with atmospheric rivers for the most extreme precipitation days (≥90th percentile) in the Canary Archipelago; Table S1. Information regarding the location and altitude of the weather stations in the Azores Archipelago; Table S2. Same as Table S1 for the Madeira Archipelago; Table S3. Same as Table S1 for the Canary Archipelago. Table S4. Atmospheric rivers mean frequency (days) considering the nearest grid point of each island taking into account the four reanalysis: ERA-Interim; Climate Forecast System Reanalysis (CFSR); Modern-Era Retrospective analysis for Research and Applications, Version 2 (MERRA-2) and NCEP/NCAR.

Author Contributions

A.M.R. conceived and designed the experiments; A.M.R. and R.T. performed the experiments. A.M.R., R.M.T., R.T., M.L.R.L. analysed the data and wrote the paper.

Funding

This work was supported by the project “Weather Extremes in the Euro Atlantic Region: Assessment and Impacts—WEx-Atlantic” (PTDC/CTA-MET/29233/2017) and by Instituto Dom Luiz (IDL, UID/GEO/50019/2013) funded by Fundação para a Ciência e a Tecnologia, Portugal (FCT) and Portugal Horizon2020. Alexandre. M. Ramos was also supported by a FCT postdoctoral grant (FCT/DFRH/SFRH/BPD/84328/2012).

Acknowledgments

Alexandre M. Ramos would like to thank Bin Guan for kindly sharing the atmospheric rivers databases. Finally we would like to thank the reviewers for their thoughtful comments and efforts towards improving the manuscript.

Conflicts of Interest

The authors declare no conflict of interest.

References

  1. Fragoso, M.; Trigo, R.M.; Zêzere, J.; Valente, M.A. The exceptional rainfall event in Lisbon on 18 February 2008. Weather 2010, 65, 31–35. [Google Scholar] [CrossRef] [Green Version]
  2. Zêzere, J.; Pereira, S.; Tavares, A.; Bateira, C.; Trigo, R.M.; Quaresma, I.; Santos, P.; Santos, M.; Verde, J. DISASTER: A GIS database on hydro-geomorphologic disasters in Portugal. Nat. Hazards 2014, 72, 503–532. [Google Scholar] [CrossRef]
  3. Liberato, M.L.R.; Ramos, A.M.; Trigo, R.M.; Trigo, I.F.; Durán-Quesada, A.M.; Nieto, R.; Gimeno, L. Moisture Sources and Large-Scale Dynamics Associated with a Flash Flood Event. In Lagrangian Modeling of the Atmosphere; Lin, J., Brunner, D., Gerbig, S.C., Luhar, A.A., Webley, P., Eds.; American Geophysical Union: Washington, DC, USA, 2012. [Google Scholar]
  4. Neiman, P.J.; Ralph, F.M.; Wick, G.A.; Lundquist, J.D.; Dettinger, M.D. Meteorological characteristics and overland precipitation impacts of atmospheric rivers affecting the West Coast of North America based on eight years of SSM/I satellite observations. J. Hydrometeorol. 2008, 9, 22–47. [Google Scholar] [CrossRef]
  5. Ralph, F.M.; Dettinger, M.D. Storms, floods, and the science of atmospheric rivers. Eos Trans. Am. Geophys. Union 2011, 92, 265–266. [Google Scholar] [CrossRef]
  6. Barth, N.A.; Villarini, G.; Nayak, M.A.; White, K. Mixed populations and annual flood frequency estimates in the western United States: The role of atmospheric rivers. Water Resour. Res. 2017, 53, 257–269. [Google Scholar] [CrossRef]
  7. Ralph, F.M.; Dettinger, M.D.; Lavers, D.; Gorodetskaya, I.V.; Martin, A.; Viale, M.; White, A.B.; Oakley, N.; Rutz, J.; Spackman, J.R.; et al. Atmospheric Rivers Emerge as a Global Science and Applications Focus. Bull. Am. Meteorol. Soc. 2017, 98, 1969–1973. [Google Scholar] [CrossRef]
  8. Zhang, W.; Villarini, G. Uncovering the role of the East Asian jet stream and heterogeneities in atmospheric rivers affecting the western United States. Proc. Natl. Acad. Sci. USA 2018, 115, 891–896. [Google Scholar] [CrossRef] [PubMed]
  9. Stohl, A.; Forster, C.; Sodemann, H. Remote sources of water vapor forming precipitation on the Norwegian west coast at 60° N—A tale of hurricanes and an atmospheric river. J. Geophys. Res. 2008, 113. [Google Scholar] [CrossRef]
  10. Lavers, D.A.; Villarini, G.; Allan, R.P.; Wood, E.F.; Wade, A.J. The detection of atmospheric rivers in atmospheric reanalyses and their links to British winter floods and the large-scale climatic circulation. J. Geophys. Res. Atmos. 2012, 117. [Google Scholar] [CrossRef] [Green Version]
  11. Ramos, A.M.; Trigo, R.M.; Liberato, M.L.R.; Tomé, R. Daily Precipitation Extreme Events in the Iberian Peninsula and Its Association with Atmospheric Rivers. J. Hydrometeorol. 2015, 16, 579–597. [Google Scholar] [CrossRef]
  12. Lavers, D.A.; Villarini, G. The nexus between atmospheric rivers and extreme precipitation across Europe. Geophys. Res. Lett. 2013, 40, 3259–3264. [Google Scholar] [CrossRef] [Green Version]
  13. Guan, B.; Waliser, D.E. Detection of atmospheric rivers: Evaluation and application of an algorithm for global studies. J. Geophys. Res. Atmos. 2015, 120, 12514–12535. [Google Scholar] [CrossRef]
  14. Cropper, T. The weather and climate of Macaronesia: Past, present and future. Weather 2013, 68, 300–307. [Google Scholar] [CrossRef]
  15. Cropper, T.E.; Hanna, E. An analysis of the climate of Macaronesia, 1865–2012. Int. J. Climatol. 2014, 34, 604–622. [Google Scholar] [CrossRef]
  16. Couto, F.T.; Salgado, R.; Costa, M.J.; Prior, V. Precipitation in the Madeira Island over a 10-year period and the meridional water vapour transport during the winter seasons. Int. J. Climatol. 2015, 35, 3748–3759. [Google Scholar] [CrossRef] [Green Version]
  17. Fragoso, M.; Trigo, R.M.; Pinto, J.G.; Lopes, S.; Lopes, A.; Ulbrich, S.; Magro, C. The 20 February 2010 Madeira flash-floods: Synoptic analysis and extreme rainfall assessment. Nat. Hazards Earth Syst. Sci. 2012, 12, 715–730. [Google Scholar] [CrossRef] [Green Version]
  18. Ramos, A.M.; Trigo, R.M.; Santo, F.E. Evolution of extreme temperatures over Portugal: Recent changes and future scenarios. Clim. Res. 2011, 48, 177–192. [Google Scholar] [CrossRef]
  19. Espírito Santo, F.; de Lima, M.I.; Ramos, A.M.; Trigo, R.M. Trends in seasonal surface air temperature in mainland Portugal, since 1941. Int. J. Climatol. 2014, 34, 1814–1837. [Google Scholar] [CrossRef]
  20. Pereira, S.; Ramos, A.M.; Zêzere, J.L.; Trigo, R.M.; Vaquero, J.M. Spatial impact and triggering conditions of the exceptional hydro-geomorphological event of December 1909 in Iberia. Nat. Hazards Earth Syst. Sci. 2016, 16, 371–390. [Google Scholar] [CrossRef]
  21. Hecht, C.W.; Cordeira, J.M. Characterizing the influence of atmospheric river orientation and intensity on precipitation distributions over North Coastal California. Geophys. Res. Lett. 2017, 44, 9048–9058. [Google Scholar] [CrossRef]
  22. Hernández, A.; Haim, K.; Trigo, R.M.; Valente, M.A.; Sigró, J.; Cropper, T.; Santo, F.E. New Azores archipelago daily precipitation dataset and its links with large-scale modes of climate variability. Int. J. Climatol. 2016, 36, 4439–4454. [Google Scholar] [CrossRef]
  23. Hénin, R.; Ramos, A.M.; Schemm, S.; Gouveia, C.; Liberato, M.L.R. Assigning precipitation to mid-latitudes fronts on sub-daily scales in the North Atlantic and European sector: Climatology and trends. Int. J. Climatol. 2018. accepted. [Google Scholar]
  24. García-Herrera, R.; Gallego, D.; Hernández, E.; Gimeno, L.; Ribera, P.; Calvo, N. Precipitation trends in the Canary Islands. Int. J. Climatol. 2003, 23, 235–241. [Google Scholar] [CrossRef] [Green Version]
  25. Blamey, R.C.; Ramos, A.M.; Trigo, R.M.; Tomé, R.; Reason, C.J. The Influence of Atmospheric Rivers over the South Atlantic on Winter Rainfall in South Africa. J. Hydrometeorol. 2018, 19, 127–142. [Google Scholar] [CrossRef]
  26. Trigo, I.F. Climatology and interannual variability of stormtrack in the Euro-Atlantic sector: A comparison between ERA-40 and NCEP/NCAR reanalyses. Clim. Dyn. 2006, 26, 127–143. [Google Scholar] [CrossRef]
  27. Neu, U.; Akperov, M.G.; Bellenbaum, N.; Rasmus, B.; Richard, B.; Rodrigo, C.; Angela, C.; Helen, F.D.; Yang, F.; Klaus, F.; et al. IMILAST: A Community Effort to Intercompare Extratropical Cyclone Detection and Tracking Algorithms. Bull. Am. Meteorol. Soc. 2013, 94, 529–547. [Google Scholar] [CrossRef]
  28. Nieto, R.; Gimeno, L.; De la Torre, L.; Ribera, P.; Barriopedro, D.; García-Herrera, R.; Serrano, A.; Gordillo, A.; Redaño, A.; Lorente, J. Interannual variability of cut-off low systems over the European sector: The role of blocking and the Northern Hemisphere circulation modes. Meteorol. Atmos. Phys. 2007, 96, 85–101. [Google Scholar] [CrossRef]
  29. Couto, F.T.; Salgado, R.; Costa, M.J. Analysis of intense rainfall events on Madeira Island during the 2009/2010 winter. Nat. Hazards Earth Syst. Sci. 2012, 12, 2225–2240. [Google Scholar] [CrossRef] [Green Version]
  30. Trigo, R.M.; Ramos, C.; Pereira, S.; Ramos, A.M.; Zêzere, J.L.; Liberato, M.L.R. The deadliest storm of the 20th century striking Portugal: Flood impacts and atmospheric circulation. J. Hydrol. 2016, 541, 597–610. [Google Scholar] [CrossRef]
  31. Trigo, R.M.; Varino, F.; Ramos, A.M.; Valente, M.; Zêzere, J.; Vaquero, J.; Gouveia, C.; Russo, A. The record precipitation and flood event in Iberia in December 1876: Description and synoptic analysis. Front. Earth Sci. 2014, 2, 1–15. [Google Scholar] [CrossRef]
  32. Ramos, A.M.; Tomé, R.; Trigo, R.M.; Liberato, M.L.R.; Pinto, J.G. Projected changes in atmospheric rivers affecting Europe in CMIP5 models. Geophys. Res. Lett. 2016, 43, 9315–9323. [Google Scholar] [CrossRef]
Figure 1. Map of the Macaronesian European Islands, illustrating their location within the North Atlantic Ocean.
Atmosphere 09 00325 g001
Figure 2. Location of the weather stations in the Azores Archipelago for each group of islands: (a) central group; (b) western group and (c) eastern group. In addition, for each station, the information regarding the 90th percentile (mm) of the daily precipitation is also shown between brackets. The nine Azores Islands are highlighted in red numbers: 1. Flores, 2. Corvo, 3. Faial, 4. Pico, 5. São Jorge, 6. Graciosa, 7. Terceira, 8. São Miguel and 9. Santa Maria.
Atmosphere 09 00325 g002
Figure 3. Similar to Figure 2 for the Madeira Archipelago. The two Madeira Islands are highlighted in red numbers: 1. Madeira and 2. Porto Santo. In addition, the locations that are above 600 m are highlighted in green dots
Atmosphere 09 00325 g003
Figure 4. Similar to Figure 2 for the Canary Archipelago. The five Canary Islands where data is available are highlighted in red numbers: 1. La Palma, 2. Tenerife, 3. Gran Canaria, 4. Fuerte Ventura and 5. Lanzarote. In addition, the locations that are above 600 m are highlighted in green dots.
Atmosphere 09 00325 g004
Figure 5. Distribution of daily precipitation (mm) for the 50th, 60th, 70th, 80th and 90th percentiles for three selected locations in each Archipelago: Ponta Delgada (Azores, blue), Funchal (Madeira, green) and Santa Cruz (Canary, yellow).
Atmosphere 09 00325 g005
Figure 6. Time evolution of yearly ARs days per extended winter for each of the different reanalyses (ERA-Interim (blue line); Climate Forecast System Reanalysis (CFSR) (red line); Modern-Era Retrospective analysis for Research and Applications, Version 2 (MERRA-2) (green line) and NCEP/NCAR (purple line)) for (a) São Miguel Island (Azores), (b) Madeira Island (Madeira Archipelago) and (c) Tenerife Island (Canary).
Atmosphere 09 00325 g006
Figure 7. Percentage of days in each daily precipitation percentile bin (from 50th to 60th to the ≥90th percentile) associated with atmospheric rivers (ARs) for each of the four reanalyses (ERA-Interim (blue line); CFSR (red line); MERRA2 (green line) and NCEP/NCAR (purple line) for (a) Ponta Delgada (São Miguel, Azores), (b) Funchal (Madeira) and (c) Santa Cruz (Tenerife, Canary).
Atmosphere 09 00325 g007
Figure 8. Mean percentage of days, associated with ARs for the most extreme precipitation days (≥90th percentile) in the Azores Archipelago: (a) central group, (b) western group and (c) eastern group. The mean percentage was obtained after averaging the four reanalyses used.
Atmosphere 09 00325 g008
Figure 9. Mean percentage of days associated with ARs for the most extreme precipitation days (≥90th percentile) in the Madeira Archipelago. The mean percentage was obtained after averaging the four reanalyses used.
Atmosphere 09 00325 g009
Figure 10. Mean percentage of days associated with ARs for the most extreme precipitation days (≥90th percentile) in the Canary Archipelago. The mean percentage was obtained after averaging the four reanalysis used.
Atmosphere 09 00325 g010

