Article

A Multi-GCM Assessment of the Climate Change Impact on the Hydrology and Hydropower Potential of a Semi-Arid Basin (A Case Study of the Dez Dam Basin, Iran)

Department of Water Sciences Engineering, Bu-Ali Sina University, Hamedan 6517838695, Iran
*
Author to whom correspondence should be addressed.
Water 2018, 10(10), 1458; https://doi.org/10.3390/w10101458
Submission received: 28 August 2018 / Revised: 8 October 2018 / Accepted: 8 October 2018 / Published: 16 October 2018

Abstract

:
In this paper, the impact of climate change on the climate and discharge of the Dez Dam Basin and the hydropower potential of two hydropower plants (Bakhtiari and Dez) is investigated based on the downscaled outputs of six GCMs (General Circulation Models) and three SRES (Special Report on Emission Scenarios) scenarios for the early, mid and late 21st century. Projections of all the scenarios and GCMs revealed a significant rise in temperature (up to 4.9 °C) and slight to moderate variation in precipitation (up to 18%). Outputs of the HBV hydrologic model, enforced by projected datasets, show a reduction of the annual flow by 33% under the climate change condition. Further, analyzing the induced changes in the inflow and hydropower generation potential of the Bakhtiari and Dez dams showed that both inflow and hydropower generation is significantly affected by climate change. For the Bakhtiari dam, this indicates a consistent reduction of inflow (up to 27%) and electricity generation (up to 32%). While, in the Dez dam case, the inflow is projected to decrease (up to 22%) and the corresponding hydropower is expected to slightly increase (up to 3%). This contrasting result for the Dez dam is assessed based on its reservoir and hydropower plant capacity, as well as other factors such as the timely releases to meet different demands and flow regime changes under climate change. The results show that the Bakhtiari reservoir and power plant will not meet the design-capacity outputs under the climate change condition as its large capacity cannot be fully utilized; while there is room for the further development of the Dez power plant. Comparing the results of the applied GCMs showed high discrepancies among the outputs of different models.

1. Introduction

Anthropogenic global warming and its consequences, especially in the arid and semi-arid regions, received particular attention in recent years as many scholars documented the occurrence and dominance of droughts, a rise in the temperature, and an increase in the atmospheric water demand, accompanied by a reduction in the precipitation and runoff [1,2,3,4]. Additionally, in Iran, many studies support the fact that during recent decades the climate has experienced variations, mostly toward hot and dry conditions [5,6,7,8,9,10,11,12,13,14].
Anticipated climatic changes can alter the hydrological regimes, such as the amount of discharge or the timing of the surface flow on both the regional and local (catchment) scales [15,16,17], with socio-economic and environmental consequences. Projections of the impact of climate change on the hydrological conditions on a global scale show that for low and mid-latitude regions, a reduction of freshwater could exacerbate their water-management problems; while the higher latitudes will experience higher amounts of surface flow [18,19].
Several studies worldwide predicted that the combination of the temperature increase and precipitation variation during the present century will result in a significant change of the runoff. According to the study by Tong et al. on the variability of the discharge, under the B1 scenario and the urbanization in the Las Vegas Wash watershed in the USA, climate change is the main deriving factor of future changes in the watershed, causing a wintertime discharge decrease and a summertime discharge increase [20]. The study on the future water availability in Bangladesh revealed that climate change has a significant impact on runoff and evapotranspiration because the region will face a higher irrigation demand, a decline of groundwater, and a variability of rainfall and runoff (both increasing and decreasing) [21].
The projection of future climatic conditions in Senegal by Tall et al. showed an increase in the temperature, evaporation, and precipitation by the mid-21st century and a decrease of these parameters by the late-21st century. They also reported that dependent on the applied scenarios, the runoff will change (both increasingly and decreasingly). This could lead to an arid climate dominance in the region [22]. He et al. assessed the hydrologic sensitivity to climate change in the upper San Joaquin River basin in California by employing projected temperature and precipitation datasets, the reported temperature rise (between 1.5 and 4.5 °C) and precipitation variations (between 80 and 120%) [23]. They showed that climate change can lead to annual streamflow variations between −41 and 16%. They also detected an earlier shift of most of the streamflow by 15 to 46 days as a result of the temperature increase, which is the cause of the higher seasonal variability of streamflow. Modeling the future climatic and hydrologic response to climate change in Spain revealed a 1.5–3.3 °C temperature increase, a 6–32% precipitation decrease, and a 2–54% runoff decrease [24]. Xu and Luo, by employing seven GCMs (General Circulation Models) and the A1B scenario in two semi-arid and humid regions in China, reported dramatic changes in the temperature (up to +8.6 °C), precipitation (up to 139%), and seasonal discharge (up to 304%), as well as an increase in the extreme flows and seasonal shifts of discharge [25]. Investigating the scenarios of climate change impact on the river flow in Western Kenya using different GCMs and SRES (Special Report on Emission Scenarios) showed that climate change has the potential to significantly alter the river flow [26].
Additionally, assessments of climate change impact on the river flow in Iran show considerable variations of surface water resources across different parts of the country. Simulation of streamflow in the North of Iran, through forcing the hydrologic model with climatic projections based on different SRES scenarios, revealed increases and decreases of the discharge for the wet and dry seasons, respectively, with an overall increase in the annual discharge [27]. According to another study on the future changes of the climatic condition and runoff across Iran, the future temperature and precipitation are projected to vary by ±6 °C and ±60%, respectively [28]. Additionally, these changes will result in higher rates of annual evaporation and a runoff reduction, as well as seasonal variations of runoff (an increase in winter and a decrease in spring). Rafiei Emam et al. showed that the hydrologic response of the Raza-Ghahavand region (a semi-arid region in Iran) to climate change is a decrease in precipitation and an increase in temperature, which leads to less groundwater recharge and a lower soil water content [29]. A study on the impact of climate change on the surface water supply in the Zayandeh-Rud River Basin in Central Iran showed an increase of 0.4–0.76 °C in annual temperature, a decrease of 14–38% in the precipitation and a decrease of 8–43% in the runoff [30]. Modeling the future climate and water resources under the A1B, A2, and B2 scenarios in the Karkheh River Basin (located in the West and Southwest of Iran) revealed a temperature increase and reduction of the water yield in the basin. This reduction is considerable from April to September as a result of the temperature increase and precipitation decrease [31].
It is widely documented that based on the future simulations, the modeled wintertime discharge increase is usually followed by a springtime discharge decrease, which is due to the temperature increase which causes the snow to melt sooner and for there to be less snow [15,16,17,32,33]. Additionally, a global scale study on the river flow variations caused by the A2 and B1 emission scenarios suggested an increase in the seasonality of the river flow, i.e., an increase in the high flows and a decrease in the low flows, for about one-third of the Earth [34]. Elsner et al., using the A1B and B1 scenarios, showed that climate change causes significant shifts and changes in the amount and timing of the runoff in the Pacific Northwest [35]. Pervez and Henebry reported that a combination of the land use and climatic change under different SRES scenarios can cause some changes and shifts in the amount of discharge and flow timing in the Brahmaputra River Basin [36]. Boyer et al. studied the projected variability of the wintertime and springtime discharges at a regional scale and found that under climate change, the wintertime discharge increases, while the springtime discharge decreases [16].
One of the vulnerable industries to climate change is hydropower generation, which completely relies on the amount of precipitation, snow cover, snowmelt, streamflow, and the timing of the flow, all of which show high inter-annual variability [37,38,39]. Based on the IPCC report, as a result of climate change, the hydropower generation potential is projected to drop by up to 6% [40]. Therefore, it is essential to adapt the water resources management to the future climatic changes [41]. In Iran, climatic changes and their repercussion on hydropower generation have been studied by Jahandideh et al. [42] and Jamali et al. [43], focusing on the Karun and Karkheh river basins, respectively. They reported a reduction of the hydropower generation potential in both of the studied basins.

Problem Statement and Objectives of the Study

The Dez Dam Basin is located in Iran’s Southwest and the discharge from this basin is planned to provide water for different sectors, such as the agriculture, industry, fishery and hydropower generation sectors through existing and currently-in-constructed dams. In the planning and management of water resources, the base period recorded dataset is normally considered. However, the records from recent years and future projections of climate models suggest that global warming and climate change could alter the climate indicators and hydrologic conditions. Therefore, for basins like the Dez Dam Basin, which is not completely developed yet, it is crucial to assess the variations in the amount of discharge on a basin scale with respect to the climate change scenarios; this is essential for climate change adaptation. In this study, we investigated the variations of hydroclimatic conditions induced by climate change in the Dez Dam Basin and its consequences with regards to the hydropower generation potential through two large dams in the basin. For this aim, first, the precipitation and temperature values were projected based on the three SRES scenarios. Then, using the HBV hydrologic model, the discharge was simulated under climate change conditions. Next, the hydropower generation potential was calculated for the two hydropower plants of the Bakhtiari and Dez dams. Since many scholars identified GCMs as one of the significant sources of uncertainty in hydro-climatic studies [25,33,44,45,46,47,48,49], in this study, an ensemble of six GCMs and three emission scenarios were employed to consider the different climatic conditions within a range, offered by the outputs of different GCMs and scenarios. This assessment provides a useful means to the modify water resources management strategies, considering the repercussions of climate change on the surface water resources and the hydropower plants of the Dez Dam Basin.

2. Materials and Methods

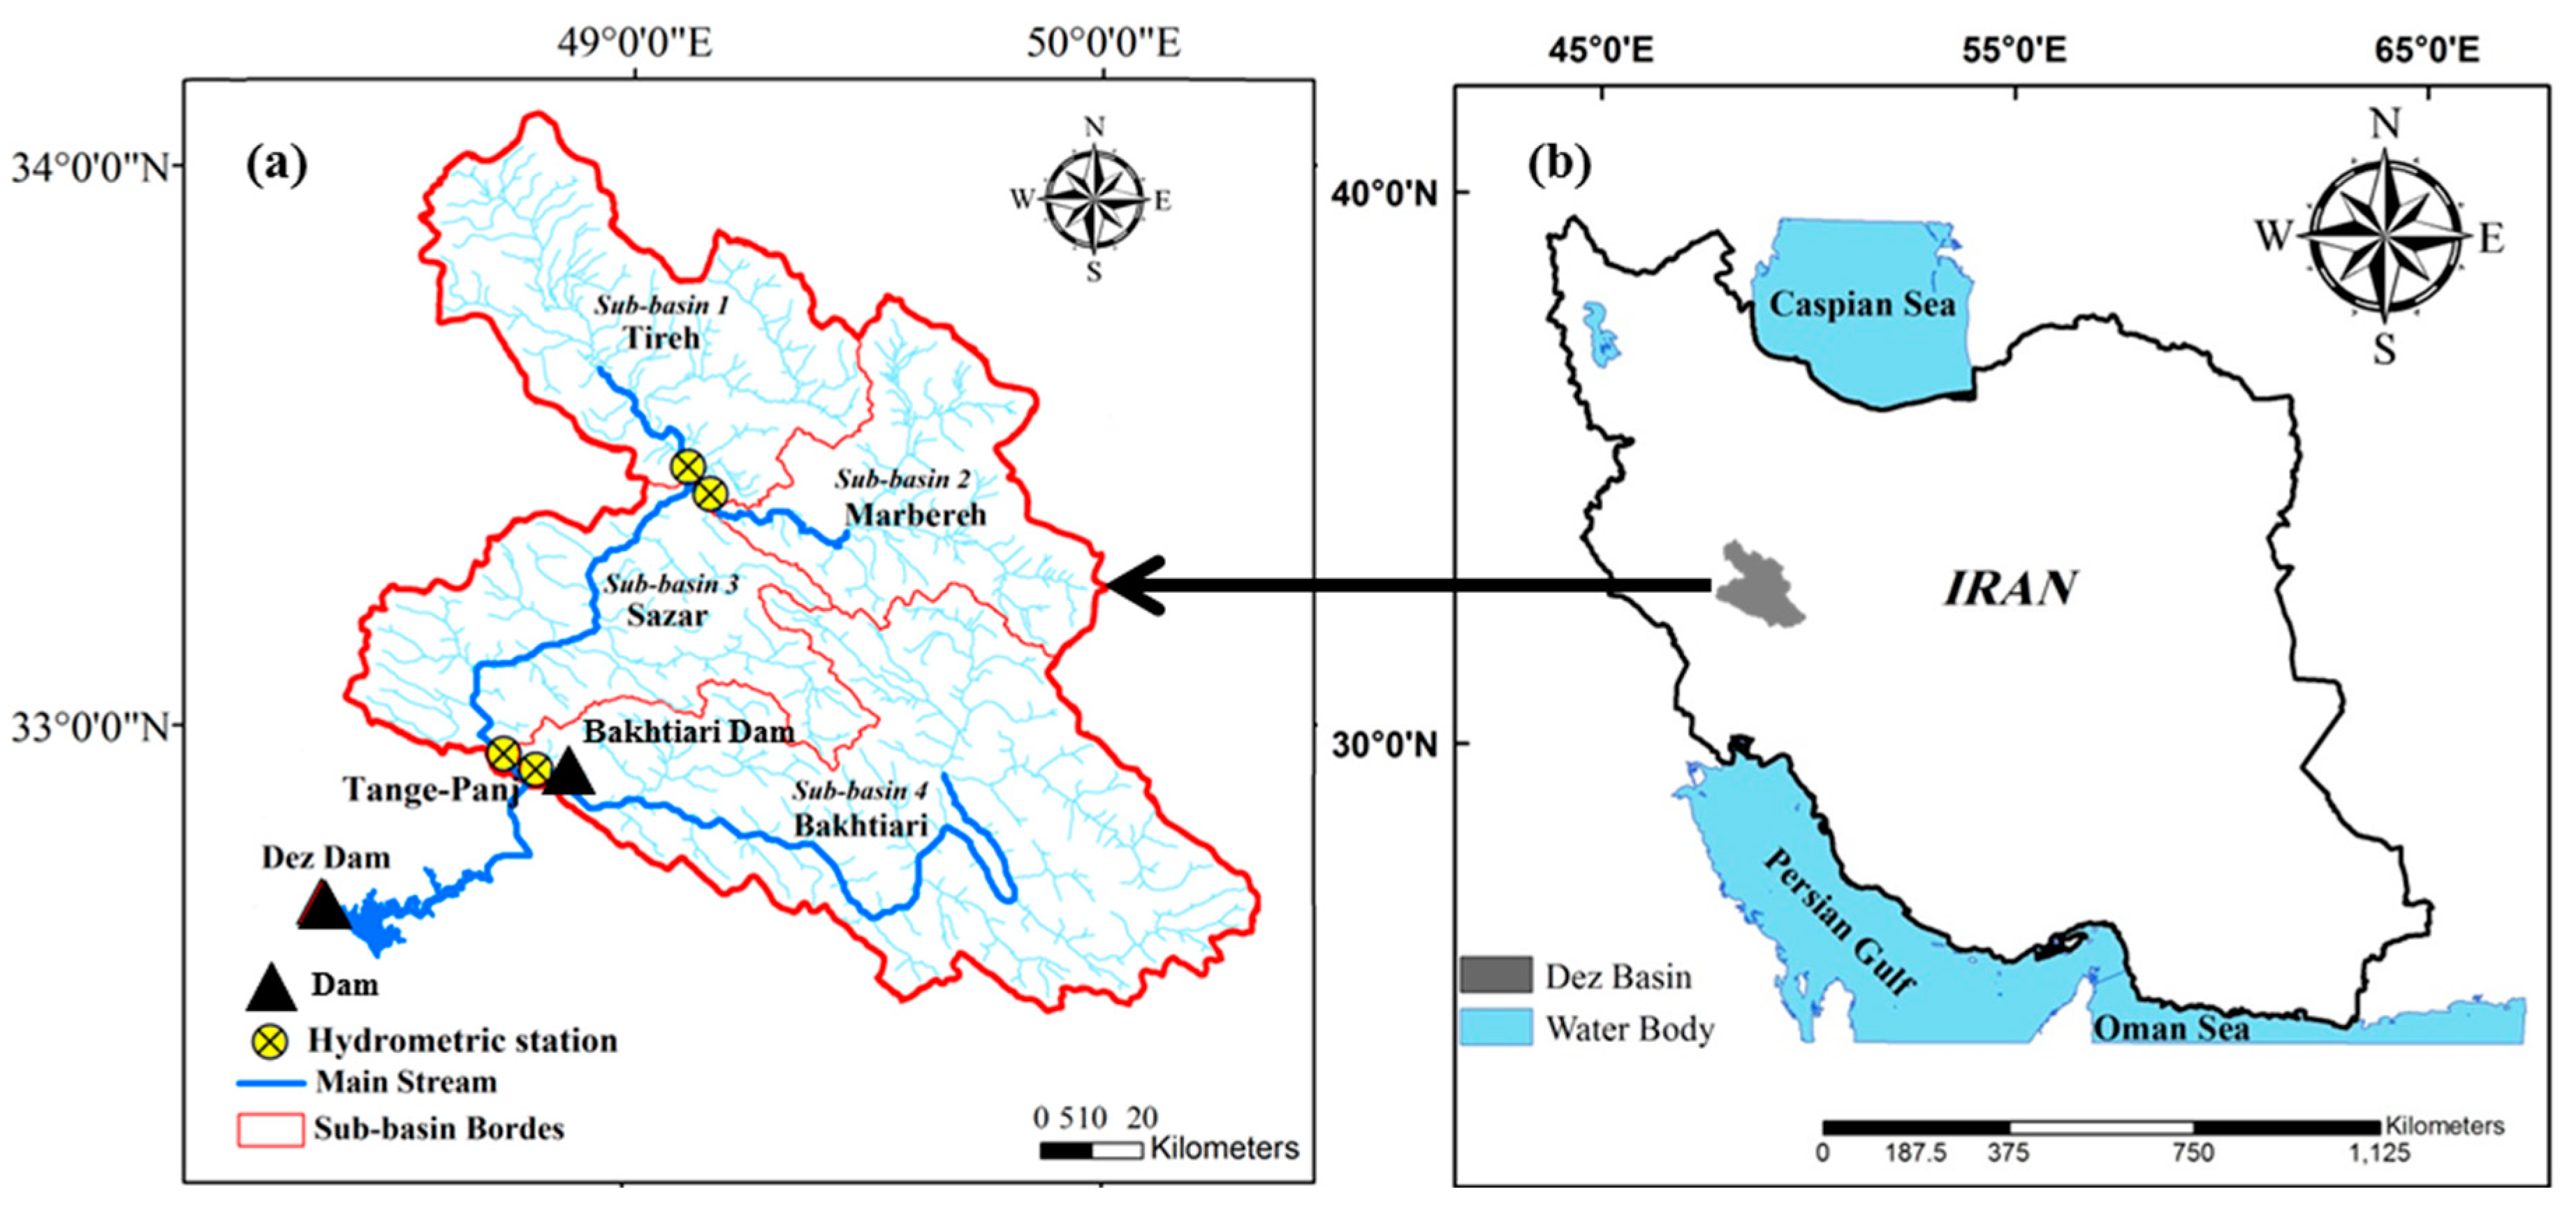
2.1. Study Area and Data

The Dez Dam Basin (hereafter referred to as DDB) is located in the Southwest of Iran between 31°35′51″–34°7′46″ N and 48°9′15″–50°18′37″ E and is the upstream tributary of the great Karun catchment. Figure 1 shows the location of the Dez Dam Basin in Iran, as well as the streams and hydrometric stations in this basin, based on the data layers acquired from the Iran Water Resources Management Company. Figure 1 also illustrates the four sub-basins of the DDB (delineated by the ArcSWAT tool in ArcGIS), namely, Tireh, Marbereh, Sazar, and Bakhtiari. The two main rivers of Sazar and Bakhtiari drain the basin and join at the point known as Tange Panj to form the Dez River. Figure 1 shows the location of the Dez dam, which is currently operational, and the Bakhtiari dam, which is under construction. As depicted in Figure 1, the Bakhtiari dam is located at the end point of the Bakhtiari sub-basin. Additionally, the inflow to the multi-purpose Dez dam comes from the Sazar and Bakhtiari rivers. The Bakhtiari dam is mainly designated for hydropower generation. While the storage of the Dez reservoir provides water for the domestic, agricultural, and industrial sectors, it is also used to generate electricity. Table 1 presents a description of the studied sub-basins and the hydro-meteorological indicators of the study area. The presented coordinates and elevations in Table 1 belong to the centroid of each sub-basin.
Long-term daily Streamflow (Q), precipitation (P), evaporation (E), and temperature (T) time series were acquired from the Iran Water Resources Management Company and the Islamic Republic of the Iran Meteorological Organization (IRIMO). The observation period for Q is 1989–2009 and, for other parameters, it is 1986–2010.
The catchment is located within a mountainous area known as the Zagros Mountains with limited shallow aquifers in some parts of the sub-basins 1 to 3. The basin’s climate is characterized as semi-arid to Mediterranean with warm summers and cold winter and less than 800 mm of precipitation per year.

2.2. GCM-Scenario Ensemble

To project the future T and P, six different GCMs were applied, including CCSM3, ECHAM5-OM, GFDL-CM2.1, HadCM3, INM-CM3.0, and IPSL-CM4. Each of the applied GCMs couple different components of the Earth system on different grid resolutions. Applying a multi-model ensemble of GCMs enables us to consider a wide range of predictions. Table 2 provides a description of the applied GCMs. The three SRES emission scenarios of A1B, A2, and B1 were applied to project the future T and P for the 2011–2030 (the 2020s), 2046–2065 (the 2050s), and 2081–2100 (the 2080s) time horizons. Therefore, in this study, an ensemble of 54 combinations of GCMs, scenarios, and time horizons (hereafter referred to as GSTs) were used to assess the climatic change and its impact on the discharge and hydropower potential of the DDB.
The related assumptions regarding each SRES scenario and the corresponding CO2 concentrations can be found in the IPCC’s fourth assessment technical report (AR4) [50].
To downscale the future T and P in the study area, under three SERS scenarios (A1B, B1, and A2) during the 2020s, the 2050s, and the 2080s, the stochastic weather generator of LARS-WG was applied. This generated the future time series based on the probability distribution of the base period data and the correlations between the observations. The detailed description of LARS-WG is provided by Semenov [51] and Semenov and Stratonovitch [52].

2.3. Hydrological Modeling

The HBV-light (HBV-light-GUI, V. 4.0.0.6) semi-distributed hydrological model is used to simulate the streamflow in the DDB. The model considers snow routine, soil moisture routine, response function, and the flood routing of the basin. This model simulates Q with T, P, and E as the input data. The model provides the option to link sub-basins, therefore, for SUB-1, SUB-2, and SUB-3, the semi-distributed mode was applied. A detailed description of the HBV model structure and routines are provided by Seibert and Vis [53]. Prior to the application of the model, it is necessary to calibrate its parameters by the trial and error procedure, as recommended by Bergström [54]. After model calibration, validation, and after ensuring its efficiency, it was run with a projected climate series to simulate the future runoff in the basin.

2.4. Model Calibration and Validation

There are several statistics to identify the efficiency of a model. In this research, we examined the goodness of fit with different criteria (Equations (1)–(3)) to diagnose the efficiency of the model in the simulation of the streamflow in the calibration and validation periods. In details, the Nash–Sutcliff measure (Reff), the coefficient of determination (R2), and the mean annual difference (Mdiff) are utilized to evaluate the model performance regarding efficiency, the timing of the flow, and the average error, respectively.
R e f f = 1 ( Q S i m Q O b s ) 2 ( Q O b s Q ¯ O b s ) 2
R 2 = ( ( Q O b s Q O b s ¯ ) ( Q S i m Q S i m ¯ ) ) 2 ( Q O b s Q O b s ¯ ) 2 ( Q S i m Q S i m ¯ ) 2
M D i f f = 100 ( ( Q O b s Q S i m ) n Q O b s ¯ 365 )
where, Qsim and Qobs are the simulated and observed discharge data and n is the number of data.

2.5. Modeling the Two Reservoirs System

The two reservoirs systems of the Bakhtiari and Dez dams are modeled based on the water balance equation (Equation (4)) by considering all the restrictions on the operation of the reservoirs and the power plant, for power generation.
S t + 1 = S t + Q t R E t R D t S P L t E V A P t + A D D t
where, St+1 is the reservoir volume at the end of the t period (beginning of the t + 1 period); St is the reservoir volume at the beginning of the t period; Qt is the inflow to the reservoir during the t period; REt is the outflow from the reservoir to generate energy during the t period; RDt is the outflow from the reservoir to meet the downstream demand during the t period; SPLt is the spill from the reservoir during the t period; EVAPt is the evaporation from the reservoir during the t period; and ADDt is the volume of the added flow from the upstream reservoir during the t period.
Additionally, based on the minimum operational reservoir volume (Smin) and the maximum reservoir volume (Smax), the following conditions are considered in the model:
  • If Smin < St < Smax, the outflow from the reservoir and the hydropower generation is equal to the water and energy demands of that specific month and neither deficit nor spill will occur.
  • If Smax < St, considering the upper limit for the reservoir volume (St ≤ Smax), the reservoir volume (St) is equal to Smax and the excessive amount of water (SmaxSt) will spill. In this condition, there is no water or energy deficit and the secondary energy could be produced.
  • If St < Smin, considering the lower limit for the reservoir operation (SminSt), the reservoir volume will be substituted with the minimum operational reservoir storage, i.e., Smin. Therefore, in that month, the deficit is equal to (St − Smin). In this condition, some or all the demands may not be met. If St − Smin ≥ 0, the water is released based on the priorities to meet high prioritized demands. Additionally, the energy generation will be affected in accordance with the reduction of the amount of water flowing through a turbine.
The power generation is associated with the installed capacity, efficiency, and plant factor as well as to the inflow and hydraulic head. Equation (5) shows the relationship that is used to calculate the energy generation.
P t = γ Q t H t e t
where, Pt is the power generated during the t period (W); γ is water specific weight (N/m3); Qt is the inflow to the turbine during the t period (m3/s); Ht is the net hydraulic head on the turbine during the t period (m); and et is the power plant efficiency during the t period.
The following constraints are applied for the calculation of the hydropower generation based on the limits of the hydropower plant (Equations (6)–(8)).
P t P C C
Q min < Q t < Q max
H min < H t < H max
where, PCC is the installed capacity (MW); Qmin is the minimum turbine inflow (m3/s); Qmax is the maximum turbine inflow (m3/s); Hmin is the minimum required head to operate the power plant (m); Hmax is the maximum head to operate the power plant (m).

3. Results

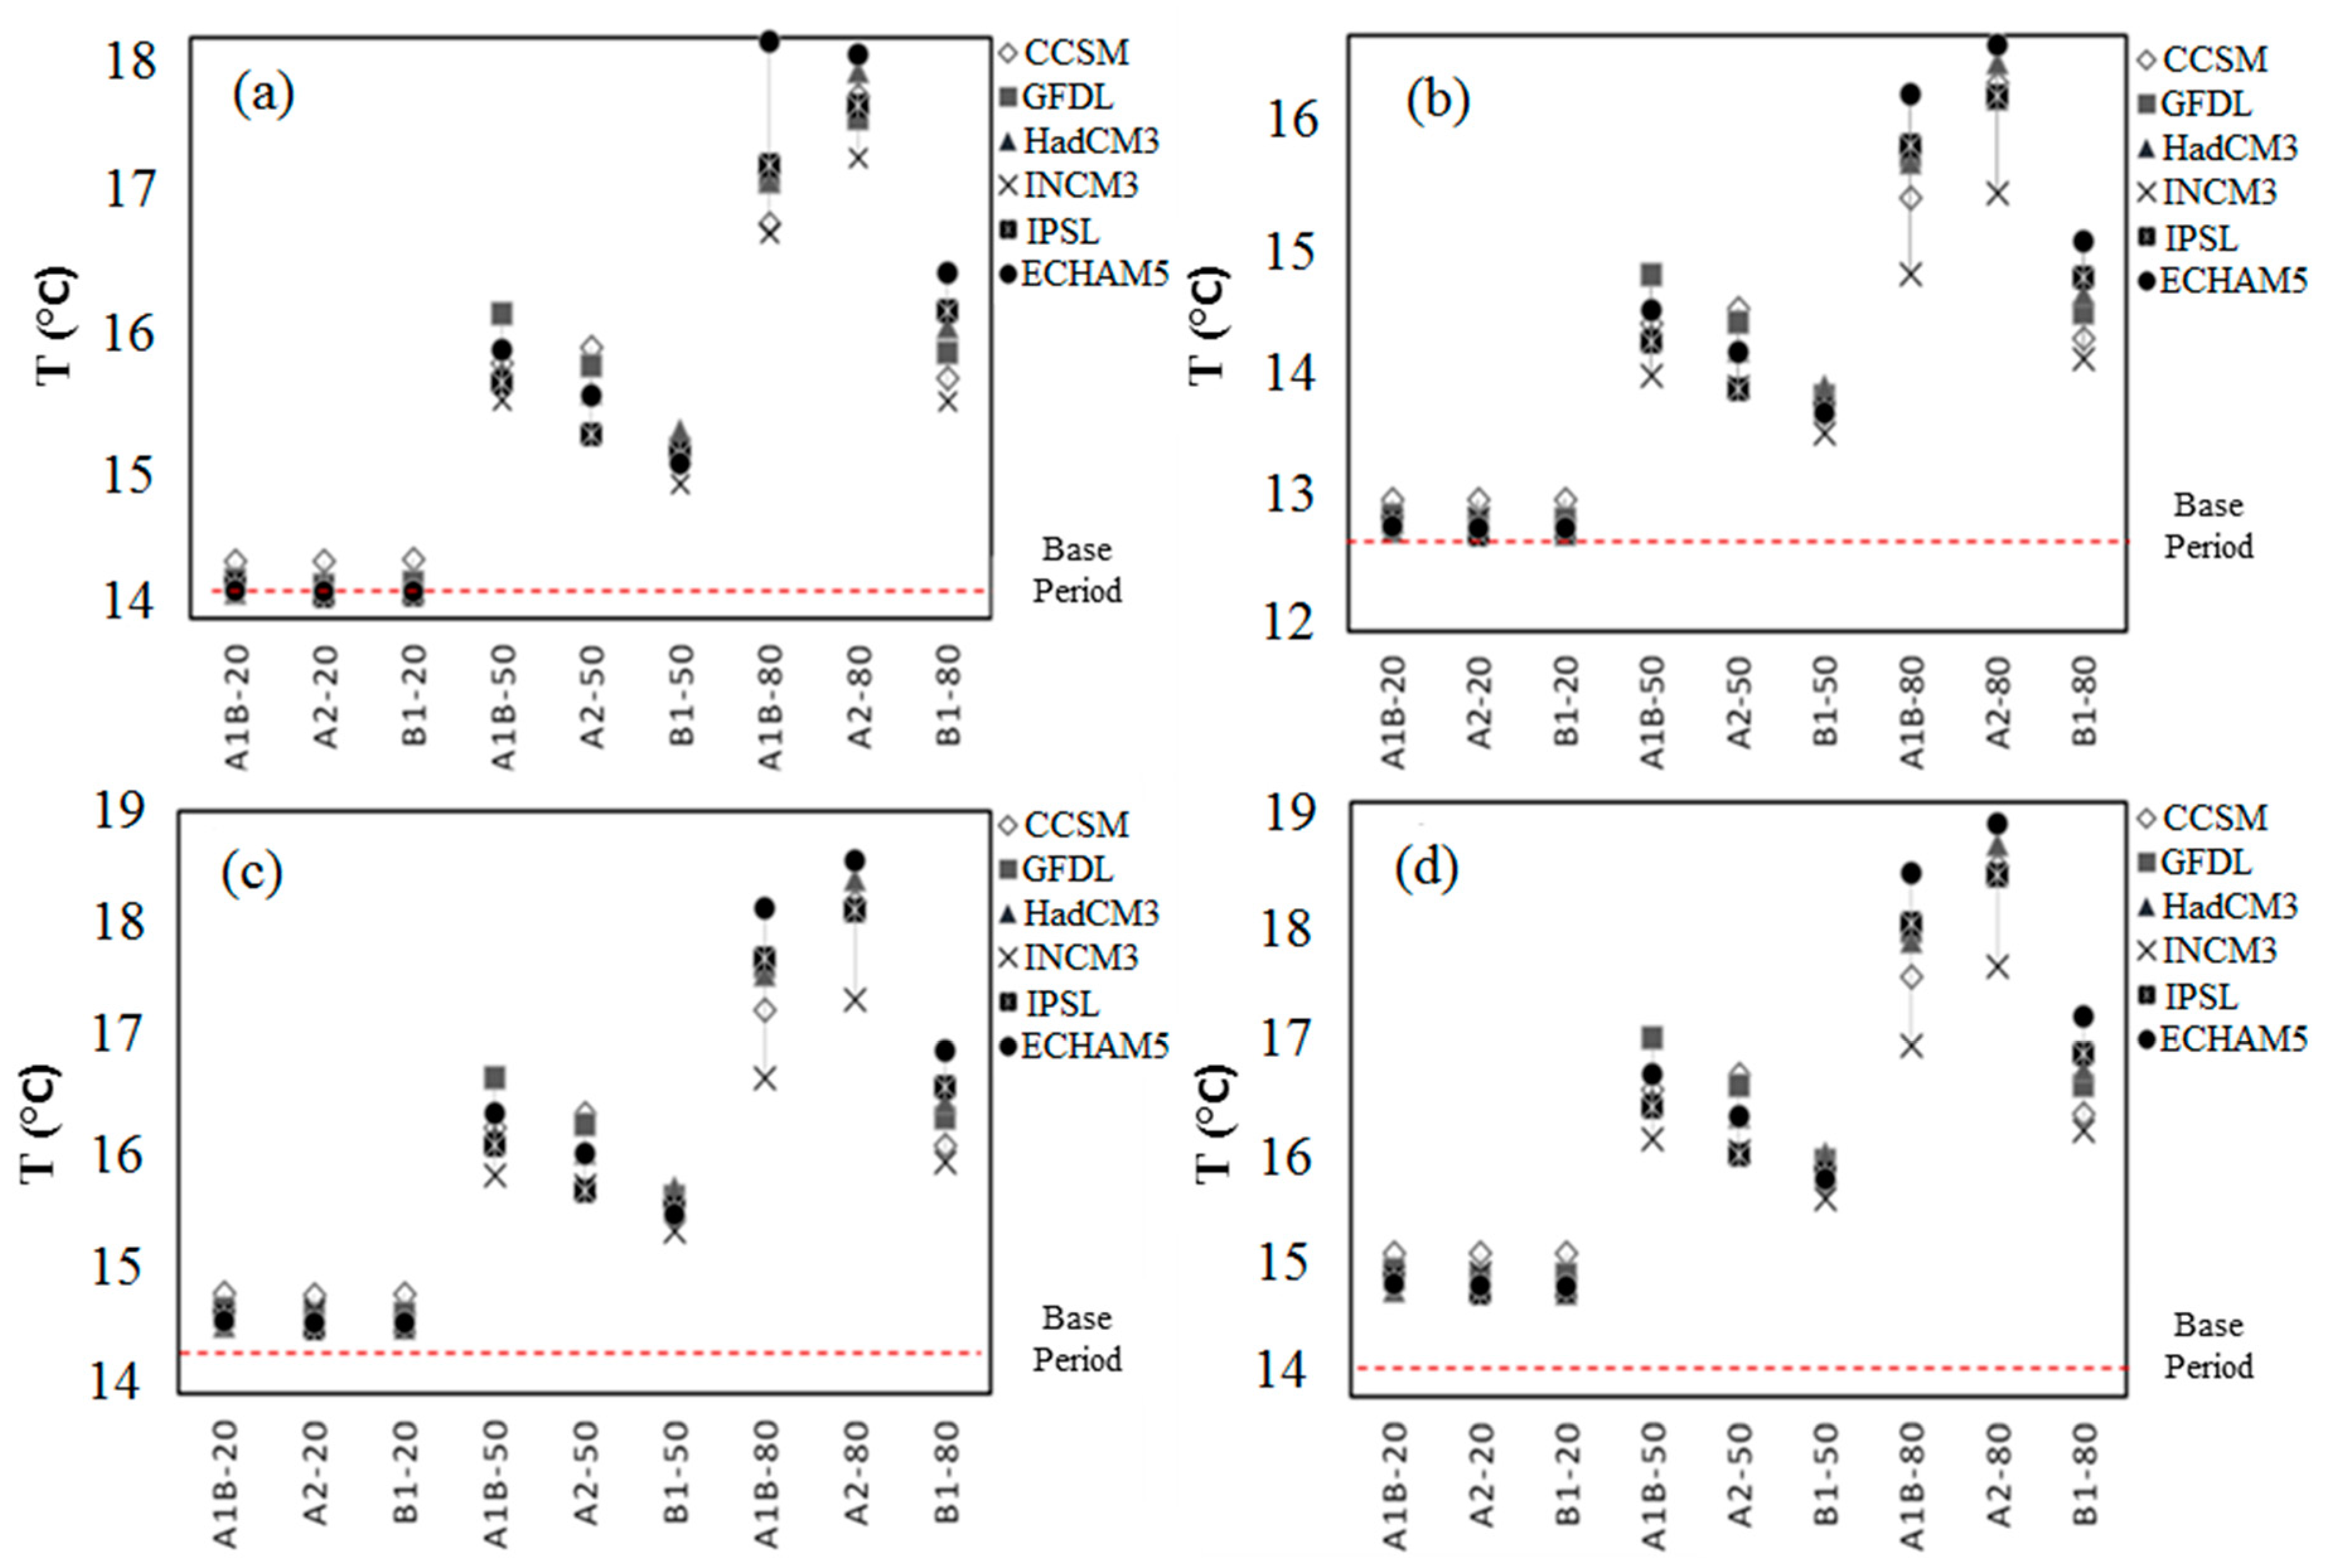
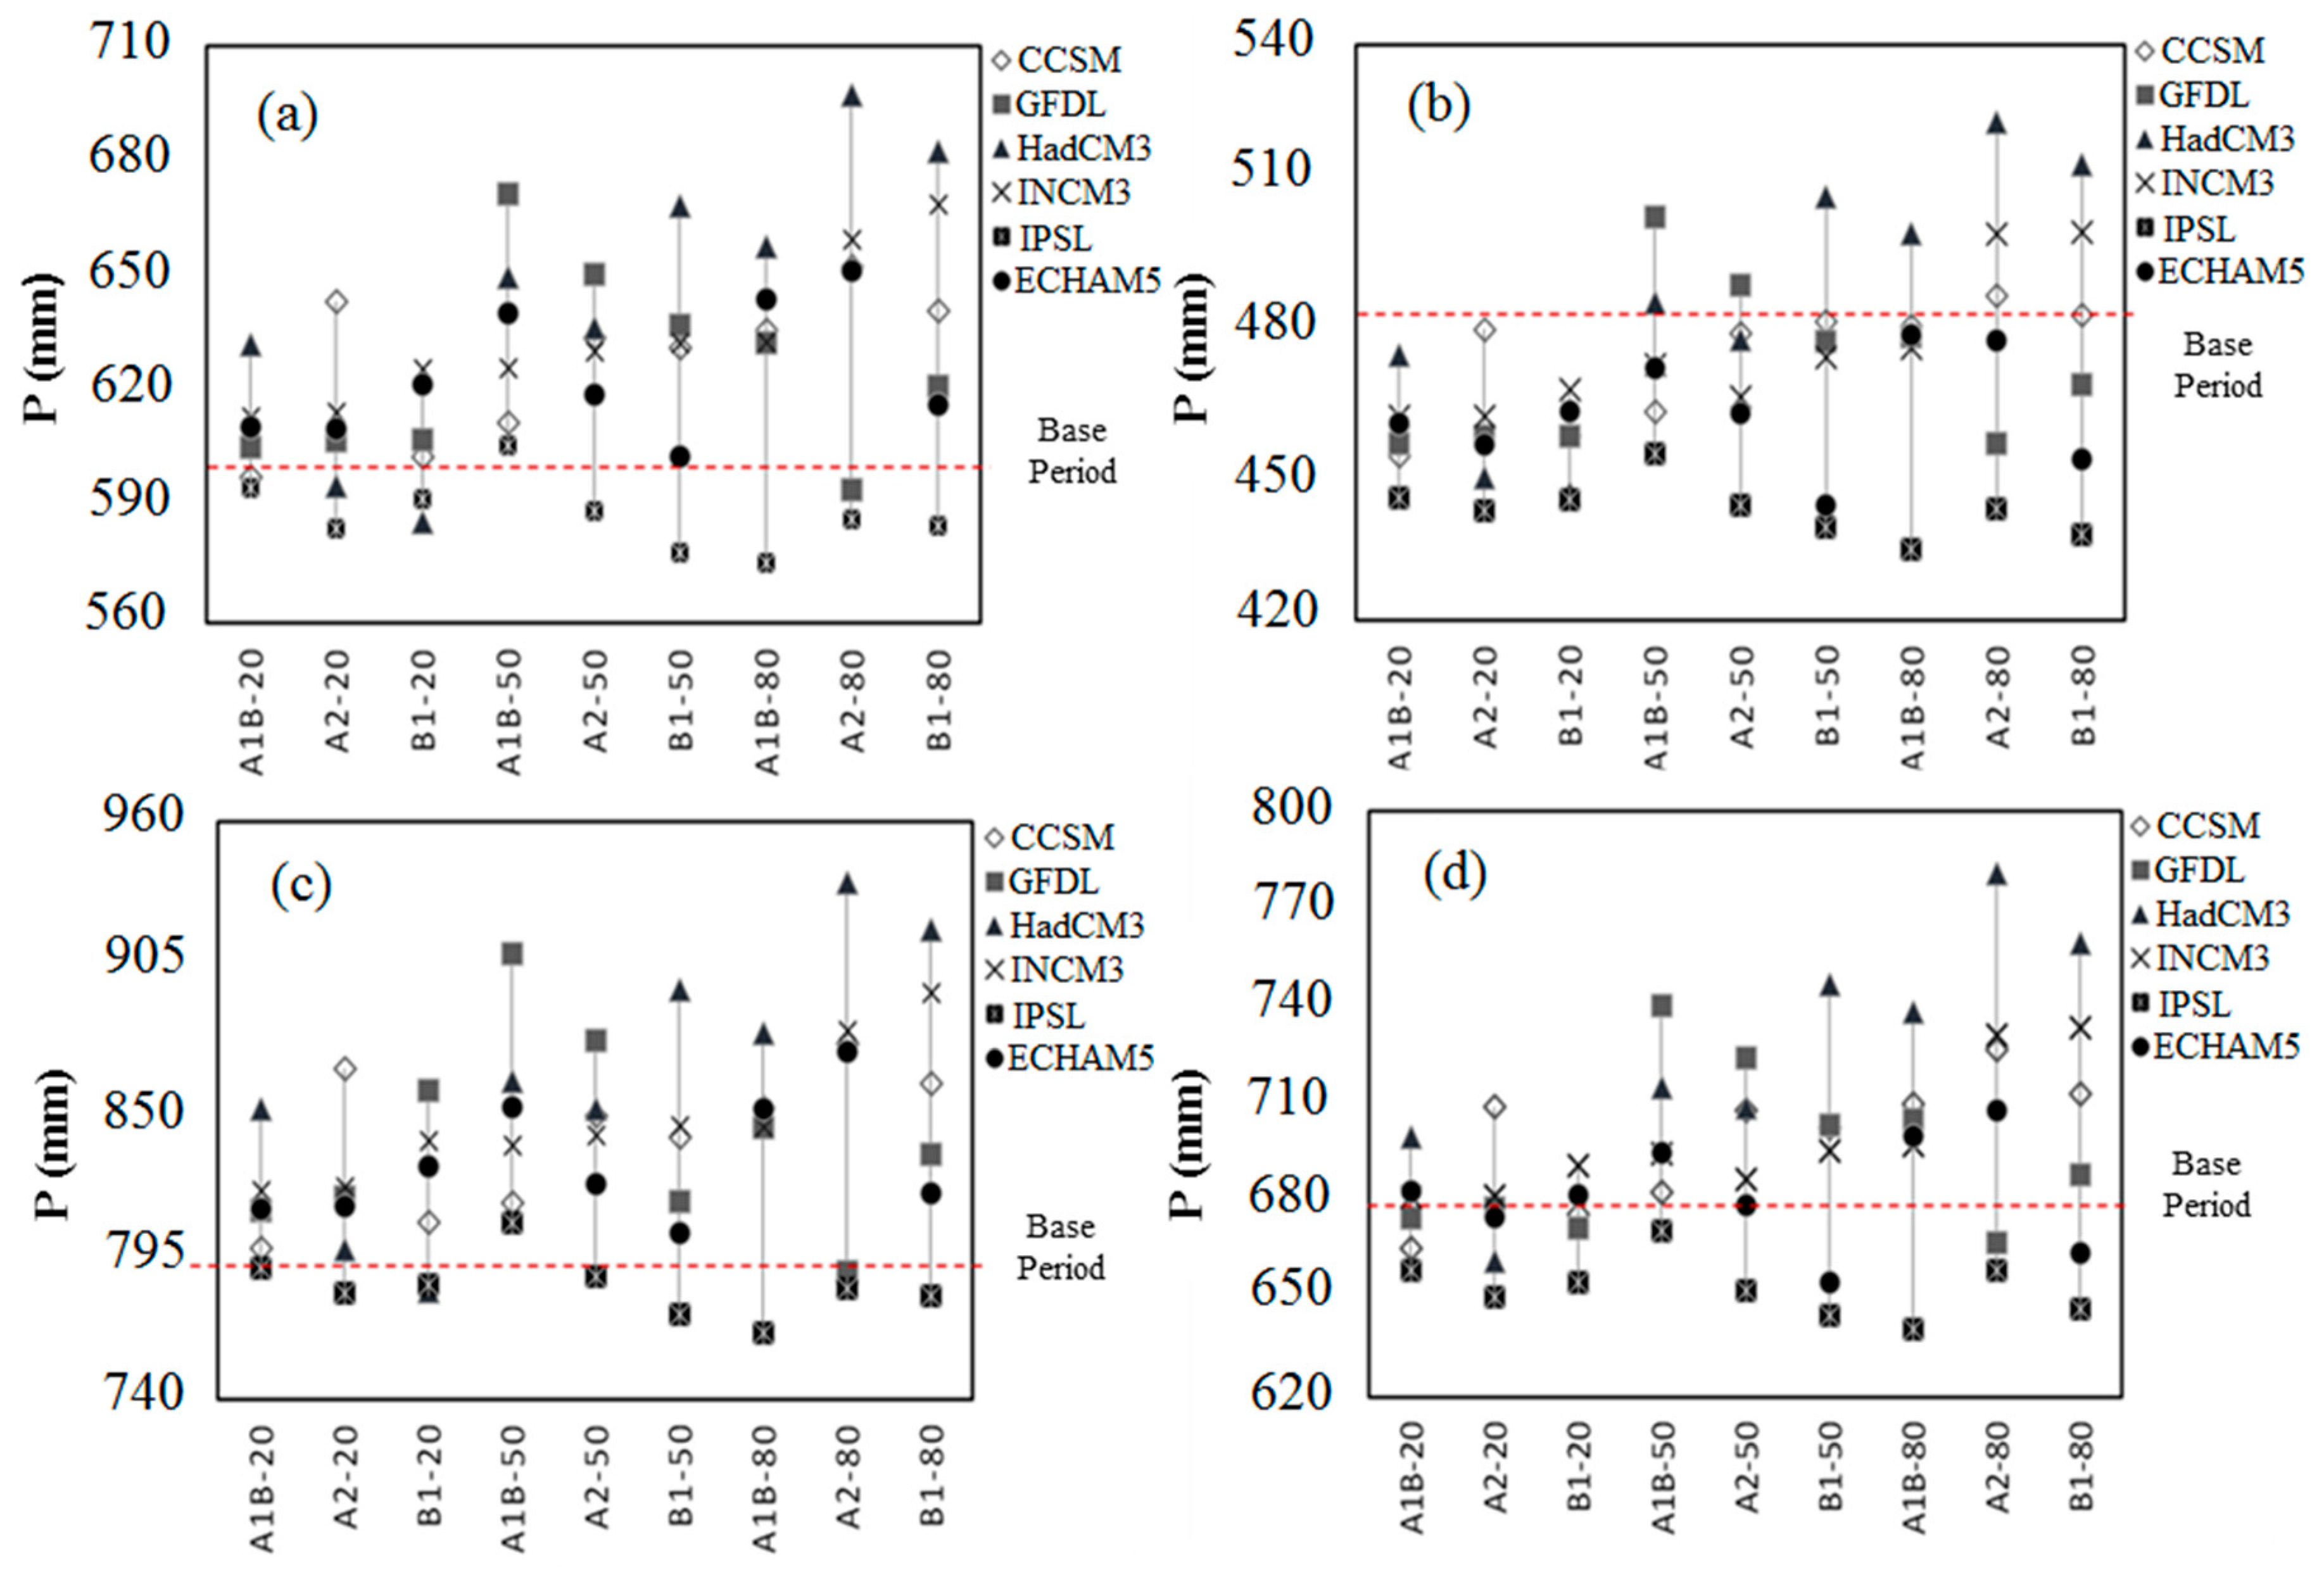
3.1. Projected Impact of Climate Change on Temperature and Precipitation Rates

Figure 2 illustrates the average of the projected temperatures, obtained by different GSTs and the average temperature of the base period (1986–2010). As depicted in Figure 2, all the GCMs and scenarios suggest a small temperature change during the 2020s. However, for SUB-4, a temperature rate increase up to 1.2 °C is projected for the first time horizon. While, based on all the scenarios, a significant rise in the temperature is projected for the time horizons of the 2050s and the 2080s. Additionally, the average of the projected temperatures in the 2080s is higher than in the 2050s. Generally, the B1 scenario suggests a smaller temperature increase during the 2050s and the 2080s; while, scenarios A2 and A1B revealed a higher temperature during these time horizons. Additionally, regarding the differences between the GCMs, it seems that INCM3 mostly shows the lowest rates of the temperature increase, especially during the 2050s and 2080s; while GFDL, in most cases, revealed the highest temperature increase during the 2050s, based on the scenarios A1B, A2, and B1, respectively. Additionally, during the 2080s, the highest temperatures based on all the scenarios are suggested by ECHAM5. As it is shown in Figure 2, the amplitude of the multi-GCM projections of temperature suggests greater uncertainties in the 2080s, compared to the 2050s and the 2020s. Conversely, the values of the projected temperatures by different GCMs are approximately similar for the first time horizon (the 2020s).
The maximum temperature increase is consistently identified by all models for the 2080s time horizon under the A2 scenario, except for SUB-1. In SUB-1, the greatest rise in temperature is revealed by projections of ECHAM5 under the A1B scenario. The greatest temperature increase in the 2080s time horizon compared to the base period ranges from 4 °C (SUB-1) to 4.9 °C (SUB-4).
In a similar way, Figure 3 illustrates the average of the projected annual precipitation for different GSTs, as well as the average of the precipitation for the base period (1986–2010). As it is obvious, most of the GSTs suggest increasing the precipitation amounts compared to the base period. However, the projections obtained by employing IPSL mostly suggest a reduction of the amount of precipitation in the future time horizons, except for the outputs of the IPSL-A1B-2050s for SUB-1 and SUB-3; these show a slight increase in the amount of precipitation. Additionally, projections for SUB-2 show both a rise and decline of the precipitation, compared to the base period, which is mostly inclining towards a decrease of the precipitation rate in the 2020s. Based on the results, the greatest precipitation changes mostly occur in the 2080s time horizon.
Regarding the differences between GCMs, it is clear that the IPSL performs differently. Additionally, GFDL shows greater deviations in the 2050s from the base period. In addition, some inconsistent results were found among the sub-basins. For example, the projections mostly suggest a precipitation decrease in the first time horizon (the 2020s) in SUB-2, while for other sub-basins the precipitation is mostly projected to be increased.
In total, the projections of most of the GSTs indicate a warmer future and a moderate increase in the precipitation amount. However, the results of the precipitation are more anomalous, showing both an increase and decrease of the amount of precipitation. Additionally, for the late 21st century, the GCM-scenario ensemble suggests a wider range of projections for the temperature and precipitation, implying that the uncertainties of the projections increase in a wider time span. The ensemble revealed similar results for the 2020s.

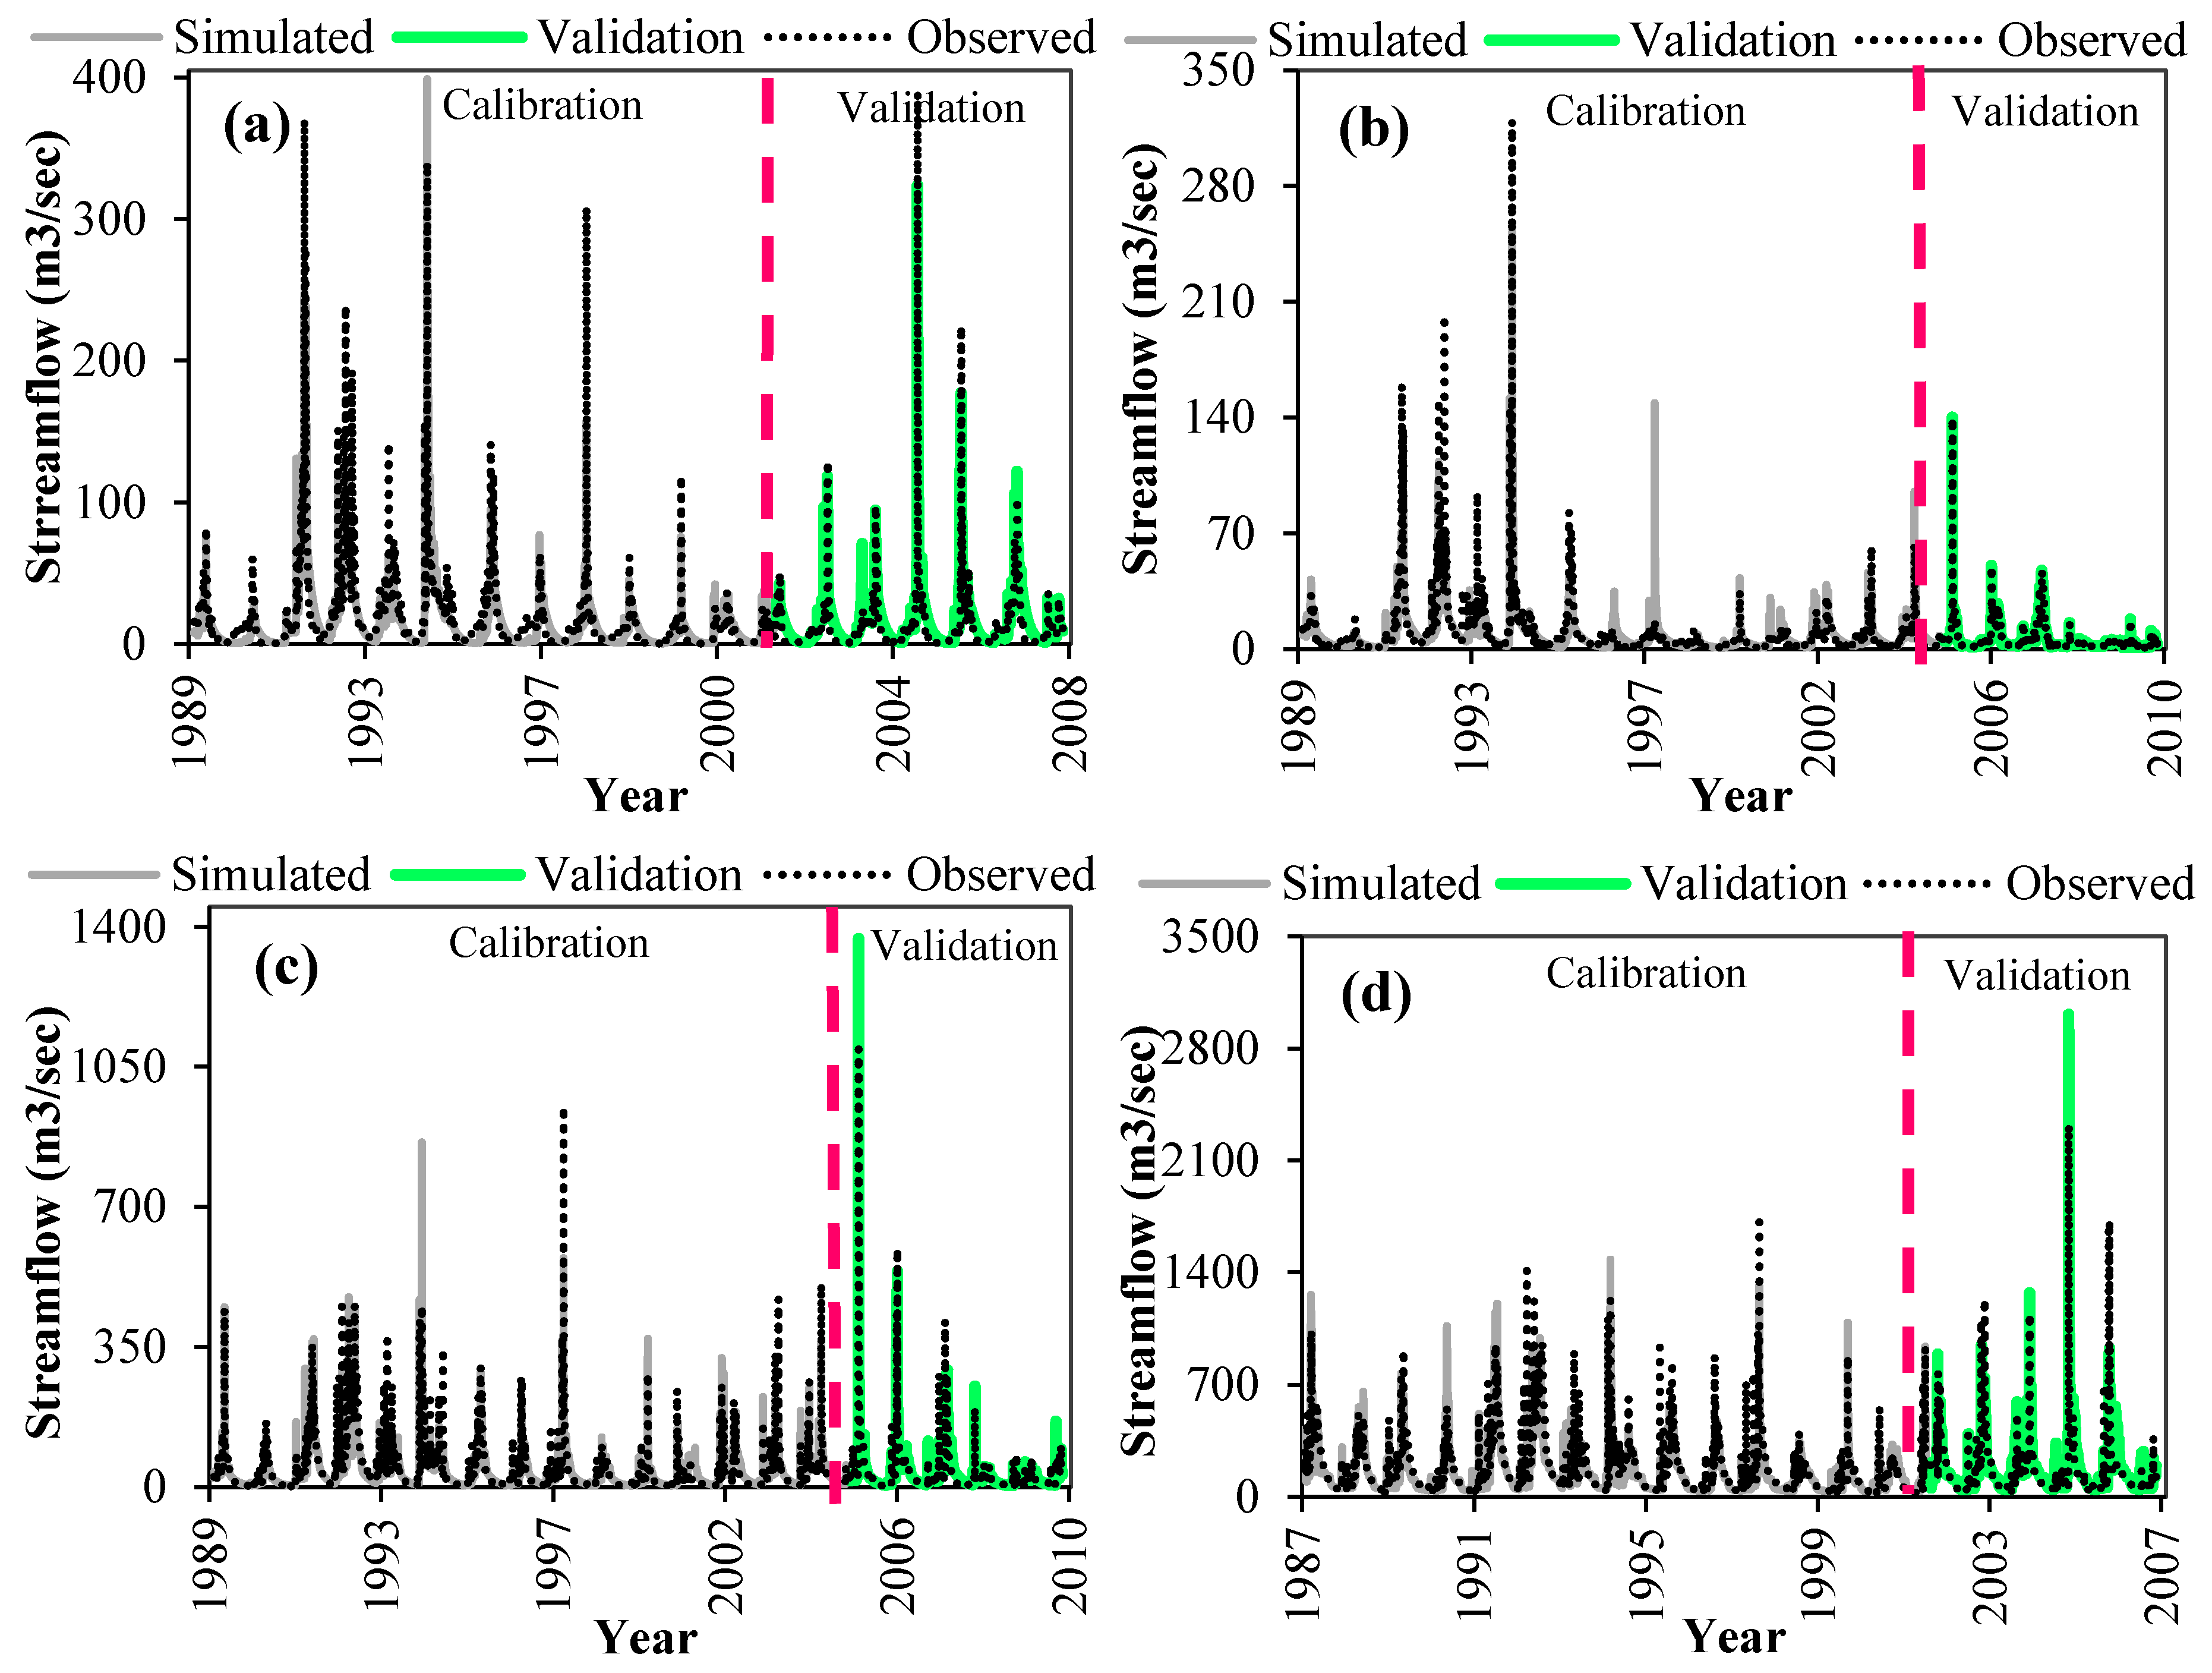
3.2. Hydrological Modeling of the Dez Dam Basin

To simulate the streamflow in the DDB, the semi-distributed HBV model is applied. First, the model calibration was completed using at least 12 years of observed discharge data. After the calibration, the model performance was evaluated using at least 5 years of observed discharge data, independent of the calibration period. It is taken into consideration that the calibration and validation periods cover both dry and wet conditions to ensure that the model is capable of working with different conditions.
Table 3 represents the information regarding the length of the calibration and validation periods, as well as the model performance at each sub-basin. Overall, the statistics show an acceptable performance of the calibrated model. As it is obvious for the validation period, negative values of Mdiff (%) are obtained for SUB-1, 2, and 4, which are mainly due to the reduction of the annual flow during the validation period which coincides with the final years of the observation period. Figure 4a–d shows the observed and simulated streamflow at the outlet of the four sub-basins during the calibration and validation periods.

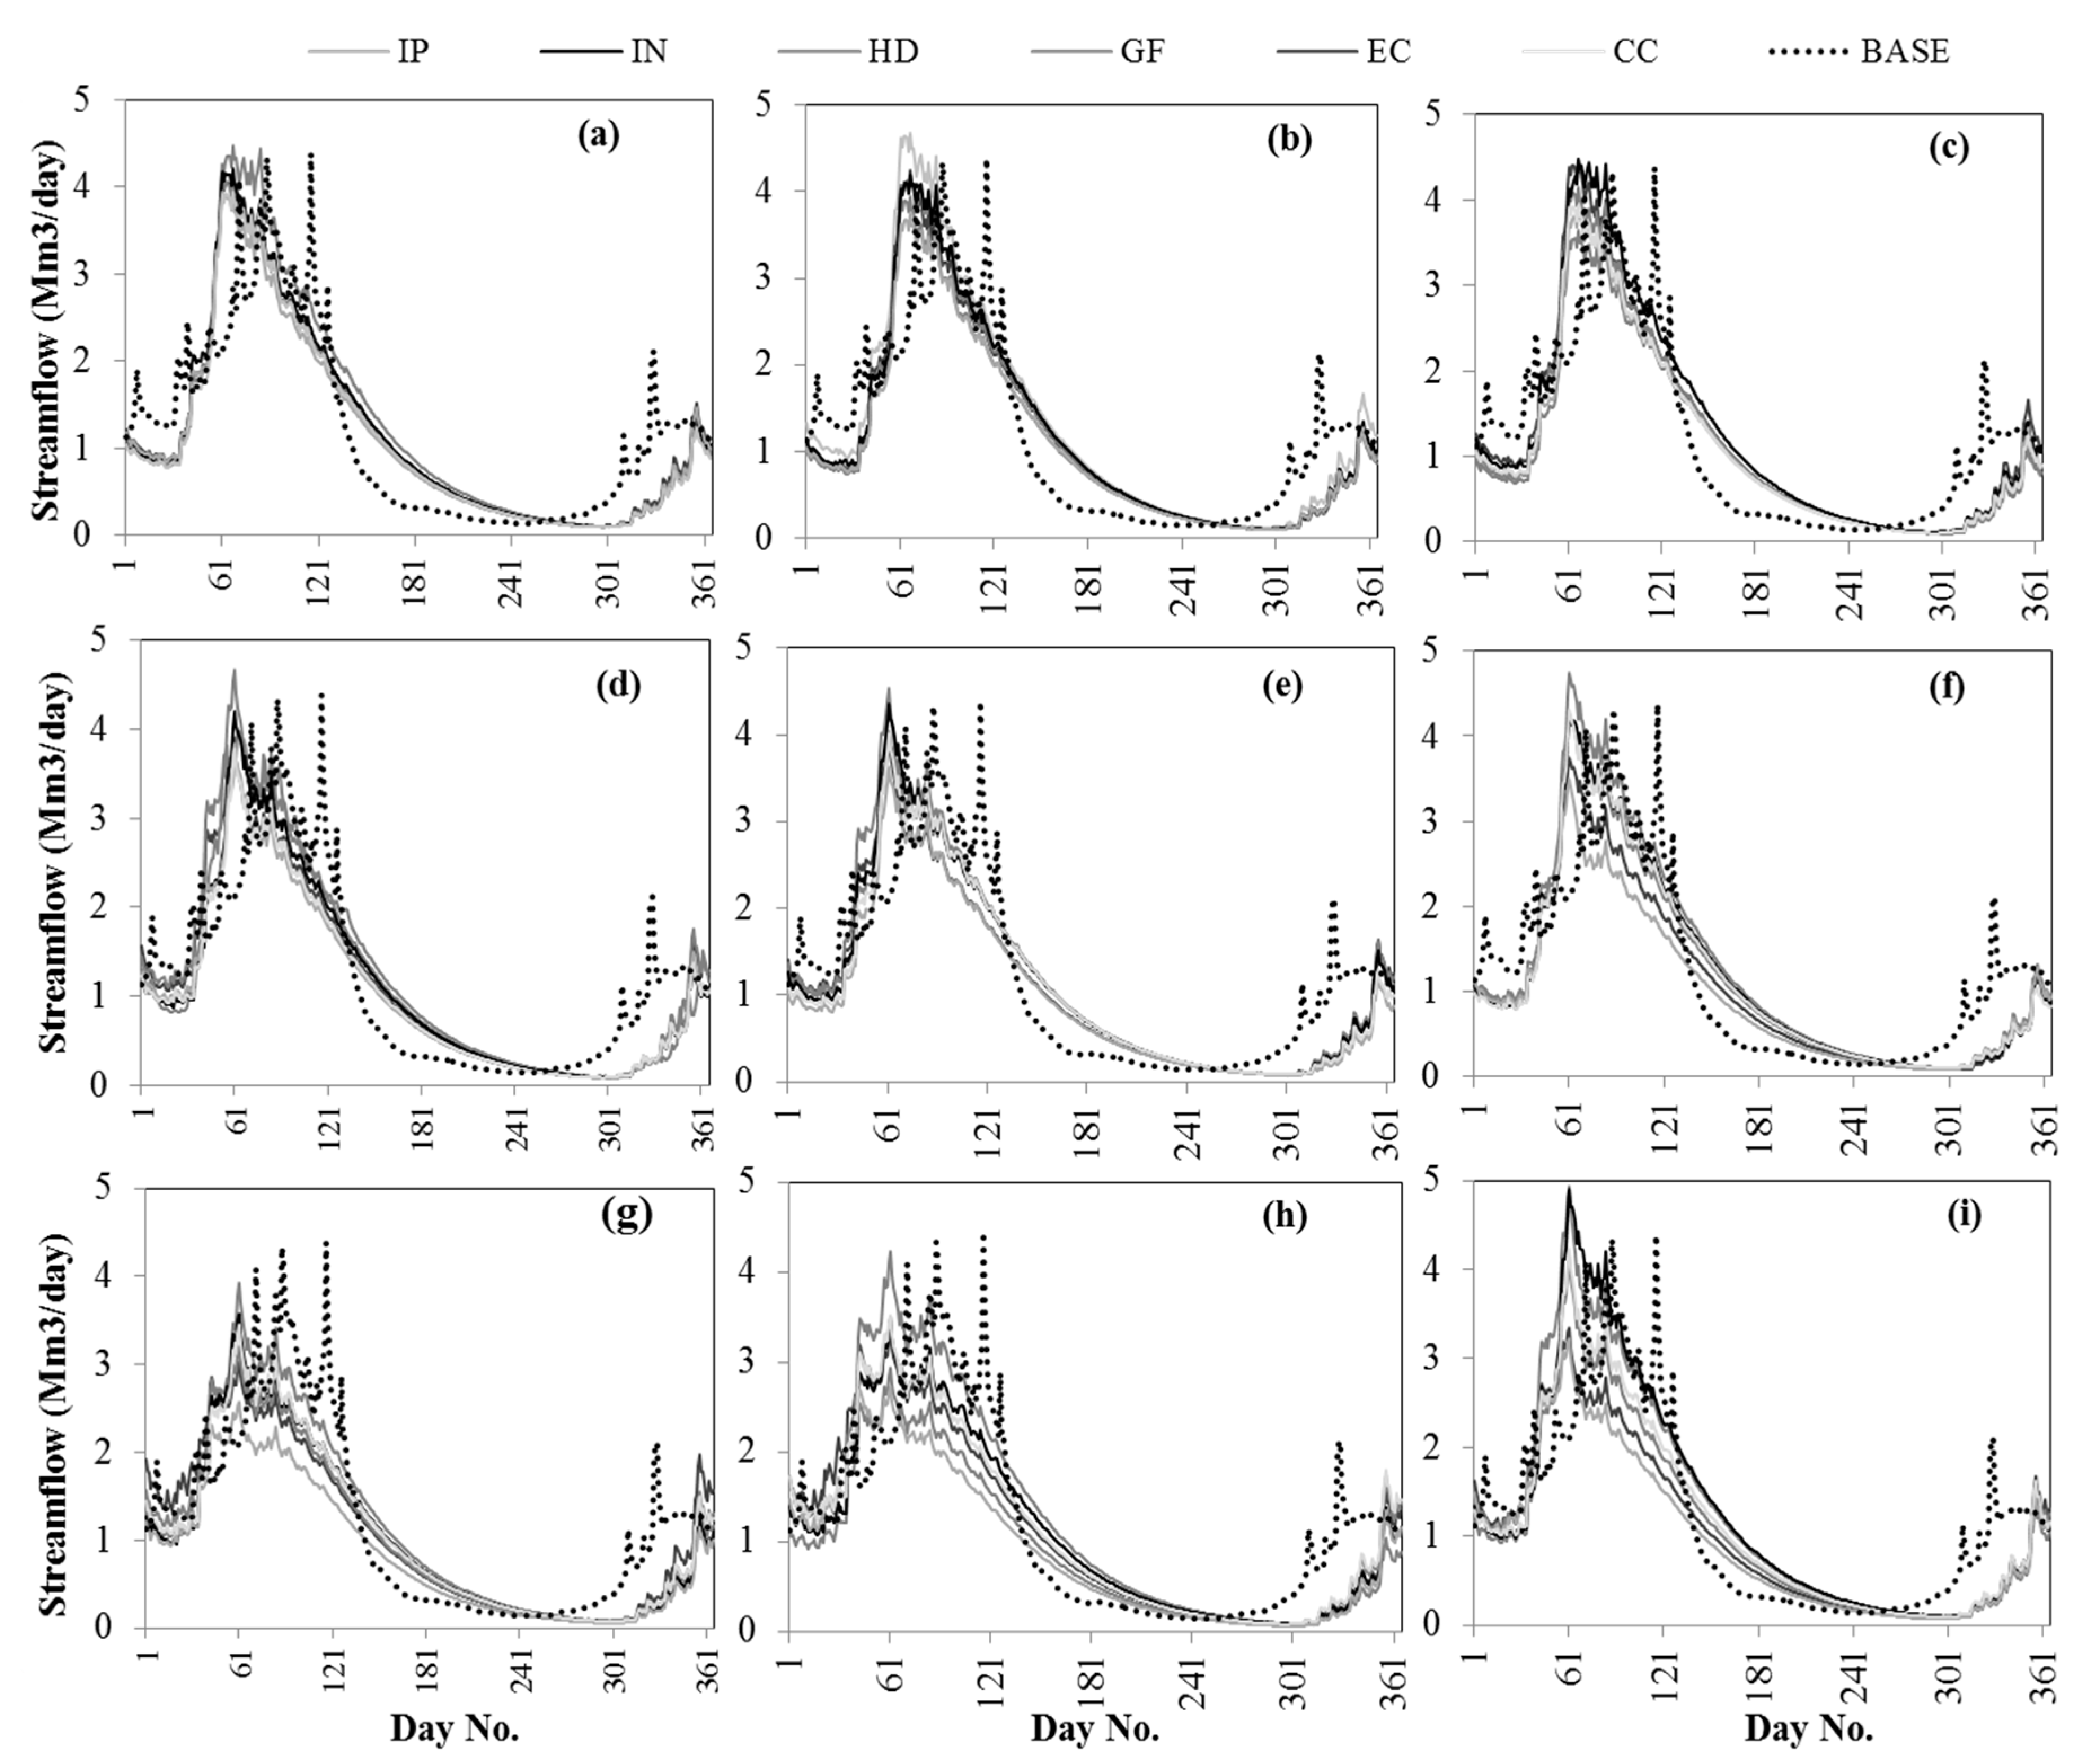
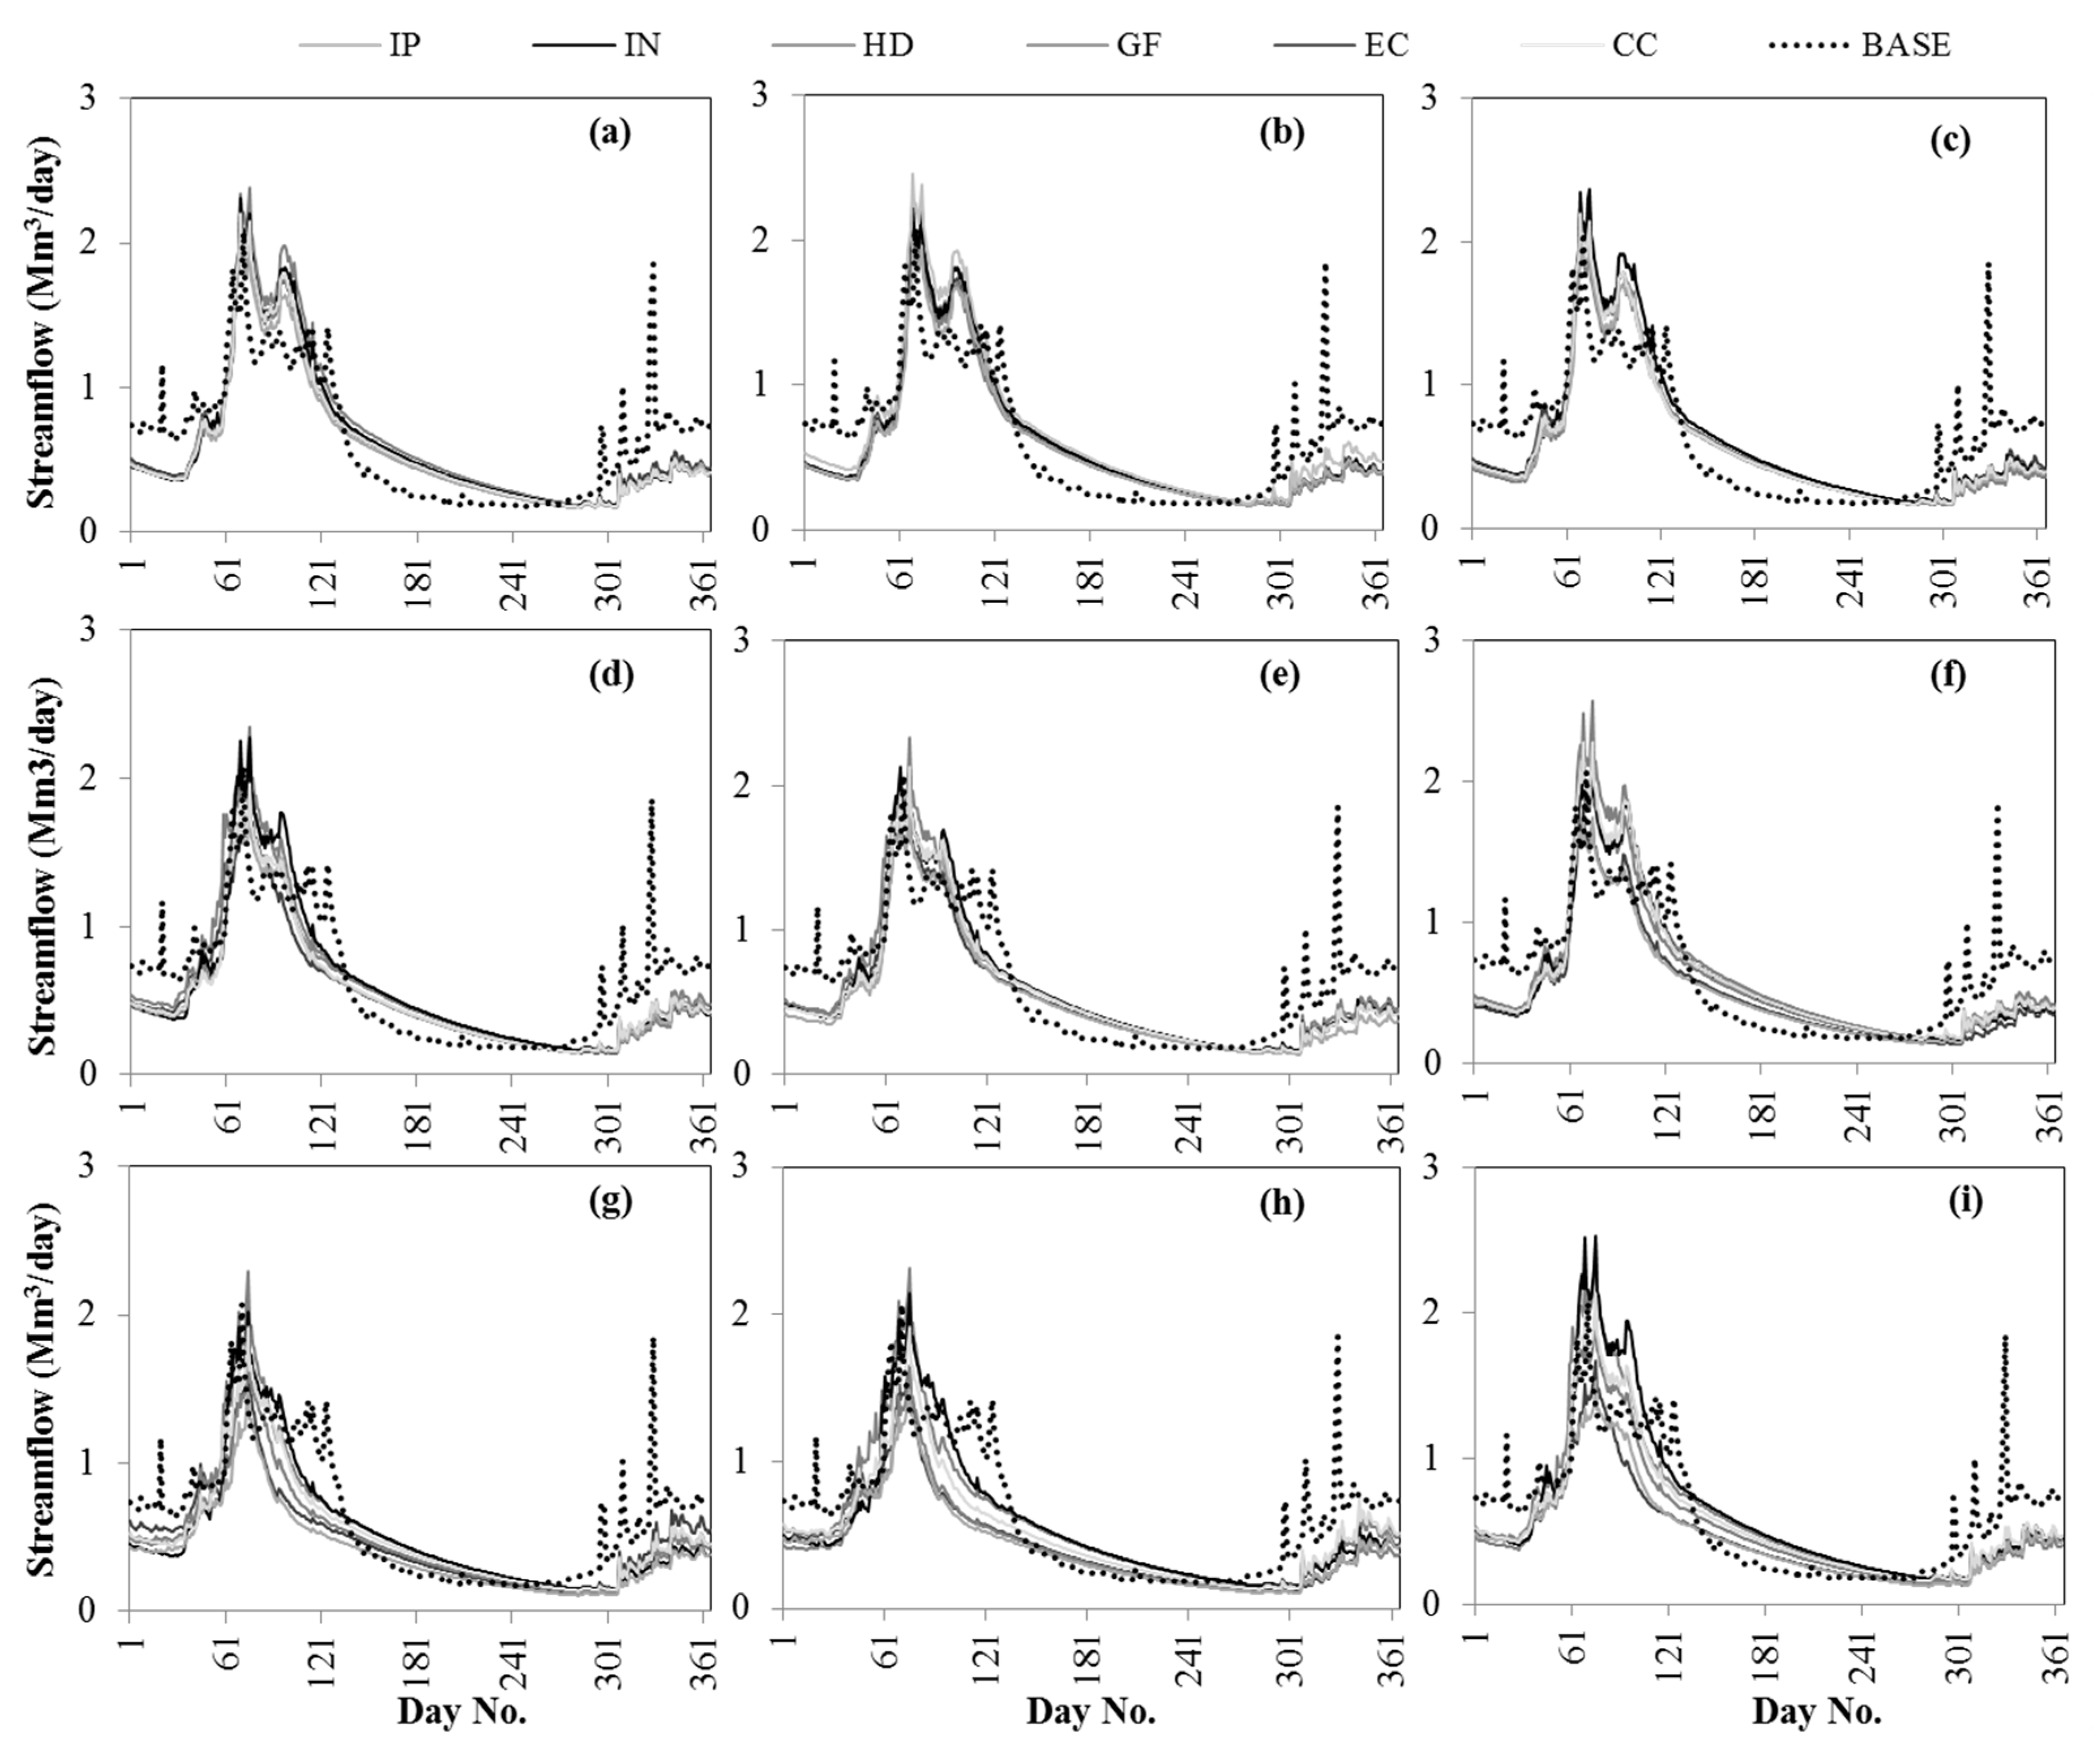
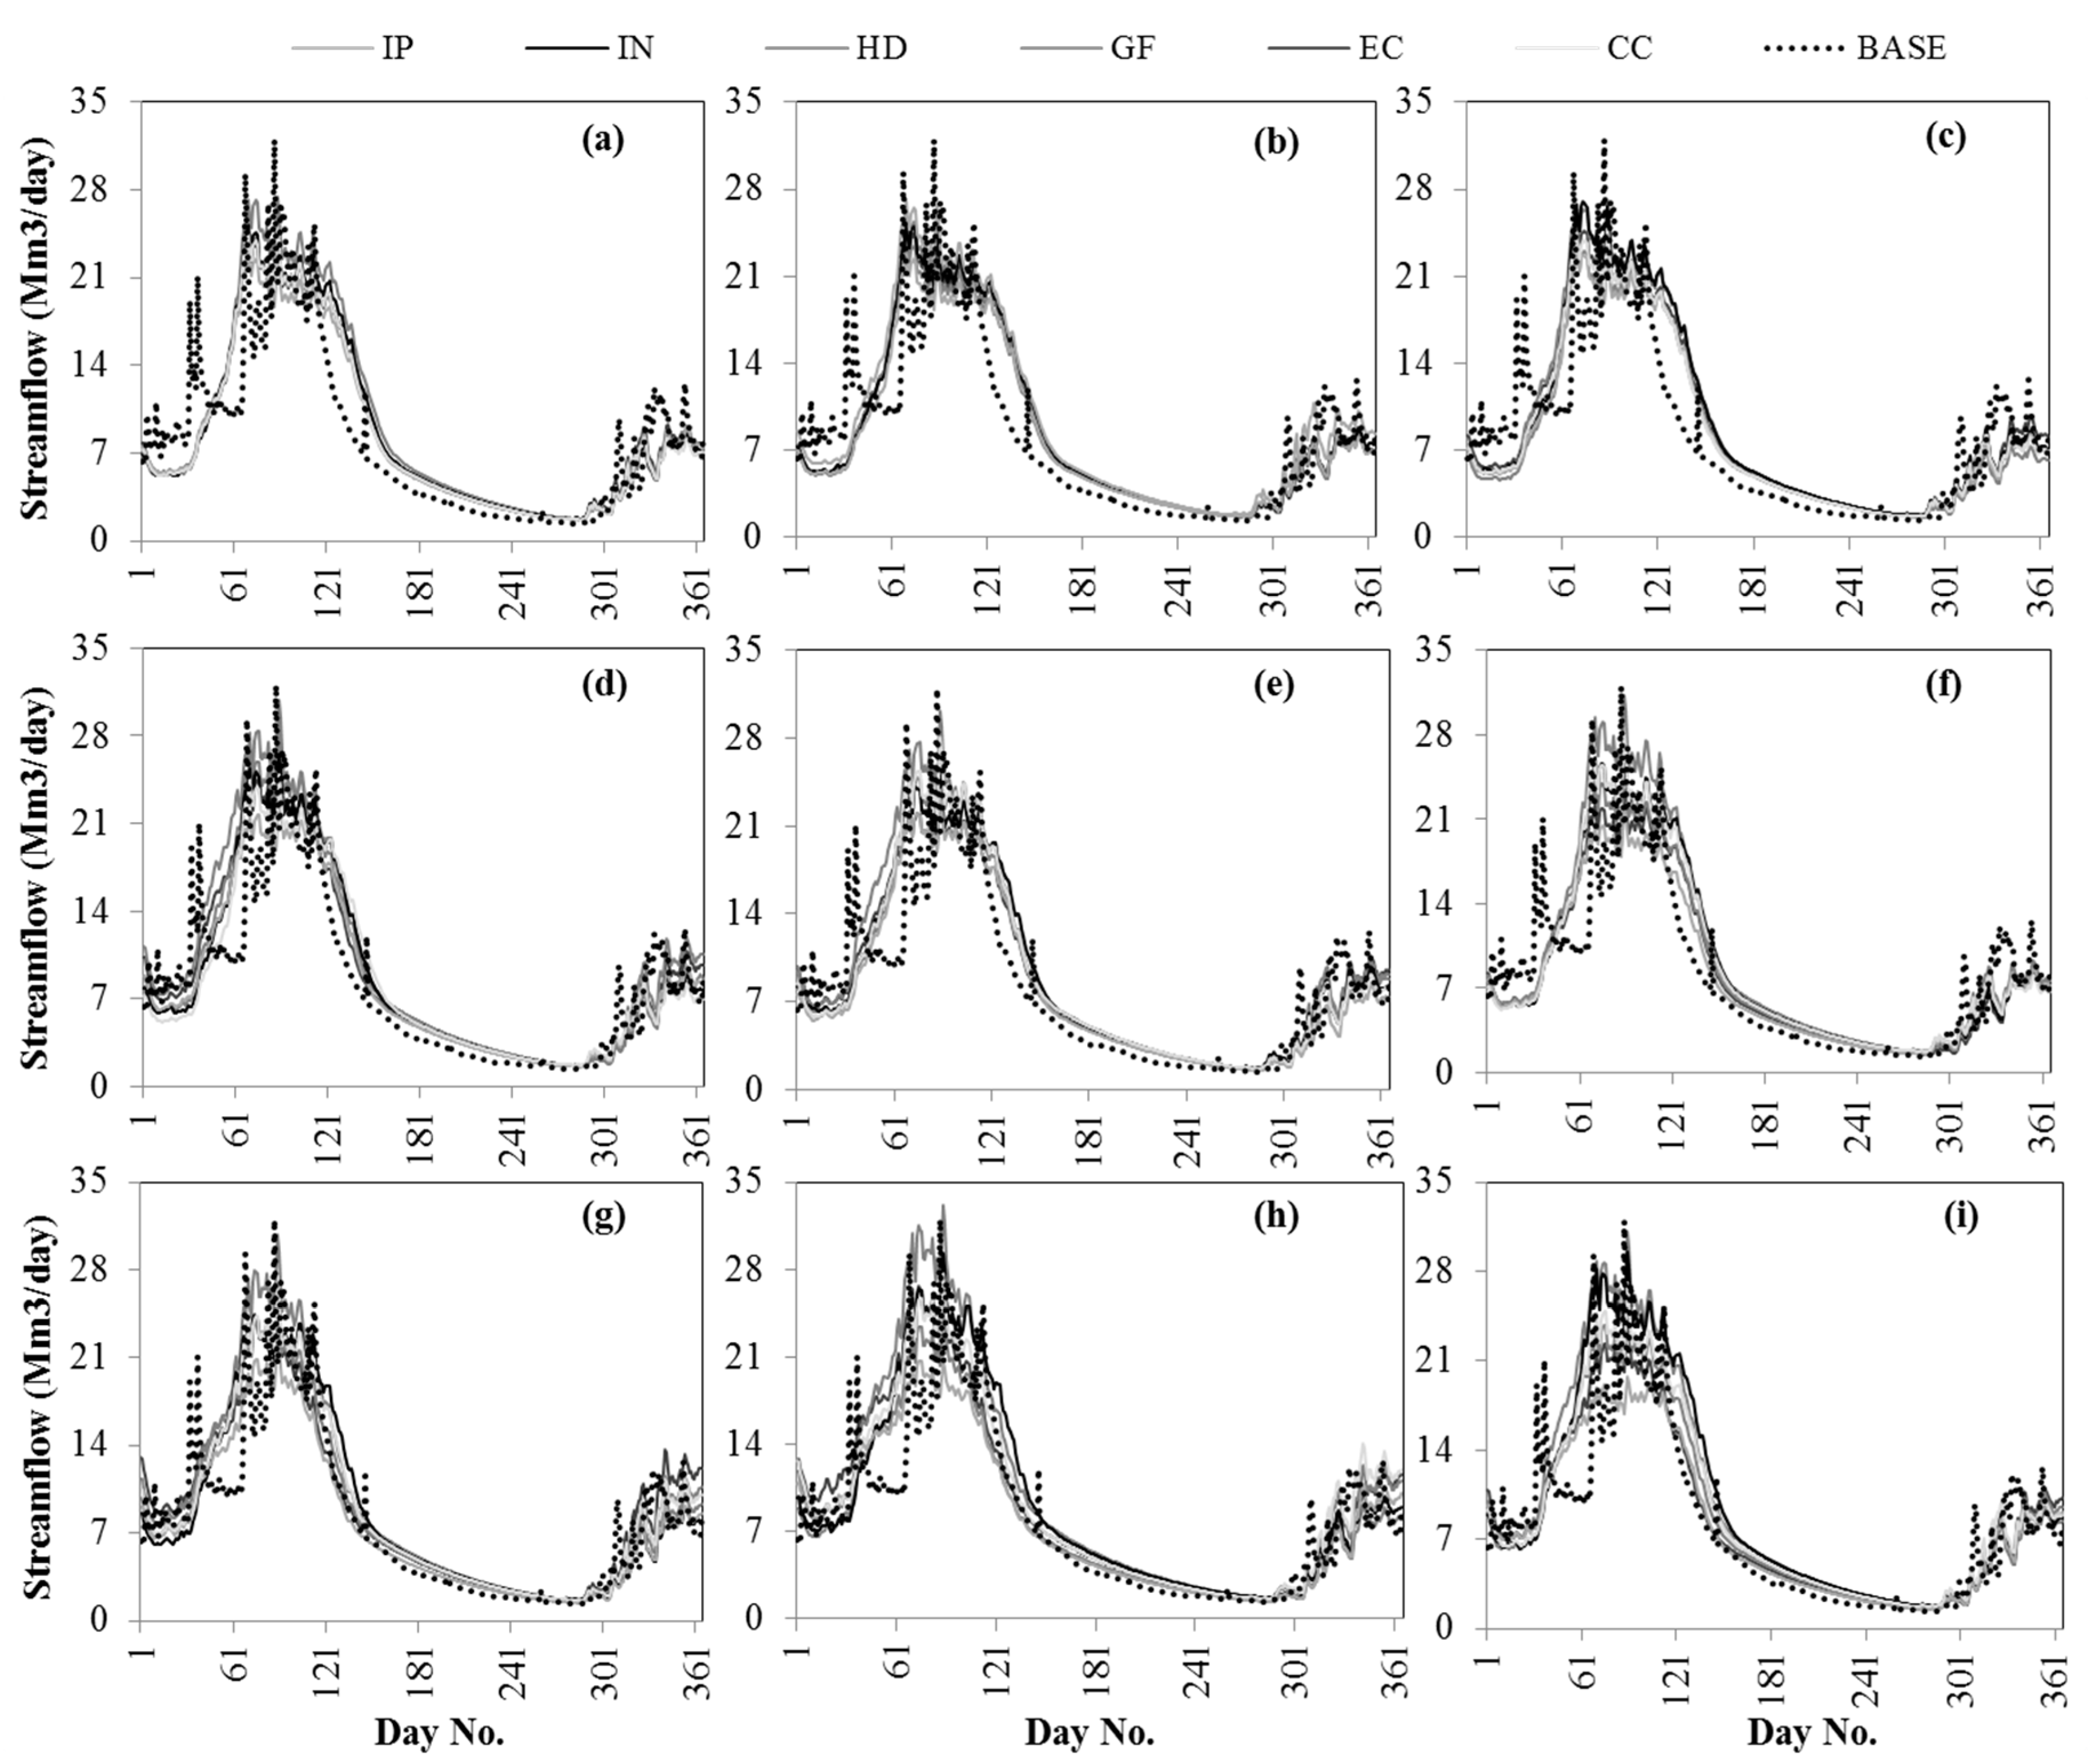
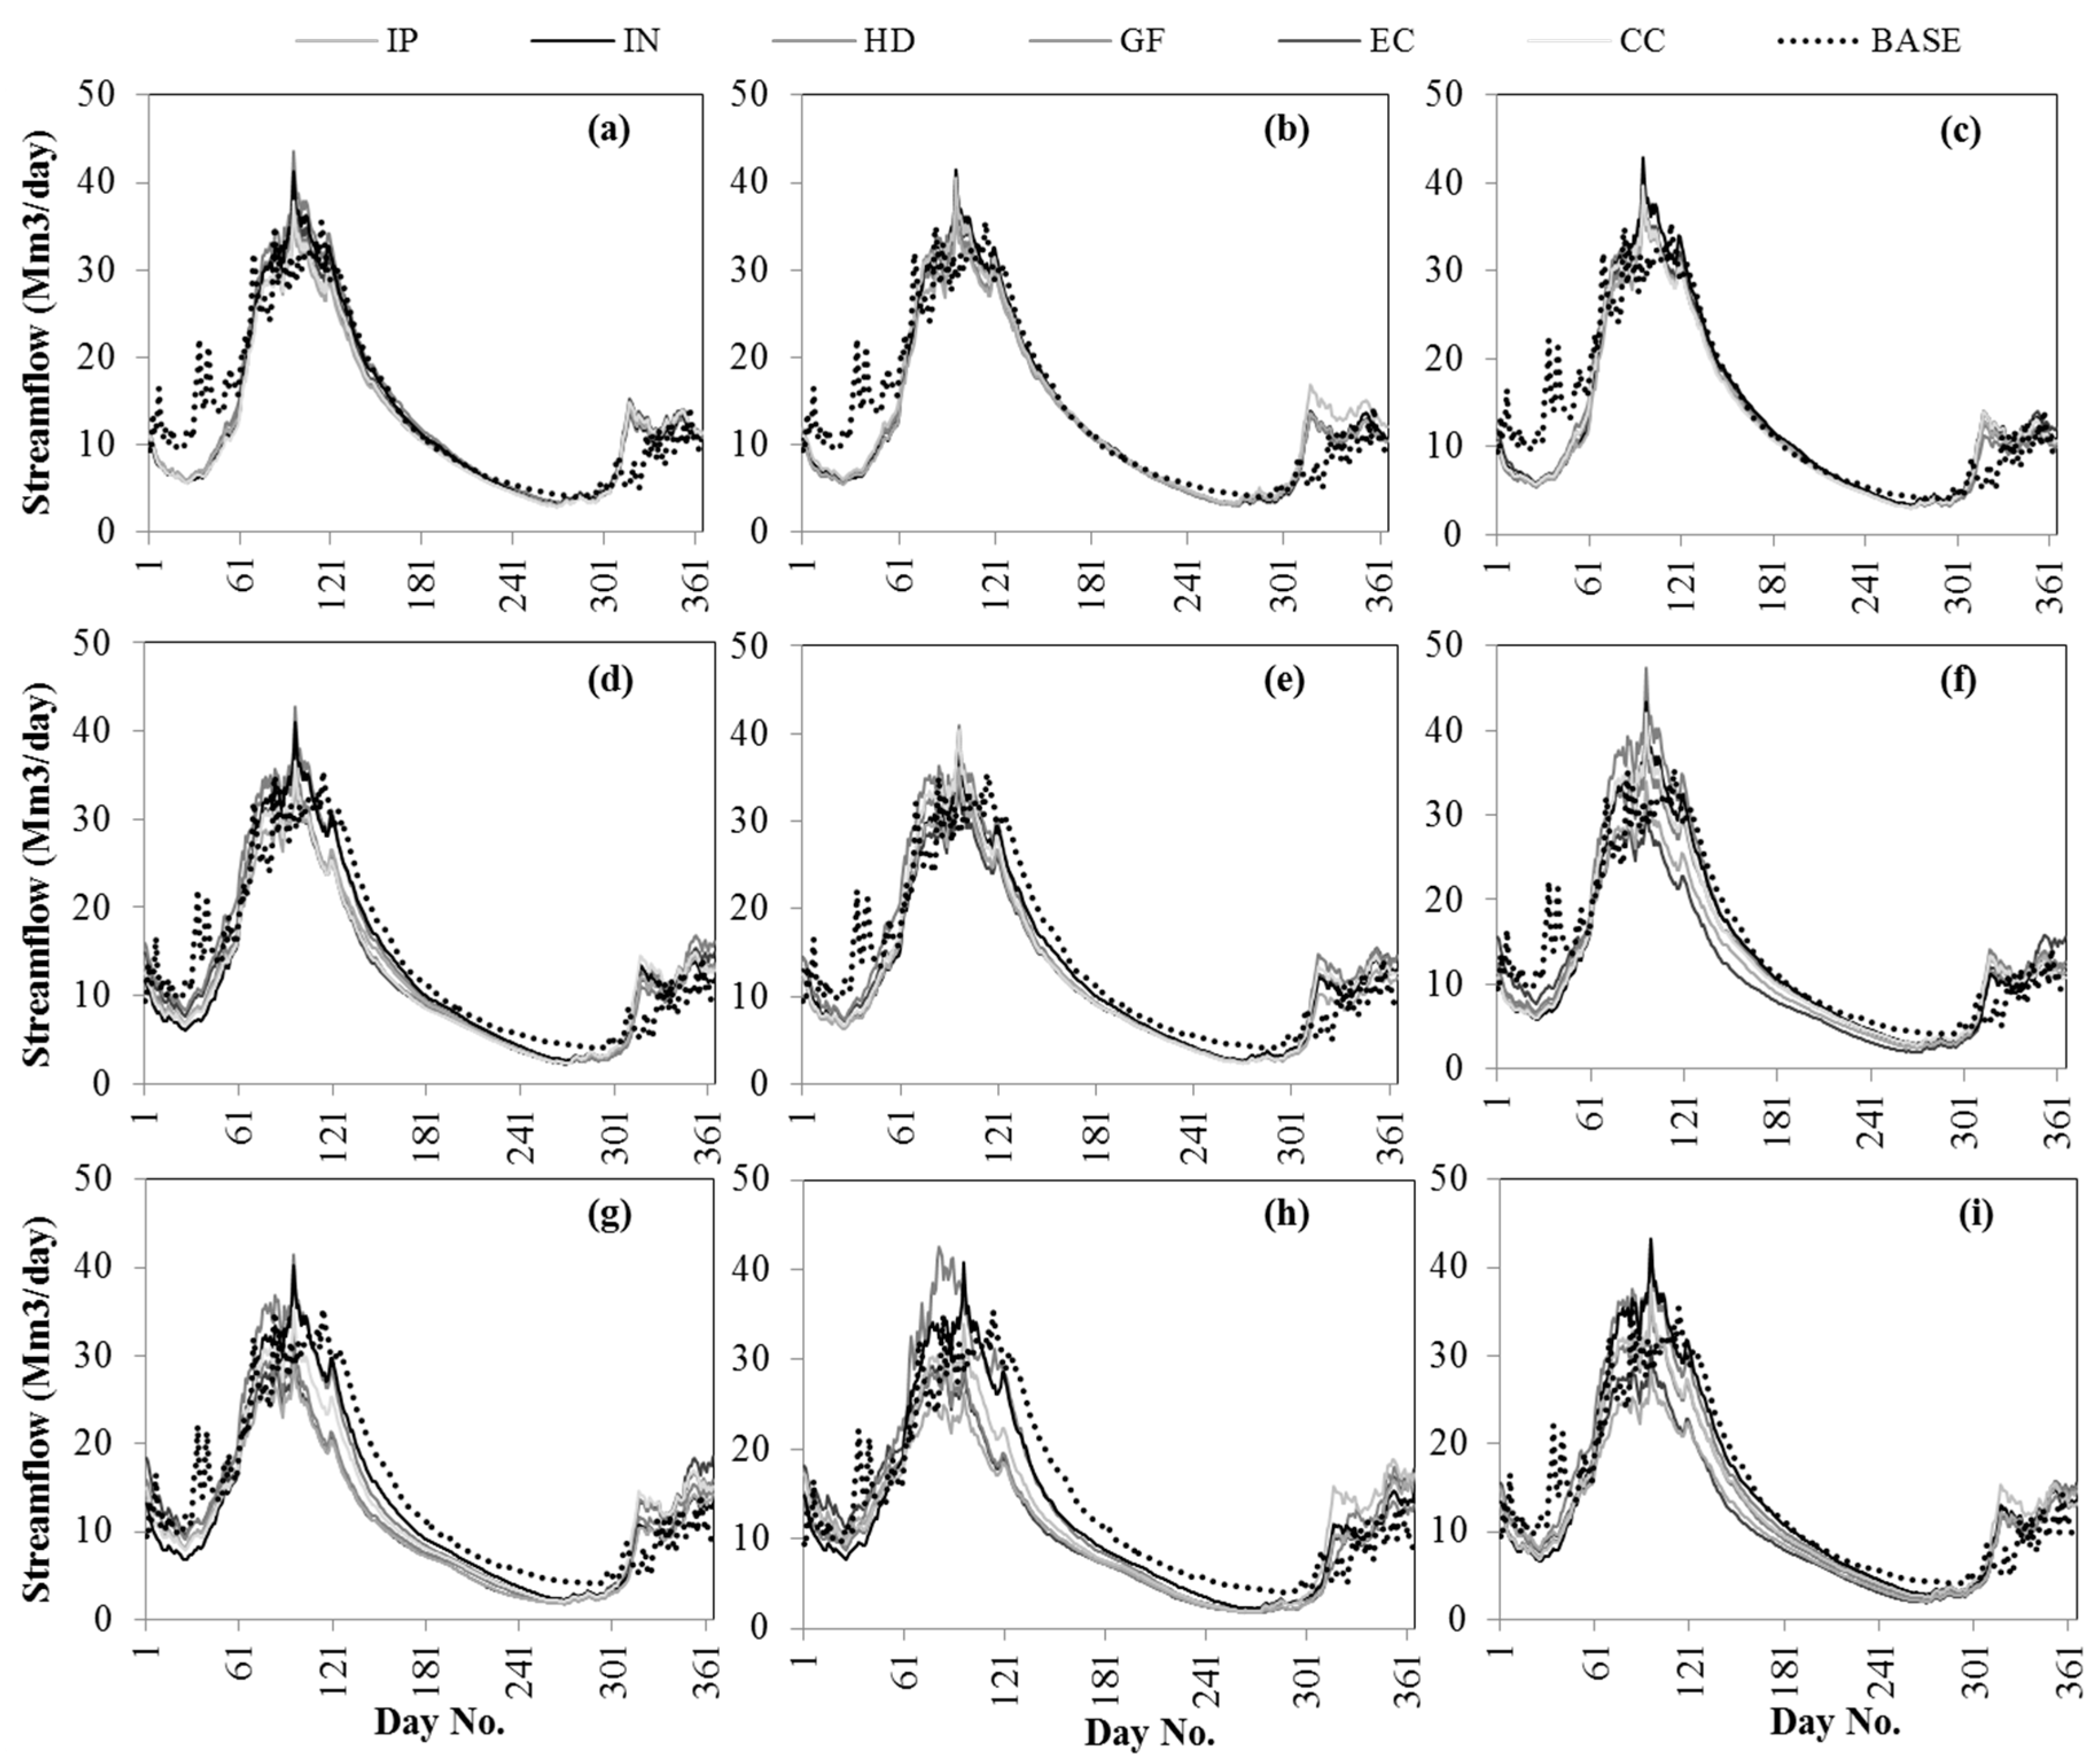
3.3. Hydrological Simulation under Climate Change Scenarios

After ensuring the efficiency of the calibrated model, the streamflows were simulated under different climate change scenarios with the projected T and P time series as inputs. Figure 5, Figure 6, Figure 7 and Figure 8 illustrate the annual pattern of the simulated streamflows under the considered GSTs, as well as the observed discharge during the base period (1989–2009), for SUB-1 to SUB-4, respectively. As it is shown, the amplitude of the future simulations shows a significant variability implying inconsistencies between the simulated streamflows by different GCMs, mainly for the 2050s and 2080s. Obviously, the differences between the simulations are smaller during the 2020s, while the highest variations are associated with the late 21st century. These findings are in agreement with Vidal and Wade [55] who found a highly increasing variance in the late 21st century due to the spread of the outputs of different GCMs. In addition, the greatest inconsistencies between the simulated streamflows correspond to the higher amounts of discharge, which mainly occur during April and March.
Based on the simulations presented in Figure 5, Figure 6, Figure 7 and Figure 8, not only the amount of discharge, but also the flow regime experiences some changes under the studied climate change conditions. As for SUB-1 (Figure 5), the advancing shift of the peak flows compared to the base period is obvious for all time horizons, while for SUB-3 (Figure 7), the advancing shift occurs during the 2080s, and for SUB-4, (Figure 8) it was found that the peak of the annual hydrograph occurs earlier during both the 2050s and 2080s time horizons. Similar results indicating the advancing shifts of the peak flows under climate change conditions are widely documented by different researchers. Regarding the timing of the peak flow, Nohara et al. reported that under climate change conditions, the peak flows shift earlier [18]. This is because of the temperature increase which causes the snowmelt to start sooner. Similarly, the hydrologic regime change and advancing shifts of the peak flows is reported by Gan et al. in the Naryn river basin (Central Asia) [17].
Table 4 summarizes the percentage of the variations of discharge for each sub-basin based on the applied GSTs.
As it is obvious in Table 4, the sub-basins of the DDB respond differently to climate change. For example, the surface flow of the SUB-3 (in most cases) seems to be less affected by climate change compared to other sub-basins. There are similar reports by other researchers about the different responses to climate change of nearby sub-basins within a region. Nazif and Karamouz, by studying the variability of streamflows in Central Iran under climate change, showed that the streamflows are significantly altered [56]. However, they noticed that the responses of three adjacent basins to climate change were different. Additionally, Ashraf Vaghefi et al. employed the CGCM model, forced by three SRES scenarios, to project the future water resource availability in the Karkheh River Basin, located in West and Southwest of Iran and found that the freshwater availability increases in the northern parts of the basin but it decreases in the southern regions [57]. Additionally, Musau et al. reported that the sensitivity of the four adjacent watersheds, considering their hydrologic response to climate change, were different [26]. This highly spatial variability of the responses of the adjacent sub-basins underlines the importance of studying the impact of climate change on the hydrological conditions in local scales in order to get a better perspective of the behavior of each basin, rather than a holistic view.
As shown in Figure 5, Figure 6, Figure 7 and Figure 8 and Table 4, the results vary based on the GCMs used. For instance, the amount of annual flow of SUB-3 for the 2080s is projected to increase based on INCM3 (A2 and B1). However, IPSL suggests a reduction of flow in SUB-3 for the same time horizon and scenarios. Generally, among the six applied GCMs, IPSL revealed higher reductions in the flow. Therefore, not only were the results for the studied sub-basins different, but the projected response of a certain sub-basin by different GCMs could also be dissimilar. This result is in good agreement with other studies as many researchers have so far identified the GCMs as the main source of uncertainty and reported that the GCM selection can cause significant deviations in the results of the climate change impact assessments [25,44,46]. In this regard, Graham et al., by examining different RCMs, GCMs and hydrological models, concluded that the choice of GCMs is more determinative than other factors [45]. Likewise, Habets et al. applied several climate models, hydrological models, downscaling methods, and emission scenarios to simulate the future water resources and reported that the uncertainties caused by the climate models are 3–4 times greater than other factors [47]. As mentioned by Turco et al., significant differences and deviations between the results of different GCMs/RCMs imply large uncertainties regarding the use of a certain combination of GCMs and RCMs [48]. Additionally, Fang et al. documented that most of the streamflow uncertainties correspond to the structural uncertainty of GCMs [33]. Vidal and Wade mentioned that the highly increasing variance of the late 21st century is mostly due to the spread of the results obtained from different GCMs [55].

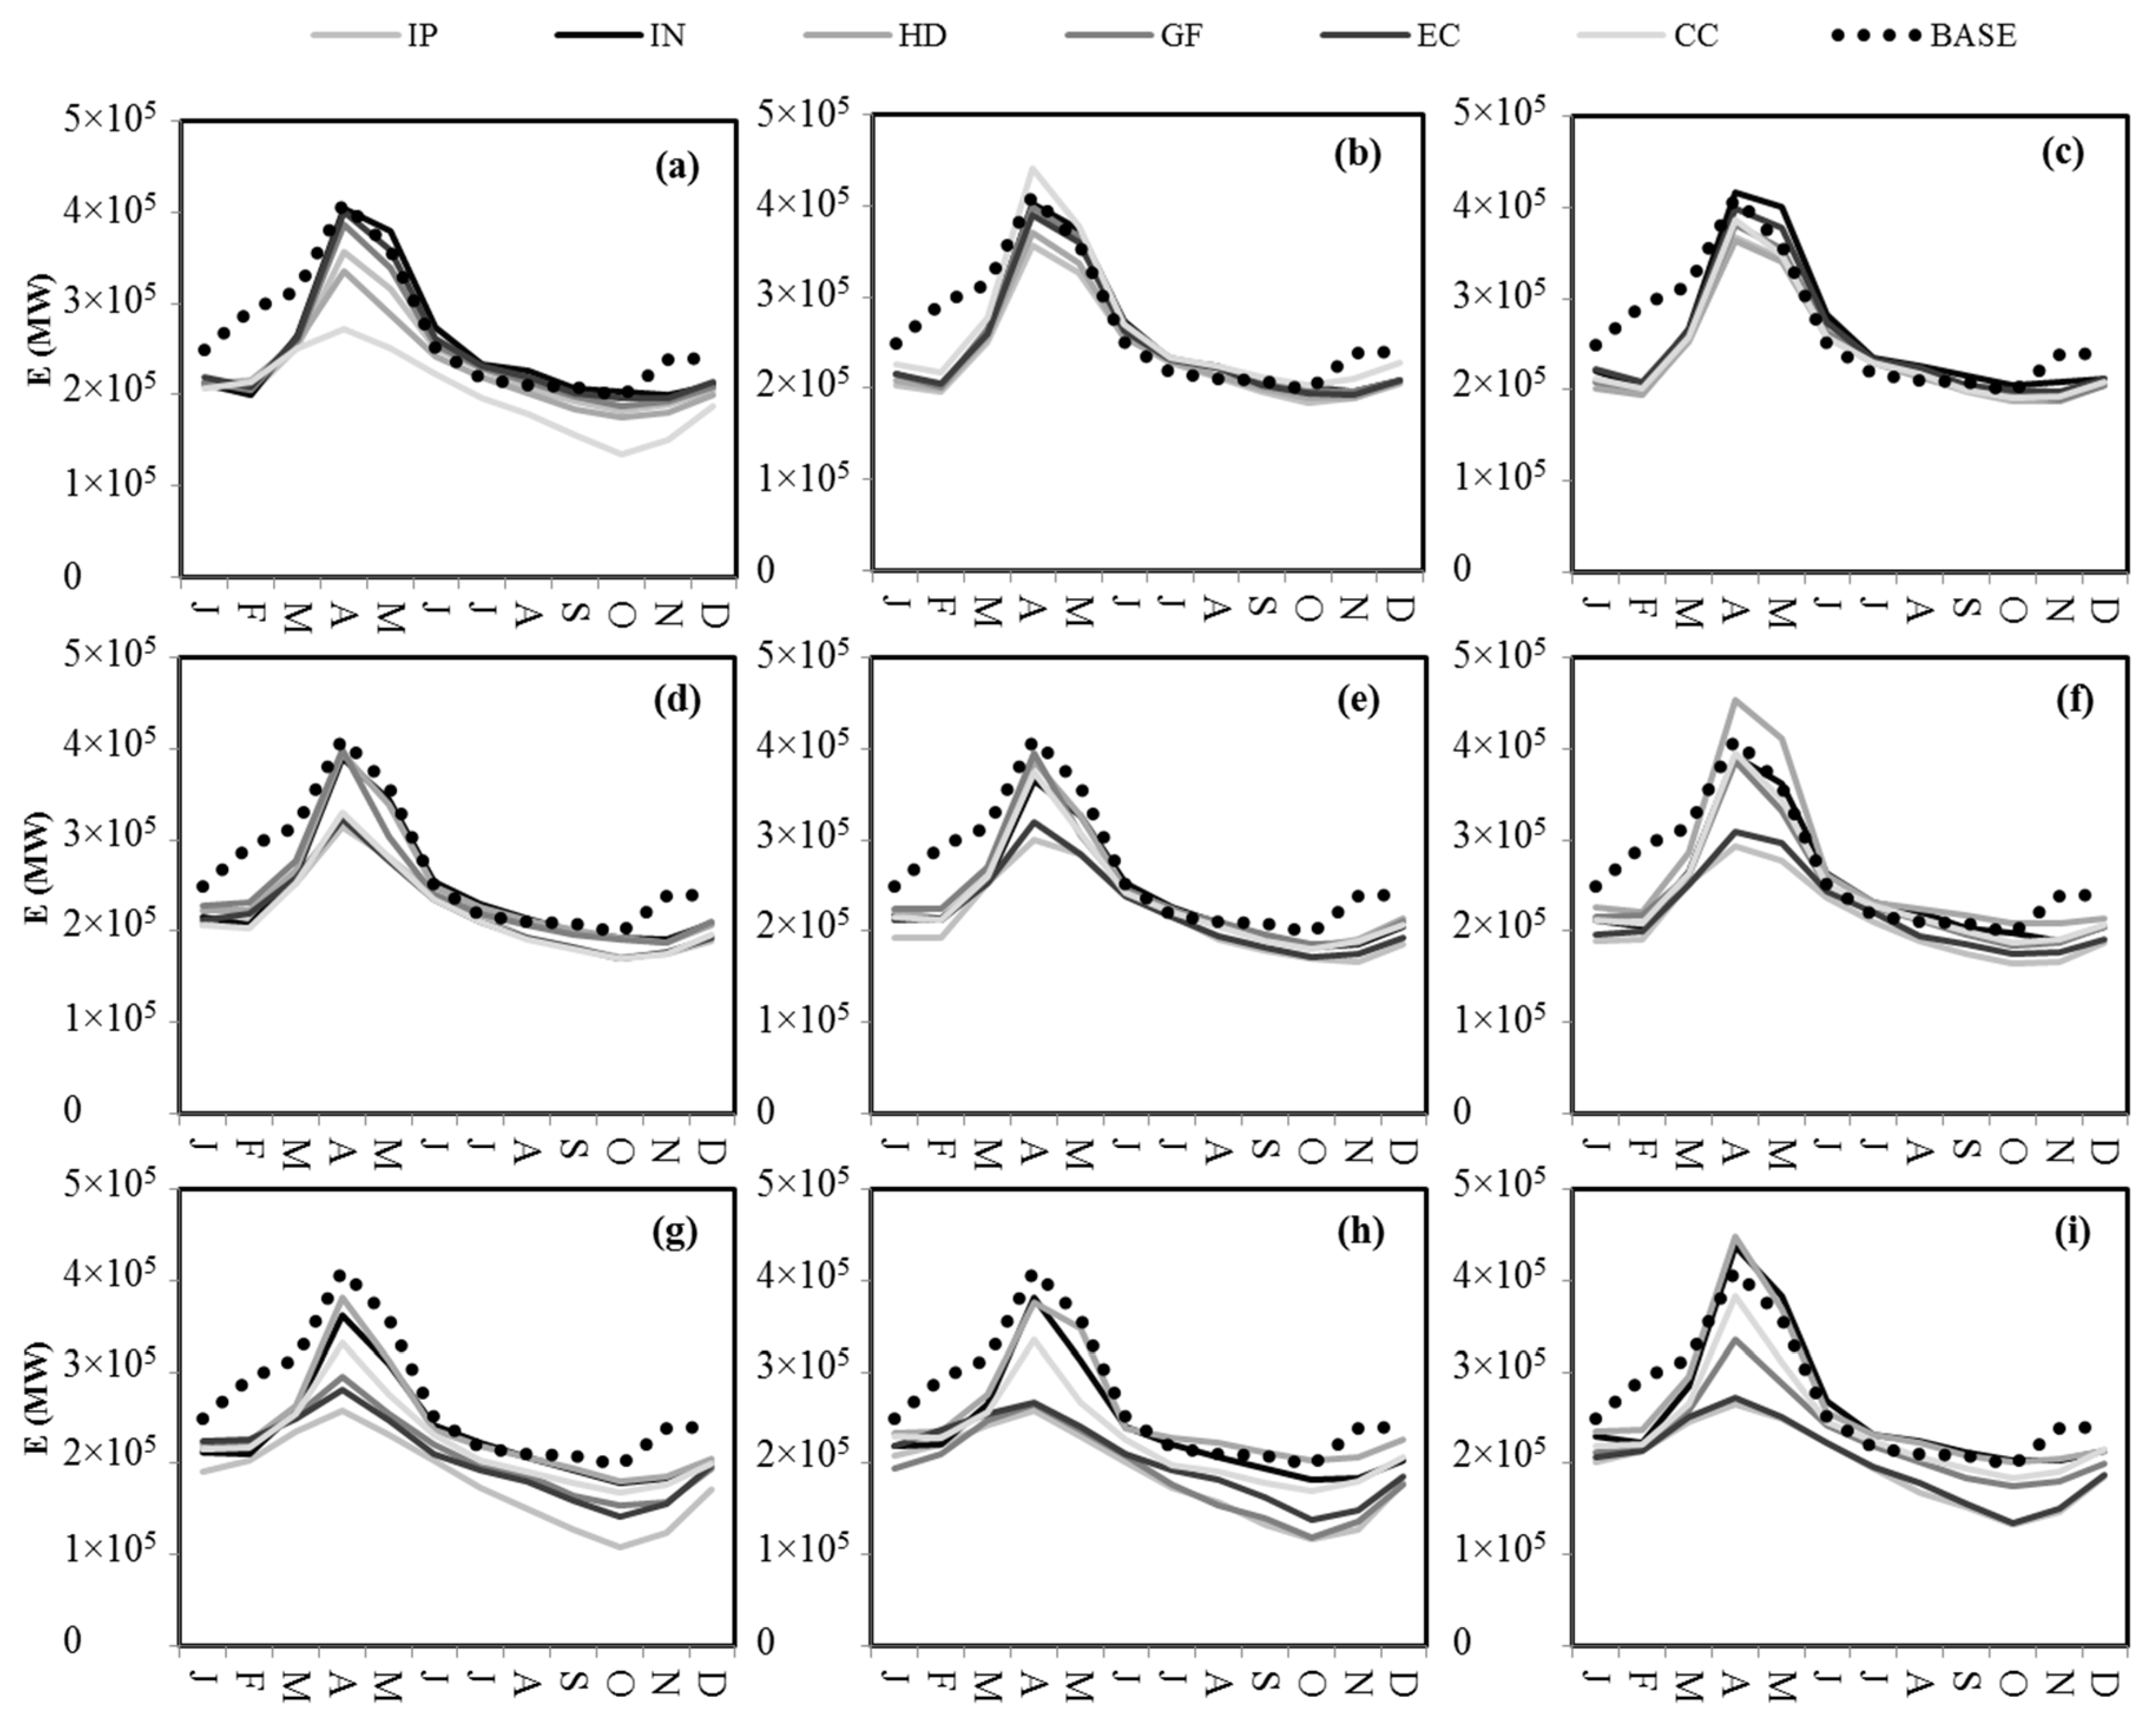
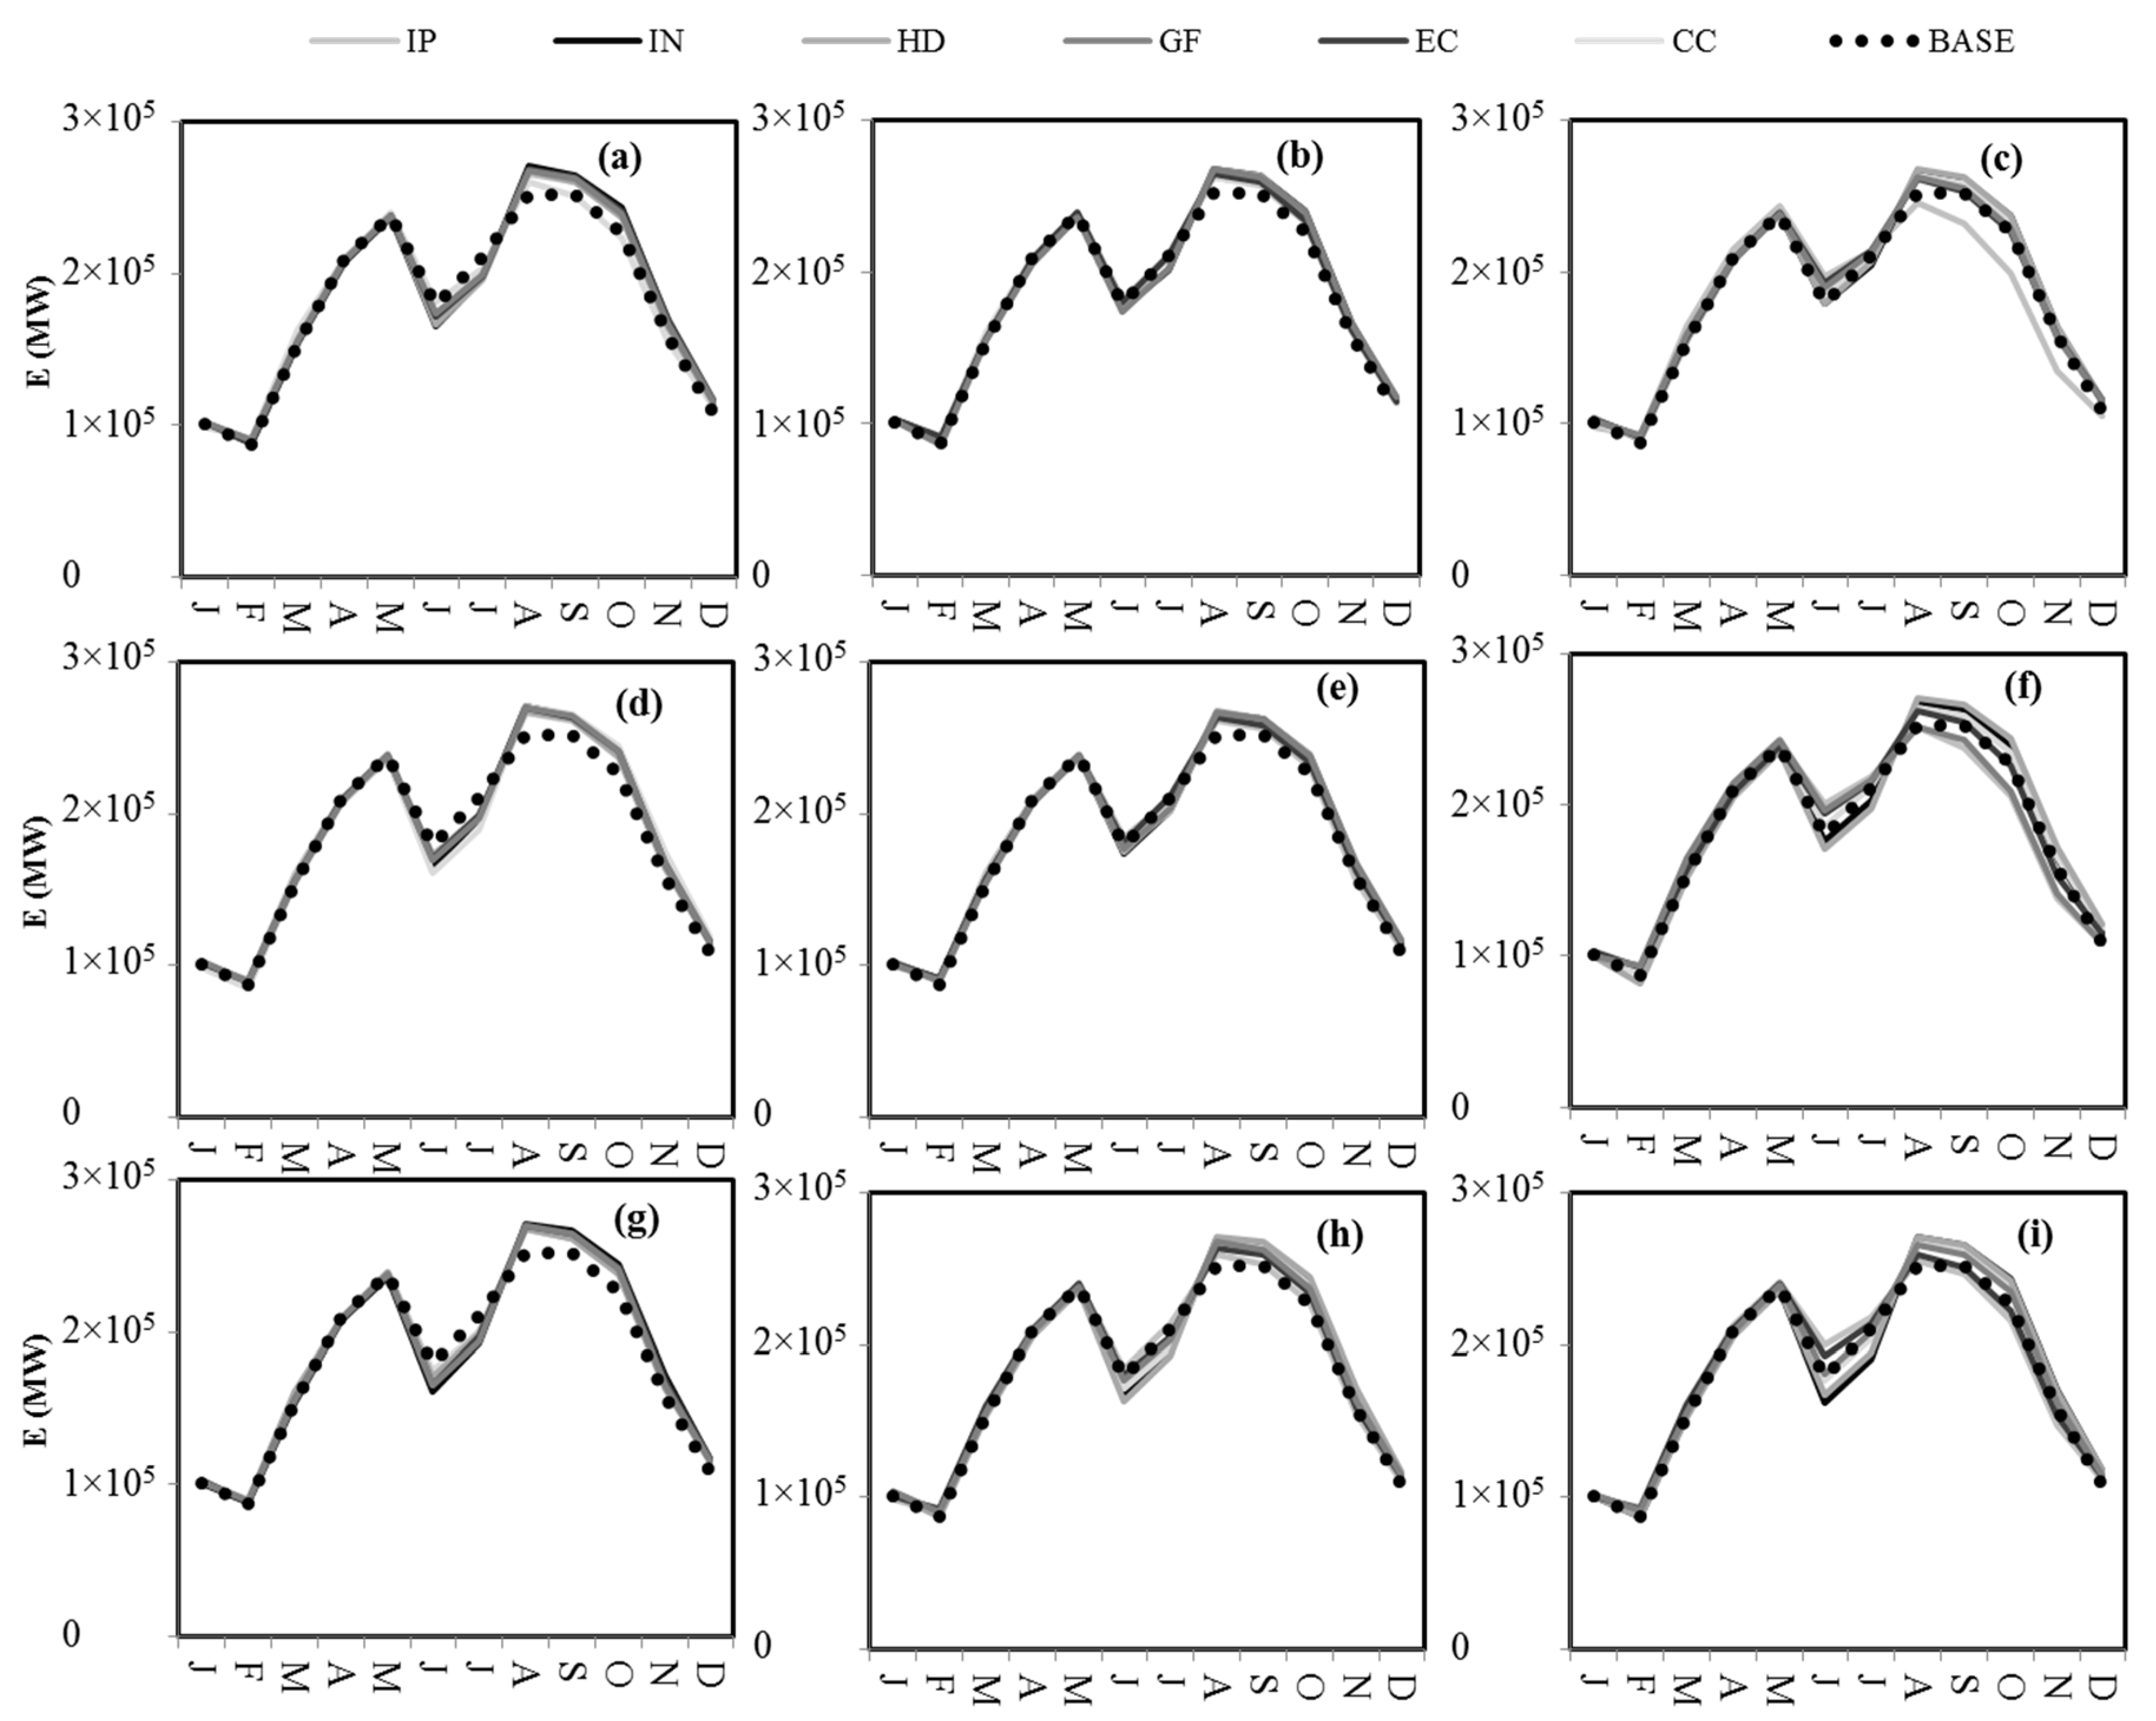
3.4. Variation of the Inflow to Dez and Bakhtiari Reservoirs and Hydropower Generation under Climate Change

The number of annual inflows to the Bakhtiari and Dez reservoirs under climate change conditions and the percentage of changes of the simulated inflows compared to the base period are obtained based on the two reservoir system of the Bakhtiari and Dez dams. The percentage of changes in the inflow to each of these reservoirs compared to the base period are shown for each GST in Table 5. The long-term averages of the discharges at the outlet of Bakhtiari and Sazar are 5106.88 and 2938.21 Mm3, respectively. Considering that the Bakhtiari Dam is located at the end-point of the Bakhtiari basin and that the Dez dam is located downstream of Tange Panj, the inflow to the Bakhtiari reservoir equals the Bakhtiari basin’s discharge and the inflow to the Dez reservoir is the total discharge from the upstream basins, which equals 8045.1 Mm3. Based on the results, the percentages of changes of the simulated inflow to the Bakhtiari reservoir under climate change varies between −1.7% (HadCM3-B1-2050) and −26.8% (IPSL-A1B-2080). Additionally, the inflow to the Dez reservoir for future time horizons is simulated to decrease by up to 21.8% (IPSL-A1B-2080) and increase by up to 3.6% (HadCM3-B1-2080) compared to the base period.
The hydropower generation potential for the base period and for the future time horizons were also calculated using the inflows obtained from the previous step. Studying the monthly average of hydropower generation for the Bakhtiari and Dez reservoirs under climate change conditions versus the base period (Figure 9 and Figure 10) shows that the ranges of simulations by the use of different GCMs and scenarios are greater in the late 21st century, while the amount of produced energy for different GCMs in the 2020s time horizon indicates a higher agreement of the results.
The percentages of the deviations of the projected hydropower generation potential from the base period for both reservoirs are presented in Table 5 for all the GSTs. Based on the results of the different GSTs, the potential of the hydropower generation of the Bakhtiari power plant was simulated to decrease between 0.9% (HadCM3-B1-2050) and 31.8% (IPSL-A1B-2080) compared to the base period. This is in agreement with the reduction of discharges to the Bakhtiari reservoir. On the contrary, the hydropower generation potential of the Dez power plant is simulated to be slightly higher than the base period, for all the GSTs because the highest increase reaches up to 2.8% (CCSM-A2-2080). Meanwhile, its inflow is mostly projected to decrease for future time horizons.
As mentioned above, in the Dez reservoir case, there are some inconsistencies between the changes in its inflow and hydropower generation caused by climate change. While the results for the Bakhtiari reservoir shows more consistency. The difference between the responses of the two reservoirs in terms of their hydropower generation potential could be attributed to the different operational rules due to different purposes, as well as due to other factors such as the size of the reservoirs and the installed capacity of their hydropower plants. To study the possible reasons, the time series of inflow, outflow, spill, and the water level in the reservoirs for the base period and for the future time horizons were assessed. The time series pertaining to the base period and the future projections under climate change (for one of the GSTs as an example) are presented in Figure 11 and Figure 12.
Regarding the different responses of the two studied reservoirs, the following facts should be taken into consideration:
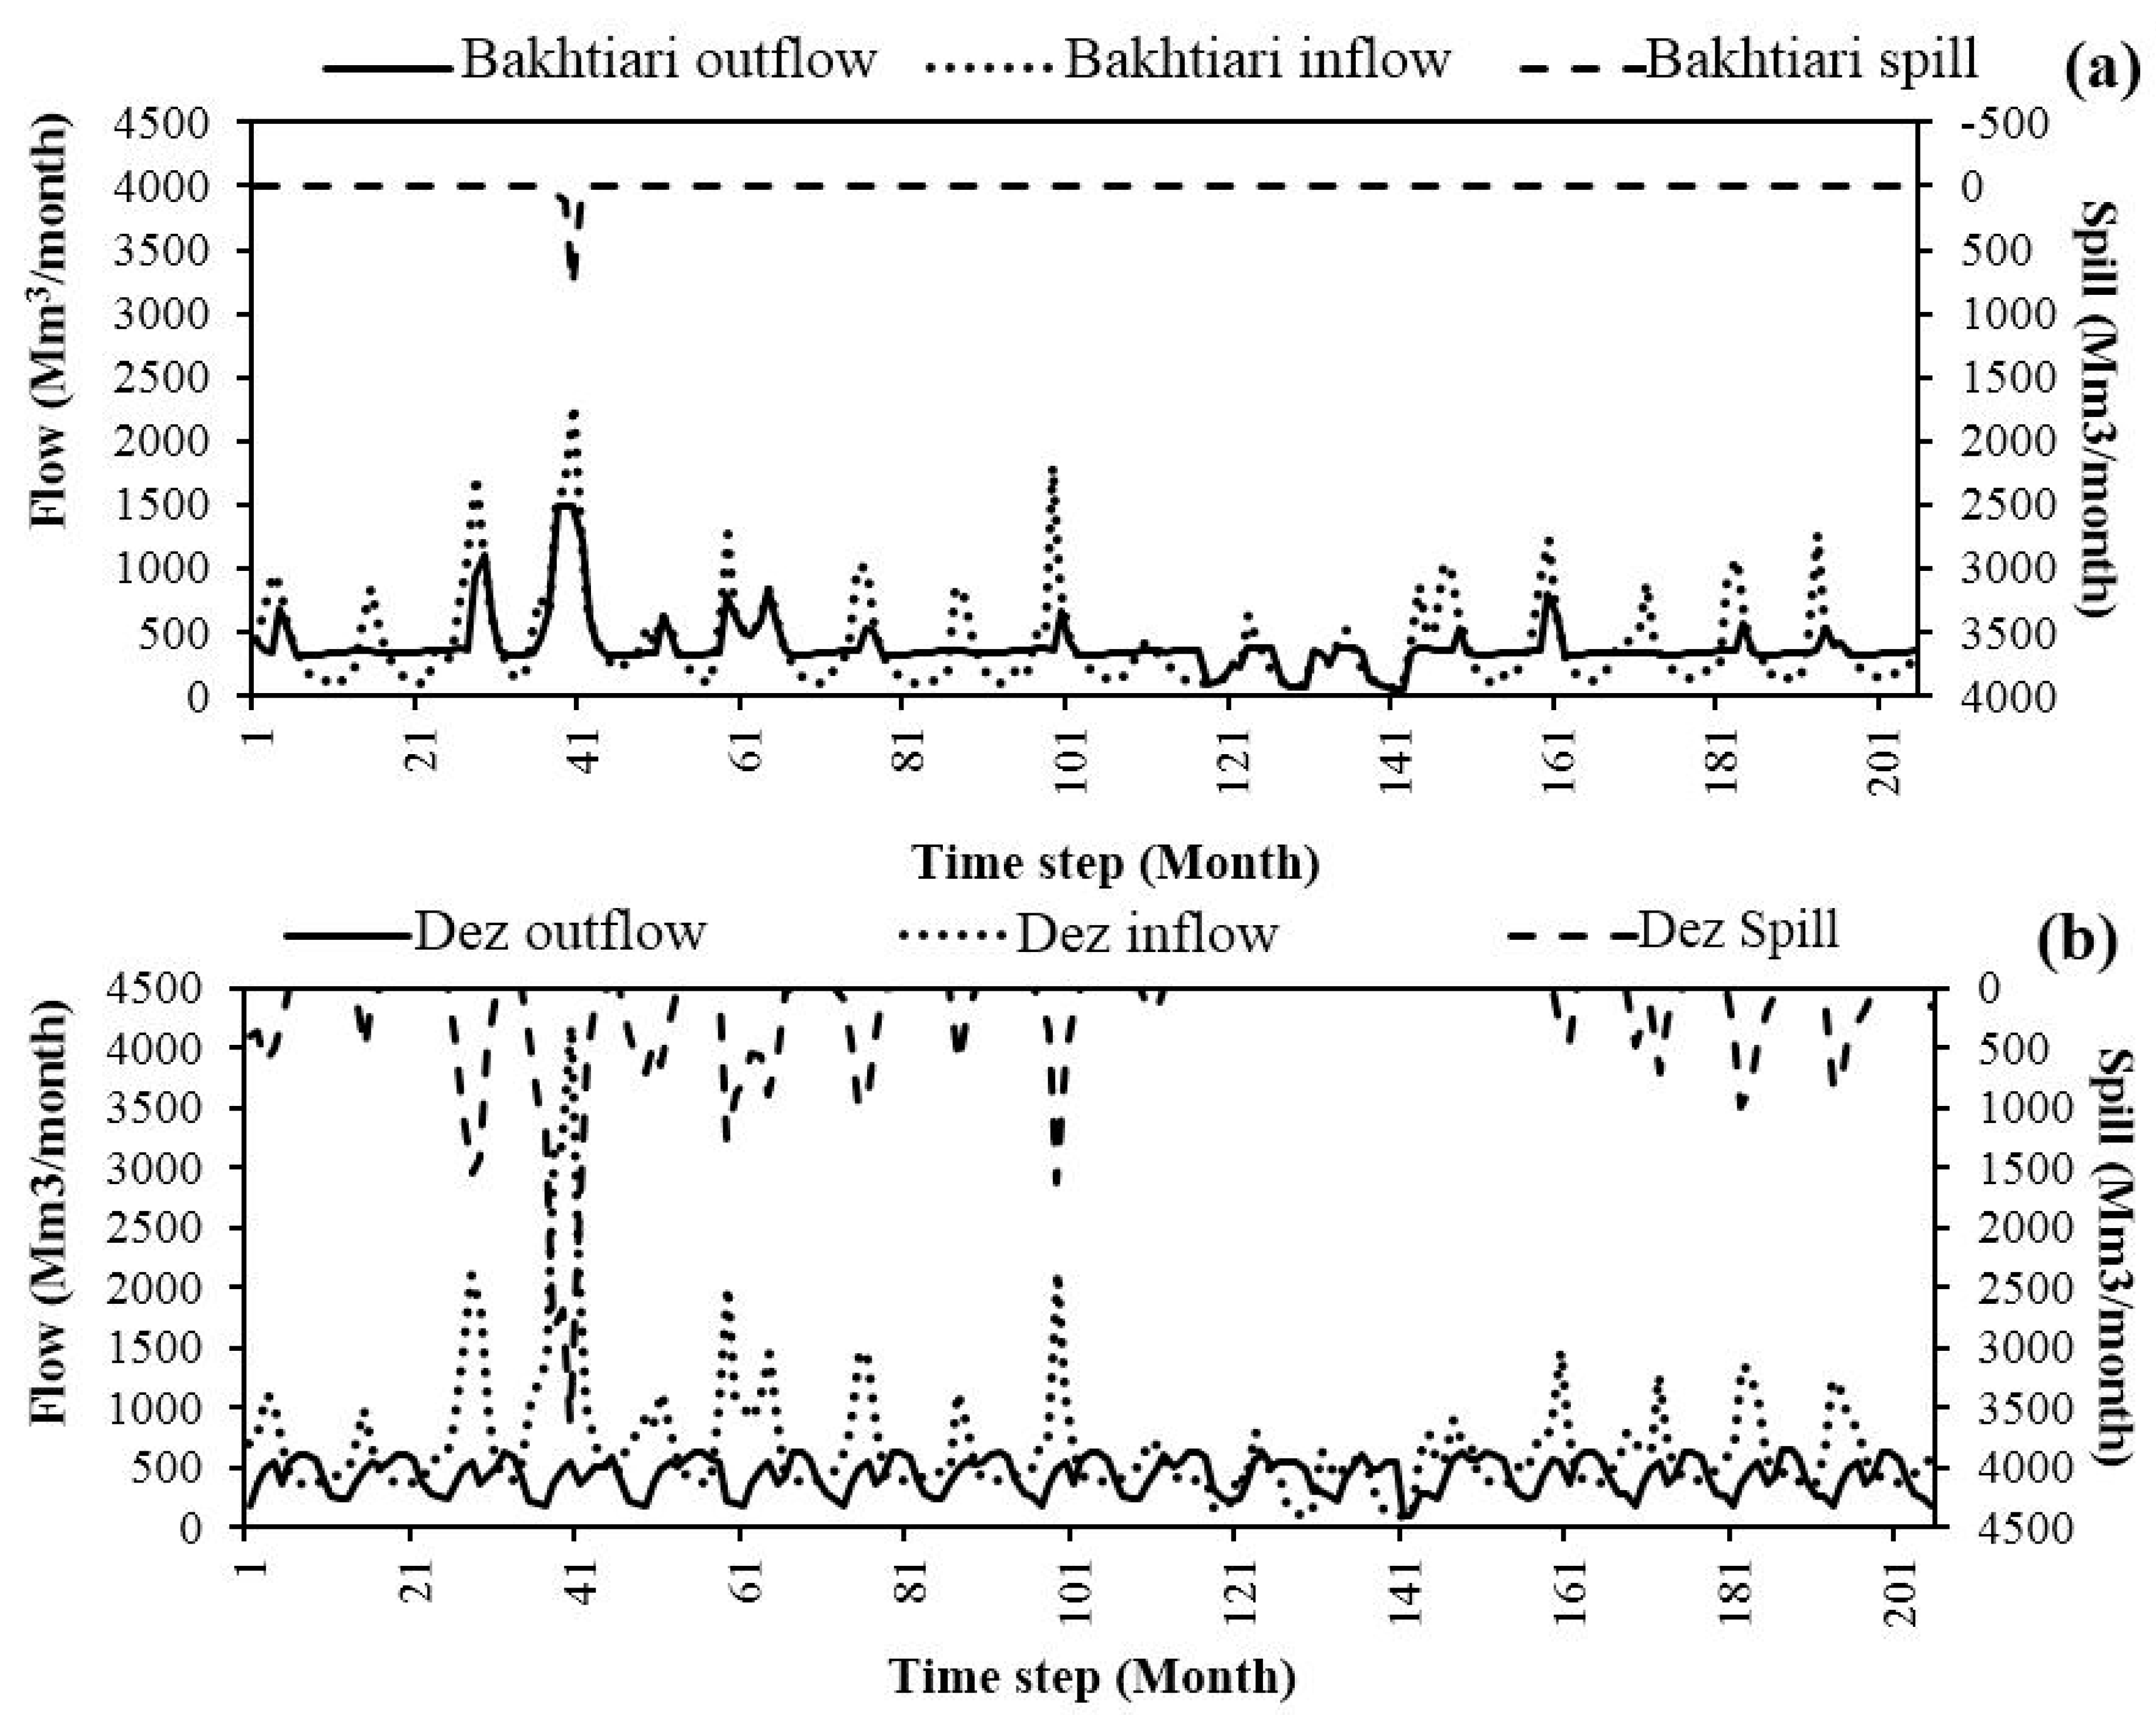
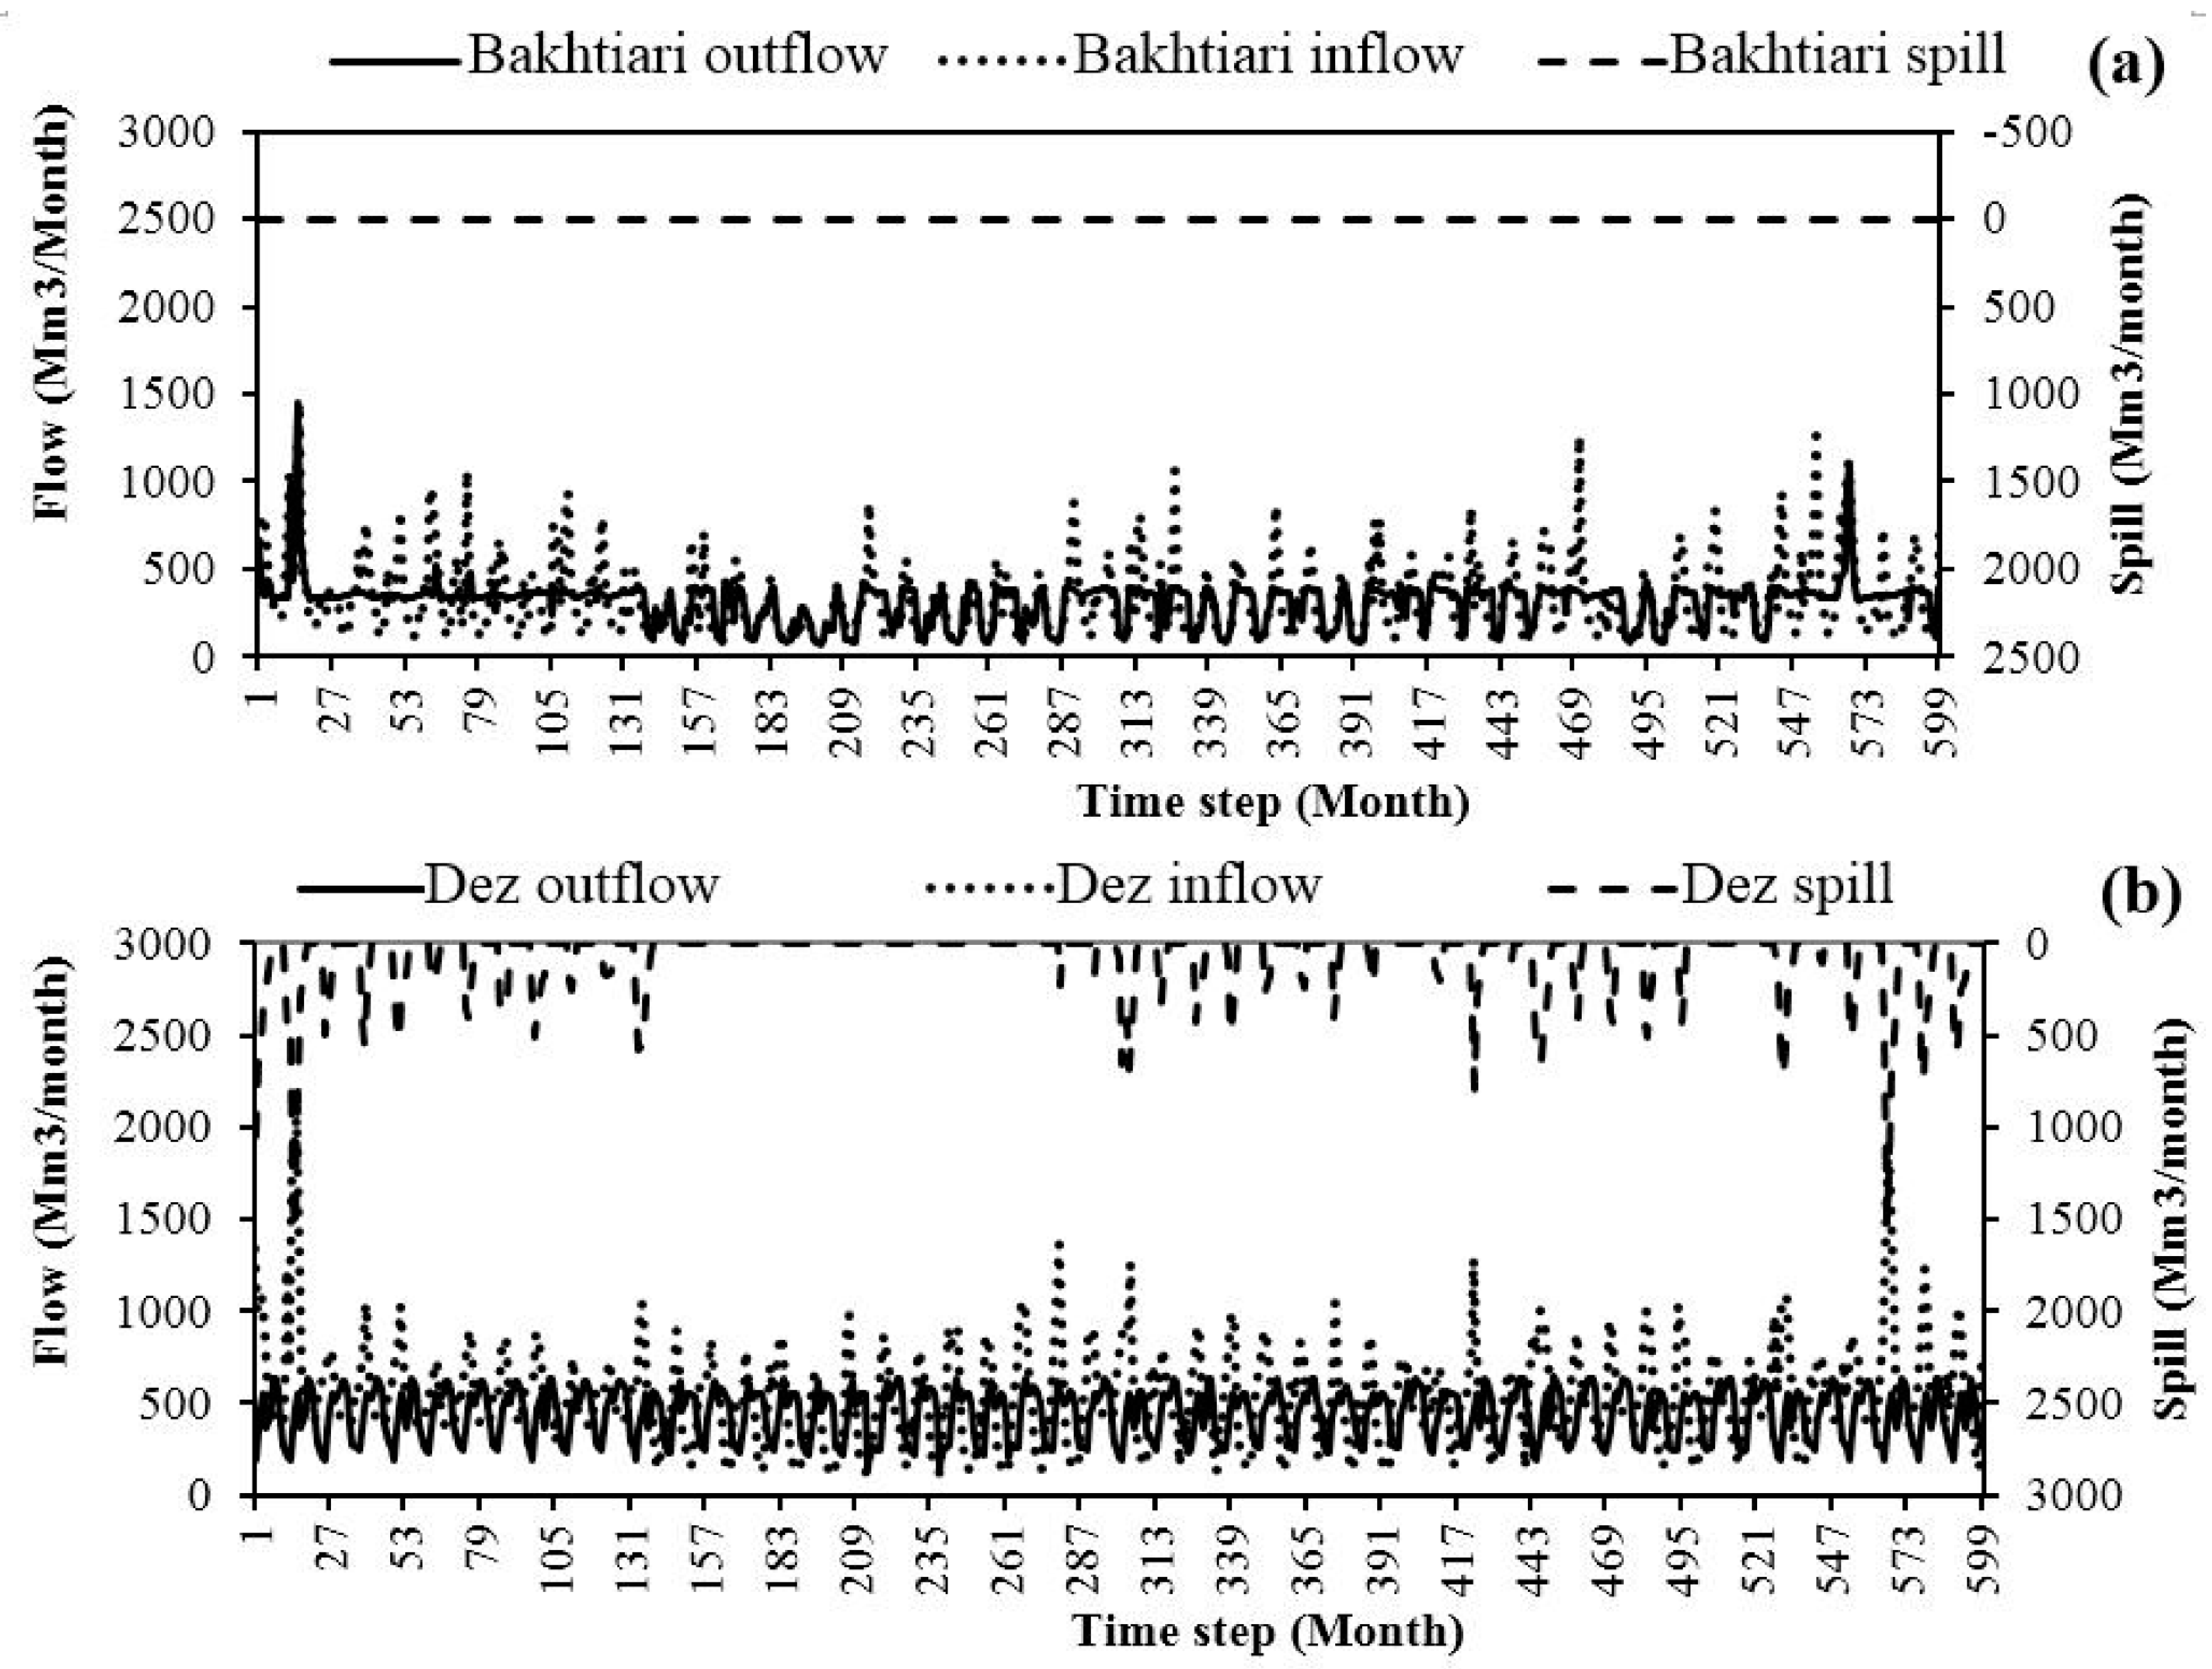
  • It should be noted that the Dez dam is a multi-purpose dam which provides water for different purposes during specific times to meet specified demands. Therefore, the releases from its reservoir are planned and only the part of the release or spill, which is not greater than the penstock or turbine capacity, contributes to the power generation. However, the release from Bakhtiari is only for hydropower generation purposes.
  • Additionally, the small capacity of Dez reservoir (2.7 Bm3), compared to the discharge from its draining catchment (8 Bm3), causes considerable spills (Figure 11b and Figure 12b).
  • Having considered that the whole capacity of the Dez hydropower plant is relatively small, compared to its inflow and releases, a significant proportion of the releases (or spills) does not contribute to power generation. Meanwhile, the Bakhtiari reservoir, with a capacity of 5.16 Bm3 and an average inflow of 5.11 Bm3, can save most of the inflows with negligible spills, both in the base period and in the future time horizons (Figure 11a and Figure 12a).
  • Additionally, the large capacity of the hydropower plant does not pose any limitation on the energy production. Therefore, in the case of Bakhtiari, there is a direct relationship between the changes in the rates of inflow and energy generation.
  • A comparison between the simulated inflow of the Dez reservoir during the future time horizons and the base period suggests that under the climate change conditions, a fewer number of floods and fewer inflows and peak flows would lead to fewer losses through spill (Figure 11b and Figure 12b), which means that more water could be saved in the reservoir to be used to generate electricity.
Considering the reasons explained above, the future changes induced by climate change in the hydropower generation potential of the Dez power plant are not consistent with the changes in the inflow of the Dez reservoir. Additionally, the slight increase in the hydropower generation potential could be attributed to the changing of the regime of discharges with smaller peaks, leading to fewer spills and more water remaining to produce electricity.

4. Conclusions

The impact of climate change on the climate, discharge, and the hydropower generation potential in the Dez Dam Basin was studied based on the downscaled outputs from six GCMs and three SRES scenarios for the three time horizons. The study revealed that the basin experiences a significant temperature rise in the mid and late 21st century (up to 4 °C). These changes are accompanied by variations in precipitation, which mostly lean towards a slight increase in the amount of precipitation. In total, the projections of all the scenarios and GCMs indicate a warmer future and small-to-moderate increase in the amount of precipitation. However, the obtained results for precipitation are more anomalous, showing both an increase and a decrease in the amount of precipitation. To simulate the future discharge at the outlet of each sub-basin under climate change conditions, the calibrated HBV hydrologic model was enforced with the projected temperature and precipitation time series. The results mostly suggest a reduction of the annual discharge in the study area. The most significant reduction of the annual flow, compared to the base period, reaches up to 33% in the two sub-basins located upstream of the basin, namely Tireh and Marbereh. Meanwhile, the greatest reductions of the annual flow of the Sazar and Bakhtiari sub-basins reach up to 17 and 27%, respectively. Considering the climate change impacts on the temperature, precipitation, and discharge in different sub-basins of the DDB, it was found that the responses of the four sub-basins are different in many cases, highlighting the noteworthiness of analyzing the impacts of climate change on local scales.
Moreover, in this study, the impact of climate change on the hydropower generation potential of the two hydropower plants in the DDB was investigated. Based on the results, climate change has the potential to significantly alter the hydropower generation potential in this basin. The results showed a reduction in the inflow and electricity generation for the Bakhtiari reservoir. Meanwhile, for the Dez reservoir, the reduction in the inflow was accompanied by a slight increase in the generated electricity. This contrasting result obtained for the Dez reservoir was assessed and has been attributed to the small size of the reservoir (2.7 Bm3) compared to the basin’s discharge (8 Bm3), the low capacity of hydropower plant, the different purposes and timely releases from its reservoir, as well as the flow regime changes in the future which cause less spills due to the lower peaks of floods. Overall, the results showed a reduction of the electricity generation at the Bakhtiari power plant. Therefore, its capacity seems to be high considering the future climatic conditions, while, based on the findings, there is room for the further development of the Dez power plant in order to increase its capacity for the production of more electricity.
This study used multiple GCMs for the projection of temperature, precipitation, discharge, and hydropower generation based on the three future time horizons scenarios. The results showed considerable discrepancies in the projected variables when obtained from different GCMs, which indicate the important role of the GCMs in future climatic impact assessments. Therefore, it is highly recommended that for future projections, different GCMs be employed to cover a range of likely projections.

Author Contributions

The authors of this research paper, R.S.M., M.A. and S.M. contributed significantly in the design of the study and data analysis and validation. Hydrologic modeling and modeling of the reservoirs system carried out by R.S.M. and M.A. All the authors contributed in interpretation of the results, writing the original draft of the paper and revision process. This work was supervised by S.M.

Funding

This research received no external funding.

Acknowledgments

Authors wish to thank the Islamic Republic of Iran Meteorological Organization (IRIMO) and Iran Water Resources Management Co. for providing the necessary data for this research.

Conflicts of Interest

The authors declare no conflict of interest.

References

  1. Kallis, G. Droughts Annual Reviews. Environ. Resour. 2008, 33, 85–118. [Google Scholar] [CrossRef]
  2. Souvignet, M.; Gaese, H.; Ribbe, L.; Kretschmer, N.; Oyarzún, R. Statistical downscaling of precipitation and temperature in north-central Chile: An assessment of possible climate change impacts in an arid Andean watershed. Hydrol. Sci. J. 2010, 55, 41–57. [Google Scholar] [CrossRef]
  3. Guo, Y.; Shen, Y. Quantifying water and energy budgets and the impacts of climatic and human factors in the Haihe River Basin, China: 2. Trends and implications to water resources. J. Hydrol. 2015, 527, 251–261. [Google Scholar] [CrossRef]
  4. Lalika, M.C.; Meire, P.; Ngaga, Y.M.; Chang’a, L. Understanding watershed dynamics and impacts of climate change and variability in the Pangani River Basin, Tanzania. Ecohydrol. Hydrobiol. 2015, 15, 26–38. [Google Scholar] [CrossRef]
  5. Modarres, R.; Silva, V.P.R. Rainfall trends in arid and semi-arid regions of Iran. J. Arid Environ. 2007, 70, 344–355. [Google Scholar] [CrossRef]
  6. Dinpashoh, Y.; Jhajharia, D.; Fakheri-Fard, A.; Singh, V.P.; Kahya, E. Trends in reference crop evapotranspiration over Iran. J. Hydrol. 2011, 399, 422–433. [Google Scholar] [CrossRef]
  7. Tabari, H.; Somee, B.S.; Zadeh, M.R. Testing for long-term trends in climatic variables in Iran. Atmos. Res. 2011, 100, 132–140. [Google Scholar] [CrossRef]
  8. Masih, I.; Uhlenbrook, S.; Maskey, S.; Smakhtin, V. Streamflow trends and climate linkages in the Zagros Mountains, Iran. Clim. Chang. 2011, 104, 317–338. [Google Scholar] [CrossRef]
  9. Abghari, H.; Tabari, H.; Talaee, P.H. River flow trends in the west of Iran during the past 40 years: Impact of precipitation variability. Glob. Planet. Chang. 2013, 101, 52–60. [Google Scholar] [CrossRef]
  10. Ahani, H.; Kherad, M.; Kousari, M.R.; Roosmalen, L.V.; Aryanfar, R.; Hosseini, S.M. Non-parametric trend analysis of the aridity index for three large arid and semi-arid basins in Iran. Theor. Appl. Climatol. 2013, 112, 553–564. [Google Scholar] [CrossRef]
  11. Golian, S.; Mazdiyasni, O.; AghaKouchak, A. Trends in meteorological and agricultural droughts in Iran. Theor. Appl. Climatol. 2015, 119, 679–688. [Google Scholar] [CrossRef]
  12. Kousari, M.R.; Ahani, H.; Hendi-zadeh, R. Temporal and spatial trend detection of maximum air temperature in Iran during 1960–2005. Glob. Planet. Chang. 2013, 111, 97–110. [Google Scholar] [CrossRef]
  13. Marofi, S.; Soleymani, S.; Salarijazi, M.; Marofi, H. Watershed-wide trend analysis of temperature characteristics in Karun-Dez watershed, southwestern Iran. Theor. Appl. Climatol. 2012, 110, 311–320. [Google Scholar] [CrossRef]
  14. Soltani, M.; Laux, P.; Kunstmann, H.; Stan, K.; Sohrabi, M.M.; Molanejad, M.; Sabziparvar, A.A.; Ranjbar SaadatAbadi, A.; Ranjbar, F.; Rousta, I.; et al. Assessment of climate variations in temperature and precipitation extreme events over Iran. Theor. Appl. Climatol. 2015, 126, 775–795. [Google Scholar] [CrossRef] [Green Version]
  15. Adam, J.C.; Hamlet, A.F.; Lettenmaier, D.P. Implications of global climate change for snowmelt hydrology in the twenty-first century. Hydrol. Process. 2009, 23, 962–972. [Google Scholar] [CrossRef]
  16. Boyer, C.; Chaumont, D.; Chartier, I.; Roy, A.G. Impact of climate change on the hydrology of St. Lawrence tributaries. J. Hydrol. 2010, 384, 65–83. [Google Scholar] [CrossRef]
  17. Gan, R.; Luo, Y.; Zuo, Q.; Sun, L. Effects of projected climate change on the glacier and runoff generation in the Naryn River Basin, Central Asia. J. Hydrol. 2015, 523, 240–251. [Google Scholar] [CrossRef] [Green Version]
  18. Nohara, D.; Kitoh, A.; Hosaka, M.; Oki, T. Impact of Climate Change on River Discharge Projected by Multimodel Ensemble. J. Hydrometeorol. 2006, 7, 1076–1089. [Google Scholar] [CrossRef]
  19. Arnell, N.W.; Gosling, S.N. The impacts of climate change on river flow regimes at the global scale. J. Hydrol. 2013, 486, 351–364. [Google Scholar] [CrossRef]
  20. Tong, S.T.Y.; Yang, H.; Chen, H.; Yang, J.Y. Hydrologic impacts of climate change and urbanization in the Las Vegas Wash Watershed, Nevada. J. Water Clim. Chang. 2016, 7, 598–620. [Google Scholar] [CrossRef]
  21. Kirby, J.M.; Mainuddin, M.; Mpelasoka, F.; Ahmad, M.D.; Palash, W.; Quadir, M.E.; Shah-Newaz, S.M.; Hossain, M.M. The impact of climate change on regional water balances in Bangladesh. Clim. Chang. 2016, 135, 481–491. [Google Scholar] [CrossRef]
  22. Tall, M.; Sylla, M.B.; Diallo, I.; Pal, J.S.; Faye, A.; Mbaye, M.L.; Gaye, A.T. Projected impact of climate change in the hydroclimatology of Senegal with a focus over the Lake of Guiers for the twenty-first century. Theor. Appl. Climatol. 2017, 129, 655–665. [Google Scholar] [CrossRef]
  23. He, Z.; Wang, Z.; Suen, C.J.; Ma, X. Hydrologic sensitivity of the Upper San Joaquin River Watershed in California to climate change scenarios. Hydrol. Res. 2013, 44, 723–736. [Google Scholar] [CrossRef]
  24. Senent-Aparicio, J.; Pérez-Sánchez, J.; Carrillo-García, J.; Soto, J. Using SWAT and Fuzzy TOPSIS to Assess the Impact of Climate Change in the Headwaters of the Segura River Basin (SE Spain). Water 2017, 9, 149. [Google Scholar] [CrossRef]
  25. Xu, H.; Luo, Y. Climate change and its impacts on river discharge in two climate regions in China. Hydrol. Earth Syst. Sci. 2015, 19, 4609–4618. [Google Scholar] [CrossRef] [Green Version]
  26. Musau, J.; Sang, J.; Gathenya, J.; Luedeling, E. Hydrological responses to climate change in Mt. Elgon watersheds. J. Hydrol. Reg. Stud. 2015, 3, 233–246. [Google Scholar] [CrossRef]
  27. Azari, M.; Moradi, H.R.; Saghafian, B.; Faramarzi, M. Climate change impacts on streamflow and sediment yield in the North of Iran. Hydrol. Sci. J. 2016, 16, 123–133. [Google Scholar] [CrossRef]
  28. Shahni Danesh, A.; Ahadi, M.S.; Fahmi, H.; Habibi Nokhandan, M.; Eshraghi, H. Climate change impact assessment on water resources in Iran: Applying dynamic and statistical downscaling methods. J. Water Clim. Chang. 2016, 7, 551–577. [Google Scholar] [CrossRef]
  29. Rafiei Emam, A.; Kappas, M.; Hosseini, S.Z. Assessing the impact of climate change on water resources, crop production and land degradation in a semi-arid river basin. Hydrol. Res. 2015, 46, 854–870. [Google Scholar] [CrossRef]
  30. Gohari, A.; Bozorgi, A.; Madani, K.; Elledge, J.; Berndtsson, R. Adaptation of surface water supply to climate change in central Iran. J. Water Clim. Chang. 2014, 5, 391–407. [Google Scholar] [CrossRef]
  31. Solaymani, H.R.; Gosain, A.K. Assessment of climate change impacts in a semi-arid watershed in Iran using regional climate models. J. Water Clim. Chang. 2015, 6, 161–180. [Google Scholar] [CrossRef]
  32. Zhou, Y.; Xu, Y.J.; Xiao, W.; Wang, J.; Huang, Y.; Yang, H. Climate Change Impacts on Flow and Suspended Sediment Yield in Headwaters of High-Latitude Regions—A Case Study in China’s Far Northeast. Water 2017, 9, 966. [Google Scholar] [CrossRef]
  33. Fang, G.; Yang, J.; Chen, Y.; Li, Z.; De Maeyer, P. Impact of GCM structure uncertainty on hydrological processes in an arid area of China. Hydrol. Res. 2018, 49, 893–907. [Google Scholar] [CrossRef]
  34. Van Vliet, M.T.H.; Franssen, W.H.P.; Yearsley, J.R.; Ludwig, F.; Haddeland, I. Global river discharge and water temperature under climate change. Glob. Environ. Chang. 2013, 23, 450–464. [Google Scholar] [CrossRef]
  35. Elsner, M.M.; Cuo, L.; Voisin, N.; Deems, J.S.; Hamlet, A.F.; Vano, J.A.; Mickelson, K.E.B.; Lee, S.-Y.; Lettenmaier, D.P. Implications of 21st century climate change for the hydrology of Washington State. Clim. Chang. 2010, 102, 225–260. [Google Scholar] [CrossRef] [Green Version]
  36. Pervez, M.S.; Henebry, G.M. Assessing the impacts of climate and land use and land cover change on the freshwater availability in the Brahmaputra River basin. J. Hydrol. Reg. Stud. 2015, 3, 285–311. [Google Scholar] [CrossRef]
  37. Bartolini, E.; Claps, P.; D’Odorico, P. Interannual variability of winter precipitation in the European Alps: Relations with the North Atlantic oscillation. Hydrol. Earth Syst. Sci. 2009, 13, 17–25. [Google Scholar] [CrossRef]
  38. Lambrecht, A.; Mayer, C. Temporal variability of the nonsteady contribution from glaciers to water discharge in western Austria. J. Hydrol. 2009, 376, 353–361. [Google Scholar] [CrossRef]
  39. Abrishamchi, A.; Jamali, S.; Madani, K.; Hadian, S. Climate Change and Hydropower in Iran’s Karkheh River Basin. In Proceedings of the World Environmental and Water Resources Congress: Crossing Boundaries, Albuquerque, NM, USA, 20–24 May 2012; Loucks, E.D., Ed.; ASCE Library: Reston, VA, USA, 2012. [Google Scholar]
  40. Bates, B.C.; Kundzewicz, Z.W.; Wu, S.; Palutikof, J.P. Climate Change and Water. Technical Paper of the Intergovernmental Panel on Climate Change, IPCC secretariat, Geneva. Clim. Chang. Policy Renewed Environ. Ethic 2008, 21, 85–101. [Google Scholar]
  41. Xu, C.-Y.; Singh, V.P. Review on regional water resources assessment models under stationary and changing climate. Water Resour. Manag. 2004, 18, 591–612. [Google Scholar] [CrossRef]
  42. Jahandideh-Tehrani, M.; Haddad, O.B.; Loáiciga, H.A. Hydropower reservoir management under climate change: The Karoon reservoir system. Water Resour. Manag. 2015, 29, 749–770. [Google Scholar] [CrossRef]
  43. Jamali, S.; Abrishamchi, A.; Marino, M. Climate Change Impact Assessment on Hydrology of Karkheh Basin. Proc. Inst. Civ. Eng.-Water Manag. 2013, 166, 93–104. [Google Scholar] [CrossRef]
  44. Wang, S.; McGrath, R.; Semmler, T.; Sweeney, C.; Nolan, P. The impact of the climate change on discharge of Suir River Catchment (Ireland) under different climate scenarios. Nat. Hazard. Earth Syst. 2006, 6, 387–395. [Google Scholar] [CrossRef] [Green Version]
  45. Graham, L.P.; Hagemann, S.; Jaun, S.; Beniston, M. On interpreting hydrological change from regional climate models. Clim. Chang. 2007, 81, 97–122. [Google Scholar] [CrossRef] [Green Version]
  46. Prudhomme, C.; Davies, H. Assessing uncertainties in climate change impact analyses on the river flow regimes in the UK. Part 1: Baseline climate. Clim. Chang. 2009, 93, 177–195. [Google Scholar] [CrossRef]
  47. Habets, F.; Boé, J.; Déqué, M.; Ducharne, A.; Gascoin, S.; Hachour, A.; Martin, E.; Pagé, C.; Sauquet, E.; Terray, L.; et al. Impact of climate change on the hydrogeology of two basins in northern France. Clim. Chang. 2013, 121, 771–785. [Google Scholar] [CrossRef] [Green Version]
  48. Turco, M.; Sanna, A.; Herrera, S.; Llasat, M.C.; Gutiérrez, J.M. Large biases and inconsistent climate change signals in ENSEMBLES regional projections. Clim. Chang. 2013, 120, 859–869. [Google Scholar] [CrossRef] [Green Version]
  49. Hosseinzadehtalaei, P.; Tabari, H.; Willems, P. Uncertainty assessment for climate change impact on intense precipitation: How many model runs do we need? Int. J. Climatol. 2017, 37, 1105–1117. [Google Scholar] [CrossRef]
  50. Solomon, S.; Qin, D.; Manning, M.; Chen, Z.; Marquis, M.; Averyt, K.B.; Tignor, M.; Miller, H.L. IPCC, 2007: Climate Change 2007: The Physical Science Basis; Contribution of Working Group I to the Fourth Assessment Report of the Intergovernmental Panel on Climate Change; Cambridge University Press: Cambridge, UK; New York, NY, USA, 2007; p. 966. ISBN 978-0-521-70596-7. [Google Scholar]
  51. Semenov, M.A. Development of high-resolution UKCIP02-based climate change scenarios in the UK. Agric. For. Meteorol. 2007, 144, 127–138. [Google Scholar] [CrossRef]
  52. Semenov, M.A.; Stratonovitch, P. Use of multi-model ensembles from global climate models for assessment of climate change impacts. Clim. Res. 2010, 41, 1–14. [Google Scholar] [CrossRef] [Green Version]
  53. Seibert, J.; Vis, M.J.P. Teaching hydrological modeling with a user-friendly catchment-runoff-model software package. Hydrol. Earth Syst. Sci. 2012, 16, 3315–3325. [Google Scholar] [CrossRef] [Green Version]
  54. Bergström, S. The HBV Model-Its Structure and Applications; SMHI Report RH No. 4; SMHI: Northkoping, Sweden, 1992.
  55. Vidal, J.P.; Wade, S.D. Multimodel projections of catchment-scale precipitation regime. J. Hydrol. 2008, 353, 143–158. [Google Scholar] [CrossRef]
  56. Nazif, S.; Karamouz, M. Evaluation of climate change impacts on streamflow to a multiple reservoir system using a data-based mechanistic model. J. Water Clim. Chang. 2014, 5, 610–624. [Google Scholar] [CrossRef]
  57. Ashraf Vaghefi, S.; Mousavi, S.J.; Abbaspour, K.C.; Srinivasan, R.; Yang, H. Analyses of the impact of climate change on water resources components, drought and wheat yield in semiarid regions: Karkheh River Basin in Iran. Hydrol. Process. 2014, 28, 2018–2032. [Google Scholar] [CrossRef]
Figure 1. The map of the Dez River Basin; (a) the sub-basins, main streams, and location of the hydrometric stations and reservoirs (b) its location in Iran.
Water 10 01458 g001
Figure 2. The daily averaged downscaled temperatures based on the A1B, A2, and B1 scenarios for the three time horizons (the 2020s, 2050s, and 2080s) using different GCMs in the sub-basins: SUB-1 (a); SUB-2 (b); SUB-3 (c); and SUB-4 (d).
Water 10 01458 g002
Figure 3. The annual downscaled precipitation based on the A1B, A2, and B1 scenarios for the three time horizons (the 2020s, 2050s, and 2080s) using different GCMs in the sub-basins: SUB-1 (a); SUB-2 (b); SUB-3 (c); and SUB-4 (d).
Water 10 01458 g003
Figure 4. The observed and simulated streamflow during the calibration and validation periods in the sub-basins: SUB-1 (a); SUB-2 (b); SUB-3 (c); and SUB-4 (d). The striped line shown on the graphs separates the calibration and validation periods.
Water 10 01458 g004
Figure 5. The annual pattern of observed streamflow (dotted graph) and future projected streamflows of SUB-1. (a): A1B-2020s; (b): A2-2020s; (c): B1-2020s; (d): A1B-2050s; (e): A2-2050s; (f): B1-2050s; (g): A1B-2080s; (h): A2-2080s; (i): B1-2080s.
Water 10 01458 g005
Figure 6. The annual pattern of observed streamflow (dotted graph) and future projected streamflows of SUB- 2. (a): A1B-2020s; (b): A2-2020s; (c): B1-2020s; (d): A1B-2050s; (e): A2-2050s; (f): B1-2050s; (g): A1B-2080s; (h): A2-2080s; (i): B1-2080s.
Water 10 01458 g006
Figure 7. The annual pattern of observed streamflow (dotted graph) and future projected streamflows of SUB- 3. (a): A1B-2020s; (b): A2-2020s; (c): B1-2020s; (d): A1B-2050s; (e): A2-2050s; (f): B1-2050s; (g): A1B-2080s; (h): A2-2080s; (i): B1-2080s.
Water 10 01458 g007
Figure 8. The annual pattern of observed streamflow (dotted graph) and future projected streamflows of SUB- 4. (a): A1B-2020s; (b): A2-2020s; (c): B1-2020s; (d): A1B-2050s; (e): A2-2050s; (f): B1-2050s; (g): A1B-2080s; (h): A2-2080s; (i): B1-2080s.
Water 10 01458 g008
Figure 9. The monthly hydropower generation of the Bakhtiari power plant for the base period and under climate change conditions projected by the six GCMs and three SRES scenarios for the 2020s, 2050s, and 2080s time horizons; (a): A1B-2020s; (b): A2-2020s; (c): B1-2020s; (d): A1B-2050s; (e): A2-2050s; (f): B1-2050s; (g): A1B-2080s; (h): A2-2080s; (i): B1-2080s.
Water 10 01458 g009
Figure 10. The monthly hydropower generation of the Dez power plant for the base period and under climate change conditions projected by the six GCMs and three SRES scenarios for the 2020s, 2050s, and 2080s time horizons; (a): A1B-2020s; (b): A2-2020s; (c): B1-2020s; (d): A1B-2050s; (e): A2-2050s; (f): B1-2050s; (g): A1B-2080s; (h): A2-2080s; (i): B1-2080s.
Water 10 01458 g010
Figure 11. The monthly inflows, outflows, spills, and reservoir storages for the base period; (a): inflow, outflow, and spill of the Bakhtiari reservoir; (b): inflow, outflow, and spill of the Dez reservoir.
Water 10 01458 g011
Figure 12. The monthly inflows, outflows, spills, and reservoir storages for the 2080s future time horizon based on the projections of the IPSL under the B1 scenario; (a): inflow, outflow, and spill of the Bakhtiari reservoir; (b): inflow, outflow, and spill of the Dez reservoir.
Water 10 01458 g012
Table 1. The description of the sub-basins of the Dez River basin.
Sub-BasinsArea (Km2)ElevationAverage
T (°C)P (mm/y)Q (Mm3)
Tireh (SUB-1)3477155113.93603486
Marbereh (SUB-2)2553194312.35472.3282
Sazar (SUB-3)3281157414.19791.23231
Bakhtiari (SUB-4)5973246013.89673.34830
Table 2. The description of the GCMs (General Ciculation Models) and the IPCC-AR4 SRES (Special Report on Emission Scenarios) emission scenarios.
Research CentreCountryGCMAcronymResolution
National Centre for Atmospheric ResearchUSACCSM3CCSM1.4 × 1.4°
Max-Planck Institute for MeteorologyGermanyECHAM5-OMECHAM51.9 × 1.9°
Geophysical Fluid Dynamics LabUSAGFDL-CM2.1GFDL2 × 2.5°
UK Meteorological OfficeUKHadCM3HadCM32.5 × 3.75°
Institute for Numerical MathematicsRussiaINM-CM3.0INCM34 × 5°
Institute Pierre Simon LaplaceFranceIPSL-CM4IPSL2.5 × 3.75°
Table 3. The model performance statistics for the calibration and validation periods.
PeriodReffR2MDiff (%)
SUB-1Calibration1989–20020.680.706
Validation2004–20080.700.79−19
SUB-2Calibration1989–20040.620.628
Validation2004–20090.430.78−24
SUB-3Calibration1989–20040.630.641
Validation2004–20090.500.63−3
SUB-4Calibration1987–20010.650.682
Validation2001–20070.450.60−18
Table 4. The percentage of the variation of the discharge from sub-basins 1 to 4 under the climate change conditions projected by the six GCMs and three SRES scenarios for the 2020s, 2050s, and 2080s time horizons compared to the base period.
GCM Scenario-Time Horizon
A1BA2B1
202020502080202020502080202020502080
ECHAM5SUB-1−7.8−11.6−15.3−7.6−15.4−13−3.6−19.1−19.3
SUB-21.7−12.3−19.3−0.6−10.3−26.12.8−16.8−20.4
SUB-3−5.3−1.3−1.5−5.9−61.7−3.1−10.4−7.2
SUB-4−7−14.9−19.8−7.7−14.8−20.4−6−15.4−20.8
HadCM3SUB-1−0.8−5.9−9.4−13.1−10.61.7−16.5−0.41.8
SUB-26.8−5.5−8.6−3.9−4.7−4.7−5.96.44.1
SUB-30.40.13.1−9.2−1.213−11.86.710.2
SUB-4−13.6−8.2−10.4−10.2−9.5−6.4−10.8−1.8−3.1
GFDLSUB-1−9.8−1.4−17.5−8.5−5.9−28.6−9−9.2−15.2
SUB-2−1.3−0.9−18.80.1−3.3−29.6−1.5−4.3−10.7
SUB-3−5.99.1−2.6−5.43.6−12.4−0.7−5.8−4.6
SUB-4−9.3−9−18.5−7.1−9.3−24.5−8.6−9.7−13.6
CCSMSUB-1−12.5−18.1−163.8−13.2−11.1−11.8−9.4−9
SUB-2−1.5−10.9−13.711.2−7.5−14.2−0.90−2.3
SUB-3−8.2−6.9−1.84.2−2.13.3−6.9−21
SUB-4−20.8−15.4−15.3−3.3−11.5−14.6−8.9−8.9−9.9
INCM3SUB-1−6.5−12.3−17.3−5.3−9.9−12.4−0.2−8.21.7
SUB-22.2−2.4−111.7−5.1−7.36.1−27.3
SUB-3−4.8−3.5−4.1−4.3−2.82.6−0.6−27
SUB-4−5.9−8.8−12−6.3−10.8−10.7−3.9−7.6−3.2
IPSLSUB-1−12.2−18.9−33.3−14.5−22.7−29.6−12.6−25.5−25.8
SUB-2−5.1−12.9−33.3−4.3−15.9−30.8−4.2−16−21
SUB-3−9.2−8.7−16.9−11−12.2−13.4−10.5−14.2−13.3
SUB-4−11.8−15.5−26.7−11.6−17.2−25−10.3−18.1−21.9
Table 5. The percentage of variation of the inflows and the hydropower generation of the Bakhtiari and Dez reservoirs under climate change conditions projected by the six GCMs and three SRES scenarios for the 2020s, 2050s, and 2080s time horizons compared to the base period.
GCM Scenario-Time Horizon
A1BA2B1
202020502080202020502080202020502080
ECHAM5∆I (B) 1−7−14.9−19.9−7.7−14−20.5−5.9−15.3−20.8
∆E (B)−6.8−16.9−22.7−7.6−16.8−23.6−5.3−17.2−24.1
∆I (D) 2−4.7−8.3−11.5−5.4−10−10.7−3.2−12−14.3
∆E (D)2.42.52.32.42.42.32.12.22
HadCM3∆I (B)−13.6−8.2−10.4−10.1−9.5−6.5−10.7−1.7−3.1
∆E (B)−15−8.4−11.1−10.4−10−5.8−11−0.9−2.1
∆I (D)−6.8−3.5−3.7−8.2−4.82.5−9.63.23.6
∆E (D)1.52.42.62.22.52.22.121.9
GFDL∆I (B)−9.3−9.1−18.6−7−9.4−24.6−8.5−9.7−13.6
∆E (B)−9.4−9.4−21.1−6.7−9.8−28.9−8.6−9.9−15
∆I (D)−6.4−0.6−11.1−4.8−2.9−18.7−4−6.7−8.7
∆E (D)2.32.12.32.22.30.51.82.42.4
CCSM∆I (B)−20.8−15.4−15.3−3.3−11.5−14.6−8.8−8.8−9.9
∆E (B)−24.1−17.5−17.3−2.2−12.2−16.3−8.9−9−10.3
∆I (D)−14.6−10.7−8.71.3−6.4−6.3−6.5−4.6−4.2
∆E (D)12.52.61.72.22.82.42.22.6
INCM3∆I (B)−5.9−8.8−12−6.3−10.8−10.7−3.8−7.6−3.2
∆E (B)−5.5−8.8−12.9−6−11.2−11.3−3−7.6−2.4
∆I (D)−3.8−5.2−7.5−3.9−6.2−4.1−0.9−3.92.3
∆E (D)2.22.62.42.12.32.41.921.7
IPSL∆I (B)−11.7−15.5−26.8−11.5−17.2−25.1−10.2−18.1−22
∆E (B)−12.4−17.4−31.8−12−19.3−29.7−10.5−20.6−25.6
∆I (D)−9.2−11.5−21.8−9.8−13.9−19.4−8.8−15.2−17.4
∆E (D)22.3−1.32.11.902.31.61.5
1 B: Bakhtiari dam; 2 D: Dez dam.

