Article

Economic Evaluation of Hydrological Ecosystem Services in Mediterranean River Basins Applied to a Case Study in Southern Italy

1
Council for Agricultural Research and Economics, Research Centre for Agriculture and Environment (CREA-AA), 70125 Bari, Italy
2
Basin Authority of Apulia, 70010 Valenzano, Italy
3
MANZONI Learning (Fire Protection), 70125 Bari, Italy
4
Department of Disaat, University of Bari, 70125 Bari, Italy
*
Author to whom correspondence should be addressed.
Water 2018, 10(3), 241; https://doi.org/10.3390/w10030241
Submission received: 21 December 2017 / Revised: 20 February 2018 / Accepted: 22 February 2018 / Published: 26 February 2018

Abstract

:
Land use affects eco-hydrological processes with consequences for floods and droughts. Changes in land use affect ecosystems and hydrological services. The objective of this study is the analysis of hydrological services through the quantification of water resources, pollutant loads, land retention capacity and soil erosion. On the basis of a quantitative evaluation, the economic values of the ecosystem services are estimated. By assigning an economic value to the natural resources and to the hydraulic system, the hydrological services can be computed at the scale of catchment ecosystem. The proposed methodology was applied to the basin “Bonis” (Calabria Region, Italy). The study analyses four land use scenarios: (i) forest cover with good vegetative status (baseline scenario); (ii) modification of the forest canopy; (iii) variation in forest and cultivated surfaces; (iv) insertion of impermeable areas. The simulations prove that the variations of the state of forest areas has considerable influence on the water balance, and then on the provided economic value. Small economic changes derive from reducing the impermeable areas. Increasing the agricultural area to 50% of the total, and reducing the forest surface, affects soil erosion, reduces the storage capacity of the water, and consequently the water harvesting. The suggested methodology can be considered a suitable tool for land planning.

1. Introduction

The management of land and water resources are closely related [1,2,3], since the spatial planning addresses the localization of activities and the land use. The latter affects water balance, water quality, hydraulic risk and soil loss [3,4,5]. Thus, land use and land management practices affect the eco-hydrological processes in combination with other factors such as the topography of the basin, the hydrological properties of agricultural land and the rainfall characteristics [3,6,7,8,9].
In particular, land use affects soil erodibility and canopy cover. Both parameters are considered when estimating the values of the universal soil loss relation [10]. The latter is usually used for estimating the soil amount removed by water runoff [11]. Soil use also influences the main terms of the water balance, i.e., canopy interception, evapotranspiration, infiltration, soil water storage, and surface outflow [12,13,14]. Moreover, the above parameters are also related to the characteristics of vegetation (species, crop management, leaf area, root depth, crop height) and soil (organic matter content, hydraulic conductivity, infiltration capacity, apparent density, porosity). An important action on soil properties is carried out by cropping systems and root characteristics [15,16]. For example, the results of experimental observations show that forest soils are characterized by high values of hydraulic conductivity and porosity, with a positive effect on water infiltration and retention capacity [17,18,19].
Several studies [20,21,22] demonstrate a complex and non-linear relationship between soil use and the hydrological cycle. This relationship is more evident in small basins with a catchment area less than 40 km2 [23,24,25]. In particular, the hydrological cycle depends on site-specific factors, such as the slope and the distance from the hydrographic grid [26], as well as the changes in land use.
Furthermore, following [6,22,27,28,29,30], soil surface sealing and intensive agricultural management have significant negative impacts on the hydrological cycle, as they result in a notable increase in the superficial flow rate and volume, while soil infiltration and water-table recharge are reducing.
In a catchment, the forest surfaces, and their conservation and management, modulate the whole water cycle by promoting evapotranspiration, reducing surface runoff, and regulating flood waves [22,29,31]. As a consequence, agro-forestry management contributes to the mitigation of hydraulic risk, if it is planned taking into account water resources and hydraulic infrastructures [32,33,34]. Furthermore, the “soil–plant” system influences the availability of water resources by: (i) attenuating the kinetic energy of rainfall; (ii) increasing the soil water-storage capacity; (iii) reducing the water evaporation; and (iv) the deep drainage [35,36,37].
An important role in regulating the hydrological cycle can therefore be attributed to the ecosystems associated with land use and agro-forest management [38,39,40,41]. The agro-forest ecosystems provide a series of direct and indirect hydrological services: (1) water provisioning (storage in water bodies and water harvesting); (2) flow regulating; (3) water purification [42]; and (4) soil protection [43,44]. The water balance and the soil characteristics are consequently influenced by the species in the agro-forest ecosystems and by the adopted cropping systems. Moreover, crop and forest management has a significant impact on quality and quantity characteristics of surface waters and groundwater.
Once the ecosystem service “water providing” is quantified, it is possible to estimate the water resource carrying capacity (i.e., the population able to be supplied in a sustainable way), and to design suitable water harvesting systems.
With reference to the surface and groundwater purification issues, vegetation and the microbial soil community act on the absorption and biochemical transformation of nutrients and contaminants [45].
On the other hand, intensive farming systems, requiring high external inputs (fertilizers or other agrochemicals), may have negative effects on the quality of water resources which in some cases might become unsuitable for drinking if the agrochemicals are not adequately supplied and scheduled.
From the analysis of the literature reported above it can be concluded that territorial planning is required to optimize the eco-hydrological cycle. Such planning activities should consider at the same time the regulation, purification and provision of water resources [46] since the hydraulic security of the territory depends on these services [47], as well as on the water carrying capacity [48] and the sustainability of water purification processes [49]. Nevertheless, with respect to the soil protection service, vegetation affects the plant cover factor (C-factor) used to estimate soil loss [50]. Forests are generally retained to protect soil from erosion more efficiently than cropping systems do. However, recent agronomic studies on conservation agriculture show that the C-factor is influenced by crop residues and soil tillage [51,52,53,54]. Reducing soil tillage, combined with suitable management of the crop residues, can contribute to controlling the soil erosion [55].
A possible approach for sustainable planning starts from the definition of the physical variables involved in the ecosystem services by mean of indicators which can be quantified by giving an appropriate economic value. The general objective of this study was to quantify, in physical and economic terms, the ecosystem services provided by the territorial planning of Mediterranean basins. To achieve this objective, the following issues have been addressed: (i) water resource availability; (ii) rainfall effects on the soil surface; and (iii) water carrying capacity.
Specific objectives of this study were:
  • to develop the conceptual method for quantifying the technical and economic value of the hydrological services provided by the ecosystems. In particular, four services were considered: (1) water provisioning; (2) flow regulating; (3) water purification; (4) soil protection;
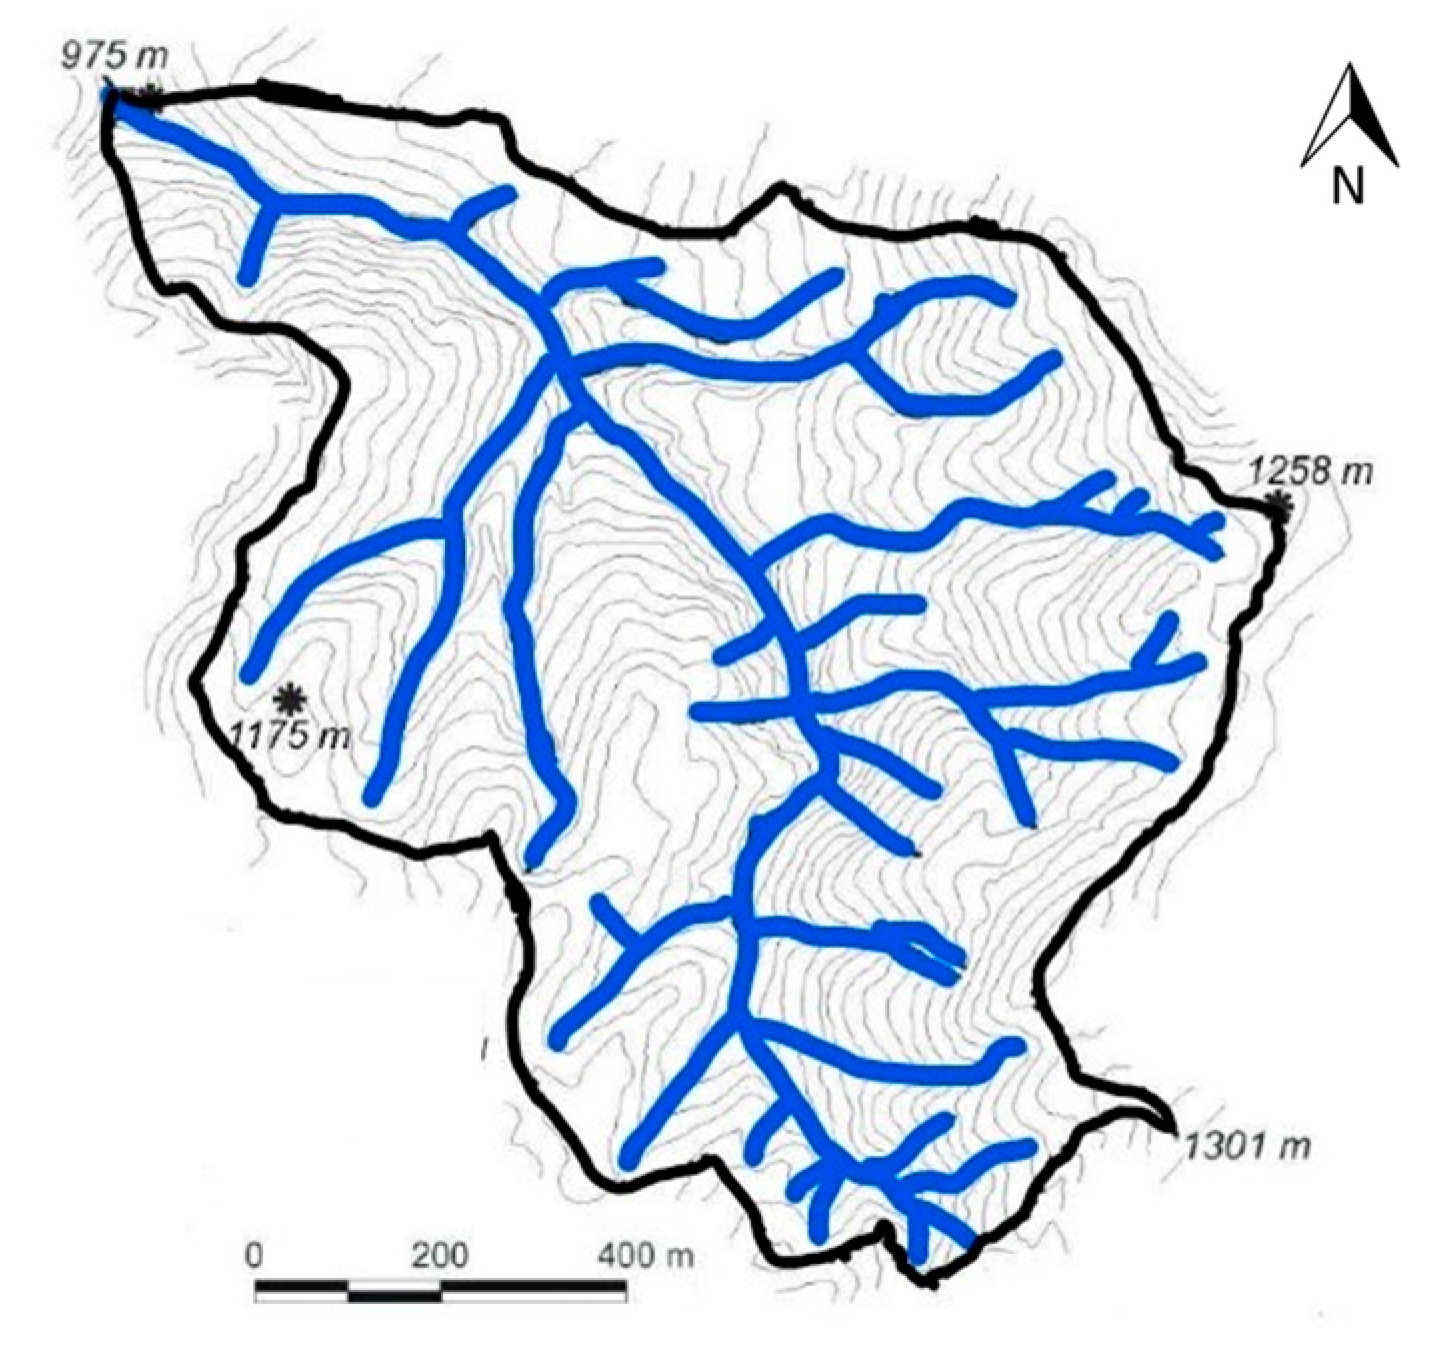
  • to apply the developed methodology to an emblematic case of a gauged watershed in southern Italy (the Bonis basin in Calabria), mainly covered by Mediterranean forest systems;
  • to analyze possible planning scenarios by using the proposed methodology.
This methodology was conceived as a tool for identifying and implementing territorial plans at the meso-scale suitable for preventing floods and degradation (of quality and quantity) of water resources.

2. Materials and Methods

In order to assess the impact of basin ecosystems on the hydrological cycle and water quality of a watershed, the proposed methodology is based on the use of both temporal and timeless indicators and it is applied to different scenarios of land use and soil management. Time indicators were evaluated at the annual scale in accordance with [56].

2.1. Assessment of Hydrological Ecosystem Services

2.1.1. Water Provisioning (WS)

The service “water provisioning” from an eco-systemic point of view is defined as water storage in rivers, lakes and aquifers [57]. This service is correlated to inflows into the water bodies and to the water harvesting systems and infrastructures [58]. To quantify this service, the “water supply” indicator is used. It can be expressed in different ways by combining the following terms: (i) the runoff [59]; (ii) the ratio between availability and demand for water resources [60]; (iii) the total volume of uptake water [61] for different socio-economic purposes.
The approach proposed in this study is based on parameters which are generally available from meteorological and hydrological data-sets. Thus, the water supply (WS in mm yr−1) was estimated following the model developed by [62]:
WS = S PTC ET EF
where SPTC is the precipitation water (mm yr−1), ET is evapotranspiration (mm yr−1) and EF is the water requirement for maintaining the aquatic ecosystems (mm yr−1), which for the Italian territory is 30% of the rain [63]. As for ET, the literature annual average values were considered. They were calculated by using the water balance at the plot scale and then spatialized at the watershed level. The economic value of the “water provisioning” service was assessed in accordance with [49], using the unit average Italian water rate of 0.71 € m−3. This fixed economic value was established by the National Authority for Energy, Gas and the Water System. Alternatively, the water rate can be more accurately estimated, taking into account the relationship between availability and demand [60].

2.1.2. Flow Regulation (WC)

Ecosystems offer a “flow regulation” service through the influence of the soil–plant system on hydrological flows [57]. This service is directly related to the volume of water intercepted by vegetation and stored in the soil profile or in the aquifers [64]. These hydrological parameters depend on soil tillage and agro-forest management. For this reason, the “flow regulation” directly affects the processes of rainfall–runoff transformation and, consequently, the hydraulic hazard. For the quantification of flow regulation by “rainfall–runoff” process evaluation, several indicators have been proposed, such as: (i) soil water-storage capacity [65]; (ii) soil infiltration capacity [61] and (iii) water conservation efficiency. These indicators refer to the water amount that is stored in the soil profile and withdrawn from the surface runoff [49,66].
In this study the flow regulation was quantified by the timeless water conservation (WC, in m3) indicator, which takes into account potential water losses due to evapotranspiration and soil water storage. This indicator was calculated with reference to rainfall with a return time of 200 years. This time period is usually considered when assessing the territory protection from floods. Therefore, the volume of rainfall accumulated into the soil and removed from the runoff was calculated by subtracting the flow volume for different land uses from the rainfall amount, characterized by a return time of 200 years:
WC = Vol rain Vol runoff
where Volrain (m3) is the 200-year rainfall volume estimated on the basis of climatic possible curves and Volrunoff is the runoff volume through the stream gauging station, estimated through the “rational formula” described in Section 2.3 (assessment of surface runoff).
The economic value of the flow regulating service has been calculated with reference to the WC indicator on the basis of the costs for the construction of a storm-water retention system with equivalent volume. Analysis of the storm-water retention system project shows that the unit cost varies from 5 to 15 € m−3. This value does not take into account the management and maintenance costs. The chosen value was assumed to be 5.16 € m−3 for the detention basin [67] (Autorità di Bacino dei FiumiTrigno, Biferno e Minori, Saccione e Fortore). This evaluation is consistent with that proposed by [68]. Thus, the presence of a forested area is economically equivalent to a water retention system that can contain the same water quantity.

2.1.3. Water Purification (COD)

The “water purification” service is defined as the capacity of ecosystems to remove pollutants by means of chemical, physical, micro-biological and mechanical processes [44]. The most used indicators for quantifying this service are the percentage of forest surface and the percentage of riparian forests along the river [68,69].
In this study, to quantify the “water purification” service, the water quality parameters influenced by land use were used as indicators. The concentration of pollutants in the surface water was assessed on the basis of the forest surface and other land uses within the same basin [2]. In particular, it is possible to estimate the chemical oxygen demand (COD in mg L−1) parameter, which describes the surface water pollution, on the basis of the following formula:
ln ( COD ) = 0.08 C 5.47 F 2.93 G + 0.29 W + 0.7 B + 1.69
where C is the conventional cultivated area (%), F forest (%), G pasture (%), W water bodies (%) and B the impermeable surfaces (%) calculated with respect to the total basin surface. The coefficients used in relation (3) were determined by [2] through data processing related to land use and water quality. It is possible to estimate the total organic carbon (TOC in mg L−1) which represents an indirect measure of the organic matter in the waters by means of the ratio COD/TOC = 3. This parameter makes it possible to establish the economic suitability of water treatment for drinking use (TOC ≤ 4 mg L−1) and for the next human consumption (TOC ≤ 2 mg L−1) [70].
An economic evaluation of the “water purification” service can be carried out based on changes in the TOC resulting from changes in soil use. In this study, the cost of the active carbon needed to reduce the TOC to the most suitable values for drinking use was calculated. In fact, through the reduction of TOC, it is possible to estimate the amount of powdered activated carbon (PAC in mg L−1) needed for the purification of the water and the relative costs [71]:
PAC =   TOC reduction 0.063
Analysis of the water treatment plant project shows that the unit PAC cost varies from 1.6 (adopted value) to 1.9 € kg−1.

2.1.4. Soil Protection (βe)

The “soil protection” service was evaluated from the close interrelations between erosion, solid transport and water quality. Actually this ecosystem service is the most complex to define and quantify. The indicator here adopted for quantifying soil protection is the “ecosystem service mitigated impact on soil erosion” (βe in t ha−1 yr−1), it is the basin potentiality, provided by the presence of areas covered with vegetation [72,73], as in:
β e = Γ   ×   C factor
where Cfactor (dimensionless) is the vegetation cover factor and Γ is the structural impact [74]. Γ is calculated as:
Γ = R × LS × K
R is the rainfall erosivity (MJ mm ha−1 h−1 yr−1), LS is the topographic factor (dimensionless), and K is the soil erodibility (t h MJ−1 mm−1).
Finally, this service can be quantified, on an annual basis (t ha−1 yr−1), through the difference between water erosion in different types of land use with respect to bare soil conditions. Values of βe (t ha−1 yr−1) allow the determination of the positive or negative impact of land use on the amount of average annual soil loss per surface unit.
The capacity of ecosystems to protect the soil is expressed by means of the parameter Es (dimensionless), according the definition by [72]:
Es = 1 − Cfactor
In the literature there are different Cfactor values in relation to soil use [12], plant species and agricultural practices [55]. Only soil-related values were used in this work due to the lack of site-specific knowledge on soil tillage, pruning and green (or crop) residue management.
By the above definitions, the unit economic value of the soil for replacement varies between 44.6 and 255.1 € t−1, including transport and filling costs [75]. A value of 45 € t−1 was assumed in this study and it represents the Italian situation. This value is consistent with the prices for backfilling operations in public works.

2.1.5. Assessment of the Economic Values

For the economic evaluation of ecosystem services, it is worth noting that there are no overlaps between the range of asset cost values: water 0.71 € m−3; powdered activated carbon 1.6 ÷ 1.9 € kg−1; storm-water retention system 5 ÷ 15 € m−3; soil replacement 44.6 ÷ 255.1 € t−1 (soil and hydraulic works). Furthermore, since all indicators are linearly related to specific costs, the variations are linearly reported in the final values of the indicators in the object.
Other ecosystem services not strictly related to the water cycle were not considered in this study.

2.2. Assessment of Water Carrying Capacity

The water resource carrying capacity (WRCC in inhabitants) is a key indicator for the study of available water resources and their sustainable management [76]. It allows us to compare the availability of and the need for water resources. The WRCC can be estimated on the basis of socio-economic and ecological parameters [48,76,77]. Considering that the carrying capacity is the number of individuals that the environment can support [78], the largest population supported with water resources produced by ecosystems in a specific river basin can be defined as:
WRCC =   WS WD × α
where WS is available water (m3 yr−1), WD is the water supply equal to 92 m3 inh−1 yr−1 [79] (National Regulatory Plan for Aqueducts, 1963), and α is the use coefficient, assumed equal to 0.8, which is the value commonly used for designing city sewers.

2.3. Assessment of Surface Runoff

The peak flow during flood events is an important parameter for dimensioning hydraulic infrastructures and for defining the floodplain areas (Flood Directive 2007/60/CE) [80]. In order to realistically estimate the runoff value, advanced methodologies for rainfall–runoff transformation are available [81]. The most commonly used method is the “rational formula”, for its simplicity and the reduced amount of input data required [82]. In order to estimate peak flow (QP), this formula is particularly used in small basins:
Q P = C × i tr 3.6 × A
where C (dimensionless) is runoff coefficient, itr (mm h−1) is the rainfall intensity for the assigned return time, and A (km2) is the watershed surface. Specific experimental data are available concerning the runoff coefficient in the analyzed basin [83]. Assuming a return time of 200 years, the rainfall intensity for the study area is 18.2 mm h−1. This value was calculated on the basis of pluviometric probabilistic curves for the studied area [84].

2.4. The Study Area

The “Bonis” hydrographic basin (39°25′15″ N and 16°12′38″ E) is located in the province of Cosenza in the Calabrian Region (Figure 1). From the hydrological point of view, an annual average rainfall of 1200 mm and average losses due to evapotranspiration of 300 mm are reported [85].
The basin has been the object of numerous experimental studies and it is characterized in detail by the hydro-geomorphologic and territorial points of view (Table 1 and Table 2). Soil use determines a flow coefficient between 0.18, in the case of forests with good vegetative status, and 0.35 as a result of the cuttings for maintenance and fire-fighting actions [83].

2.5. Scenarios

Since the proposed methodology allows either the evaluation of hydrological services provided by the ecosystems, or the determination of the carrying capacity, or the effects on the soil of the rainy events, different scenarios of land use and canopy management were analyzed to evaluate the effects on hydrological eco-services. Specifically, the following scenarios were considered: (1) forest cover with good vegetative status (baseline scenario); (2) forest with low vegetation vigor (e.g., after cutting or fire-fighting actions); (3) agricultural conversion of 50% of the basin surface; (4) soil sealing on 1.5% of the basin surface (e.g., roads, tourist resorts). Scenarios 1 and 2 are related to the current land use (Table 2), but with two different levels of forest vegetation vigor. Scenarios 3 and 4 are related to a change in land use compared to that described in Table 2, with the insertion of agricultural or impervious areas and a relative reduction of the forest area.

3. Results

The application of the proposed methodology allows the quantitative and economic evaluation of the hydrological services provided by the ecosystems in the Bonis basin. The four indicators defined above were calculated for four land use scenarios and they are reported as follows: Table 3 “water provisioning” (WS), Table 4 “water flow regulation” (WC), Table 5 “water purification” (COD) and Table 6 “soil protection” (βe). In Table 4, in addition to the quantification of the “water regulation” service, the two-century peak flow (Equation (9)) was also reported, indicative of the effects of meteoric events at the soil surface.
WS has the highest values (Table 3), both in terms of water provisioning and economic value when the forest cover is characterized by low plant vigor, while the lowest value is estimated in the case of the forest having high leaf area values. This information can be successfully used to improve decision planning, with particular attention to (i) agro-forestry; (ii) water management; and (iii) the planed hydraulic infrastructures to meet the water demand from the various socio-economic sectors. From the economic point of view, the value of the water provisioning service depends mainly on climatological aspects (rainfall and evapotranspiration) that cannot be significantly controlled by anthropogenic action in the basin. The choice of dry farming systems or of drought-tolerant species, or species with a reduced leaf area, can increase the amount of water provision (and, as a consequence, the economic benefits of this ecosystem service).
Regulating water flow is an eco-systemic service (WC, Table 4) closely related to meteoric events, and specifically to runoff. From the values reported in Table 4, it is evident that the amount of water flow does not change on a yearly scale in the different scenarios. However, WC affects the peak flow and, consequently, the hydraulic hazard of the basin. Peak flow is closely related to soil use and vegetation management. Moreover, when the area is covered by forest, the lamination effect on water flows is better distributed than in other scenarios. This relation is linked to the runoff coefficient, experimentally determined for the Bonis basin by [83] Veltri et al. (2013) before and after the vegetation cutting. In the scenarios “forest” and “forest with low vigor” the runoff coefficients were experimentally determined, while in agricultural conversion scenarios, and under soil sealing conditions, the outflow coefficients were obtained from table values commonly used for hydrological models. Furthermore, the economic value of the water-flow-regulating ecosystem service (Table 4) has been closely related to vegetation, whose characteristics significantly affect interception, evapotranspiration and infiltration processes.
Crops with high leaf area and a developed root system subtract further meteoric water from the runoff component of the hydrological balance, with positive effects on the economic value of the eco-systemic service “water flow regulation”. The results show that the reduction of leaf area due to forest cutting results in a reduction in the economic value of the water regulation service of approximately 12,000 €.
The water purification service was quantified by estimating the TOC and COD quality parameters (Table 5). Values reported in Table 5 do not indicate any difference among different kinds of forest management. Moreover, the results show that the agricultural conversion of forestland causes an increase in the organic and inorganic compounds present in the water. However, in all scenarios, the COD and TOC values are suitable for human consumption. In fact, the estimated concentrations are lower than the quality thresholds established by national and international drinking water regulations (Legislative Decree 31/2001) [86]. The economic value of the ecosystem service cannot be estimated in absolute terms, as it is related to the variations in quality caused by land use changes. For this reason, relatively to the total water volume produced annually from the basin, the active charcoal (PAC) was estimated as the amount needed to reduce the TOC from the agriculture scenario to the TOC values calculated in the forest scenario. The required activated charcoal costs €1871.
The “soil protection” service (Table 6) was evaluated for all scenarios. The results show a marked increase in soil loss due to the variation of the Cfactor from 0.02 (forest areas) to 0.20 (cultivated areas) in half the area of the basin.
As for water purification, the service cannot be estimated in absolute terms, but only by comparing the current situation with the “bare soil” conditions. It follows that the soil necessary to restore the amount lost in the agricultural conversion (563 t yr−1) in one year is 25,335 € yr−1.
Considering the resulting value from all ecosystem services associated with each scenario (Table 7), the most convenient one, if compared with the baseline scenario, was found to be the forest with low vigor. Here the runoff increases to the advantage of the water provisioning but to the slight disadvantage of the water retention capacity. In order to evaluate the ecosystem service for scenarios three and four, the cost for water purification was negative, because it represents a degradation of water quality.
Regarding the capacity of water resources produced in the Bonis basin, the WRCC indicator was equal to 8500 people in the forest cover scenario. The reduction of leaf coverage by means of cutting, or agricultural conversion, resulted in an increase in carrying capacity as the greater production of water makes it possible to meet the needs of a larger number of inhabitants (about 10,000 people).
Given the close dependence of WRCC on the WC indicator, which depends on rainfall, particular attention must be paid to future climate scenarios.
In addition, in order to align water availability to requirements, it may be advisable to introduce unconventional water (reclaimed water) for alternative uses (industry, irrigation), alleviating the pressure on resources for direct human consumption (drinking water).
In planning a Mediterranean agro-forest area, the reduction of the evapotranspiration levels should be suitable, and, in the case of irrigated farming systems, species growing with both conventional and non-conventional water resources should be preferred. However, this issue needs to be properly harmonized with the aim of protecting the territory from the adverse effects of floods [87].
The results of this study show that the intensity of these phenomena is closely related to the soil use and management. Specifically, the amount of runoff and its hydrodynamic characteristics depends significantly on the type of canopy and its vegetative state. With regard to the Bonis basin (Table 4), the available data allowed the estimation of the peak flow QP for rainy events with a return time of 200 years. In conditions of good vegetative status, the estimated QP200 was 1.26 m3 s−1. This value increases to 2.46 m3 s−1 in the immediate post-cutting period. The increase in the flow rate caused by the forest system management is thus 100%, with significant effects on the intensity of alluvial phenomena. The magnitude of the negative impact on runoff increases further in the case of the agricultural conversion of 50% of the basin, resulting in a peak flow of 3.49 m3 s−1.

4. Discussion

Interventions in the eco-systems and on the territory described above mainly affect soil loss, water provisioning and its purification. Once the available water is quantified, the water harvesting systems can be planned at a basin scale. In fact, water losses associated with vegetation transpiration have a positive impact on the water flow regulating service and are potentially negative for the supply of water resources. At the same time, forest vegetation results in strong protective action against soil removal caused by erosion. However, these aspects needs to be properly analyzed since the presence of vegetation also determines the space–time distribution of water resources by reducing runoff velocity and the potential for increasing groundwater storage and infiltration [56,83,88]. The different dynamics of these hydrological processes affect the hydraulic residence time in the basin and the reduction of the seasonal variation of the seasonal fluctuations [89]. It has been shown that the increase in the forest area reduces irregularities in the runoff and increases the water retention time within the catchment area [88]. A significant negative correlation between forest area and water pollution has been also identified [2]. The amount of water with qualitative characteristics suitable for anthropogenic uses is a key element for determining the environmental carry capacity. This capacity is in fact defined as the maximum consumption of natural resources that can be supported in an area, without compromising the quality and quantity of the water in an ecosystem [90,91,92].
Modelling studies of the water balance and evapotranspiration can improve the estimation of the hydrological quantities with positive effects on the evaluation of ecosystem services.
In perspective, the potential of this methodology, developed for territorial planning on the micro-scale, can increase if the empirical functions used in this exercise are replaced by mathematical models.
To transform the quantitative results in economic value achievable from the eco-system services, the unit costs are taken into account. In the Section 2.1.5 the ranges of these costs are reported for each considered service. In the exercise reported here for the Bonis watershed case study, the effective costs usually used in Italy were considered. These values generally correspond to the minimum economic values of the indicated ranges, mainly for two costs items: storm-water retention and soil replacement.
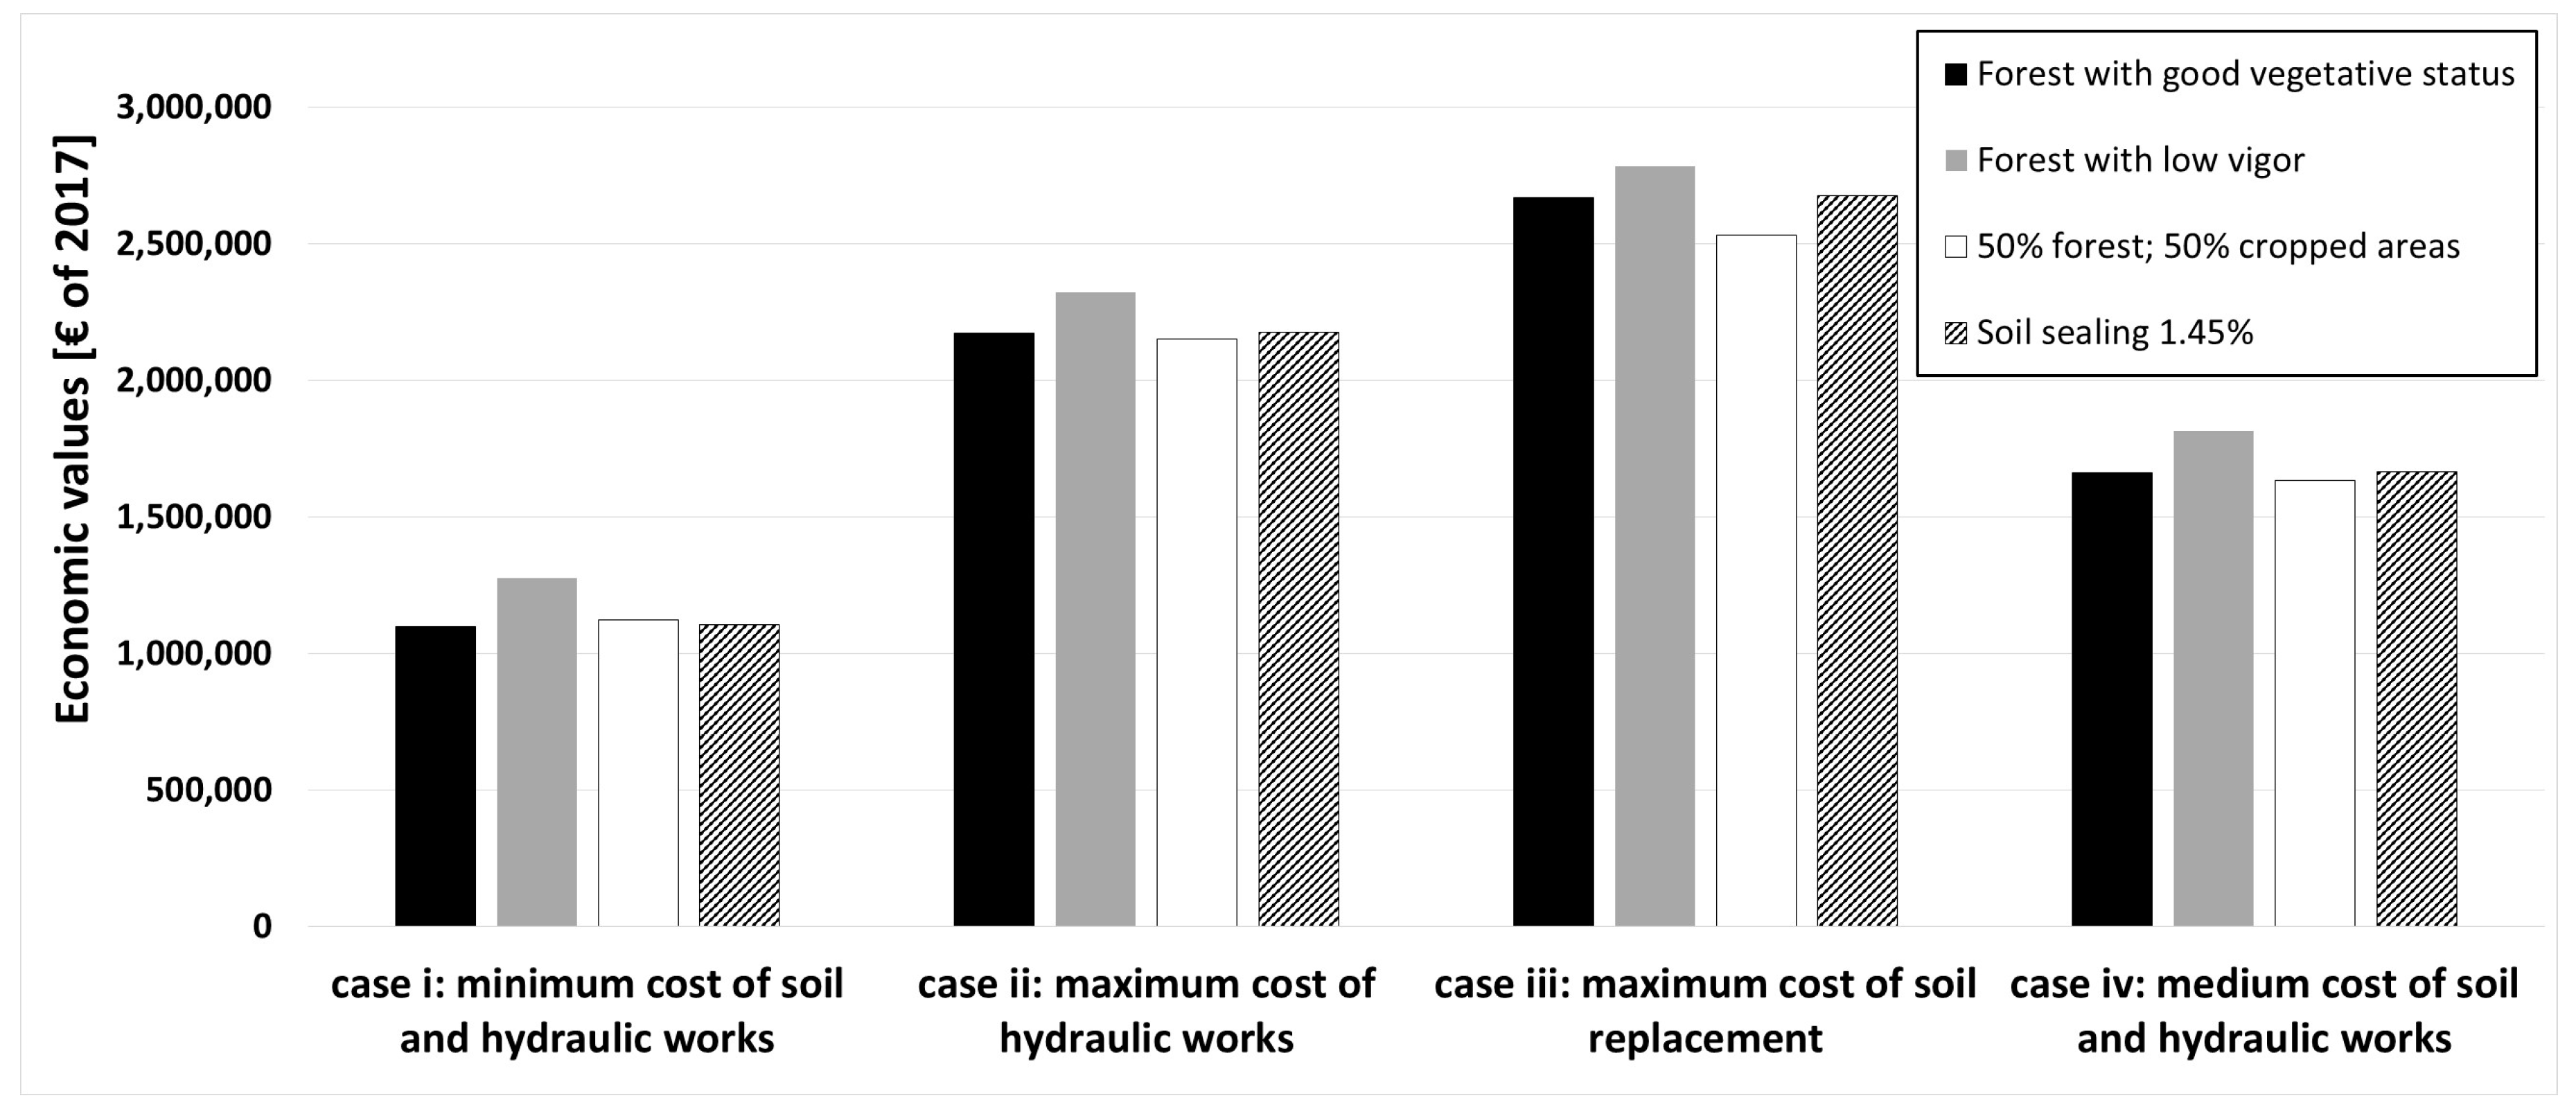
In order to validate the robustness of the proposed methodology, the results of a sensitivity test were analyzed. This consisted of using different unitary costs to estimate the values of an ecosystem service and then to compare the results. Therefore, the ecosystem economic value was recalculated for the following hypotheses: case (i) unit costs (see Section 2.1.5) referred to the minimum values of ranges; case (ii) maximum unit cost for storm-water retention systems and the invariance of other economic parameters; case (iii) maximum unit cost for soil replacement and the invariance of the other economic parameters; case (iv) average unit costs for storm-water retention systems and for soil replacement, invariance of other economic parameters.
Figure 2 shows an economic sensitivity analysis which allows us to validate the robustness of the proposed method. If we consider the “I” case as reference, the maximum increase of the ecosystem services values is obtained in case iii (130%). As for case (ii) the increment is 92% and it corresponds to about 50% in case (iv).
If the unit cost attributed to the ecosystem services varies within the above-reported ranges (Section 2.1.5), the trends do not change with the land use scenario. The only exception is observed for the third land use scenario, where 50% of the land is used by cropping systems to the detriment of the forest territory, here the economic value of the hydrological eco-services is systematically the lowest. The sensitivity analysis suggests that any increase in the cost of soil replacement (as in cases iii and iv) affects the economic significance of the forest surfaces in a watershed, in terms of their extend, care and sound management.

5. Conclusions

Research has shown that, under typical Mediterranean conditions, changes in land use and vegetation management have a significant impact on eco-hydrological processes occurring at the watershed scale. For this reason, the analysis of the effects of territorial planning on the hydrological cycle and on quality is a prerequisite in order to protect the state of water resources and hydrogeological equilibria at the same time. As an example, water provisioning (WS) could be improved by 17% by halving the forest surfacein this case the peak flow would increase (by 176%) as would the soil erosion (563 t yr−1). These figures change when the forest is adequately managed (low vigor due to cutting) compared to when the forest is not properly managed (forest with good vegetative status) In this scenario, the WS improves by 45% and the peak flow increases by 95% (about the half of the previous scenario when the cropped areas occupy the 50% of the watershed) and the soil erosion is of the same extent, at 188 t yr−1 more.
The proposed methodology is a useful tool for designing appropriate water harvesting systems. Moreover the methodology allows us to quantitatively analyze the effects of planning land use on actual or future water resource availability, water quality and the intensity of flood phenomena. It also provides a rigorous economic quantification of ecosystem services, in order to be able to tailor more precise and suitable policy measures for forest areas or for managing the land use in a watershed.
The sensitivity analysis confirms that the proposed approach provides effective results also for estimating the economic values of the ecosystem services, even if the unit cost (mainly for soil replacement or storm-water retention systems) changes considerably.
In perspective, the economic estimation of the ecosystem services allows us to consider incentives, or tax policy, as a tool for river basin planning, by supporting the land use variations which might improve the state of water resources. These measures are also foreseen in the Water Management Plans (2000/60/CE) and the Floods (Dir. 2007/60/EC) to improve water status and water retention.

Acknowledgments

This work was partially carried out within the “ALForLab” Project (PON03PE_00024_1) co-funded by the 2007–2013 National Operational Program for Research and Competitiveness (PON R&C), through the European Regional Development Fund (FESR) and national resources (rotation fund (FDR)–MIUR Action and Cohesion (CAP) Plan).

Author Contributions

Russo Giovanni and Verdiani Giuseppe conceived and designed the adopted analysis and methods; Rana Gianfranco, Mastrorilli Marcello and Fumai Antonio analyzed and elaborated the data with redaction of figures and tables; all the authors contributed analysis tools and wrote/revised the paper.

Conflicts of Interest

The authors declare no conflict of interest.

References

  1. Mastrorilli, M.; Zucaro, R. Towards sustainable use of water in rainfed and irrigated cropping systems: review of some technical and policy issues. AIMS Agric. Food 2016, 1, 294–314. [Google Scholar] [CrossRef]
  2. Huang, J.; Zhan, J.; Yan, H.; Wu, F.; Deng, X. Evaluation of the impacts of land use on water quality: A case study in the Chaohu Lake Basin. Sci. World J. 2013. [Google Scholar] [CrossRef] [PubMed]
  3. Weatherhead, E.K.; Howden, N.J.K. The relationship between land use and surface water resources in the UK. Land Use Policy 2009, 26, S243–S250. [Google Scholar] [CrossRef]
  4. Ran, J.; Nedovic-Budic, Z. Integrating spatial planning and flood risk management: A new conceptual framework for the spatially integrated policy infrastructure. Comput. Environ. Urban Syst. 2016, 57, 68–79. [Google Scholar] [CrossRef]
  5. Yong, S.T.Y.; Chen, W. Modeling the relationship between land use and surface water quality. J. Environ. Manag. 2002, 66, 377–393. [Google Scholar] [CrossRef]
  6. Jackson, B.M.; Wheater, H.S.; Mcintyre, N.R.; Chell, J.; Francis, O.J.; Frogbrook, Z.; Marshall, M.; Reynolds, B.; Solloway, I. The impact of upland land management on flooding: Insights from a multiscale experimental and modelling programme. J. Flood Risk Manag. 2008, 1, 71–80. [Google Scholar] [CrossRef]
  7. Scanlon, B.R.; Jolly, I.; Sophocleous, M.; Zhang, L. Global impacts of conversions from natural to agricultural ecosystems on water resources: Quantity versus quality. Water Resour. Res. 2007, 43. [Google Scholar] [CrossRef]
  8. Anderson, J.M.; Burt, T.P. The role of topography in controlling through flow generation. Earth Surf. Process. Landf. 1978, 3, 331–344. [Google Scholar] [CrossRef]
  9. Dunne, T. Field studies of hillslope flow processes. In Hillslope Hydrology; Kirkby, M.J., Ed.; John Wiley & Sons: Chichester, UK, 1978; pp. 227–293. ISBN 978-0-471-99510-4. [Google Scholar]
  10. Renard, K.G.; Foster, G.R.; Weesies, G.A.; Porter, J.P. RUSLE: Revised universal soil loss equation. J. Soil Water Conserv. 1991, 46, 30–33. [Google Scholar]
  11. Mogollòn, B.; Frimpong, E.A.; Hoegh, A.B.; Angermeier, P.L. An empirical assessment of which inland floods can be managed. J. Environ. Manag. 2016, 167, 38–48. [Google Scholar] [CrossRef] [PubMed]
  12. Haregeweyn, N.; Tsunekawa, A.; Poesen, J.; Tsubo, M.; Meshesha, D.T.; Fenta, A.A.; Nyssen, J.; Adgo, E. Comprehensive assessment of soil erosion risk for better land use planning in river basins: Case study of the Upper Blue Nile River. Sci. Total Environ. 2017, 574, 95–108. [Google Scholar] [CrossRef] [PubMed]
  13. Wang, B.; Zhang, G.H.; Shi, Y.Y.; Zhang, X.C.; Ren, Z.P.; Zhu, L.J. Effect of natural restoration time of abandoned farmland on soil detachment by overland flow in the Loess Plateau of China. Earth Surf. Process. Landf. 2013, 38, 1725–1734. [Google Scholar] [CrossRef]
  14. Xiao, Q.; McPherson, E.G.; Ustin, S.L.; Grismer, M.E.; Simpson, J.R. Winter rainfall interception by two mature open-grown trees in Davis, California. Hydrol. Process. 2000, 14, 763–784. [Google Scholar] [CrossRef]
  15. Price, K.; Jackson, C.R.; Parker, A.J. Variation of surficial soil hydraulic properties across land uses in the southern Blue Ridge Mountains, North Carolina, USA. J. Hydrol. 2010, 383, 256–268. [Google Scholar] [CrossRef]
  16. Wahren, A.; Feger, K.H.; Schwarzel, K.; Munch, A. Land-use effects on flood generation: Considering soil hydraulic measurements in modeling. Adv. Geosci. 2009, 21, 99–107. [Google Scholar] [CrossRef]
  17. Tyszka, J.; Stolarek, A. Changes in runoff as an indicative measure of water retention status in the Białowiea Primeval Forest. Folia For. Pol. 2013, 55, 72–88. [Google Scholar] [CrossRef]
  18. Neris, J.; Jiménez, C.; Fuentes, J.; Morillas, G.; Tejedor, M. Vegetation and land-use effects on soil properties and water infiltration of Andisols in Tenerife (Canary Islands, Spain). Catena 2012, 98, 55–62. [Google Scholar] [CrossRef]
  19. Thompson, S.E.; Harman, C.J.; Heine, P.; Katul, G.G. Vegetation-infiltration relationships across climatic and soil type gradients. J. Geophys. Res. 2010, 115. [Google Scholar] [CrossRef]
  20. Lin, B.; Chen, X.; Yao, H.; Chen, Y.; Liu, M.; Gao, L.; James, A. Analyses of land use change impacts on catchment runoff using different time indicators based on SWAT model. Ecol. Indic. 2015, 58, 55–63. [Google Scholar] [CrossRef]
  21. Lin, K.; Lv, F.; Chen, L.; Singh, V.P.; Zhang, Q.; Chen, X. Xinanjiang model combined with Curve Number to simulate the effect of land use change on environmental flow. J. Hydrol. 2014, 519, 3142–3152. [Google Scholar] [CrossRef]
  22. Liu, Y.B.; De Smedt, F.; Hoffmannb, L.; Pfister, L. Assessing land use impacts on flood processes in complex terrain by using GIS and modeling approach. Environ. Model. Assess. 2004, 9, 227–235. [Google Scholar] [CrossRef]
  23. Marapara, T.R. Eco-hydrology Interactions between Trees, Soil and Water in Terrestrial and Wetland Areas: The Effect of Tree Planting on Water Flow Dynamics in Wairarapa Wetlands, New Zealand. Ph.D Thesis, Victoria University, Wellington, New Zealand, 2016. [Google Scholar]
  24. Bloschl, G.; Ardoin-Bardin, S.; Bonell, M.; Dorninger, M.; Goodrich, M.; Gutknecht, D.; Matamoros, D.; Merz, B.; Shand, P.; Szolgay, J. At what scales do climate variability and land cover change impact on flooding and low flows? Hydrol. Process. 2007, 21, 1241–1247. [Google Scholar] [CrossRef]
  25. Smith, L.K.; Voytek, M.A.; Böhlke, J.K.; Harvey, J.W. Denitrificationin nitrate-rich streams: Application of N2:Ar and 15N-tracer methods in intact cores. Ecol. Appl. 2006, 16, 2191–2207. [Google Scholar] [CrossRef]
  26. Saghafian, B.; Khosroshahi, M. Unit response approach for priority determination of flood source areas. J. Hydrol. Eng. 2005, 10, 270–277. [Google Scholar] [CrossRef]
  27. Du, S.; Shi, P.; Rompaey, A.V.; Wen, J. Quantifying the impact of impervious surface location on flood peak discharge in urban areas. Nat. Hazards 2014, 76, 1457–1471. [Google Scholar] [CrossRef]
  28. Garmendia, E.; Mariel, P.; Tamayo, I.; Aizpuru, I.; Zabaleta, A. Assessing the effect of alternative land uses in the provision of water resources: Evidence and policy implications from southern Europe. Land Use Policy 2012, 29, 761–770. [Google Scholar] [CrossRef]
  29. Nyeko, M.; D’Urso, G.; Immerzeel, W.W. Adaptive simulation of the impact of changes in land use on water resources in the lower Aswa basin. J. Agric. Eng. 2012, 43, 159–164. [Google Scholar] [CrossRef]
  30. O’Connell, E.; Ewen, J.; O’Donnell, G.; Quinn, P. Is there a link between agricultural land-use management and flooding? Hydrol. Earth Syst. Sci. 2007, 11, 96–107. [Google Scholar] [CrossRef]
  31. Andréassian, V. Waters and forests: from historical controversy to scientific debate. J. Hydrol. 2004, 291, 1–27. [Google Scholar] [CrossRef]
  32. Castellini, M.; Iovino, M.; Pirastru, M.; Niedda, M.; Bagarello, V. Use of BEST procedure to assess soil physical quality in the Baratz Lake Catchment (Sardinia, Italy). Soil Sci. Soc. Am. J. 2016, 80, 742–755. [Google Scholar] [CrossRef]
  33. Barbano, A.; Braca, G.; Bussettini, M.; Dessì, B.; Inghilesi, R.; Lastoria, B.; Monacelli, G.; Morucci, S.; Piva, F.; Sinapi, L.; Spizzichino, D. Proposta Metodologica per L’aggiornamento Delle Mappe di Pericolosità e di Rischio—Attuazione Della Direttiva 2007/60/CE Relativa Alla valutazione e Alla Gestione dei Rischi da Alluvioni (Decreto Legislativo n.49/2010); Manuali e Linee Guida 82/2012; ISPRA (Istituto Superiore per la Protezione e la Ricerca Ambientale): Rome, Italy, 2012; ISBN 978-88-448-0571-5. (In Italian) [Google Scholar]
  34. Souchere, V.; King, D.; Daroussin, J.; Papy, F.; Capillon, A. Effects of tillage on runoff directions: Consequences on runoff contributing area within agricultural catchments. J. Hydrol. 1998, 206, 256–267. [Google Scholar] [CrossRef]
  35. Valle, R.F. Jr.; Varandas, S.G.P.; Pacheco, F.A.L.; Pereira, V.R.; Santos, C.F.; Cortes, R.M.V.; Fernandes, L.F.S. Impacts of land use conflicts on riverine ecosystems. Land Use Policy 2015, 43, 48–62. [Google Scholar] [CrossRef]
  36. Butler, C.; Pidgeon, N. From ‘flood defence’ to ‘flood risk management’: Exploring governance, responsibility, and blame. Environ. Plan. 2011, 29, 533–547. [Google Scholar] [CrossRef]
  37. Bosch, J.M.; Hewlett, J.D. A review of catchment experiments to determine the effect of vegetation changes on water yield and evapotranspiration. J. Hydrol. 1982, 55, 3–23. [Google Scholar] [CrossRef]
  38. Harrison, P.A.; Berry, P.M.; Simpson, G.; Haslett, J.R.; Blicharska, M.; Bucur, M.; Dunford, R.; Egoh, B.; Garcia-Llorente, M.; Geamănă, N.; et al. Linkages between biodiversity attributes and ecosystem services: A systematic review. Ecosyst. Serv. 2014, 9, 191–203. [Google Scholar] [CrossRef]
  39. Boelee, E.; Yohannes, M.; Poda, J.N.; McCartney, M.; Cecchi, P.; Kibret, S.; Hagos, F.; Laamrani, H. Options for water storage and rainwater harvesting to improve health and resilience against climate change in Africa. Reg. Environ. Chang. 2013, 13, 509–519. [Google Scholar] [CrossRef]
  40. Wheater, H.; Evans, E. Land use, water management and future flood risk. Land Use Policy 2009, 26, S251–S264. [Google Scholar] [CrossRef]
  41. Pisante, M.; Stagnari, F.; Grant, C.A. Agricultural innovations for sustainable crop production intensification. Ital. J. Agron. 2012, 7, 300–311. [Google Scholar] [CrossRef]
  42. Stagnari, F.; Jan, S.; Galieni, A.; Pisante, M. Sustainable agricultural practices for water quality protection. In Water Stress and Crop Plants: A Sustainable Approach; Ahmad, P., Ed.; John Wiley & Sons: Chichester, UK, 2016; pp. 75–85. [Google Scholar]
  43. Ramazzotti, S.; Stagnari, F.; Pisante, M. Integrated soil and water management for vineyards in southern Italy: A case study. Ital. J. Agron. 2008, 3, 117–118. [Google Scholar]
  44. Grêt-Regamey, A.; Bugmann, H.; Burlando, P.; Celio, E.; de Buren, G.; Koellner, T.; Knoepfel, P.; Pappas, C.; Ryffel, A. Securing hydrological ecosystem services through catchment-wide land-use management. In Managing Alpine Future Ii: Inspire and Drive Sustainable Mountain Regions: Proceedings of the Innsbruck Conference, November 21–23, 2011; Borsdorf, A., Stötter, J., Veulliet, E., Eds.; Austrian Academy of Sciences Press: Vienna, Austria, 2011; pp. 124–133. [Google Scholar]
  45. Naiman, R.J.; Décamps, H. The ecology of interfaces: Riparian zones. Annu. Rev. Ecol. Evol. Syst. 1997, 28, 621–658. [Google Scholar] [CrossRef]
  46. Pires, M. Watershed protection for a world city: The case of New York. Land Use Policy 2004, 21, 161–175. [Google Scholar] [CrossRef]
  47. Chang, H.S.; Hsieh, H.Y. An exploratory study on land use planning of disaster prevention: A case study of Kaohsiung new town. Procedia Environ. Sci. 2013, 17, 382–391. [Google Scholar] [CrossRef]
  48. Li, W.M.; Zhang, K. Evaluation and analysis of water resources carrying capacity in arid zone—A case of Manas basin. In Water Resources and Environment Proceedings of the 2015 International Conference on Water Resources and Environment (Beijing, 25–28 July 2015); Scholz, M., Ed.; CRC Press/Balkema: Leiden, The Netherlands, 2016; pp. 103–108. [Google Scholar]
  49. Morri, E.; Pruscini, F.; Scolozzi, R.; Santolini, R. A forest ecosystem services evaluation at the river basin scale: Supply and demand between coastal areas and upstream lands (Italy). Ecol. Indic. 2014, 37, 210–219. [Google Scholar] [CrossRef]
  50. Kinnell, P.I.A. Event soil loss, runoff and the Universal Soil Loss Equation family of models: A review. J. Hydrol. 2010, 385, 384–397. [Google Scholar] [CrossRef]
  51. Ventrella, D.; Stellacci, A.M.; Castrignanò, A.; Charfeddine, M.; Castellini, M. Effects of crop residue management on winter durum wheat productivity in a long term experiment in Southern Italy. Eur. J. Agron. 2016, 77, 188–198. [Google Scholar] [CrossRef]
  52. Pisante, M.; Stagnari, F.; Acutis, M.; Bindi, M.; Brilli, L.; Di Stefano, V.; Carozzi, M. Conservation agriculture and climate change. In Conservation Agriculture; European Conservation Agriculture Federation (ECAF): Brussels, Belgium, 2015; pp. 579–620. [Google Scholar]
  53. Wall, G.J.; Coote, D.R.; Pringle, E.A.; Shelton, I.J. RUSLEFAC—Revised Universal Soil Loss Equation for Application in Canada; A Handbook for Estimating Soil Loss from Water Erosion in Canada; Agriculture and Agri-Food: Ottawa, ON, Canada, 2002. [Google Scholar]
  54. Reeves, D.W. Cover crops and rotations. In Advances in Soil Science; Springer: New York, NY, USA, 1994; pp. 125–172. [Google Scholar]
  55. Panagos, P.; Borrelli, P.; Meusburger, K.; van der Zanden, E.H.; Poesen, J.; Alewell, C. Modelling the effect of support practices (P-factor) on the reduction of soil erosion by water at European scale. Environ. Sci. Policy 2015, 51, 23–34. [Google Scholar] [CrossRef] [Green Version]
  56. Brauman, K.A.; Daily, G.C.; Ka’eo Duarte, T.; Mooney, H.A. The nature and value of ecosystem services: An overview highlighting hydrologic services. Annu. Rev. Environ. Resour. 2007, 32, 67–98. [Google Scholar] [CrossRef]
  57. De Groot, R.S.; Wilson, M.A.; Boumans, R.M.J. A typology for the classification, description and valuation of ecosystem functions, goods and services. Ecol. Econ. 2002, 41, 393–408. [Google Scholar] [CrossRef]
  58. Nunez, D.; Nahuelhual, L.; Oyarzun, C. Forests and water: the value of native temperate forests in supplying water for human consumption. Ecol. Econ. 2006, 58, 606–616. [Google Scholar] [CrossRef]
  59. MEA (Millennium Ecosystem Assessment) project. Ecosystems and Their Services. In Ecosystems and Human Well-Being: A Framework for Assessment; Island Press: Washington, DC, USA, 2005. [Google Scholar]
  60. Boithias, L.; Acuña, V.; Vergoñós, L.; Ziv, G.; Marcé, R.; Sabater, S. Assessment of the water supply: Demand ratios in a Mediterranean basin under different global change scenarios and mitigation alternatives. Sci. Total Environ. 2014. [Google Scholar] [CrossRef] [PubMed]
  61. Maes, J.; Liquete, C.; Teller, A.; Erhard, M.; Luisa, M.; Barredo, J.I.; Grizzetti, B.; Cardoso, A.; Somma, F.; Petersenc, J.E.; et al. An indicator framework for assessing ecosystem services in support of the EU Biodiversity Strategy to 2020. Ecosyst. Serv. 2016, 17, 14–23. [Google Scholar] [CrossRef]
  62. Meijer, K.S.; Krogt, W.N.M.; Beek, E. A new approach to incorporating environmental flow requirements in water allocation modeling. Water Resour. Manag. 2012, 26, 1271–1286. [Google Scholar] [CrossRef]
  63. Smakhtin, V.; Revenga, C.; Döll, P. Taking into Account Environmental Water Requirements in Global-Scale Water Resources Assessments; Comprehensive Assessment Research Report 2; CGIAR’s System-Wide Initiative on Water Management (SWIM): Montpellier, France, 2004; ISBN 92-9090-542-5. [Google Scholar]
  64. Onaindia, M.; de Manuel, B.F.; Madariaga, I.; Rodríguez-Loinaz, G. Co-benefits and trade-offs between biodiversity, carbon storage and water flow regulation. For. Ecol. Manag. 2013, 289, 1–9. [Google Scholar] [CrossRef]
  65. De Groot, R.S.; Alkemade, R.; Braat, L.; Hein, L.; Willemen, L. Challenges in integrating the concept of ecosystem services and values in landscape planning, management and decision making. Ecol. Complex. 2010, 7, 260–272. [Google Scholar] [CrossRef]
  66. Chang, C.T. Risk-trading in flood management: An economic model. J. Environ. Manag. 2017, 200, 1–5. [Google Scholar] [CrossRef] [PubMed]
  67. Autorità di Bacino dei Fiumi Trigno, Biferno e Minori, Saccione e Fortore. Progetto di Piano Stralcio per l’Assetto Idrogeologico del Bacino Regionale del Fiume Biferno e Minori. Quadro del Fabbisogno Finanziario. 2014. Available online: http://adbpcn.regione.molise.it/autorita/pdf/na/biferno.pdf (accessed on 28 October 2017).
  68. Pirastru, M.; Bagarello, V.; Iovino, M.; Marrosu, R.; Castellini, M.; Giadrossich, F.; Nedda, M. Subsurface flow and large-scale lateral saturated soil hydraulic conductivity in a Mediterranean hillslope with contrasting land uses. J. Hydrol. Hydromech. 2017, 65, 297–306. [Google Scholar] [CrossRef]
  69. Rodríguez-Loinaz, G.; Alday, J.G.; Onaindia, M. Multiple ecosystem services landscape index: A tool for multifunctional landscapes conservation. J. Environ. Manag. 2015, 147, 152–163. [Google Scholar] [CrossRef] [PubMed]
  70. Pontius, F.W. Federal drinking water regulation update. J. Am. Water Works Assoc. 1993, 85, 42–51. [Google Scholar] [CrossRef]
  71. Elias, E.; Laban, D.; Dougherty, M. Estimating the Public Water Supply Protection Value of Forests. J. Contemp. Water Res. 2013, 152, 94–104. [Google Scholar] [CrossRef]
  72. Guerra, C.A.; Maes, J.; Geijzendorffer, I.; Metzger, M.J. An assessment of soil erosion prevention by vegetation in Mediterranean Europe: Current trends of ecosystem service provision. Ecol. Indic. 2016, 60, 213–222. [Google Scholar] [CrossRef]
  73. Xue, D.; Tisdell, C. Valuing ecological functions of biodiversity in Changbaishan Mountain Biosphere Reserve in Northeast China. Biodivers. Conserv. 2001, 10, 467–481. [Google Scholar] [CrossRef]
  74. Prasuhn, V.; Liniger, H.; Gisler, S.; Herweg, K.; Candinas, A.; Clement, J.P. A high-resolution soil erosion risk map of Switzerland as strategic policy support system. Land Use Policy 2013, 32, 281–291. [Google Scholar] [CrossRef]
  75. Schirpke, U.; Scolozzi, R.; De Marco, C. Modello Dimostrativo di Valutazione Qualitativa e Quantitativa dei Servizi Ecosistemici nei siti Pilota; Report of the Project: Making Good Natura (LIFE+11 ENV/IT/000168); EURAC Research: Bolzano, Italy, 2014; pp. 1–75. Available online: http://www.lifemgn-serviziecosistemici.eu/IT/Documents/doc_mgn/LIFE+MGN_Report_B1.1.pdf (accessed on 28 February 2017).
  76. Ming, L. The prediction and analysis of water resource carrying capacity in Chongqing Metropolitan, China. Procedia Environ. Sci. 2011, 10, 2233–2239. [Google Scholar] [CrossRef]
  77. Li, Y.; Guo, T.; Zhou, J. Research of ecological carrying capacity—Comprehensive evaluation model. Procedia Environ. Sci. 2011, 11, 864–868. [Google Scholar] [CrossRef]
  78. Odum, H.T. Self-organization, transformity, and information. Science 1988, 242, 1132–1139. [Google Scholar] [CrossRef] [PubMed]
  79. Italian Standard n. 129, National Regulatory Plan for Aqueducts, 4 February 1963. Available online: http://www.edizionieuropee.it/LAW/HTML/5/zn1_02_007.html (accessed on 4 March 2017).
  80. Directive 2007/60/EC of the European Parliament and of the Council of 23 October 2007 on the Assessment and Management of Flood Risk. Available online: http://eur-lex.europa.eu/legal-content/EN/TXT/?uri=CELEX:32007L0060 (accessed on 6 November 2017).
  81. Petroselli, A.; Grimaldi, S.; Serinaldi, F. Project flood wave for small non-instrumented basins: comparison between continuous models and event scale models. In Proceedings of the Management and Control of Agricultural and Forest Systems, Belgirate, Italy, 22–24 September 2011. (In Italian). [Google Scholar]
  82. Petroselli, A.; Grimaldi, S. Design hydrograph estimation in small and fully ungauged basin: A preliminary assessment of the EBA4SUB framework. J. Flood Risk Manag. 2015. [Google Scholar] [CrossRef]
  83. Veltri, A.; Callegari, G.; Iovino, F. Impatto della gestione dei rimboschimenti di pino laricio sul bilancio idrico. Ital. J. For. Mt. Environ. 2001, 5, 352–361. (In Italian) [Google Scholar]
  84. Falace, M. Il Bacino Sperimentale Bonis: Inquadramento Generale e Dissesto Idrogeologico in Atto. Master’s Thesis, Università degli Studi di Padova, Rende, Italy, 2004. [Google Scholar]
  85. Scarascia-Mugnozza, G.; Callegari, G.; Veltri, A.; Matteucci, G. Water balance and forest productivity in Mediterranean mountain environments. Ital. J. Agron. 2010, 5, 217–222. [Google Scholar] [CrossRef]
  86. Gazzetta Ufficiale n. 52 del 3 Marzo 2001—Supplemento Ordinario n. 41, Decreto Legislativo 2 Febbraio 2001, n. 31 “Attuazione Della Direttiva 98/83/CE Relativa Alla Qualita’ Delle Acque Destinate al Consumo Umano”. Available online: http://www.camera.it/parlam/leggi/deleghe/01031dl.htm (accessed on 20 February 2018).
  87. Pirastru, P.; Niedda, M.; Castellini, M. Effects of maquis clearing on the properties of the soil and on the near-surface hydrological processes in a semi-arid Mediterranean environment. J. Agric. Eng. 2014, 45. [Google Scholar] [CrossRef]
  88. Tekidou, A.; Kasperidus, H.D.; Baltas, E.; Mimikou, M. Water-Retention Potential of Europe’s Forests; Technical Report of European Environment Agency: Copenhagen, Denmark, 2015. [Google Scholar]
  89. Tyszka, J. Estimation and economic valuation of the forest retention capacities. J. Water Land Dev. 2009, 13, 149–159. [Google Scholar] [CrossRef]
  90. Ruggiero, G.; Verdiani, G.; Dal Sasso, S. Evaluation of carrying capacity and territorial environmental sustainability. J. Agric. Eng. 2012, 43, 65–71. [Google Scholar] [CrossRef]
  91. Min, D.; Zhenghe, X.; Limin, P.; Yunhai, Z.; Xiufeng, X. Comprehensive evaluation of water resources carrying capacity of Jining City. Energy Procedia 2011, 5, 1654–1659. [Google Scholar] [CrossRef]
  92. Oh, K.; Jeong, Y.; Lee, D.; Lee, W.; Choi, J. Determining development density using the urban carrying capacity assessment system. Landsc. Urban Plan. 2005, 73, 1–15. [Google Scholar] [CrossRef]
Figure 1. Bonis River Basin (39°25′15″ N; 16°12′38″ W).
Water 10 00241 g001
Figure 2. Sensitivity analysis: variations of the economic values of the hydrological eco-services according to the four cost cases in four land use scenarios.
Water 10 00241 g002
Table 1. Morphometric parameters of the Bonis basin.
Basin area1.387km2
Basin perimeter5.7km
Length of river 2.2km
Average height of basin1131m
Maximum height of the basin1301m
Height of runoff measurement station 975m
Average slope of the basin43.4%
Slope of river12.5%
Average slope of the drainage network24.5%
Altitude difference of the main river 275m
Altitude difference between basin’s closing section and watershed326m
Drainage density7.43km km−2
Gravelius coefficient1.37
Table 2. Land use in the Bonis basin.
Land UseSurface
ha%
Populations of autochthonous larch pine17.612.7
Larch pine reforestation42.930.9
Chestnut reforestation7.95.7
Larch pine and chestnut reforestation13.49.7
Degraded afforested land25.618.5
Spare larch pines and natural vegetation11.28.1
Poplar and alder1.61.2
Glades and clearings2.82.0
Burnt areas2.31.6
Riverbeds colonized by alder11.38.2
Arable fields2.01.4
TOTAL138.7100
Table 3. Ecosystem service “water provisioning” of the Bonis basin: variations at annual scale time of physical and economic values in four land use scenarios of quantitative (WS) and economic values.
Land Use ScenariosWater Supply (WS) (m3 yr−1)Economic Value (€ of 2017)
Forest with good vegetative status607,200431,112
Forest with low vigor883,200627,072
50% forest; 50% cropped areas710,700504,597
Soil sealing 1.45%614,100436,011
Table 4. Ecosystem service “water flow regulation” of the Bonis basin: variations of physical (WC) and economic values in four land use scenarios. Peak flow and runoff (two-century return time) are also reported.
Land Use ScenariosPeak Flow (m3 s−1)Runoff (m3)Water Conservation (WC) (m3)Economic Value (€ of 2017)
Forest with good vegetative status1.262464108,901561,929
Forest with low vigor2.464812106,553549,811
50% forest, 50% cropped areas3.496524104,541539,436
Soil sealing 1.45%1.342617108,828561,553
Table 5. Ecosystem service “water purification” of the Bonis basin: variations of physical and economic values in four land use scenarios. COD is chemical oxygen demand; TOC is total organic carbon; PAC is powdered activated carbon.
Land Use ScenariosCOD (mg L−1)TOC (mg L−1)PAC (mg L−1)Water Purification Cost (€ of 2017)
per LiterBasin Scale
Forest with good vegetative status0.0290.010-
Forest with low vigor0.0290.010-
50% forest; 50% cropped areas0.3400.1131.652.63 × 10−61871
Soil sealing 1.45%0.0320.0110.022.53 × 10−815
Table 6. Eco-systemic service “soil protection” of the Bonis basin (mitigated impact on soil erosion): variations of quantitative and economic values in four land use scenarios. Water erosion prevention: avoided soil losses for basin surface (t yr−1) with respect to the “bare soil” conditions.
Land Use ScenariosEcosystem service “Soil Protection” (t yr−1)Value of the Avoided Erosion (€ of 2017)
Forest with good vegetative status2376.9106,961
Forest with low vigor2189.398,516
50% forest; 50% cropped areas1813.981,628
Soil sealing 1.45%2377.8107,001
Table 7. Hydrological eco-systemic service value of the Bonis basin and comparison with baseline scenario.
Land Use ScenariosEcosystem Service Value (€ of 2017)Relative Ecosystem Service Value (€ of 2017)
Forest with good vegetative status1,100,002/
Forest with low vigor1,275,399175,397
50% forest; 50% cropped areas1,123,79023,788
Soil sealing 1.45%1,104,5504548

