1. Introduction
Sustainable Development Goals (SDGs) aim to achieve universal and equitable access to safe and affordable drinking water for all by 2030. SDGs include sustainability of water in four major components universality (accessible to all), equitability (proportionately accessible in rightful manner), safety (within the water quality standards), and affordability [
1]. Previously, “Willingness to pay” was the primary way to measure the affordability. However, the equitable access and distribution are difficult to be measured solely by “willingness to pay” [
2,
3,
4,
5]. The affordability of water supply services to households is subject to household income, whereas the water utility’s economic sustainability is linked to revenue generated from water price. Furthermore, the balance between these two is necessary, because both are linked [
6]. Largely, regulating bodies from the government formulate price policies for water supply services, which, from the service provider’s perspective, is one way to reduce inequality. However, from the consumer’s perspective, household water use behavior, along with access to the services, plays a critical role in reducing inequality [
7].
The Method of water pricing plays a crucial role in maintaining affordability [
8]. The privatized water sector may increase efficiency in service delivery; however, its impacts on equity are yet to be understood. Accessibility of water services to all people, equitable distribution of water along with the cost recovery of the capital investments in the cities such as Cape-Town (South Africa) and Jerusalem (Israel), etc., shows there are challenges to setting the water price in urban areas [
9,
10]. Evidence shows that in most cities of developing countries, informal markets hold approximately half the share of water supply [
11]. This demonstrates that water utilities should consider the alternate water market when fixing the water price, as the urban water market is full of competitors. On the other hand, proper pricing, along with improvement in water use and management, can solve the water crisis and remedy its economic and environmental consequences [
12].
This article focuses on water price and household water expenditure for the water scarce Kathmandu Valley. Current water demand inside the Valley is 370 MLD (million liters per day). The service provider of Kathmandu’s piped water supply is Kathmandu Upatyaka Khanepani Limited (KUKL), which supplies 115 MLD (31% of demand) during the wet season and 69 MLD (19% of demand) during the dry season [
13,
14]. Dug-wells, tube-wells, traditional stone spouts from shallow ground water, rainwater, and tanker water (water from the vendors obtained typically from deep aquifers) are the options adopted by households to meet the water deficit. Among the various options, shallow ground water for accessible areas and tanker water for inaccessible areas are a second priority for households after piped water supply services [
15,
16]. In order to solve the water crisis inside Kathmandu Valley, the Melamchi Water Supply Project (MWSP), which is currently under construction, is expected to add 170 MLD in the KUKL’s system [
17].
KUKL has the authority to operate and maintain water supply services [
13], and the Kathmandu Valley Water Supply Management Board (KVWSMB) is the asset owner that also has the authority to license and regulate deep ground water and water from the vendors [
18]. KVWSMB’s authority over water service structure; monitoring of the water service from the vendors; and recharging, licensure, and regulation of ground water services is governed through the Water Supply Management Board Act regulations and guidelines. KUKL’s proposal for price rates is approved and regulated by an independent government entity, the Water Tariff Fixation Commission (WTFC) [
13], which operates under the Water Tariff Fixation Act and Water tariff fixation regulations. The water tariff inside KUKL’s service area is a progressive inclining blocks tariff (IBT) with two blocks. The minimum water price for domestic purpose is Nepalese rupees (NRs.) 100 per 10 Cubic meters (CuM) and an additional Rs. 32 thereafter [
13]. Volumetric average water price now is NRs.15.59/CuM, which is not enough for smooth operation of KUKL. The proposed water price for smooth operation is NRs.42.73/CuM [
19]. KUKL, with assistance from the expected MWSP’s additional 170 MLD of water, may lower the required water price to less than NRs.42.73/CuM due to increased production. The difference between required cost and revenue of KUKL is approximately NRs.700 Million annually [
19].
Anticipating this situation, this article addresses the potential impact of two expected major improvements: affordability and equity of household water use, and utilities sustainability after the completion of the MWSP. Proper water price is one of the key factors for an affordable, equitable, and sustainable water supply. In this article, we propose a methodology for identifying the acceptable price necessary to achieve these goals.
2. Methodology
2.1. Study Area, and Present Water Supply and Use
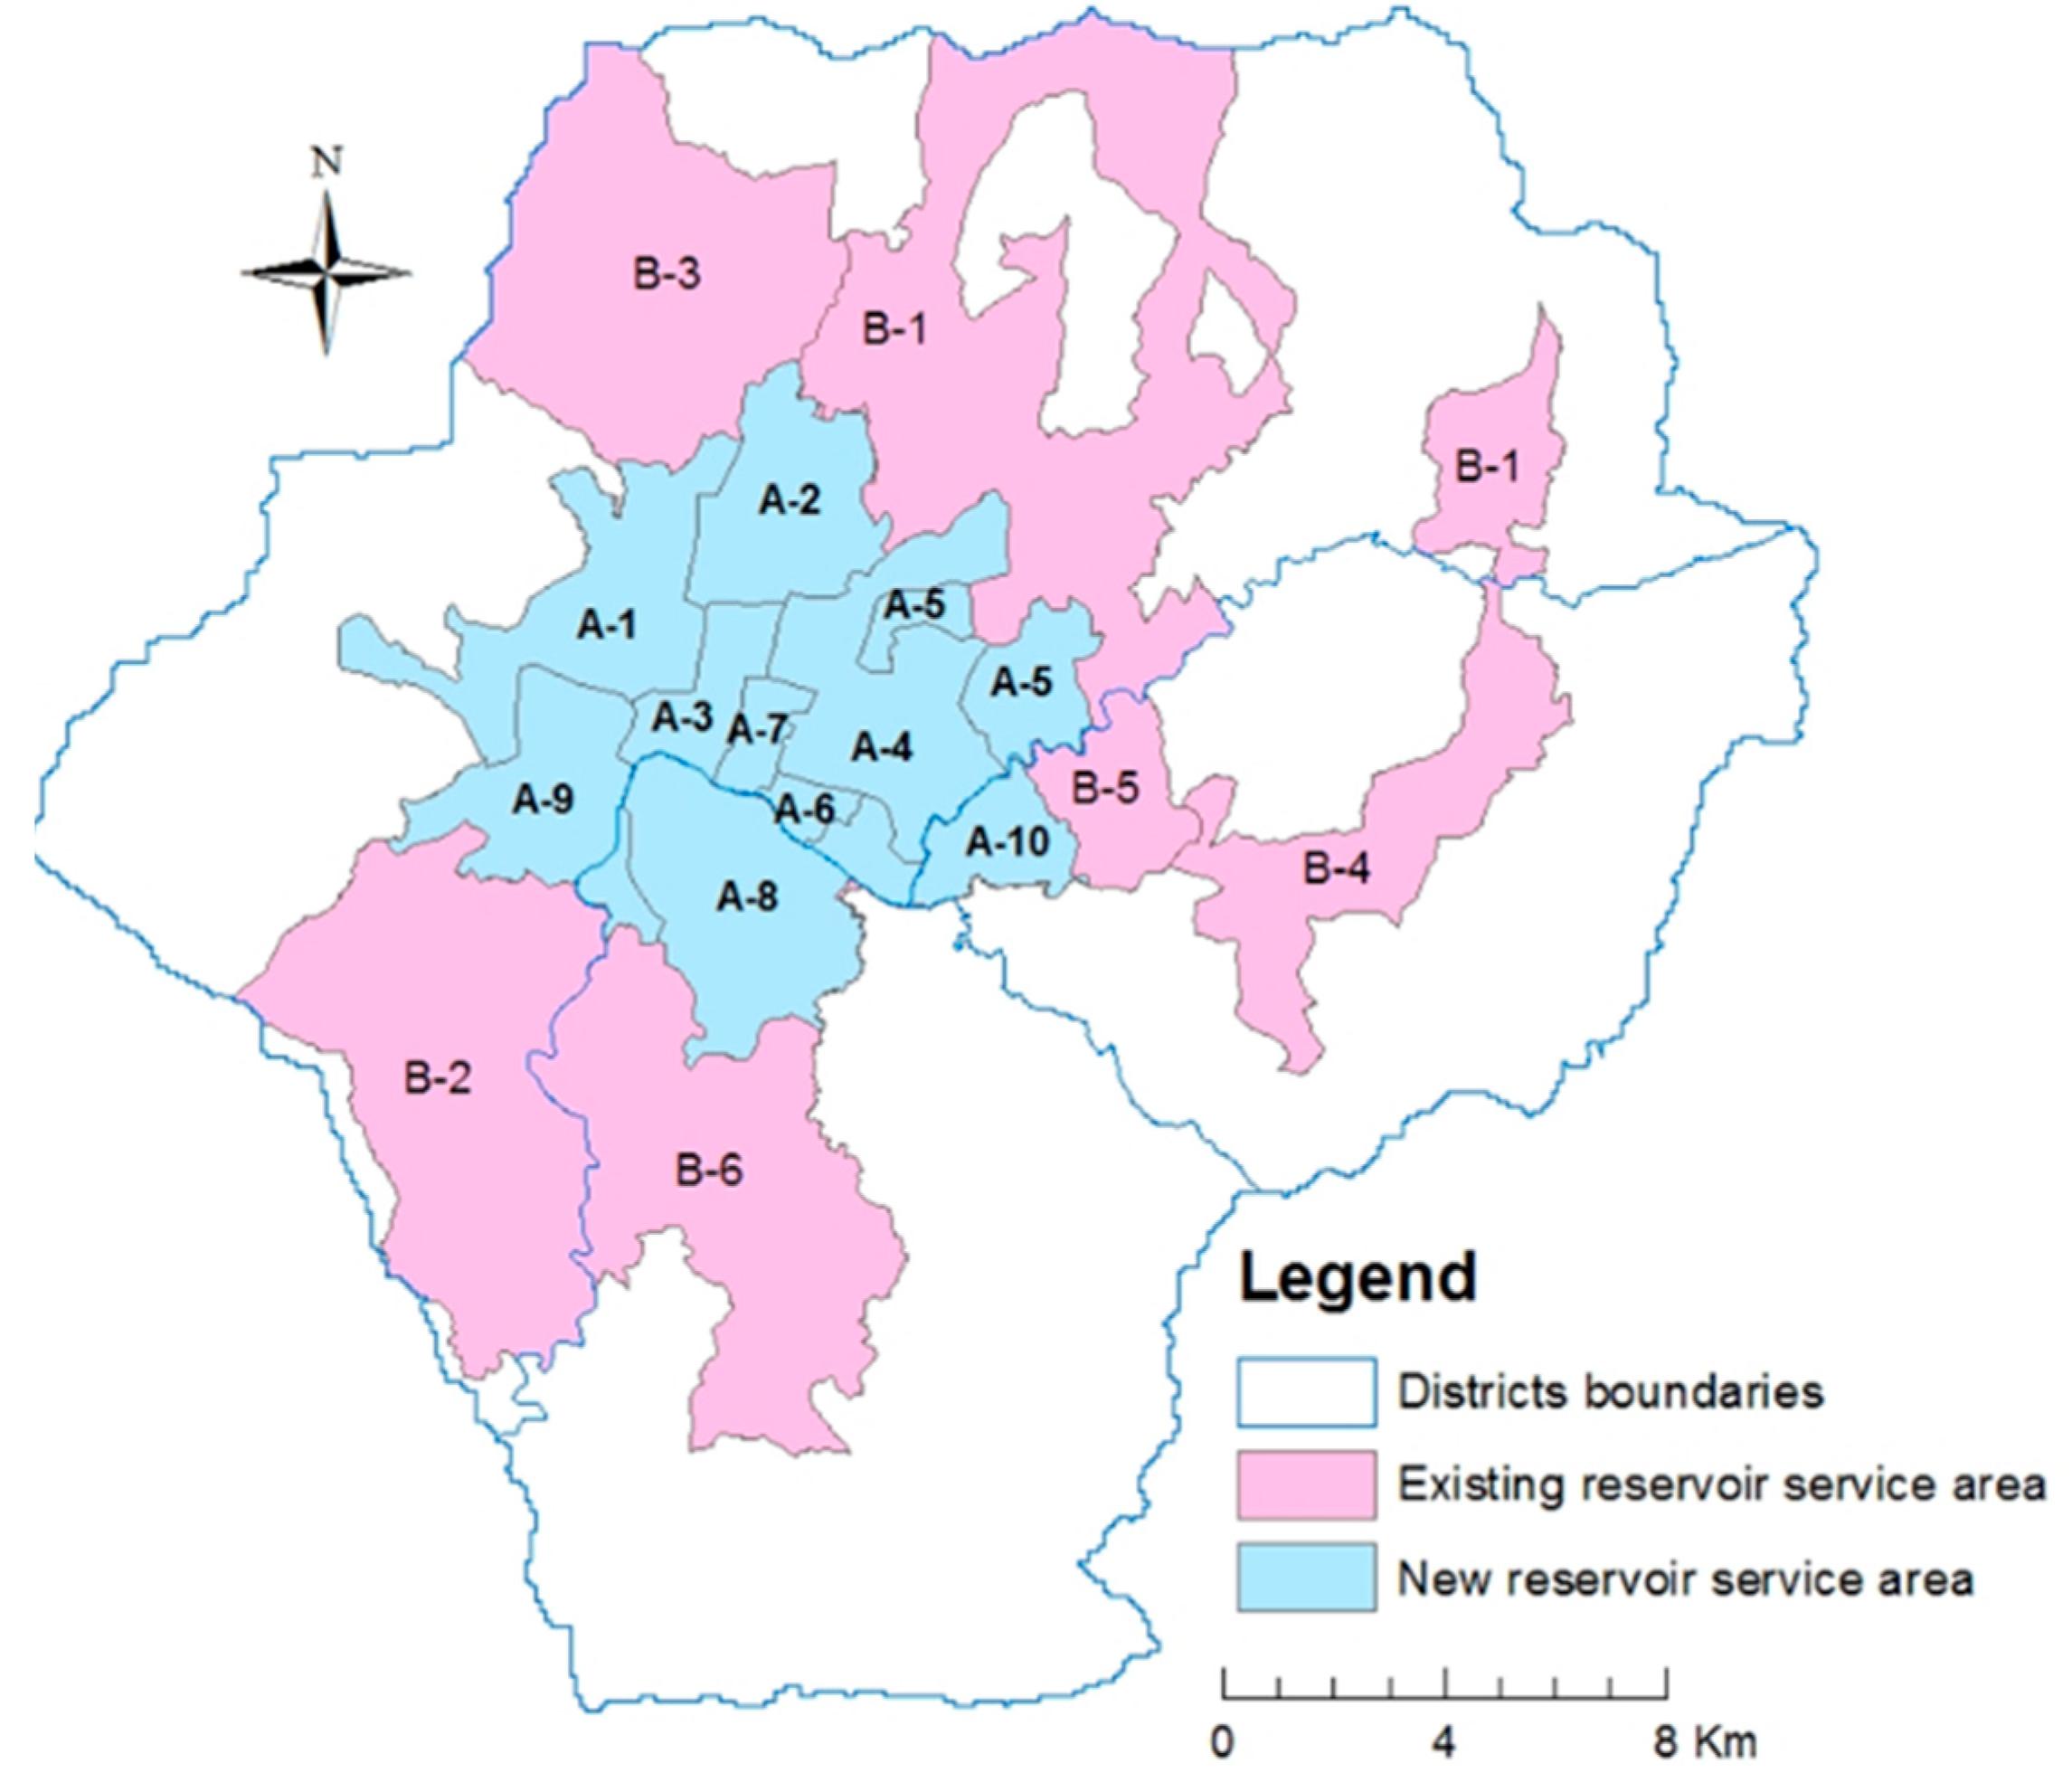
KUKL currently has 10 service areas, depending upon population density and the distribution pipeline. However, after completion of the MWSP, the number of private connections will increase, and therefore KUKL is planning to increase the number of service areas to sixteen (
Figure 1).
Service areas: Mahakalchaur(B-1), Kritipur(B-2), Maharajgunj(B-3), Bhaktapur(B-4), Madhyapur Thimi(B-5), Lalitpur(B-6),Kirtipur North(A-9), Balaju North(A-1), Bansbari North(A-2), Khumaltar North(A-8),Arubari North(A-5), Tigeni North(A-10), Mahakalchaur North (A-4), Anamnagar East(A-7), Minbhawan East (A-6), and Panipokhari East (A-3).
2.2. Methodological Framework for Acceptable Water Price Estimation
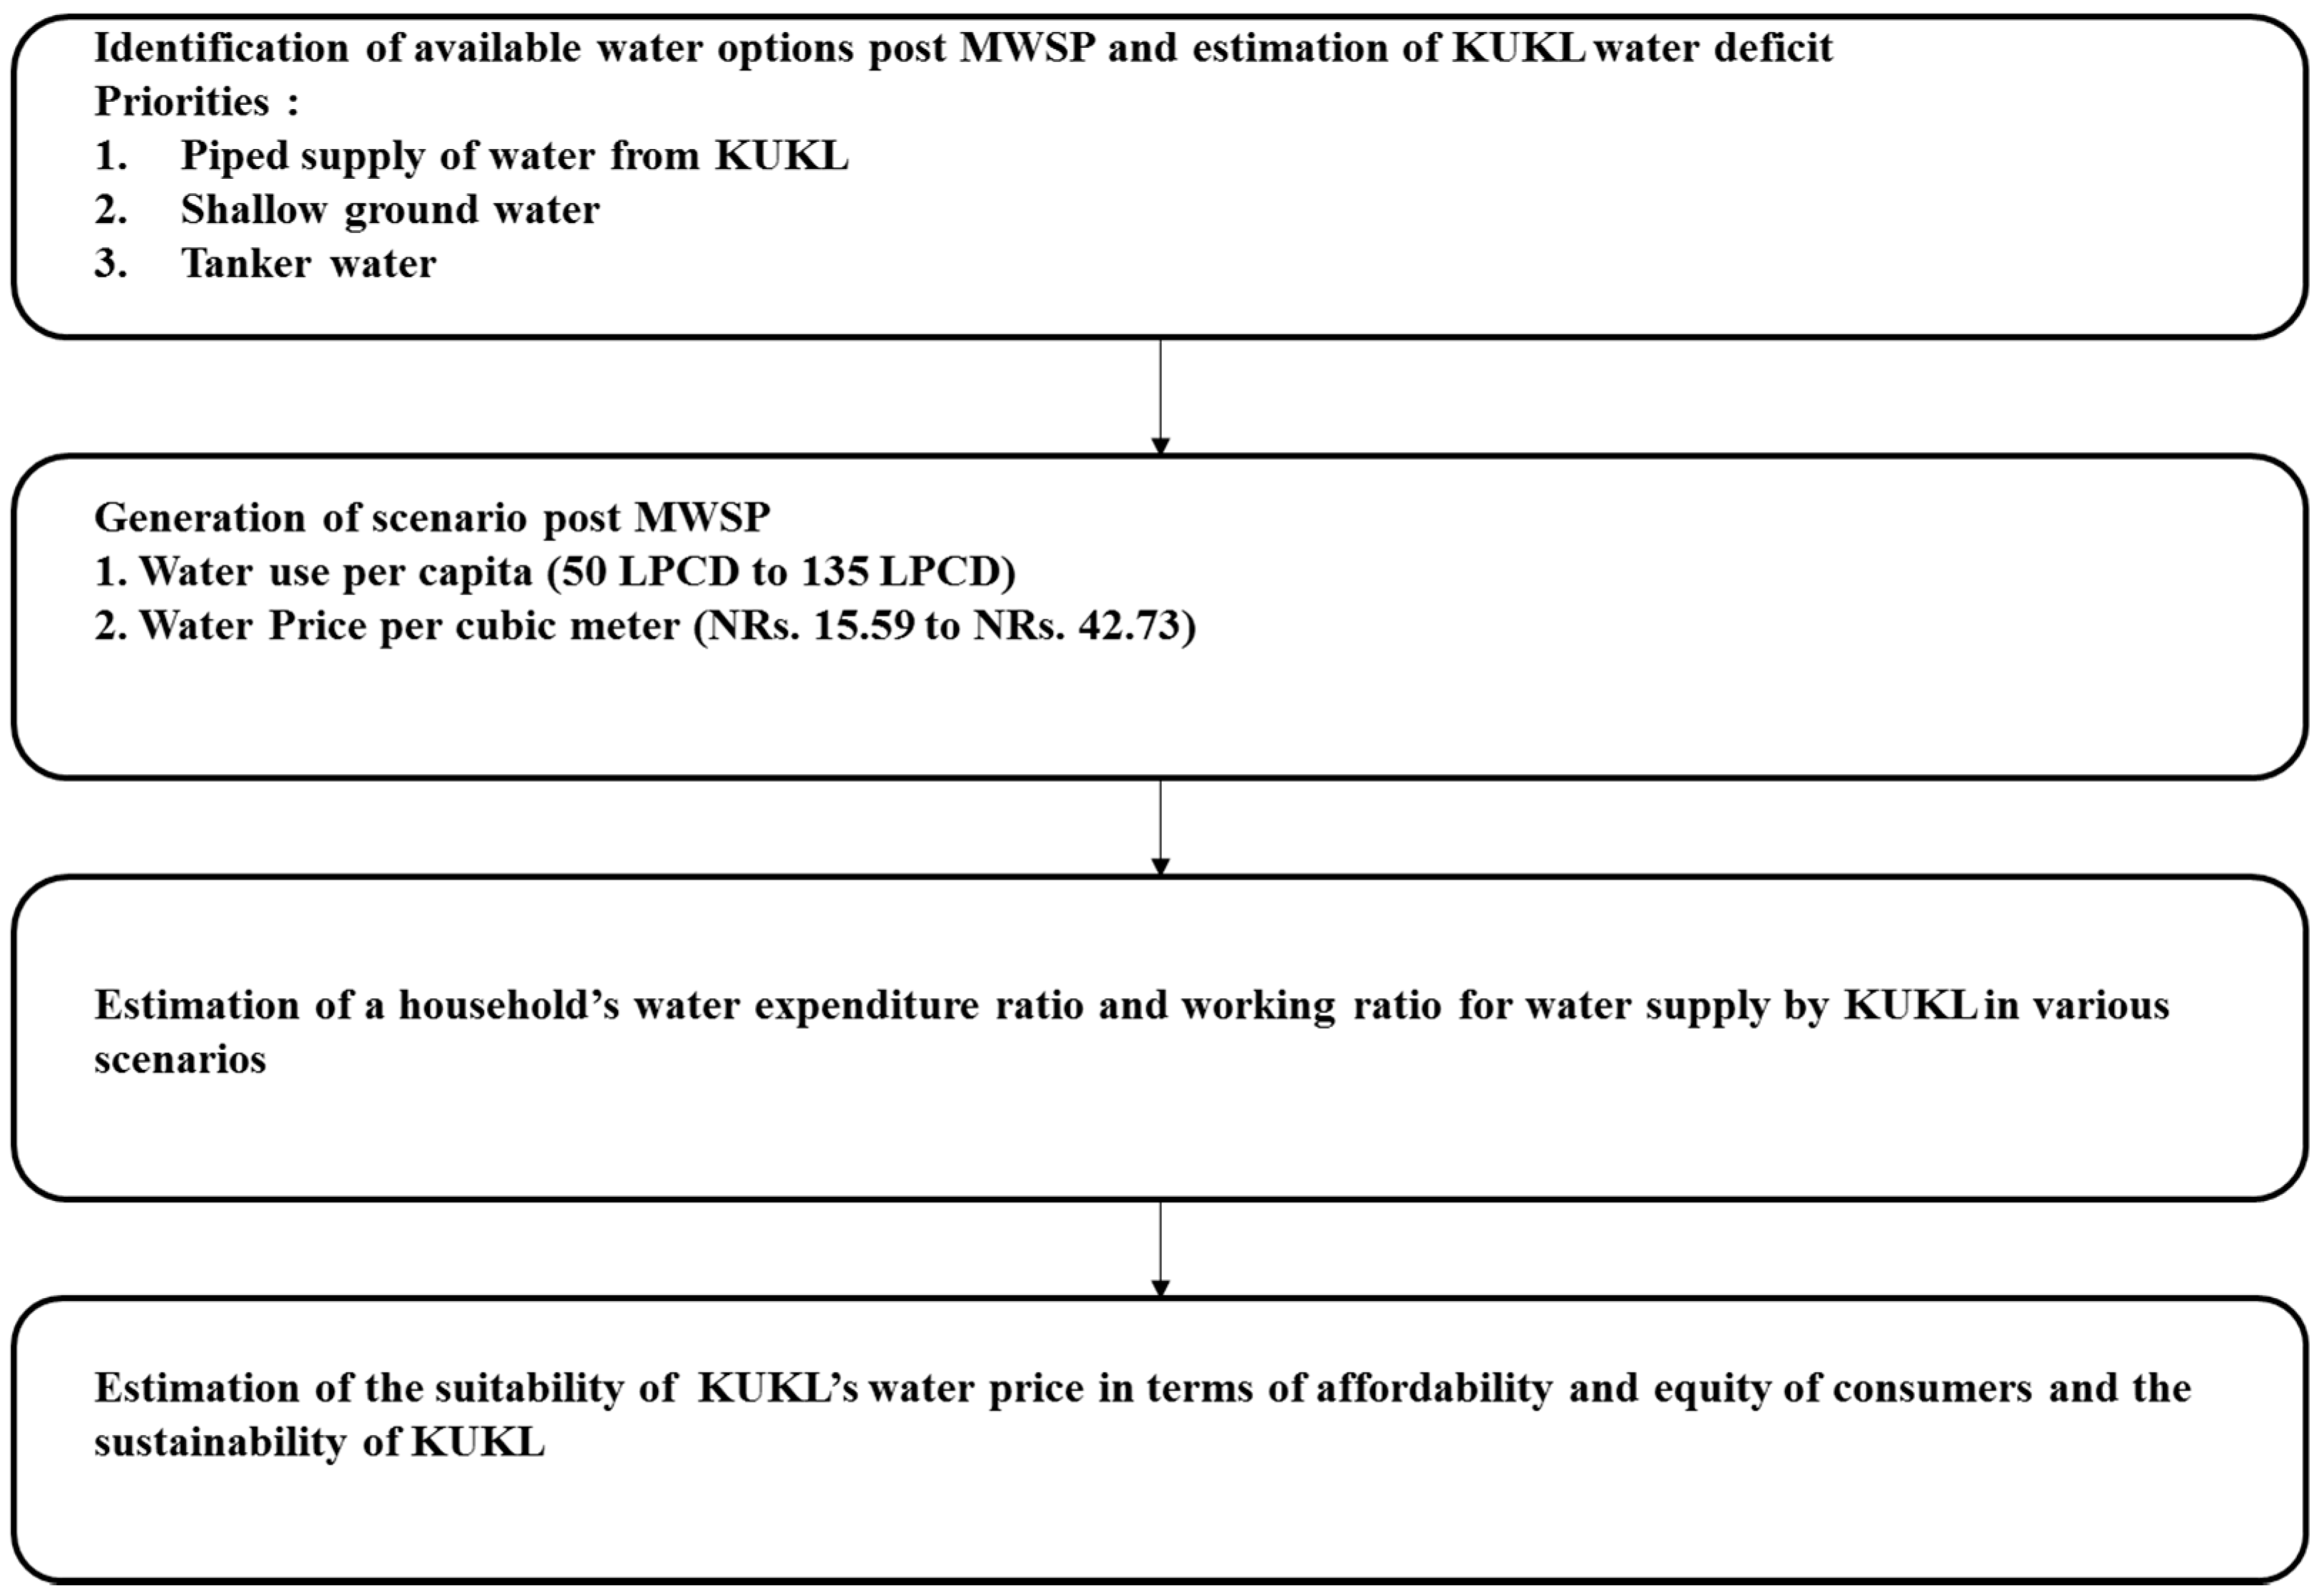
The methodological framework for the study is shown in
Figure 2. We considered piped water as the basic water source and groundwater and tanker water as alternate water sources. We assumed that piped water had first priority. Whereas, groundwater and tanker water were used only when total water use by households was greater than the available piped water supply in each KUKL water service area. Scenarios after the MWSP were generated in terms of household water use in liter per capita per day (LPCD) and water price (NRs./CuM) in service areas. Water expenditure was calculated as the summation of money spent on piped water service and alternative water sources. Ratios of water expenditure to household total expenditure (expenditure ratio: ER) were calculated as indices of affordability and equity. To ascertain the sustainability of the utility, the working ratio (WR), which is the ratio of operating cost to revenue, was calculated. Based upon these estimates, an acceptable plan for household water use and water price was developed, which can promote affordability and equity among the people in all service areas, as well as utilities sustainability.
2.3. Water Use Scenarios and Estimation of Water Deficit
Some scenarios of water use after completion of the MWSP were assumed in order to evaluate the water deficit and use of alternative water sources. Per capita water use (WU) can change with the situation of the people, water accessibility, and affordability. The minimum water use was set at current water use levels, as the system is already under scarcity. However, water use inside some service areas such as Mahakalchaur, Arubari, Tigeni, and Anamnagar is well below 50 LPCD, the basic water supply level [
20], which is considered as the minimum demand to maintain proper health and hygienic condition. Therefore, the minimum water use was assumed to be 50 LPCD in these service areas. Conversely, the maximum water use scenario adopted is 135 LPCD, which is designed per capita water demand of MWSP [
17]. Several scenarios were created between maximum and minimum water use, in which current water use was chosen when the current values were larger than the scenario value.
The deficit was calculated as the difference between water supply and water use in each service area using the following equations.
in which
Ski is water supplied by KUKL for service area
i (CuM/day),
Di is water use of service area
i (CuM/day),
WU is per capita water use of service area
i (CuM/person/day), and
Pi is projected population of service area
i (persons).
The deficit is covered by ground water and tanker water. Ground water is not accessible in all areas. The ratio of ground water use to total alternative water was assumed to be the same as the ground water accessibility factor (ratio of ground water using household to total household) of the service area.
2.4. Index of Utility Sustainability, Consumer’s Affordability, and Equity
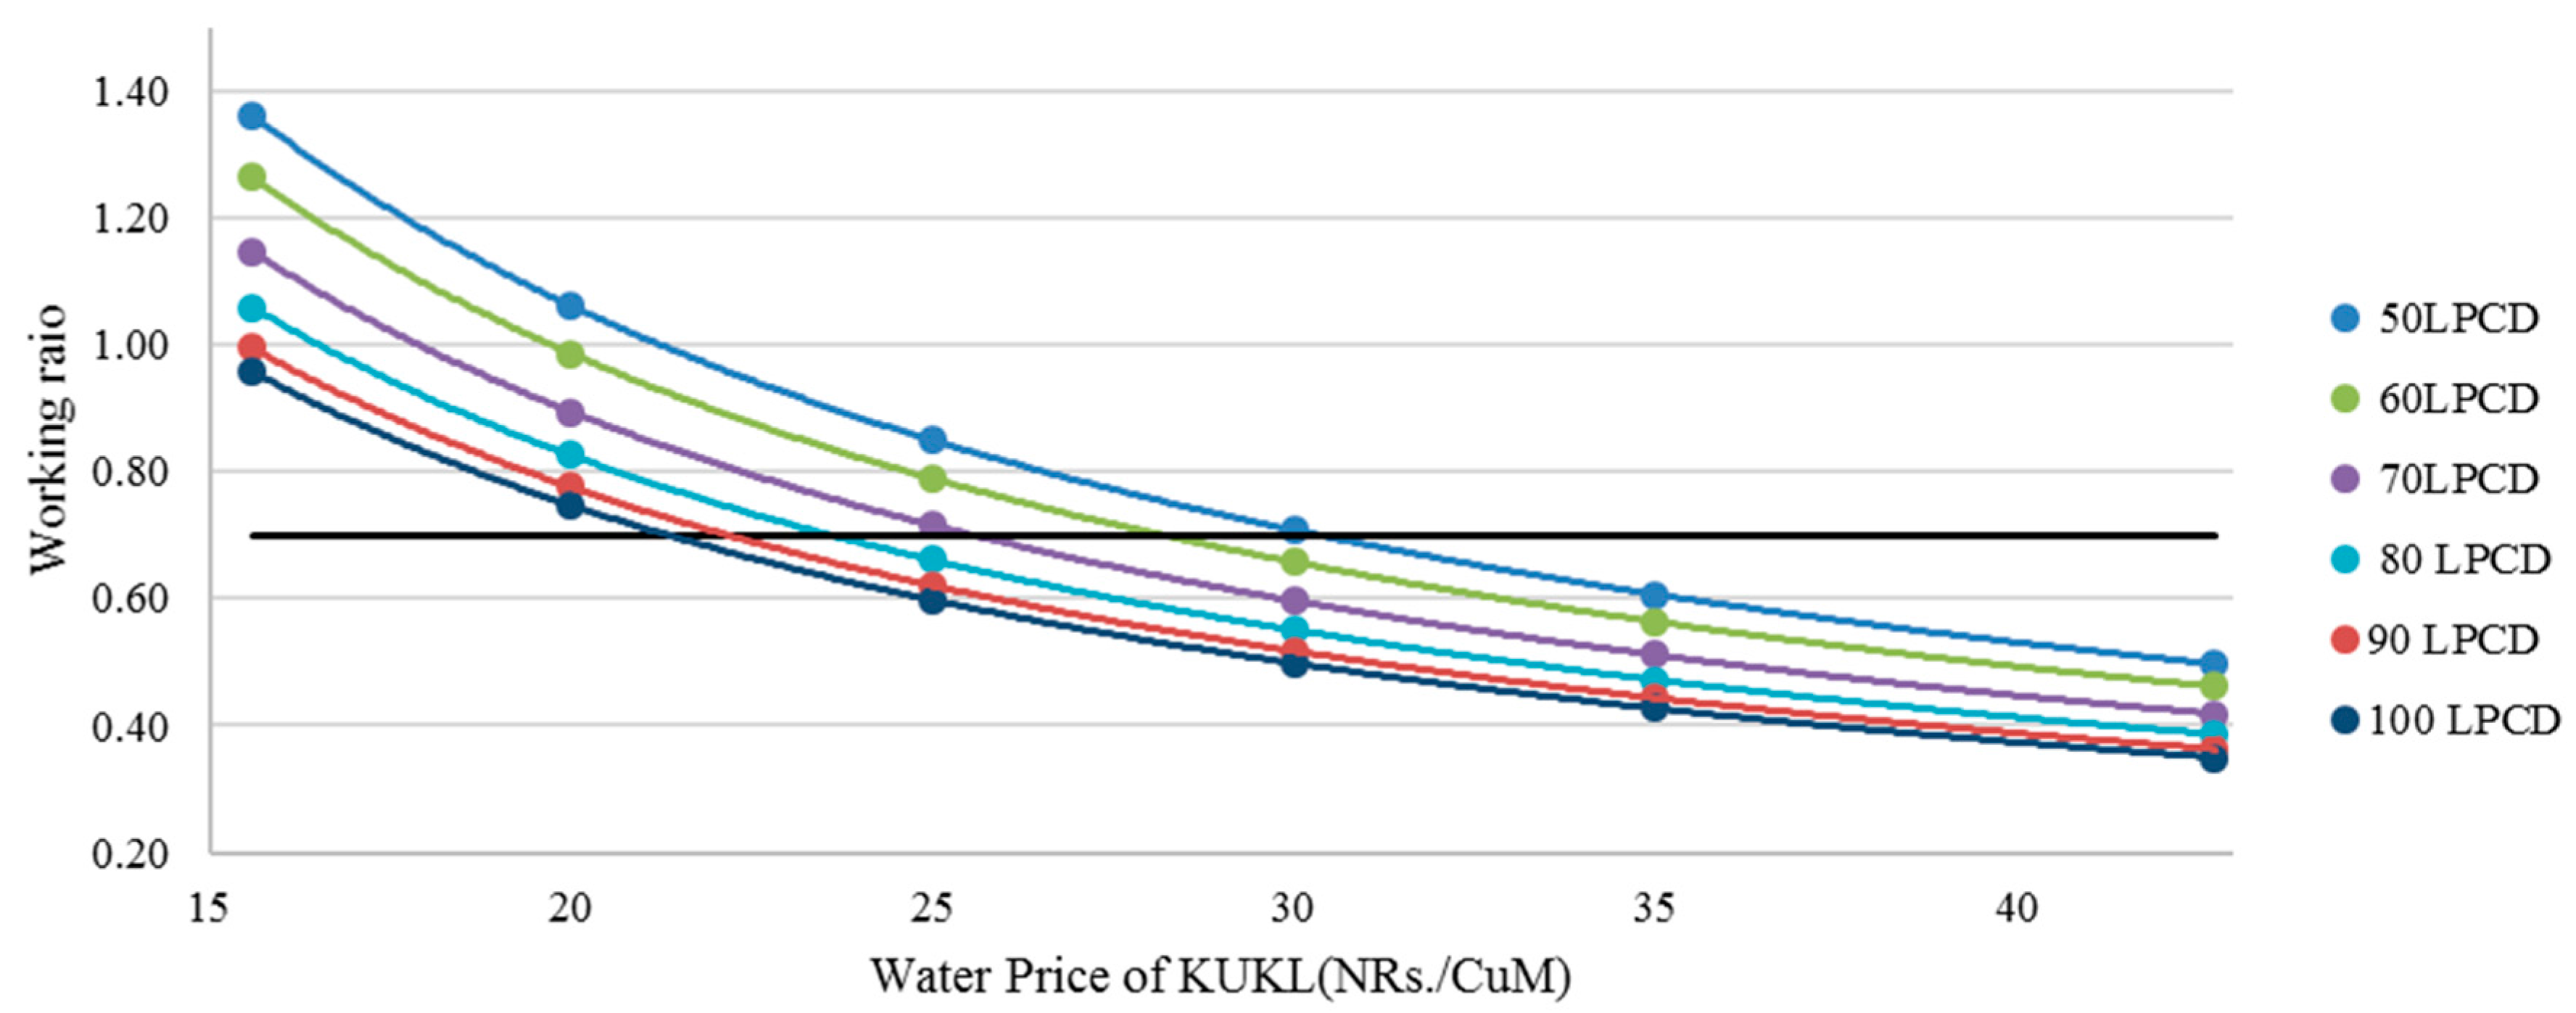
As an indicator of sustainability of water supply by utilities, we used the WR, which is the ratio of operating cost (O) over revenue (R). A WR equal to 0.7 was assumed for a breakeven point in KUKL’s financial sustainability. For sustainable operations, we assumed that WR should be less than 0.7, which is the average of various utilities globally available [
21].
We assumed the current water price (NRs.15.59/CuM) to be minimum volumetric water price after completion of MWSP, whereas the proposed price in the proposal [
19] is more than two times the current price (NRs.42.73/CuM) and was assumed as the maximum water price. However, it is very likely that price of water will be somewhere between these two prices. As an indicator of the sustainability of water supply from utilities, we used the WR. Operating expenses (O) after MWSP completion were adopted from the projection by Asian Development Bank (ADB) [
22] of 1.42 billion NRs. per year.
For the indices of affordability and equity, we calculated the ER of households in each service area. Total water expenditure, the summation of household expenditure on piped water supply by KUKL and alternative water supply, is calculated using Equation (3) through Equation (8):
in which
is expenditure ratio of service area
,
WEi is water expenditure in Service area
i (NRs./HH/Month),
TEi is total expenditure in service area
i (NRs./HH/Month),
KWEi is KUKL’s portion of water expenditure in service area
i (NRs./HH/Month),
AWEi is Alternative water supply’s portion of water expenditure in service area
i (NRs./HH/Month),
HHSki is water supplied by KUKL per household for service area
i (CuM/month),
Tk is water price of KUKL (NRs./CuM),
Tg is unit cost of groundwater (NRs.22.01/CuM),
Tta is Unit cost of tanker water (NRs.264.12/CuM) [
19],
Fgi is groundwater accessibility factor(-),
Ni is number of households in service area
I, and
HHi is household size.
Water expenditure ratio (ERi) of the particular service area i is defined as the ratio of money spent on water by household of service area i (WEi) to total expenditure (TEi), as indicated in Equation (3). WEi is the summation of a household’s expenditure on piped water supply from KUKL (KWEi) and the alternative water supply (AWEi), as indicated in Equation (4), and can be calculated from Equation (5) through Equation (8).
To ensure affordability we assumed that the service area average of ER over the service areas should be below 1%, which is global average of ER available in Baietti et al.’s report [
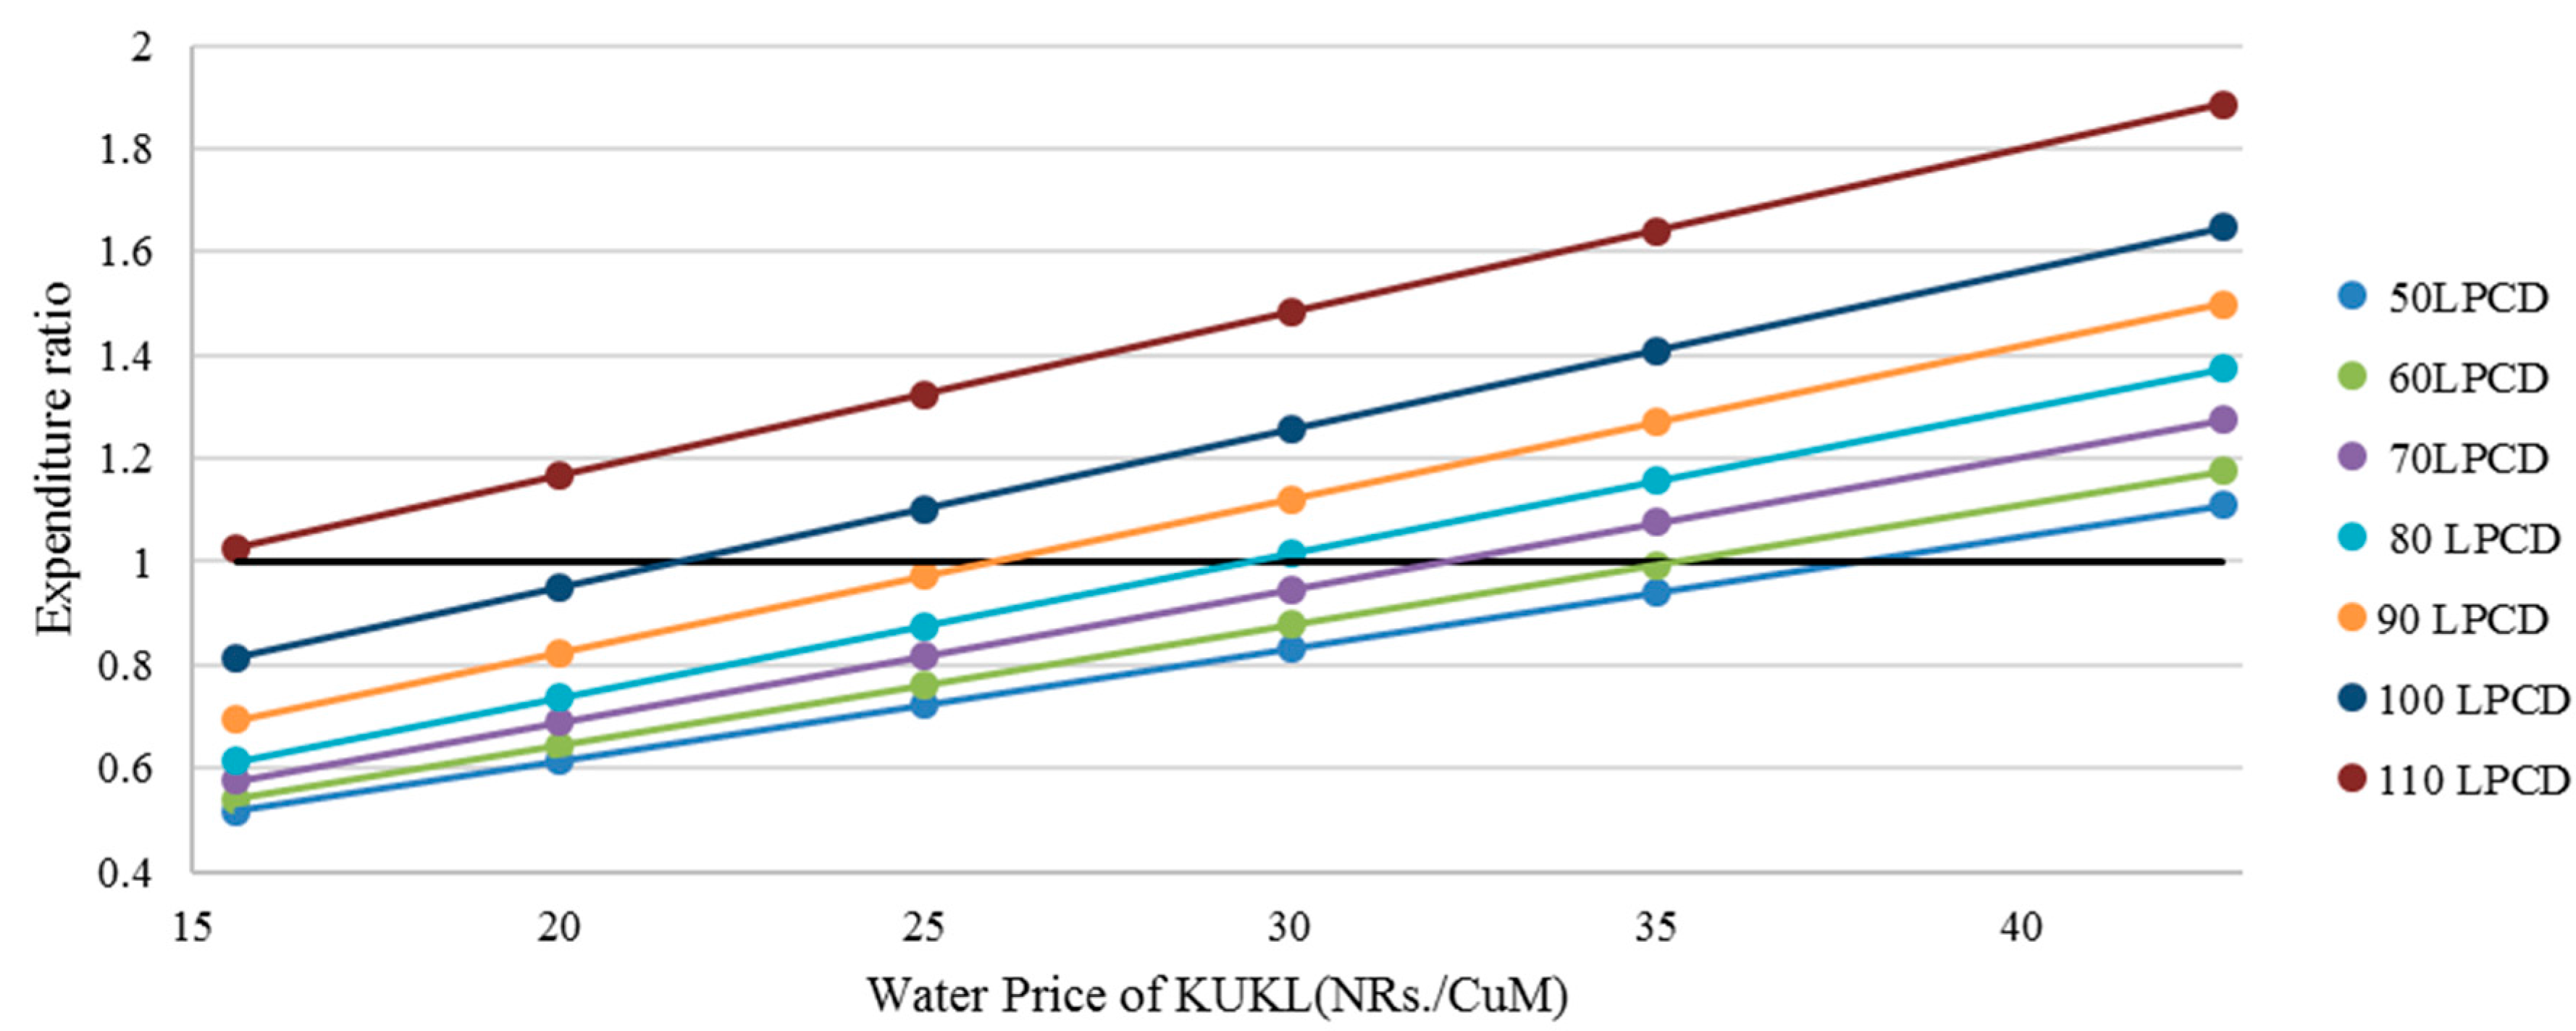
21]. Regarding equity, we also assumed that the standard deviation among service areas should be less than 1%. For each scenario of water use varying from 50 LPCD to 135 LPCD, acceptable water price was estimated on the basis of the criteria of utility sustainability, water affordability, and equity described above.
2.5. Data Source
Household-related information such as water use (
WU), the ratio of households using ground water to total households (
Fgi), total expenditure (
TEi), and water expenditure (
WEi) of the household was taken from surveys conducted by the project “Hydro-microbial approach for water security in Kathmandu Valley”, which was supported by Science and Technology Research Partnerships for Sustainable Development (SATREPS). Details of the survey were reported by Shrestha et al. [
23]. This was a multistage cluster survey. Fifty clusters were selected randomly with the probability proportional to household size sampling technique, and 30 households around each cluster were surveyed. A structured questionnaire was used, which included questions about socio-demographic characteristics, domestic water use behavior, expenditure on water, etc.
Present volumetric cost and proposed volumetric cost of piped water were adopted from the proposal prepared by KUKL [
19]. Volumetric cost of tanker water was adopted from KUKL reports, whereas volumetric cost of shallow ground water was calculated from initial investment cost and operation and maintenance cost during its life period [
24]. The existing and planned water supply data for each service area was taken from the KUKL/MWSP reports [
13] and by personal contact with the office. The ward and Village Development Committee level annual population in 2011 was from Central Bureau of Statistics (CBS) 2011 National Population and housing census, and was projected to 2017. The details of the calculation are mentioned in Thapa et al., 2018 [
25]. Similarly, the household size and the number of households in one building were adopted from CBS data [
26].
4. Discussion
This proposed methodology has focused on SDG indicators of affordability and equity. Willingness to pay has been identified as the fundamental indicator by which water prices are set in most countries and urban places [
5,
27]. However, researchers have also argued that willingness to pay would not be suitable as the sole measure of the consumer’s affordability and water pricing [
27]. Previously, coping costs were also analyzed inside Kathmandu Valley to measure spending behavior in water [
6]. Coping costs, however, were not linked to utilities sustainability. In this situation, analysis on the basis of ER and WR along with their optimization can be a unique way to determine the water price and water use, and hence to maintain affordability, equity, and utilities sustainability. Furthermore, this method can be used in other urban areas to test affordability and equity where consumers are in varying income groups or where new water supply projects are being constructed.
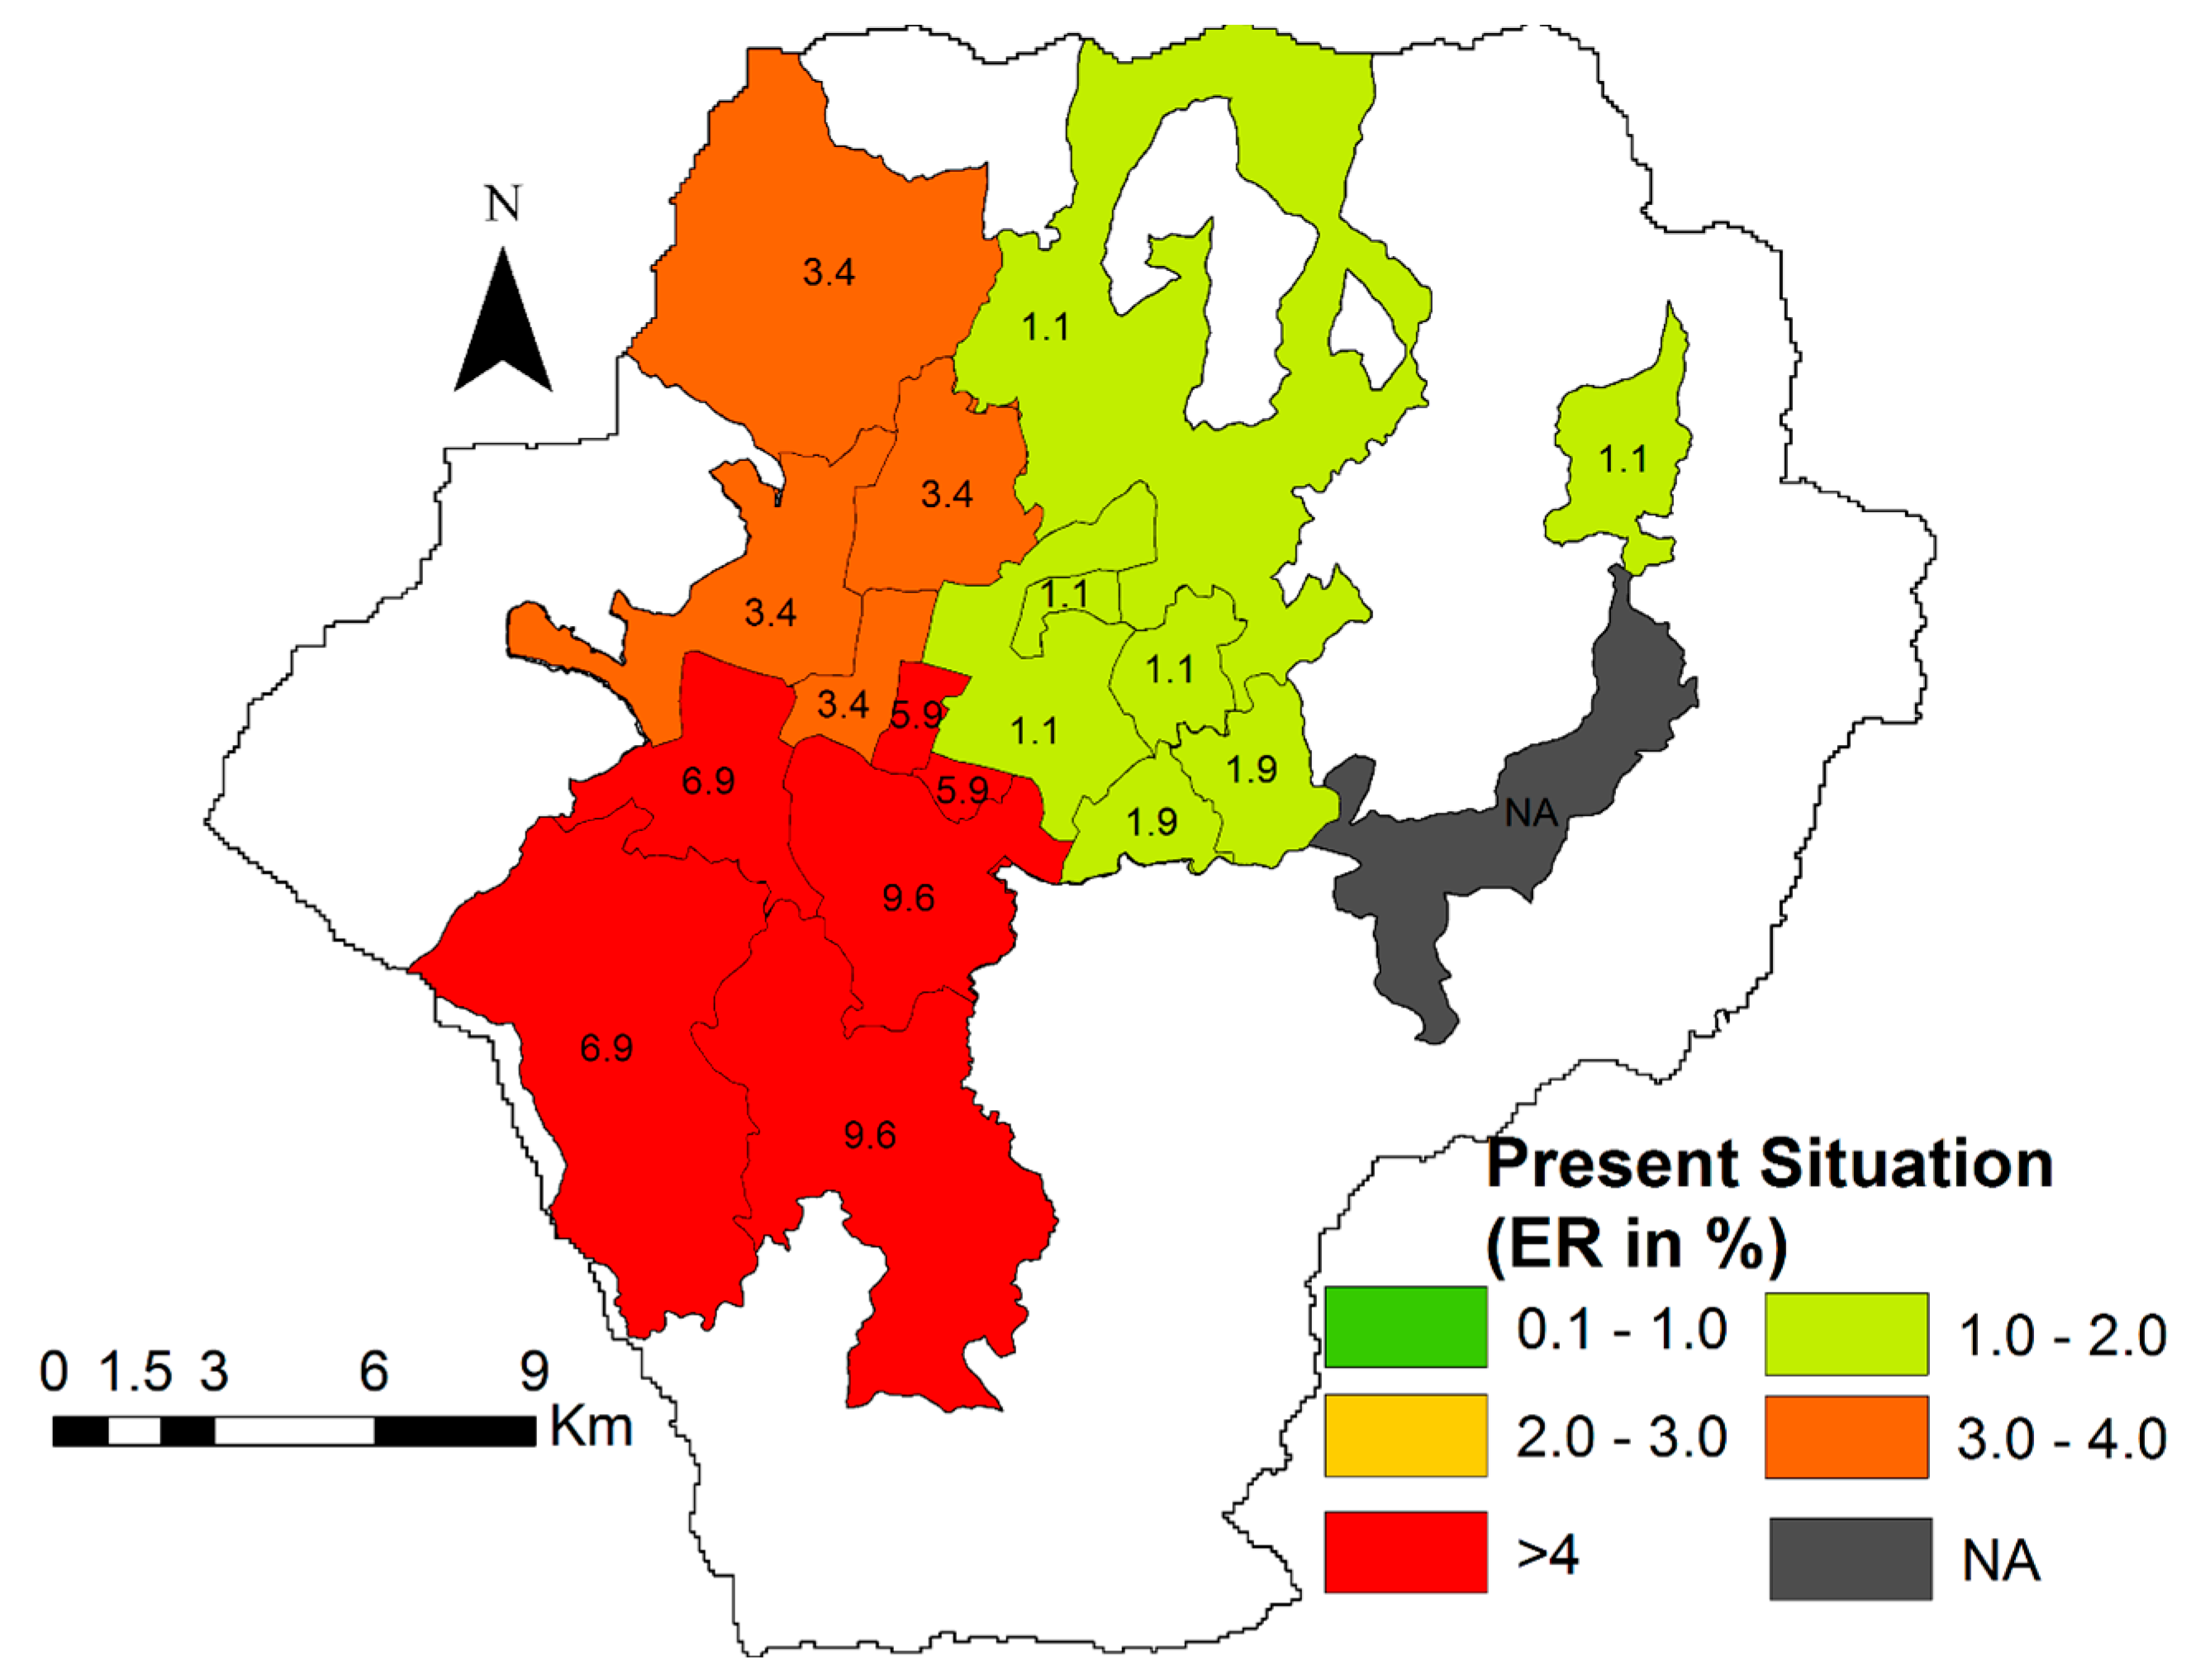
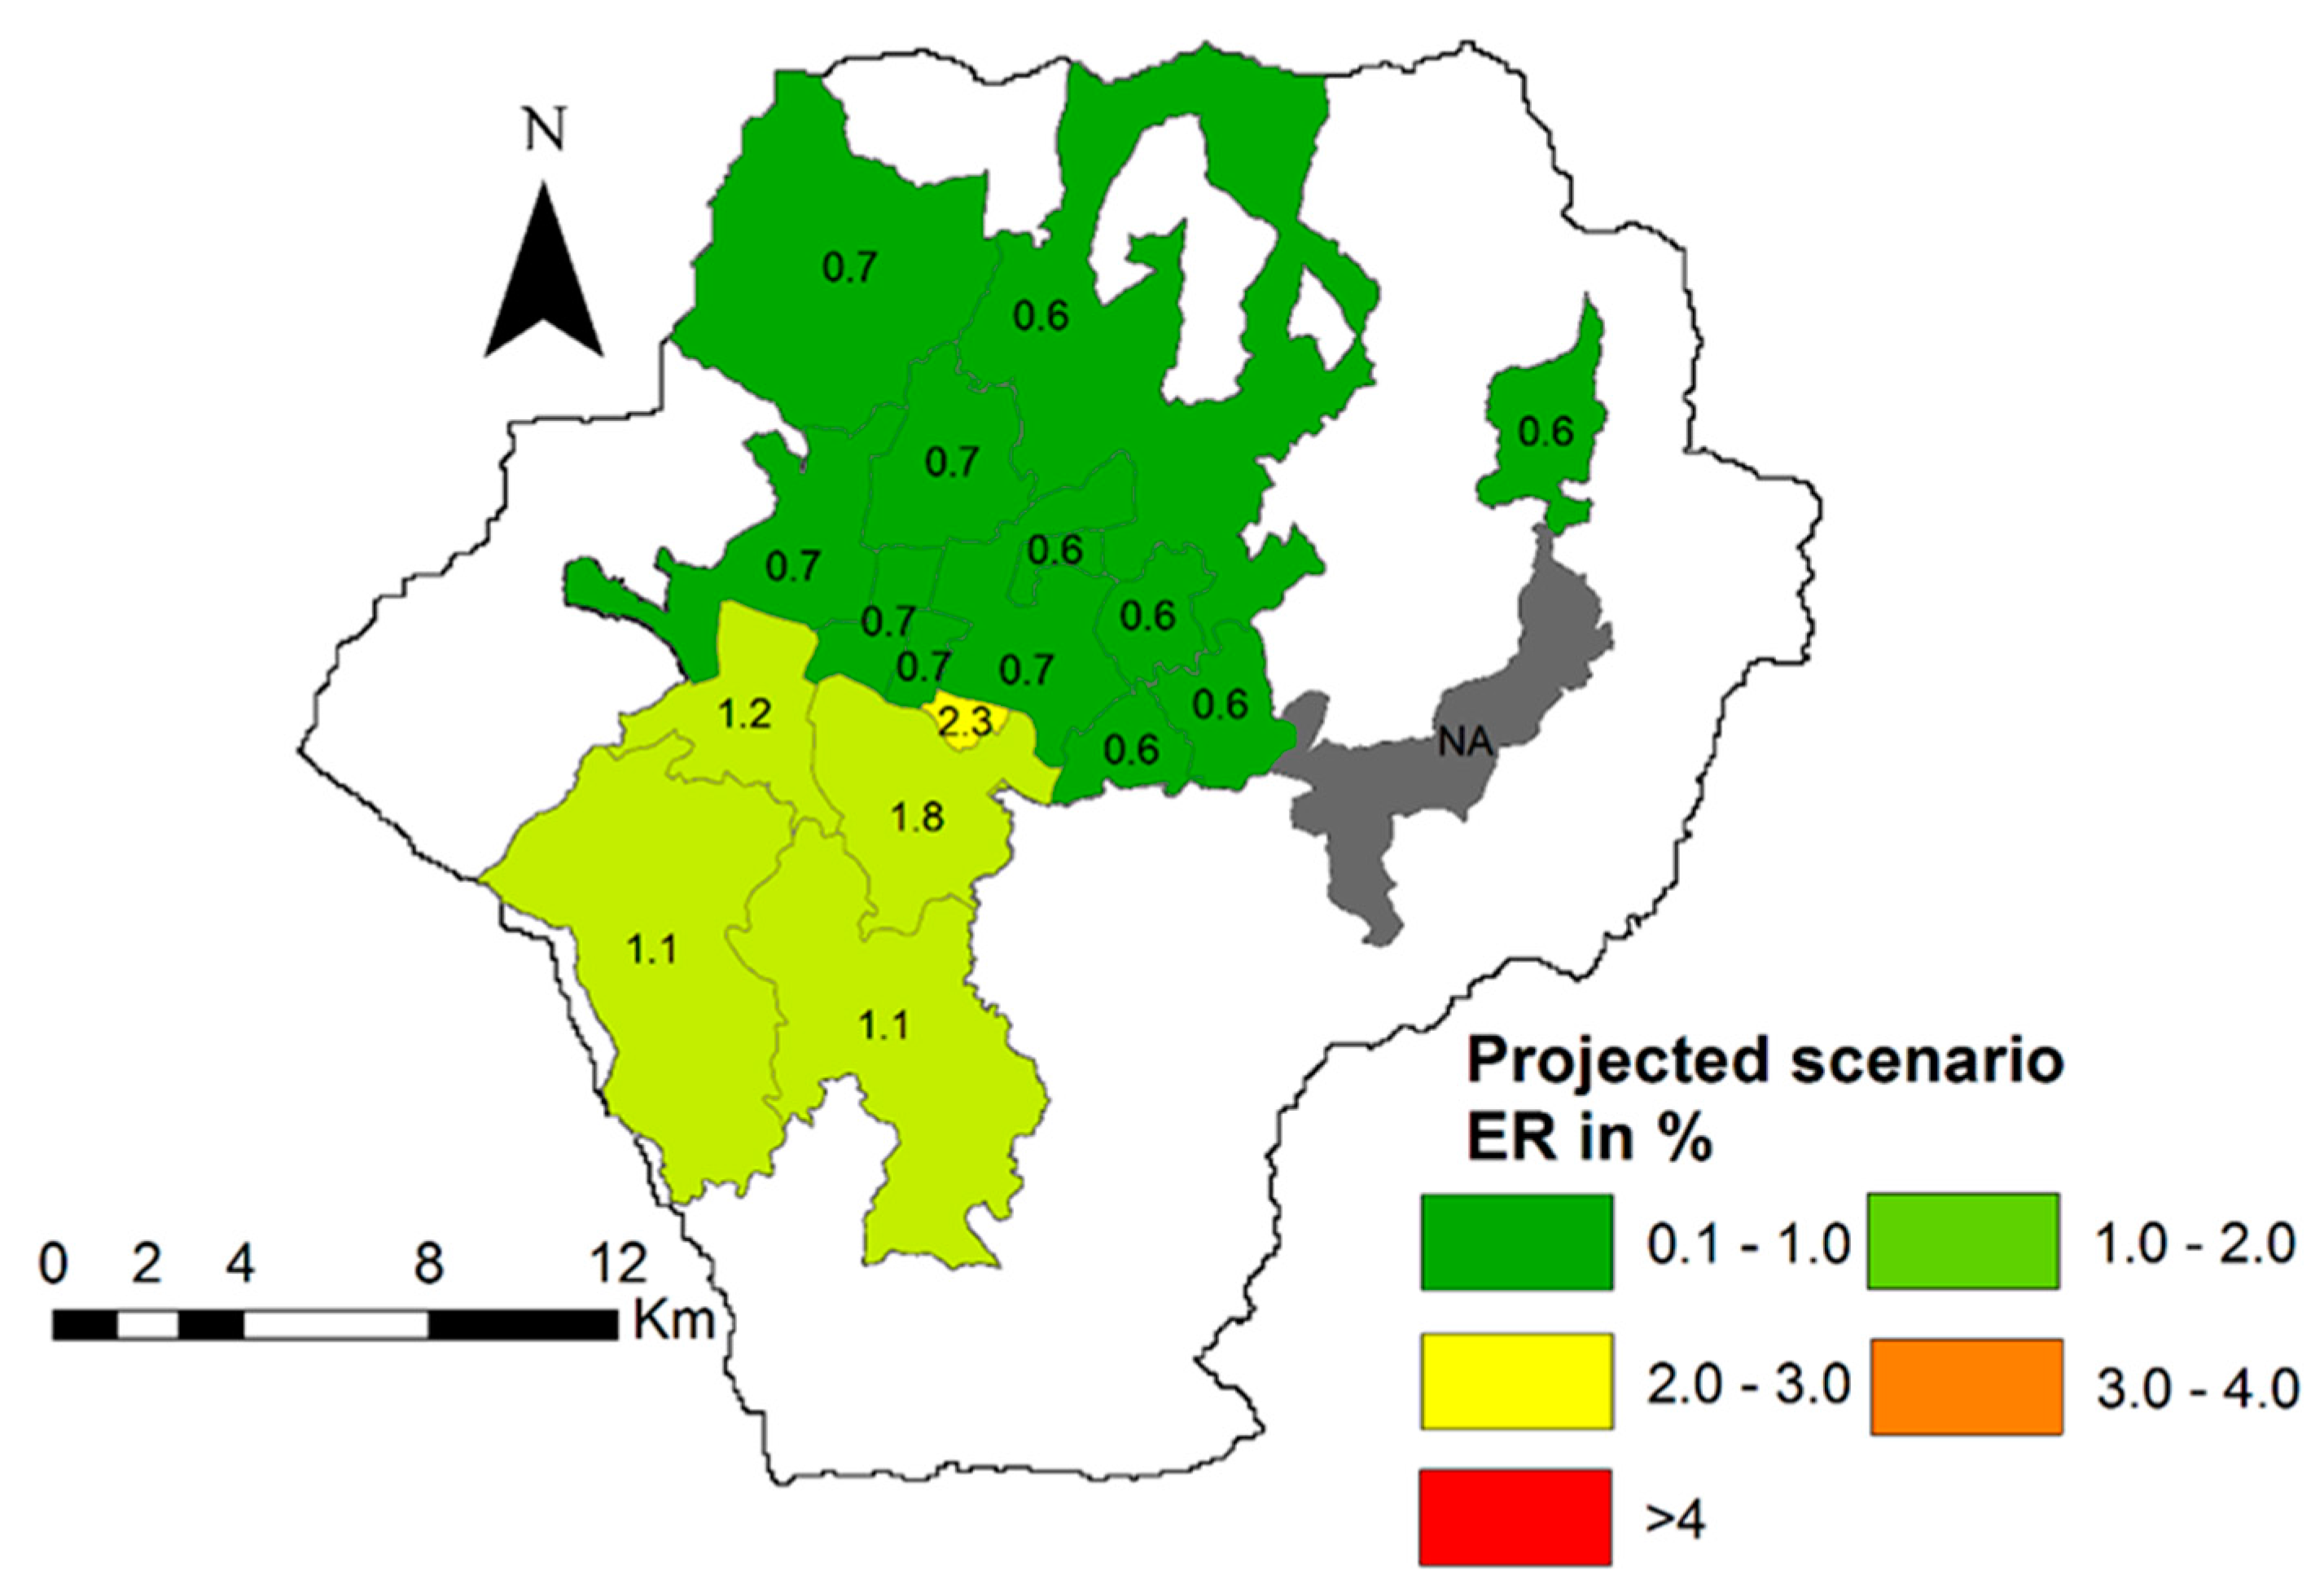
In this research, average ER was used to measure affordability, and standard deviation of ER between the service areas was used to measure equity in this paper. However, the Minbhawan (A-6) service area seemed to be expending more for water services in terms of its ER than other service areas. The markedly higher ER of Minbhawan service area compared with other service areas suggests the possibility of inequality even after the MWSP. The reallocation of KUKL’s water supply seems to be one of the options available for ensuring basic water service and controlling water expenditure as well. It also shows that, along with ER and WR, there are other factors that have affected water price and water use as described below.
4.1. Household Water Use and Effect of Minimum Volume in Water Price
KUKL has allotted minimum 10 CuM volume of water for one connection to set the minimum price [
13]. In Kathmandu Valley, one building has one connection. The average number of people living in one building is 10, 7, and 6 in the Kathmandu, Lalitpur, and Bhaktapur districts, respectively [
26]. Hence, to ensure equitable access to water for each household, the volume of minimum water requirement must be different for each district. If we assume 50 LPCD is the basic requirement [
20], it would be approximately 15 CuM, 11 CuM, and 10 CuM per building per month for Kathmandu, Lalitpur, and Bhaktapur, respectively. This means the first block of allotted water (10 CuM) will not be enough in Kathmandu and Lalitpur to maintain even the basic service level. Research shows that the lower block is meant to provide the basic service to everyone [
10]. Therefore, to facilitate the basic service level, Kathmandu’s minimum per building allotment needs to increase by at least 50%, whereas in Lalitpur an increment of 10% would be enough. Similarly, achieving the minimum use of 80 LPCD as the first block of KUKL should be able to satisfy the demand of approximately 24 CuM/month, 18 CuM/month, and 16 CuM/month in Kathmandu, Lalitpur, and Bhaktapur, respectively. This is higher than recent lower block of IBT inside Kathmandu Valley.
Although water price is not the sole contributor of sustainability to water resources, small changes in price can facilitate the sustainable and equitable distribution of water resources along with good monitoring of consumers’ behavior from the utility. This is especially relevant in developing countries, where economic conditions and therefore water price must maximize the efficient allocation of this resource, bring the sufficient revenue, produce net revenue stability, and promote resource conservation [
7]. It is difficult to maintain equity through price alone from IBT, as in the case of KUKL. Promoting equity consideration plays roles in IBT use, with lower blocks being able to fulfill the basic demand [
10]. However, IBT fails to capture the spatial variation of basic demand per connection. Dahan and Nisan have argued that IBT structure forces larger households to pay a higher average price for water. The methodology used in this article has identified the price in volumetric consumption. Spatial analysis of consumer’s water use behavior and the number of people per connection can help the utility to understand demand and manage the water price accordingly. Spatial variation in the lower block can counter the problem in equitable distribution.
4.2. Ground Water Accessibility
Ground water accessibility may decrease expenditure inequality, as the tanker water is more expensive than groundwater. People from Lalitpur and Khumaltar have a 9% ER in current conditions because of lack of access to ground water. Only 59% of the population has access to ground water in those service areas [
16]. On the other hand, in Tigeni, despite the alarming figure of 49% access to ground water services, ER is well below 1% mainly due to less water consumption. Despite using less money, consumption below 50 LPCD is not suitable, because people are living under water scarcity and are vulnerable in terms of hygienic practices. Ground water consumption, despite being unsuitable from ground water environment’s perspective [
28,
29], is helping to maintain the ER and hence affordability in Kathmandu’s case. However, in the long run, when the MWSP ensures basic water demand, ground water needs to be regulated economically for proper demand management and to reach proposed scenario noted above.
It was difficult to measure the heterogeneous behavior of consumers inside the same service area, as the service areas are considered as lowest unit of measurement in this research. Additionally, for simplification of the equations, it was assumed that the household size and household per building would remain the same during the time span. Similarly, the capital recovery of MWSP has not been considered in the calculations of ER.
5. Conclusions
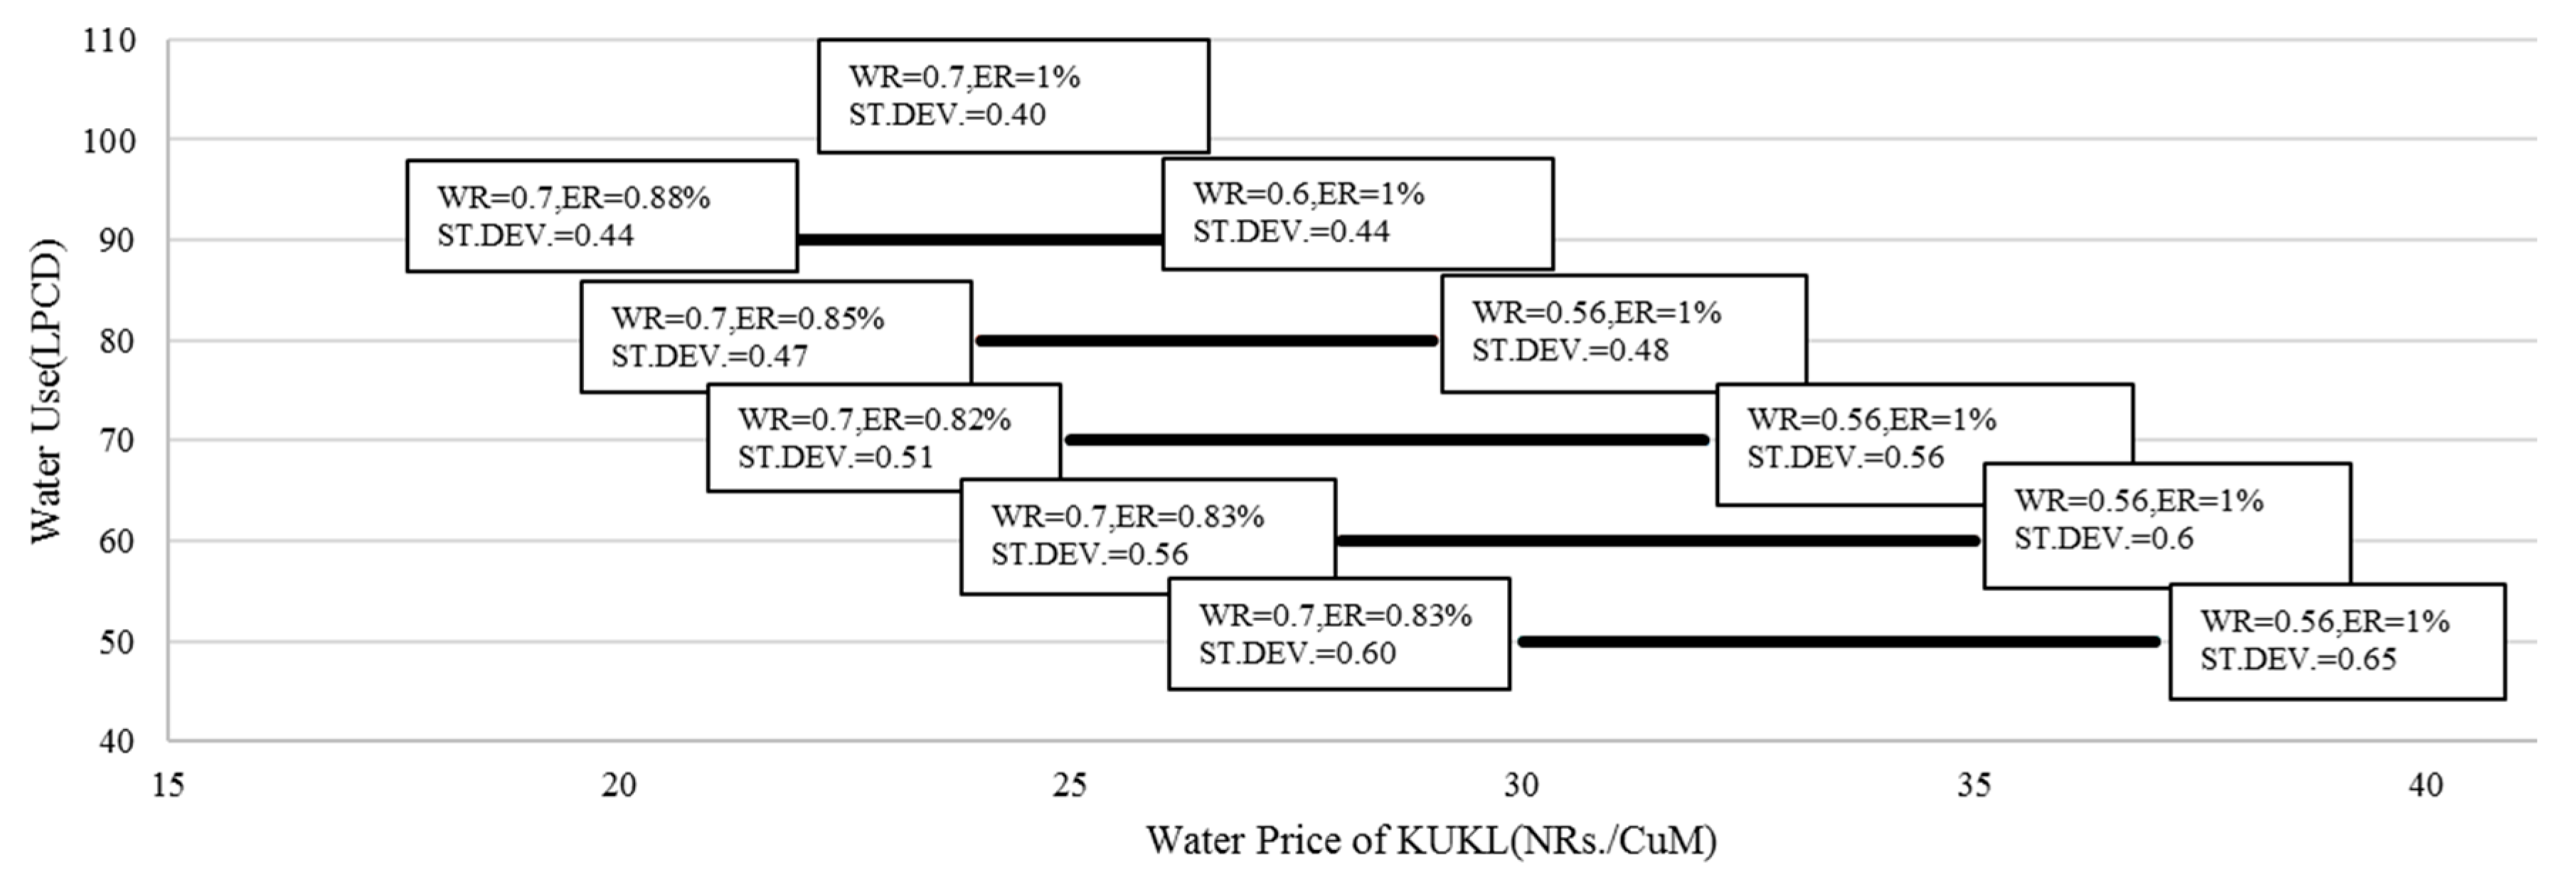
The first phase of MWSP is going to improve consumers, utility, and the environment’s recent state markedly. The results of this study show proper the water distribution mechanism and the water price are going to play critical roles in improving the indicators such as ER and WR that are critical for water affordability, equity, and utilities sustainability. The relationship between these parameters can be used to fix the price and water use. The water price should be adjusted in such a way that it promotes 80 LPCD and more research on IBT, and ground water accessibility would be needed inside Kathmandu Valley for the promotion of 80 LPCD. However, 135 LPCD is difficult to distribute in first phase; this can be regulated by enforcing the higher price on per unit consumption above mandatory minimum volume consumption. There is a threat of unequal water expenditure and ground water exploitation if alternative water is still used. During the scenario analysis, it was observed that 80 LPCD with a price of NRs.24/CuM can reduce the inequality of the distribution of water resources in terms of pricing along with WR = 0.7 for KUKL. Furthermore, the methodology suggests that water use can be controlled to some extent by the proper water price system with the help of consumer’s survey. It is necessary for a water utility service to identify consumer water use behavior in a regular period and reallocate water accordingly.
The water supply in developing countries should be sustained on the three pillars of water use behavior, environmental sustainability, and utilities sustainability. Proper monitoring of consumer’s water use with a focus on demand management and utilities sustainability while keeping water price as an instrument to achieve equity in water supply services can facilitate success in achieving SDG. A closer examination of ER and WR can help promote the equity and affordability, and therefore increase sustainability.


 ,
, 


