Runoff Dynamics and Associated Multi-Scale Responses to Climate Changes in the Middle Reach of the Yarlung Zangbo River Basin, China


Abstract
:1. Introduction
2. Materials and Methodology
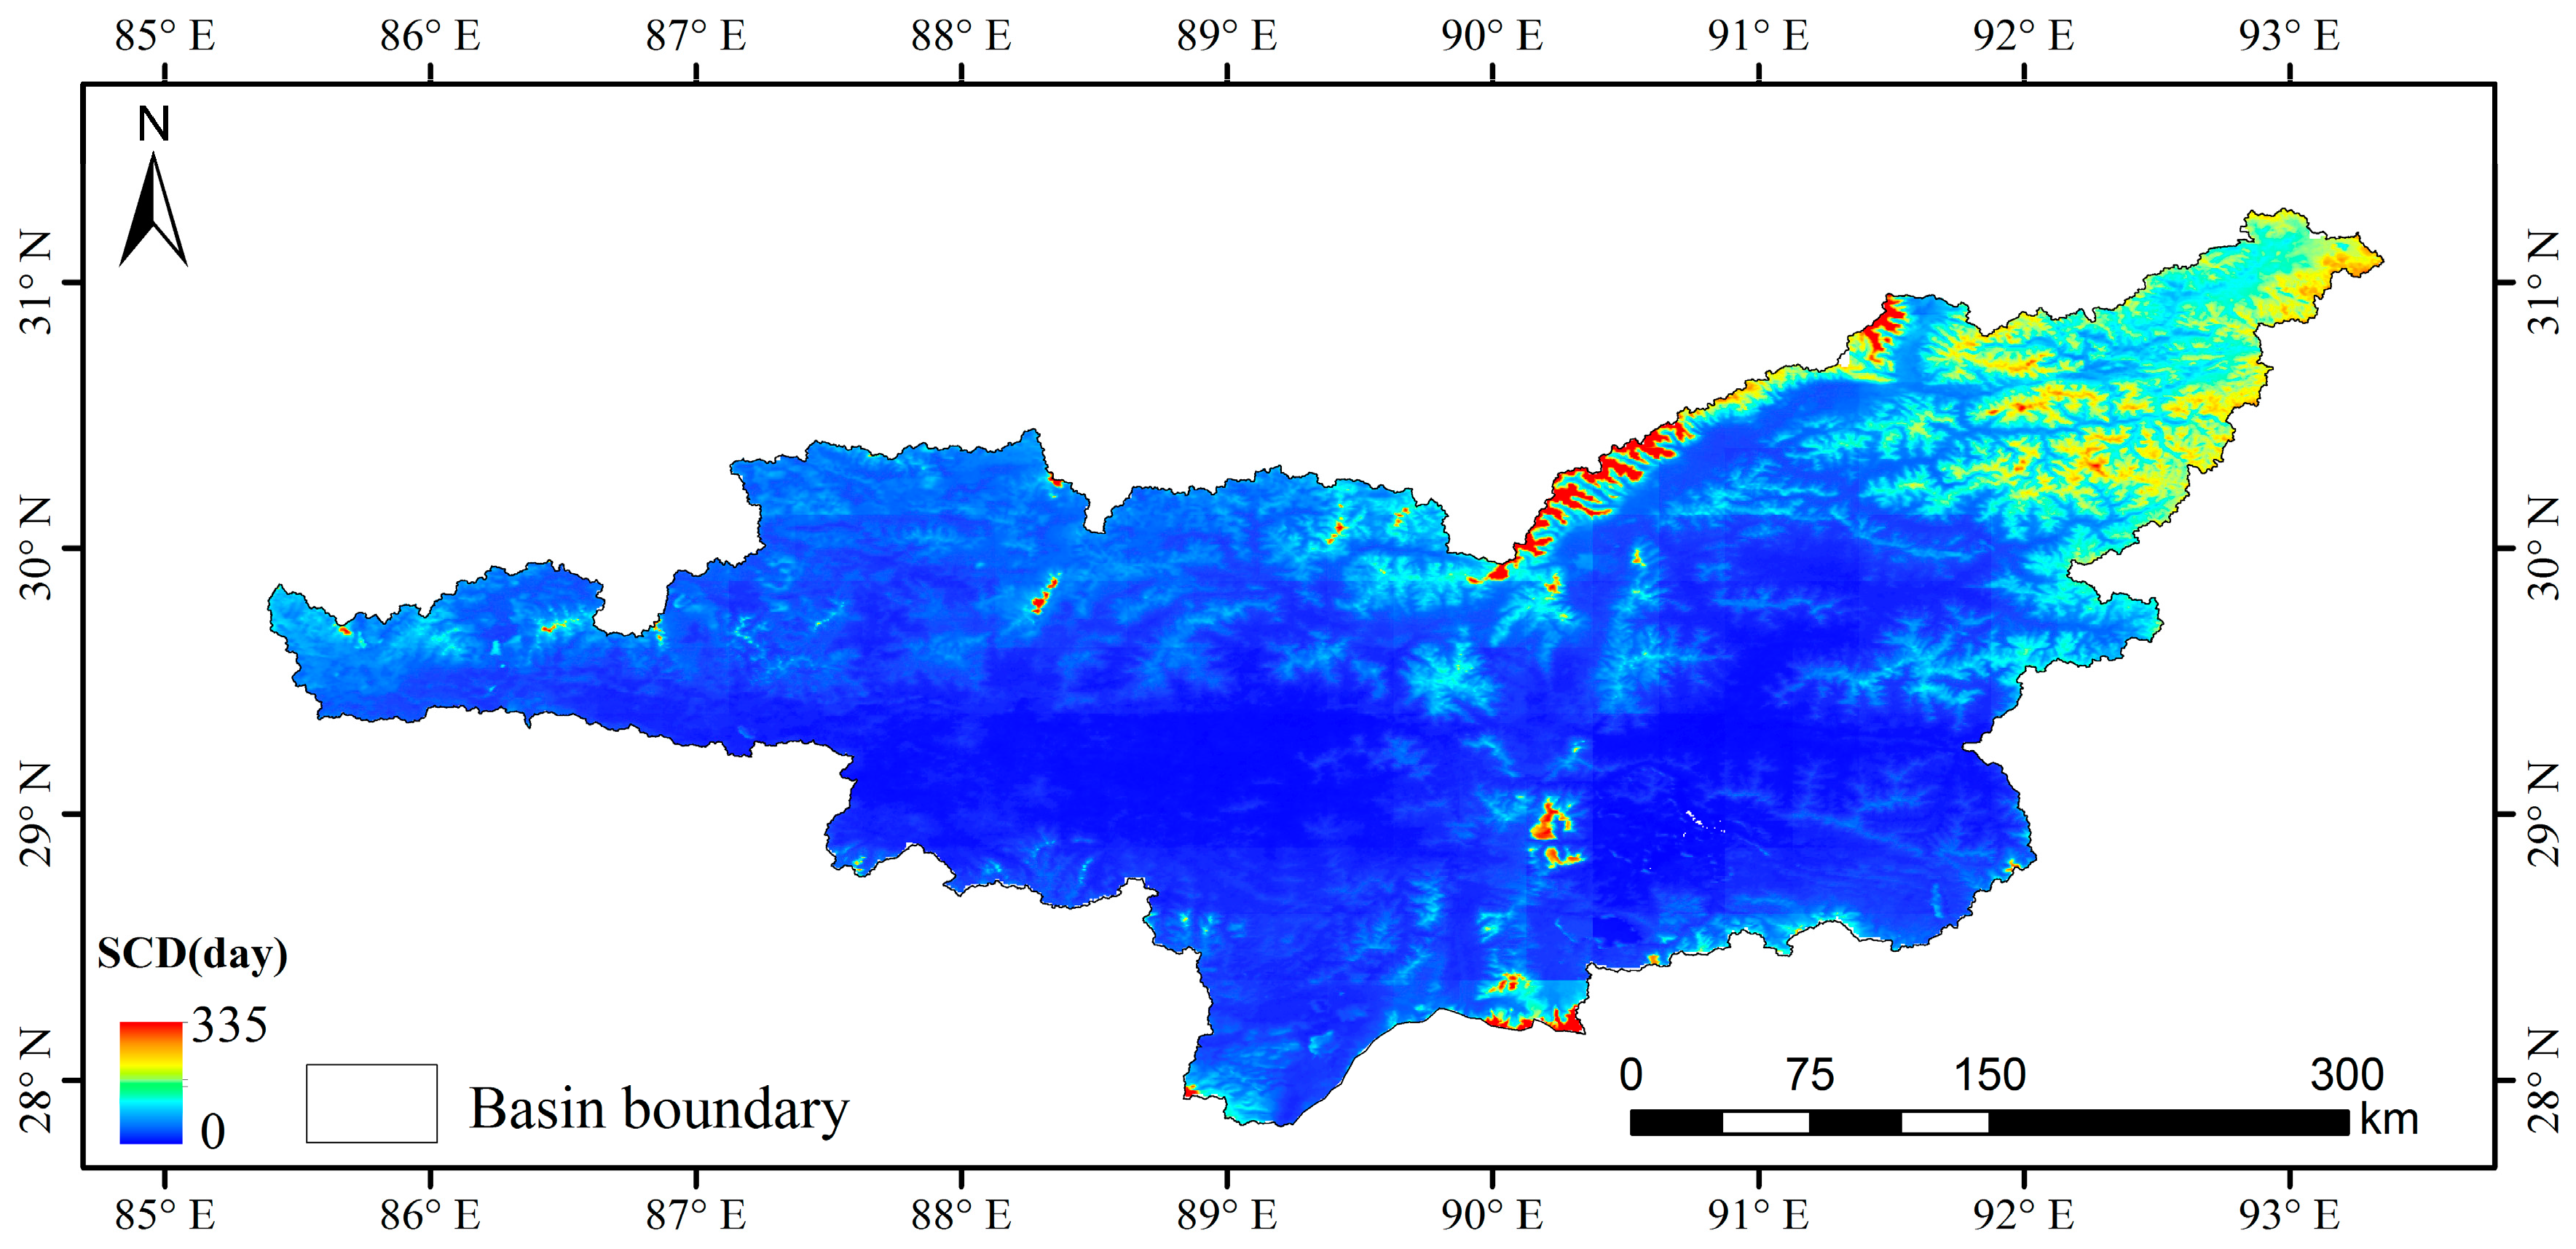
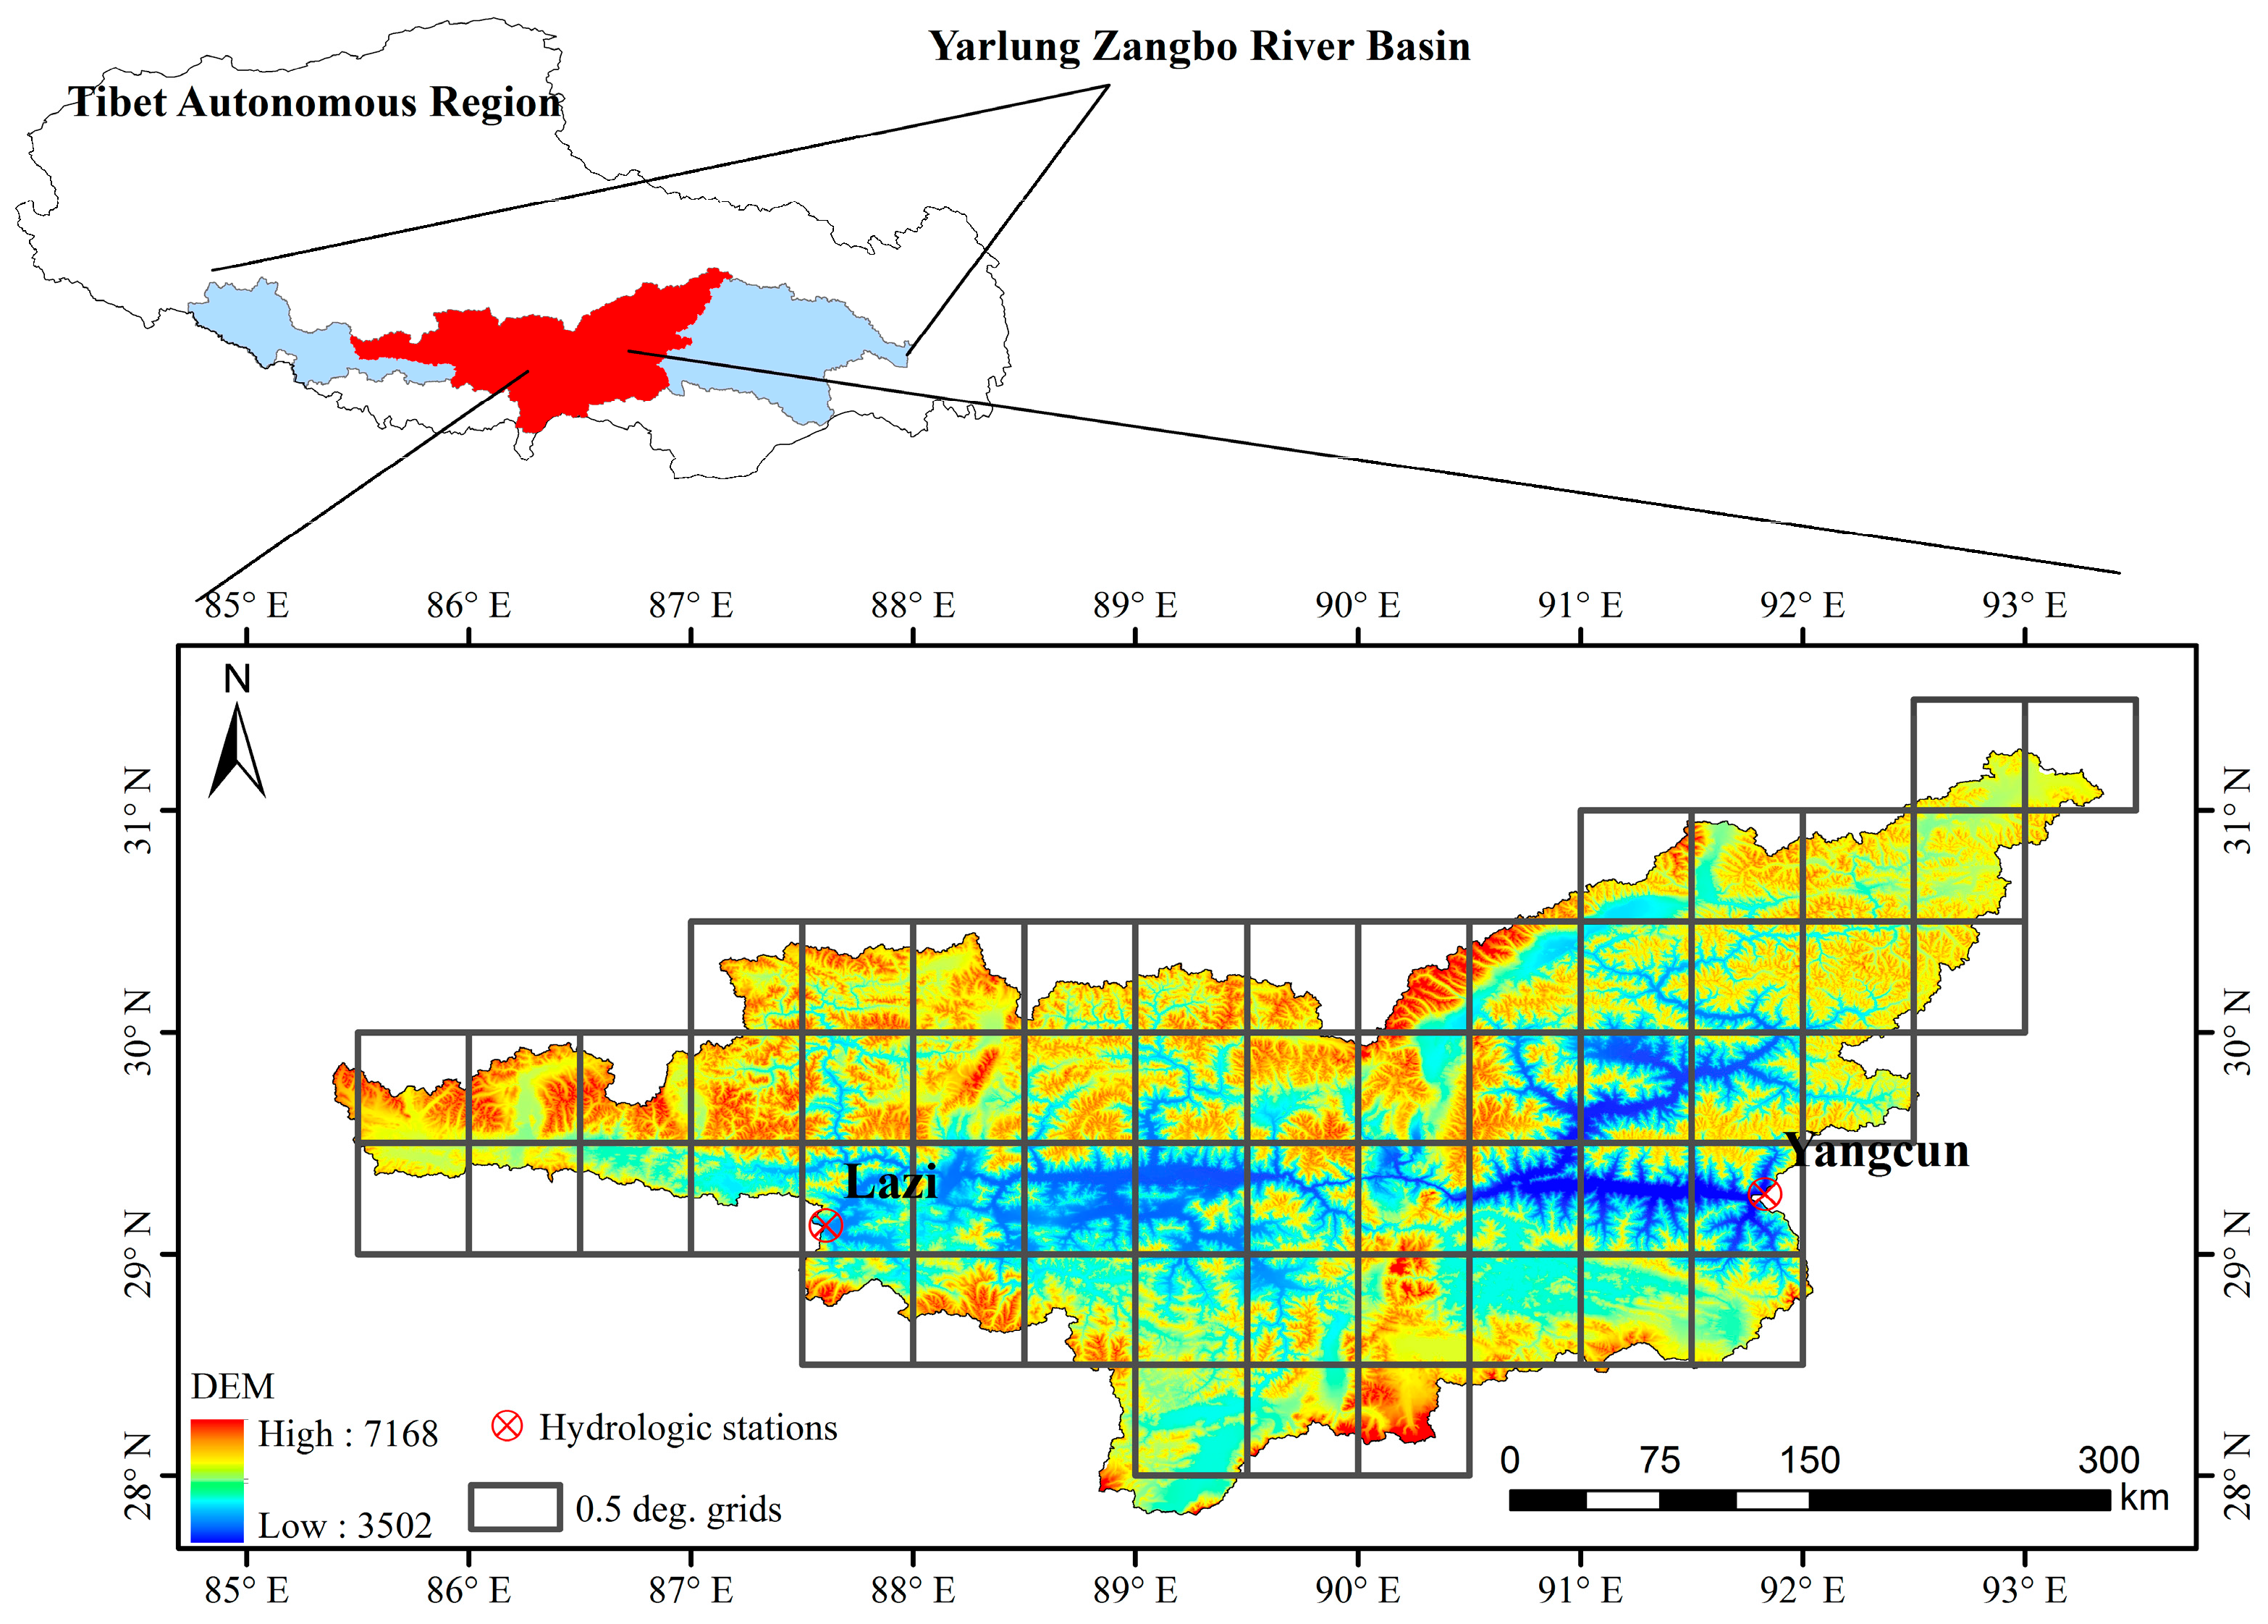
2.1. Study Area
2.2. Dataset Utilized
2.3. Methodology
3. Results
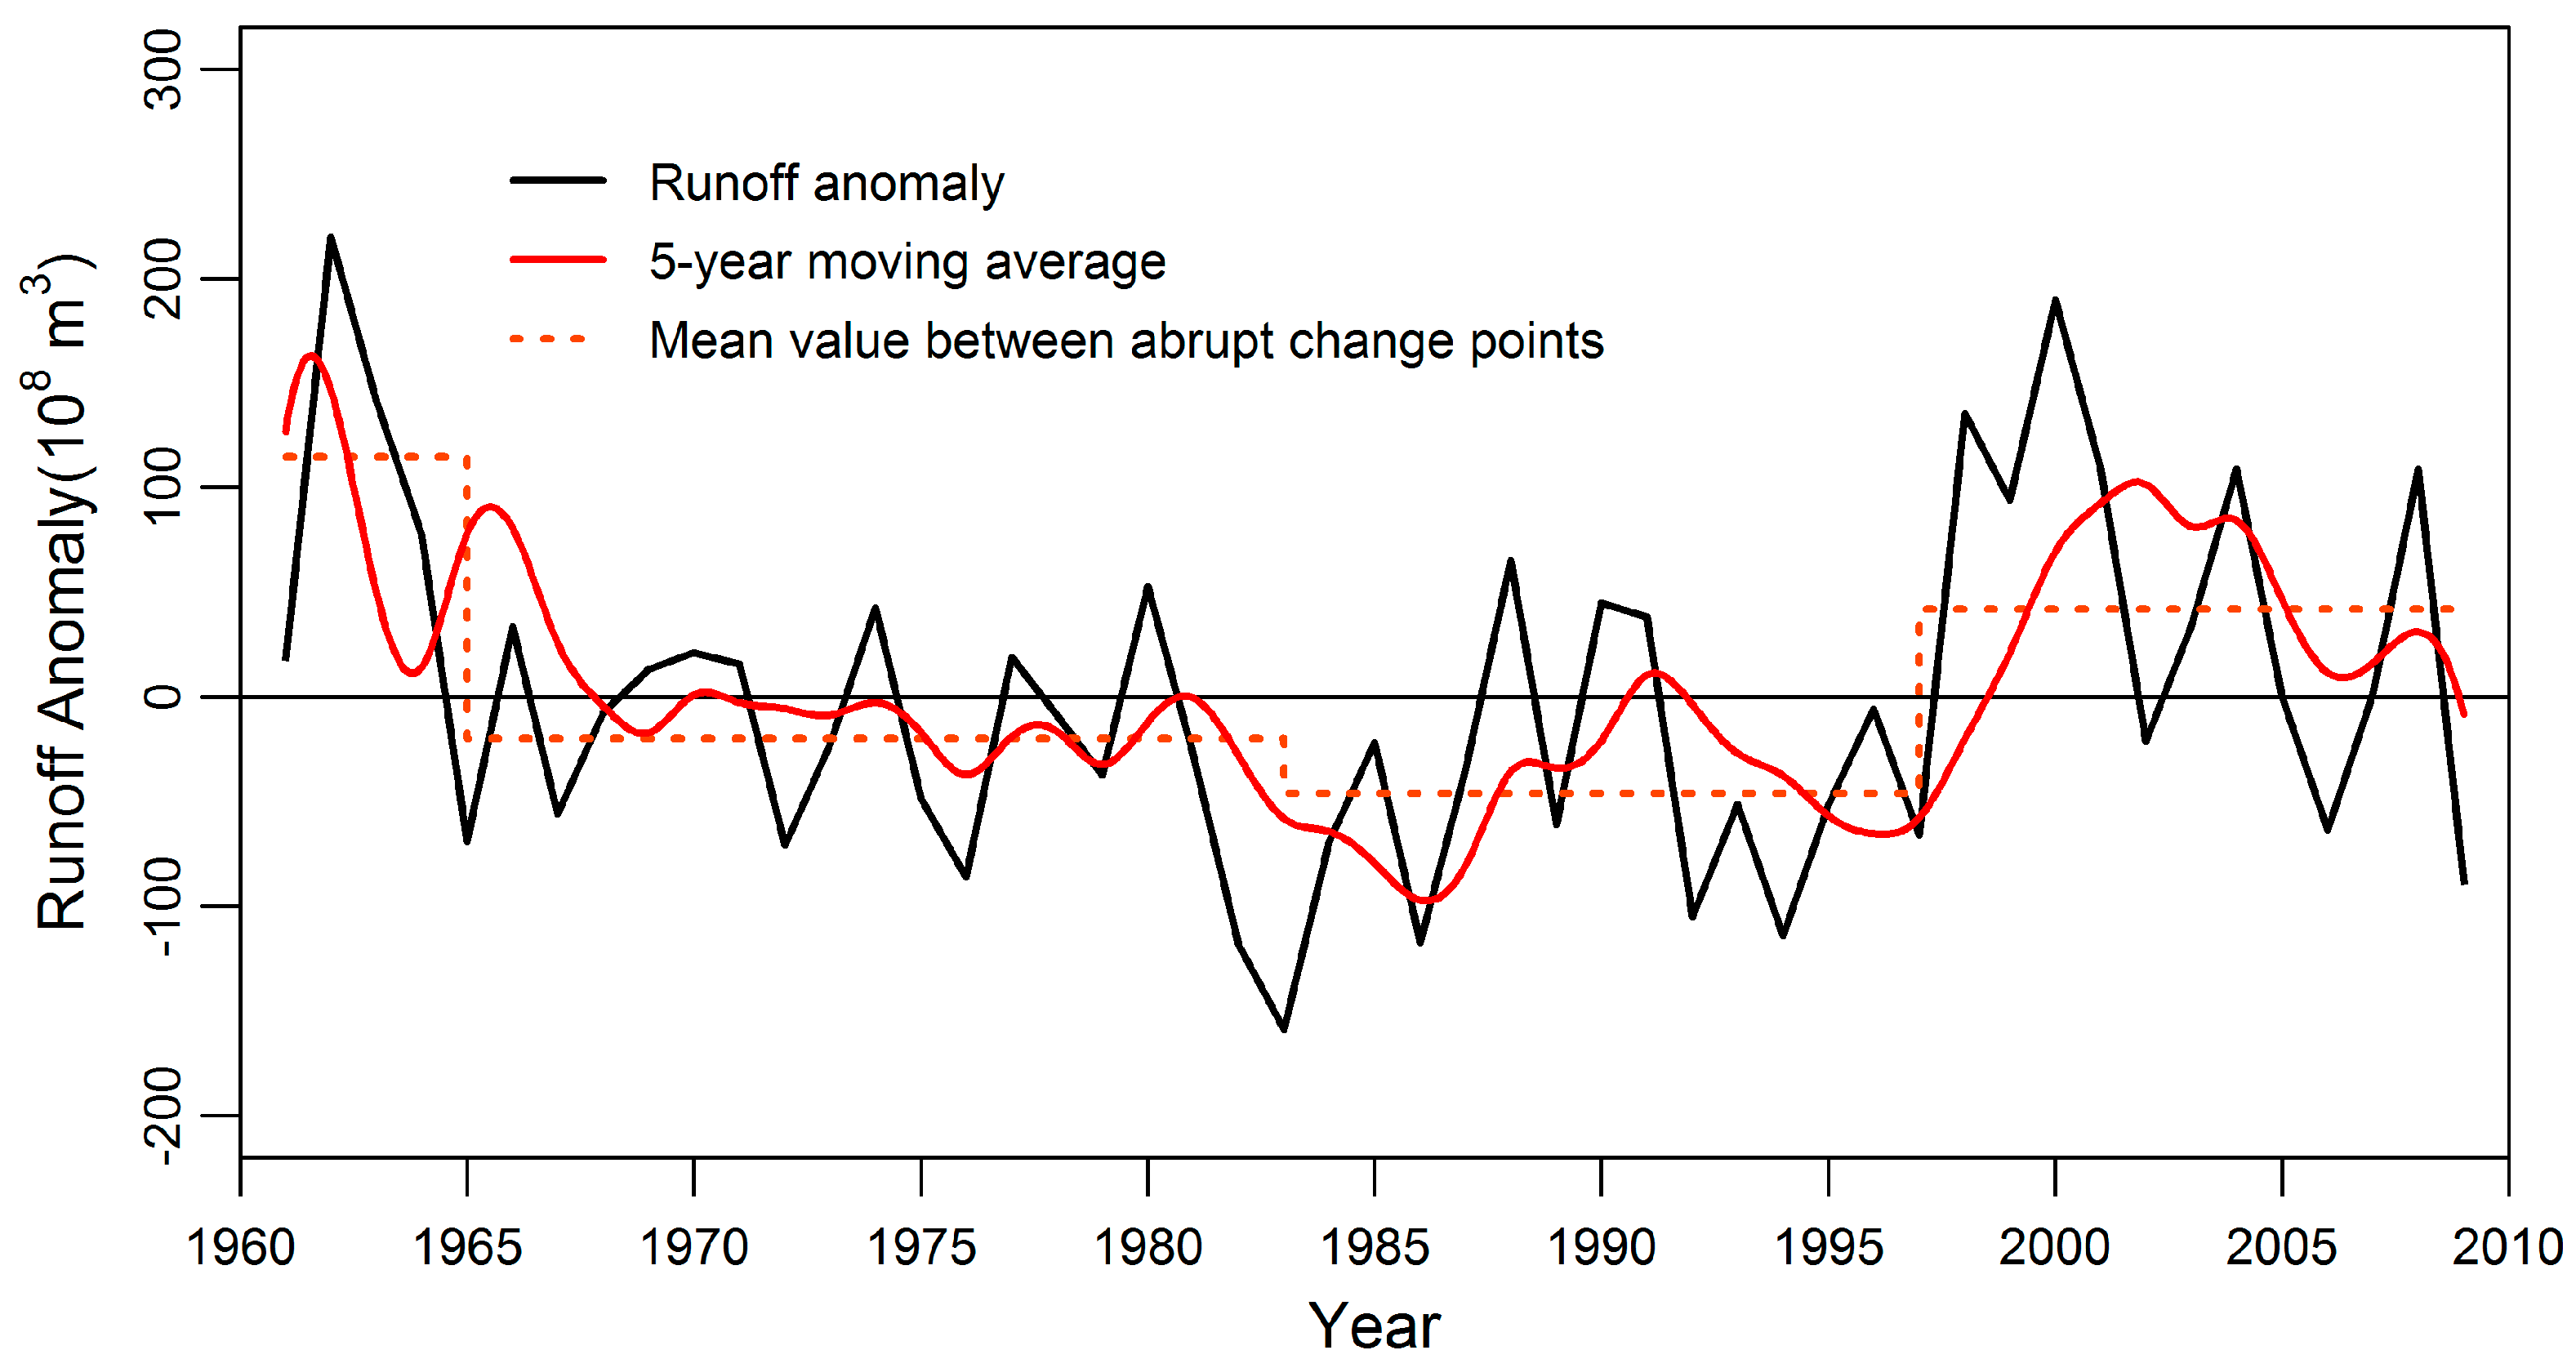
3.1. Runoff Dynamic Analysis
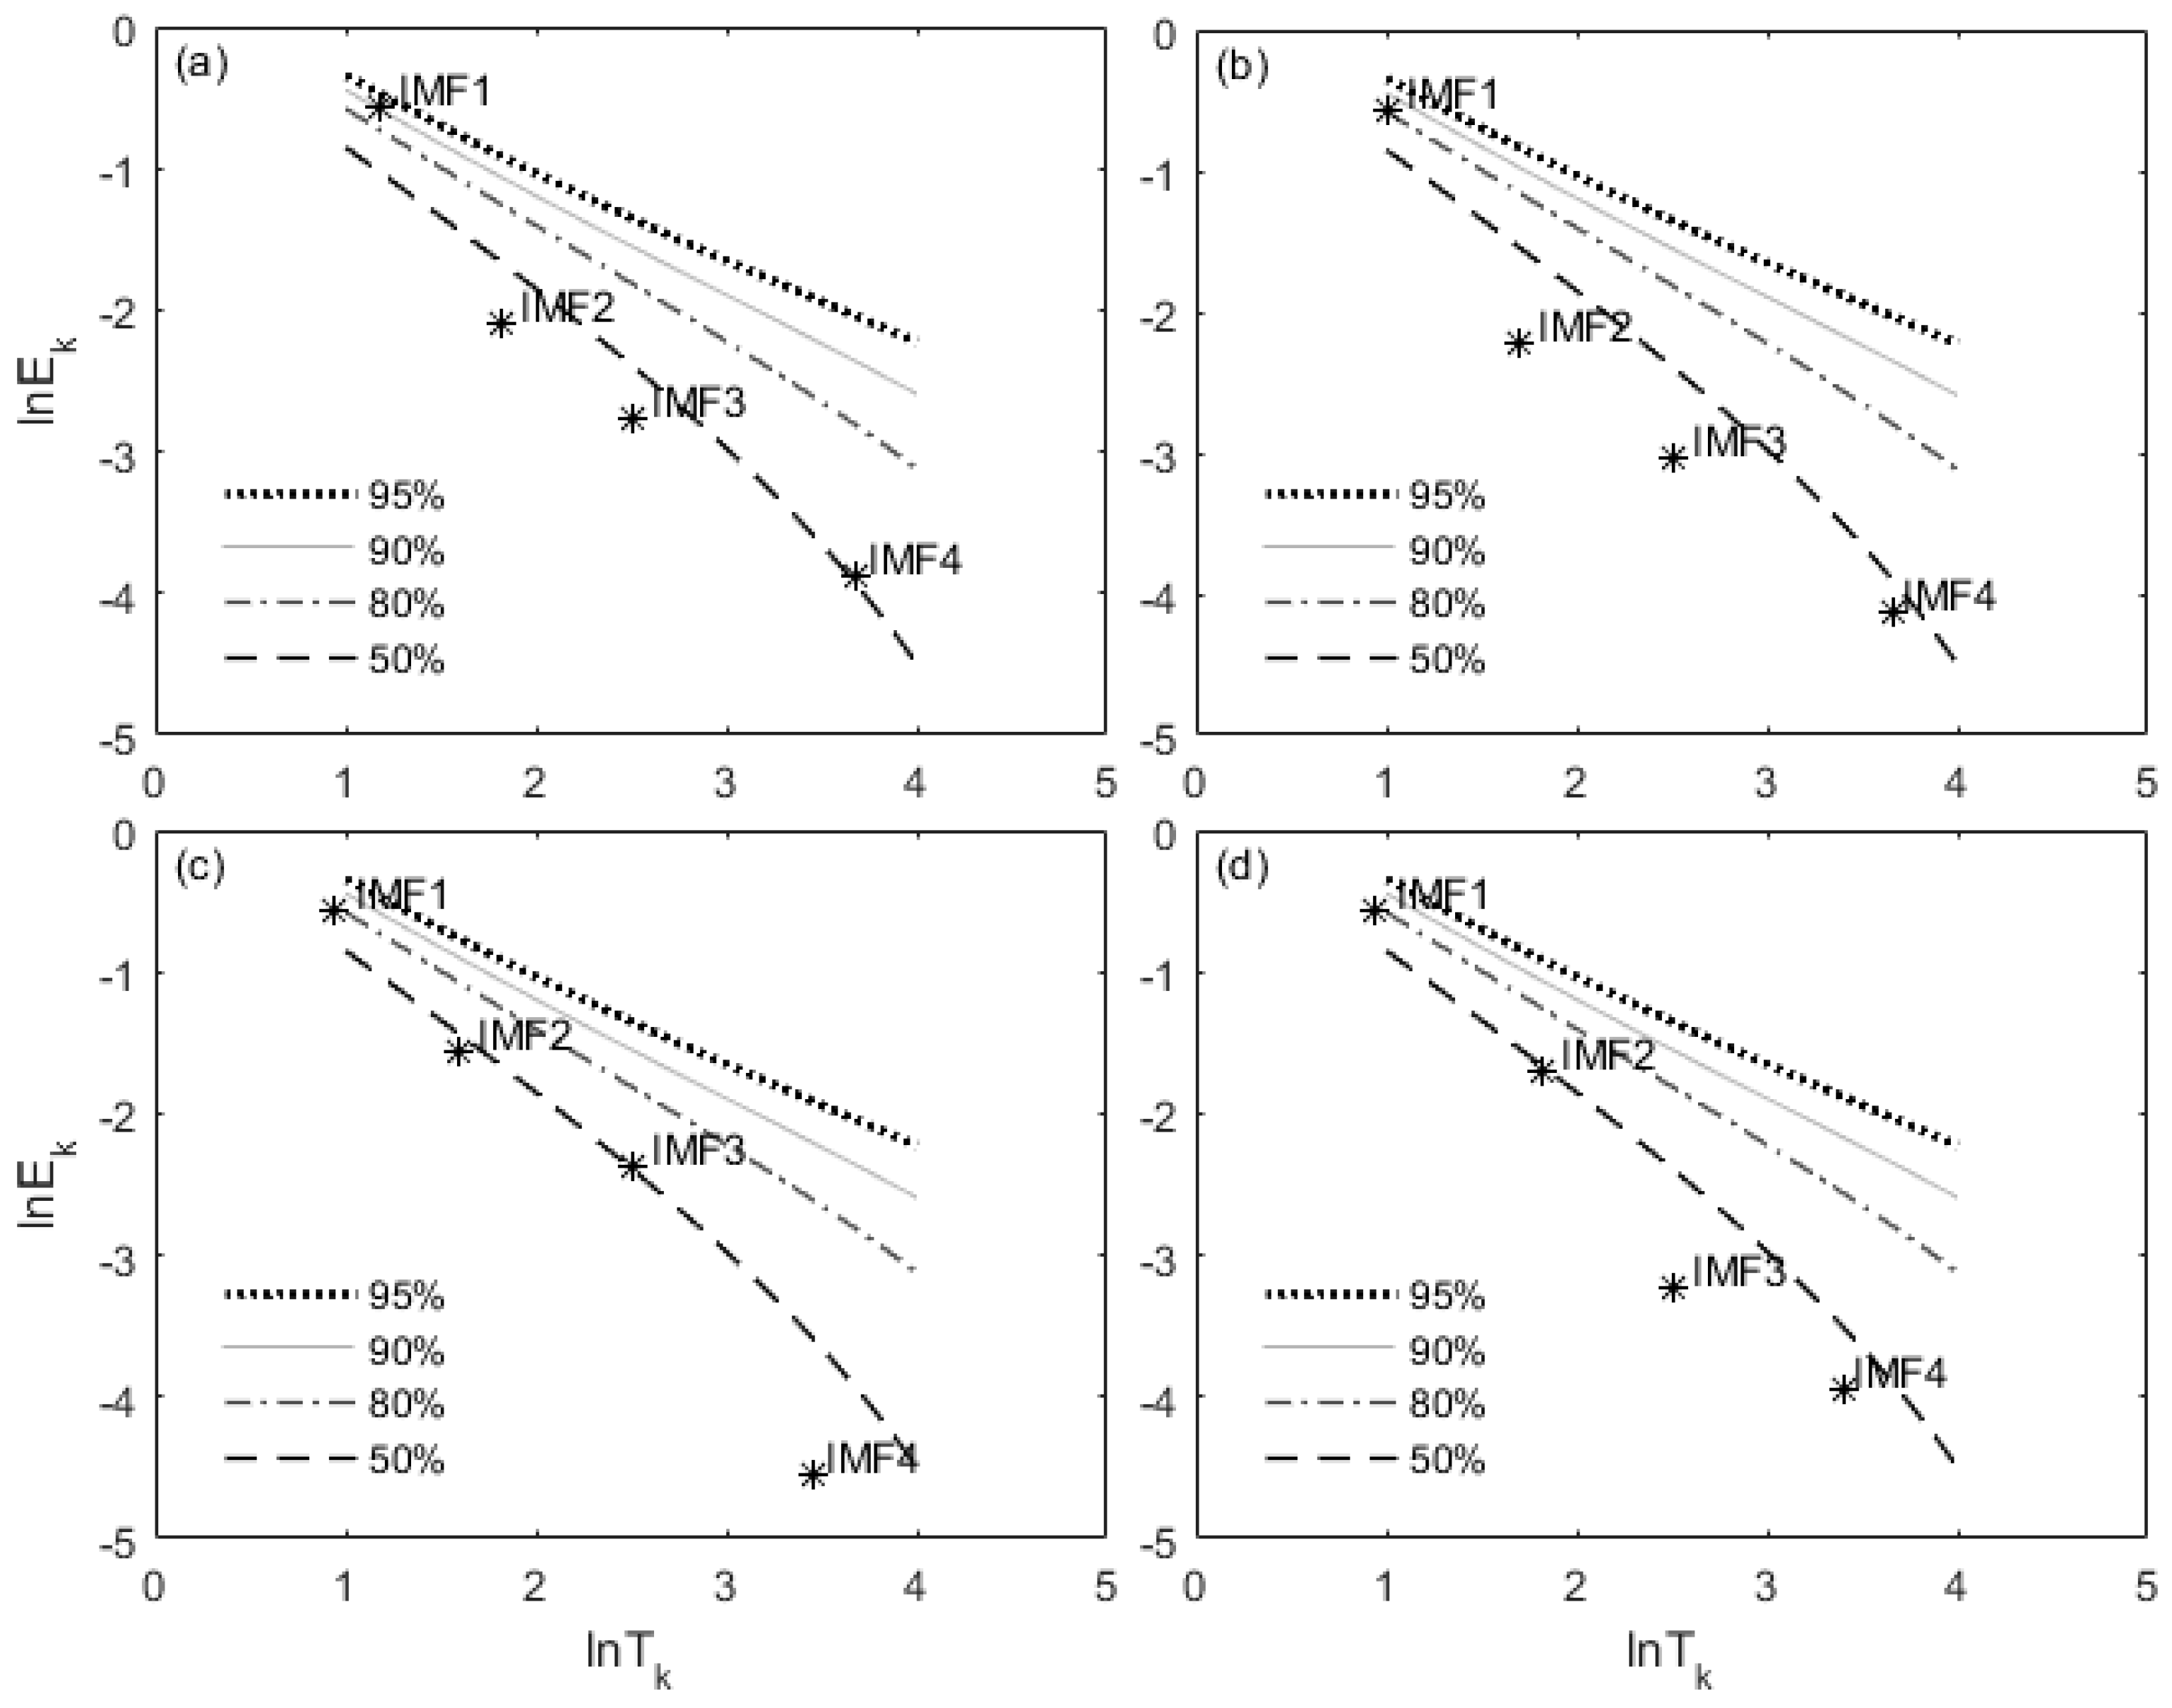
3.2. The Multi-Scale Response of Runoff Dynamics to Climate Changes
4. Discussion
5. Conclusions
Acknowledgments
Author Contributions
Conflicts of Interest
References
- Djebou, D.C.S.; Singh, V.P. Impact of climate change on the hydrologic cycle and implications for society. Environ. Soc. Psychol. 2015, 1, 9–16. [Google Scholar] [CrossRef]
- Djebou, D.C.S. Spectrum of climate change and streamflow alteration at a watershed scale. Environ. Earth Sci. 2017, 76, 653. [Google Scholar] [CrossRef]
- Djebou, D.C.S.; Singh, V.P. Impact of climate change on precipitation patterns: A comparative approach. Int. J. Climatol. 2016, 36, 3588–3606. [Google Scholar] [CrossRef]
- Stocker, T.F.; Qin, D.; Plattner, G.-K.; Tignor, M.; Allen, S.K.; Boschung, J.; Nauels, A.; Xia, Y.; Bex, V.; Midgley, P.M. Climate Change 2013: The Physical Science Basis; Intergovernmental Panel on Climate Change, Working Group I Contribution to the IPCC Fifth Assessment Report (AR5); Cambridge University Press: New York, NY, USA, 2013. [Google Scholar]
- Bai, L.; Chen, Z.; Xu, J.; Li, W. Multi-scale response of runoff to climate fluctuation in the headwater region of Kaidu River in Xinjiang of China. Theor. Appl. Climatol. 2016, 125, 703–712. [Google Scholar] [CrossRef]
- You, Q.L.; Kang, S.C.; Wu, Y.H.; Yan, Y.P. Climate change over the Yarlung Zangbo River Basin during 1961–2005. J. Geogr. Sci. 2007, 17, 409–420. [Google Scholar] [CrossRef]
- Yao, T.D.; Li, Z.G.; Yang, W.; Guo, X.J.; Zhu, L.P.; Kang, S.C.; Wu, Y.H.; Yu, W.S. Glacial distribution and mass balance in the Yarlung Zangbo River and its influence on lakes. Chin. Sci. Bull. 2010, 55, 2072–2078. [Google Scholar] [CrossRef]
- Li, B.Q.; Zhou, W.; Zhao, Y.Y.; Ju, Q.; Yu, Z.B.; Liang, Z.M.; Acharya, K. Using the SPEI to Assess Recent Climate Change in the Yarlung Zangbo River Basin, South Tibet. Water 2015, 7, 5474–5486. [Google Scholar] [CrossRef]
- Liu, Z.; Yao, Z.; Huang, H.; Wu, S.; Liu, G. Land use and climate changes and their impacts on runoff in the Yarlung Zangbo River Basin, China. Land Degrad. Dev. 2014, 25, 203–215. [Google Scholar] [CrossRef]
- Sang, Y.F.; Singh, V.P.; Gong, T.; Xu, K.; Sun, F.; Liu, C.; Liu, W.; Chen, R. Precipitation variability and response to changing climatic condition in the Yarlung Tsangpo River basin, China. J. Geophys. Res. Atmos. 2016, 121, 8820–8831. [Google Scholar] [CrossRef]
- Xu, J.; Chen, Y.; Li, W.; Peng, P.Y.; Yang, Y.; Song, C.N.; Wei, C.; Hong, Y. Combining BPANN and wavelet analysis to simulate hydro-climatic processes—A case study of the Kaidu River, North-west China. Front. Earth Sci. 2013, 7, 227–237. [Google Scholar] [CrossRef]
- Huang, N.E.; Shen, Z.; Long, S.R.; Wu, M.C.; Shih, H.H.; Zheng, Q.N.; Yen, N.C.; Tung, C.C.; Liu, H.H. The Empirical Mode Decomposition Method and the Hilbert Spectrum for Non-Stationary Time Series. Proc. R. Soc. Lond. A Math. Phys. Sci. 1998, 454, 903–995. [Google Scholar] [CrossRef]
- Wu, Z.; Huang, N.E. Ensemble Empirical Mode Decomposition: A Noise-Assisted Data Analysis Method. Adv. Adapt. Data Anal. 2009, 1, 1–41. [Google Scholar] [CrossRef]
- Wu, Z.; Huang, N.E.; Wallace, J.M.; Smoliak, B.V.; Chen, X. On the time-varying trend in global-mean surface temperature. Clim. Dynam. 2011, 37, 759–773. [Google Scholar] [CrossRef]
- Tao, H.; Fischer, T.; Su, B.; Mao, W.; Jiang, T.; Fraedrich, K. Observed changes in maximum and minimum temperatures in Xinjiang autonomous region, China. Int. J. Climatol. 2017, 37, 5120–5128. [Google Scholar] [CrossRef]
- Qian, C.; Zhou, T. Multidecadal Variability of North China Aridity and Its Relationship to PDO during 1900–2010. J. Clim. 2013, 27, 1210–1222. [Google Scholar] [CrossRef]
- Ji, F.; Wu, Z.; Huang, J.; Chassignet, E.P. Evolution of land surface air temperature trend. Nat. Clim. Chang. 2014, 4, 462–466. [Google Scholar] [CrossRef]
- Jiang, L.; Yao, Z.; Wang, R.; Liu, Z.; Wang, L.; Wu, S. Hydrochemistry of the middle and upper reaches of the Yarlung Tsangpo River system: Weathering processes and CO2 consumption. Environ. Earth Sci. 2015, 74, 2369–2379. [Google Scholar] [CrossRef]
- Chen, M.; Shi, W.; Xie, P.; Silva, V.B.S.; Kousky, V.E.; Wayne Higgins, R.; Janowiak, J.E. Assessing objective techniques for gauge-based analyses of global daily precipitation. J. Geophys. Res. 2008, 113, D04110. [Google Scholar] [CrossRef]
- Shen, Y.; Xiong, A.; Wang, Y.; Xie, P. Performance of high-resolution satellite precipitation products over China. J. Geophys. Res. 2010, 115, D02114. [Google Scholar] [CrossRef]
- Guo, H.; Chen, S.; Bao, A.; Behrangi, A.; Hong, Y.; Ndayisaba, F.; Hu, J.; Stepanian, P.M. Early assessment of Integrated Multi-satellite Retrievals for Global Precipitation Measurement over China. Atmos. Res. 2016, 176–177, 121–133. [Google Scholar] [CrossRef]
- Chen, Z.; Qin, Y.; Shen, Y.; Zhang, S. Evaluation of Global Satellite Mapping of Precipitation Project Daily Precipitation Estimates over the Chinese Mainland. Adv. Meteorol. 2016, 2016, 1–15. [Google Scholar] [CrossRef]
- Guo, H.; Chen, S.; Bao, A.; Hu, J.; Yang, B.; Stepanian, P. Comprehensive Evaluation of High-Resolution Satellite-Based Precipitation Products over China. Atmosphere 2016, 7, 6. [Google Scholar] [CrossRef]
- Shen, Y.; Feng, M.; Zhang, H.; Gao, F. Interpolation methods of China daily precipitation data. J. Appl. Meteorol. Sci. 2010, 21, 279–286. [Google Scholar]
- Shen, Y.; Xiong, A. Validation and comparison of a new gauge-based precipitation analysis over mainland China. Int. J. Climatol. 2016, 36, 252–265. [Google Scholar] [CrossRef]
- Qin, Y.; Chen, Z.; Shen, Y.; Zhang, S.; Shi, R. Evaluation of Satellite Rainfall Estimates over the Chinese Mainland. Remote Sens. 2014, 6, 11649–11672. [Google Scholar] [CrossRef]
- Chen, S.; Hong, Y.; Cao, Q.; Gourley, J.J.; Kirstetter, P.-E.; Yong, B.; Tian, Y.; Zhang, Z.; Shen, Y.; Hu, J.; et al. Similarity and difference of the two successive V6 and V7 TRMM multisatellite precipitation analysis performance over China. J. Geophys. Res. 2013, 118, 13060–13074. [Google Scholar] [CrossRef]
- The Evaluation Report of the Data Set (V2.0) of the 0.5 Degree Grid of China’s Surface Temperature. Available online: http://image.data.cma.cn/static/doc/A/SURF_CLI_CHN_TEM_DAY_GRID_0.5/SURF_CLI_CHN_TEM_DAY_GRID_0.5_ASSESSMENT.pdf (accessed on 8 March 2018).
- Wu, Z.; Huang, N.E. A study of the characteristics of white noise using the empirical mode decomposition method. Proc. R. Soc. A Math. Phys. Eng. Sci. 2004, 460, 1597–1611. [Google Scholar] [CrossRef]
- Wu, Z.; Huang, N.E.; Long, S.R.; Peng, C.-K. On the trend, detrending, and variability of nonlinear and nonstationary time series. Proc. Natl. Acad. Sci. USA 2007, 104, 14889–14894. [Google Scholar] [CrossRef] [PubMed]
- Deng, H.; Chen, Y.; Wang, H.; Zhang, S. Climate change with elevation and its potential impact on water resources in the Tianshan Mountains, Central Asia. Glob. Planet. Chang. 2015, 135, 28–37. [Google Scholar] [CrossRef]
- Sun, Z.; Wang, Q.; Batkhishig, O.; Ouyang, Z. Relationship between Evapotranspiration and Land Surface Temperature under Energy- and Water-Limited Conditions in Dry and Cold Climates. Adv. Meteorol. 2016, 2016, 1–9. [Google Scholar] [CrossRef]
- You, Q.; Kang, S.; Aguilar, E.; Pepin, N.; Flügel, W.A.; Yan, Y.; Xu, Y.; Zhang, Y.; Jie, H. Changes in daily climate extremes in China and its connection to the large scale atmospheric circulation during 1961–2003. Clim. Dynam. 2011, 36, 2399–2417. [Google Scholar] [CrossRef]
- Li, B.; Chen, Y.; Shi, X. Why does the temperature rise faster in the arid region of northwest China? J. Geophys. Res. 2012, 117, D16115. [Google Scholar] [CrossRef]
- The Second Glacier Inventory Dataset of China (Version 1.0). Available online: http://westdc.westgis.ac.cn/data/f92a4346-a33f-497d-9470-2b357ccb4246 (accessed on 8 March 2018).
- Huang, X.D.; Hao, X.H.; Wang, W.; Feng, Q.S.; Liang, T. Algorithms for Cloud Removal in MODIS Daily Snow Products. J. Glaciol. Geocryol. 2012, 34, 1118–1126. [Google Scholar]
- Yang, Z.G.; Zhuo, M.; Lu, H.Y.; Dava, C.; Ma, P.F.; Zhou, K.S. Characteristics of precipitation variation and its effects on runoff in the Yarlung Zangbo River Basin during 1961–2010. J. Glaciol. Geocryol. 2014, 36, 166–172. [Google Scholar]
- Wang, R.; Yao, Z.; Liu, Z.; Shanshan, W.U.; Jiang, L.; Wang, L. Changes in climate and runoff in the middle course area of the Yarlung Zangbo River Basin. Resour. Sci. 2015, 37, 619–628. [Google Scholar]
- Deng, H.; Chen, Y.; Shi, X.; Li, W.; Wang, H.; Zhang, S.; Fang, G. Dynamics of temperature and precipitation extremes and their spatial variation in the arid region of northwest China. Atmos. Res. 2014, 138, 346–355. [Google Scholar] [CrossRef]
- Djebou, D.C.S. Integrated approach to assessing streamflow and precipitation alterations under environmental change: Application in the Niger River Basin. J. Hydrol. Reg. Stud. 2015, 4, 571–582. [Google Scholar] [CrossRef]
- Djebou, D.C.S.; Singh, V.P. Entropy-Based Index for Spatiotemporal Analysis of Streamflow, Precipitation, and Land-Cover. J. Hydrol. Eng. 2016, 21, 05016024. [Google Scholar] [CrossRef]


| Station | Mean (108 m3) | Std. Deviation (108 m3) | Skewness | Kurtosis |
|---|---|---|---|---|
| Lazi | 38.92 | 13.47 | 0.25 ± 0.34 | −0.25 ± 0.67 |
| Yangcun | 338.85 | 92.93 | 0.55 ± 0.34 | 0.16 ± 0.67 |
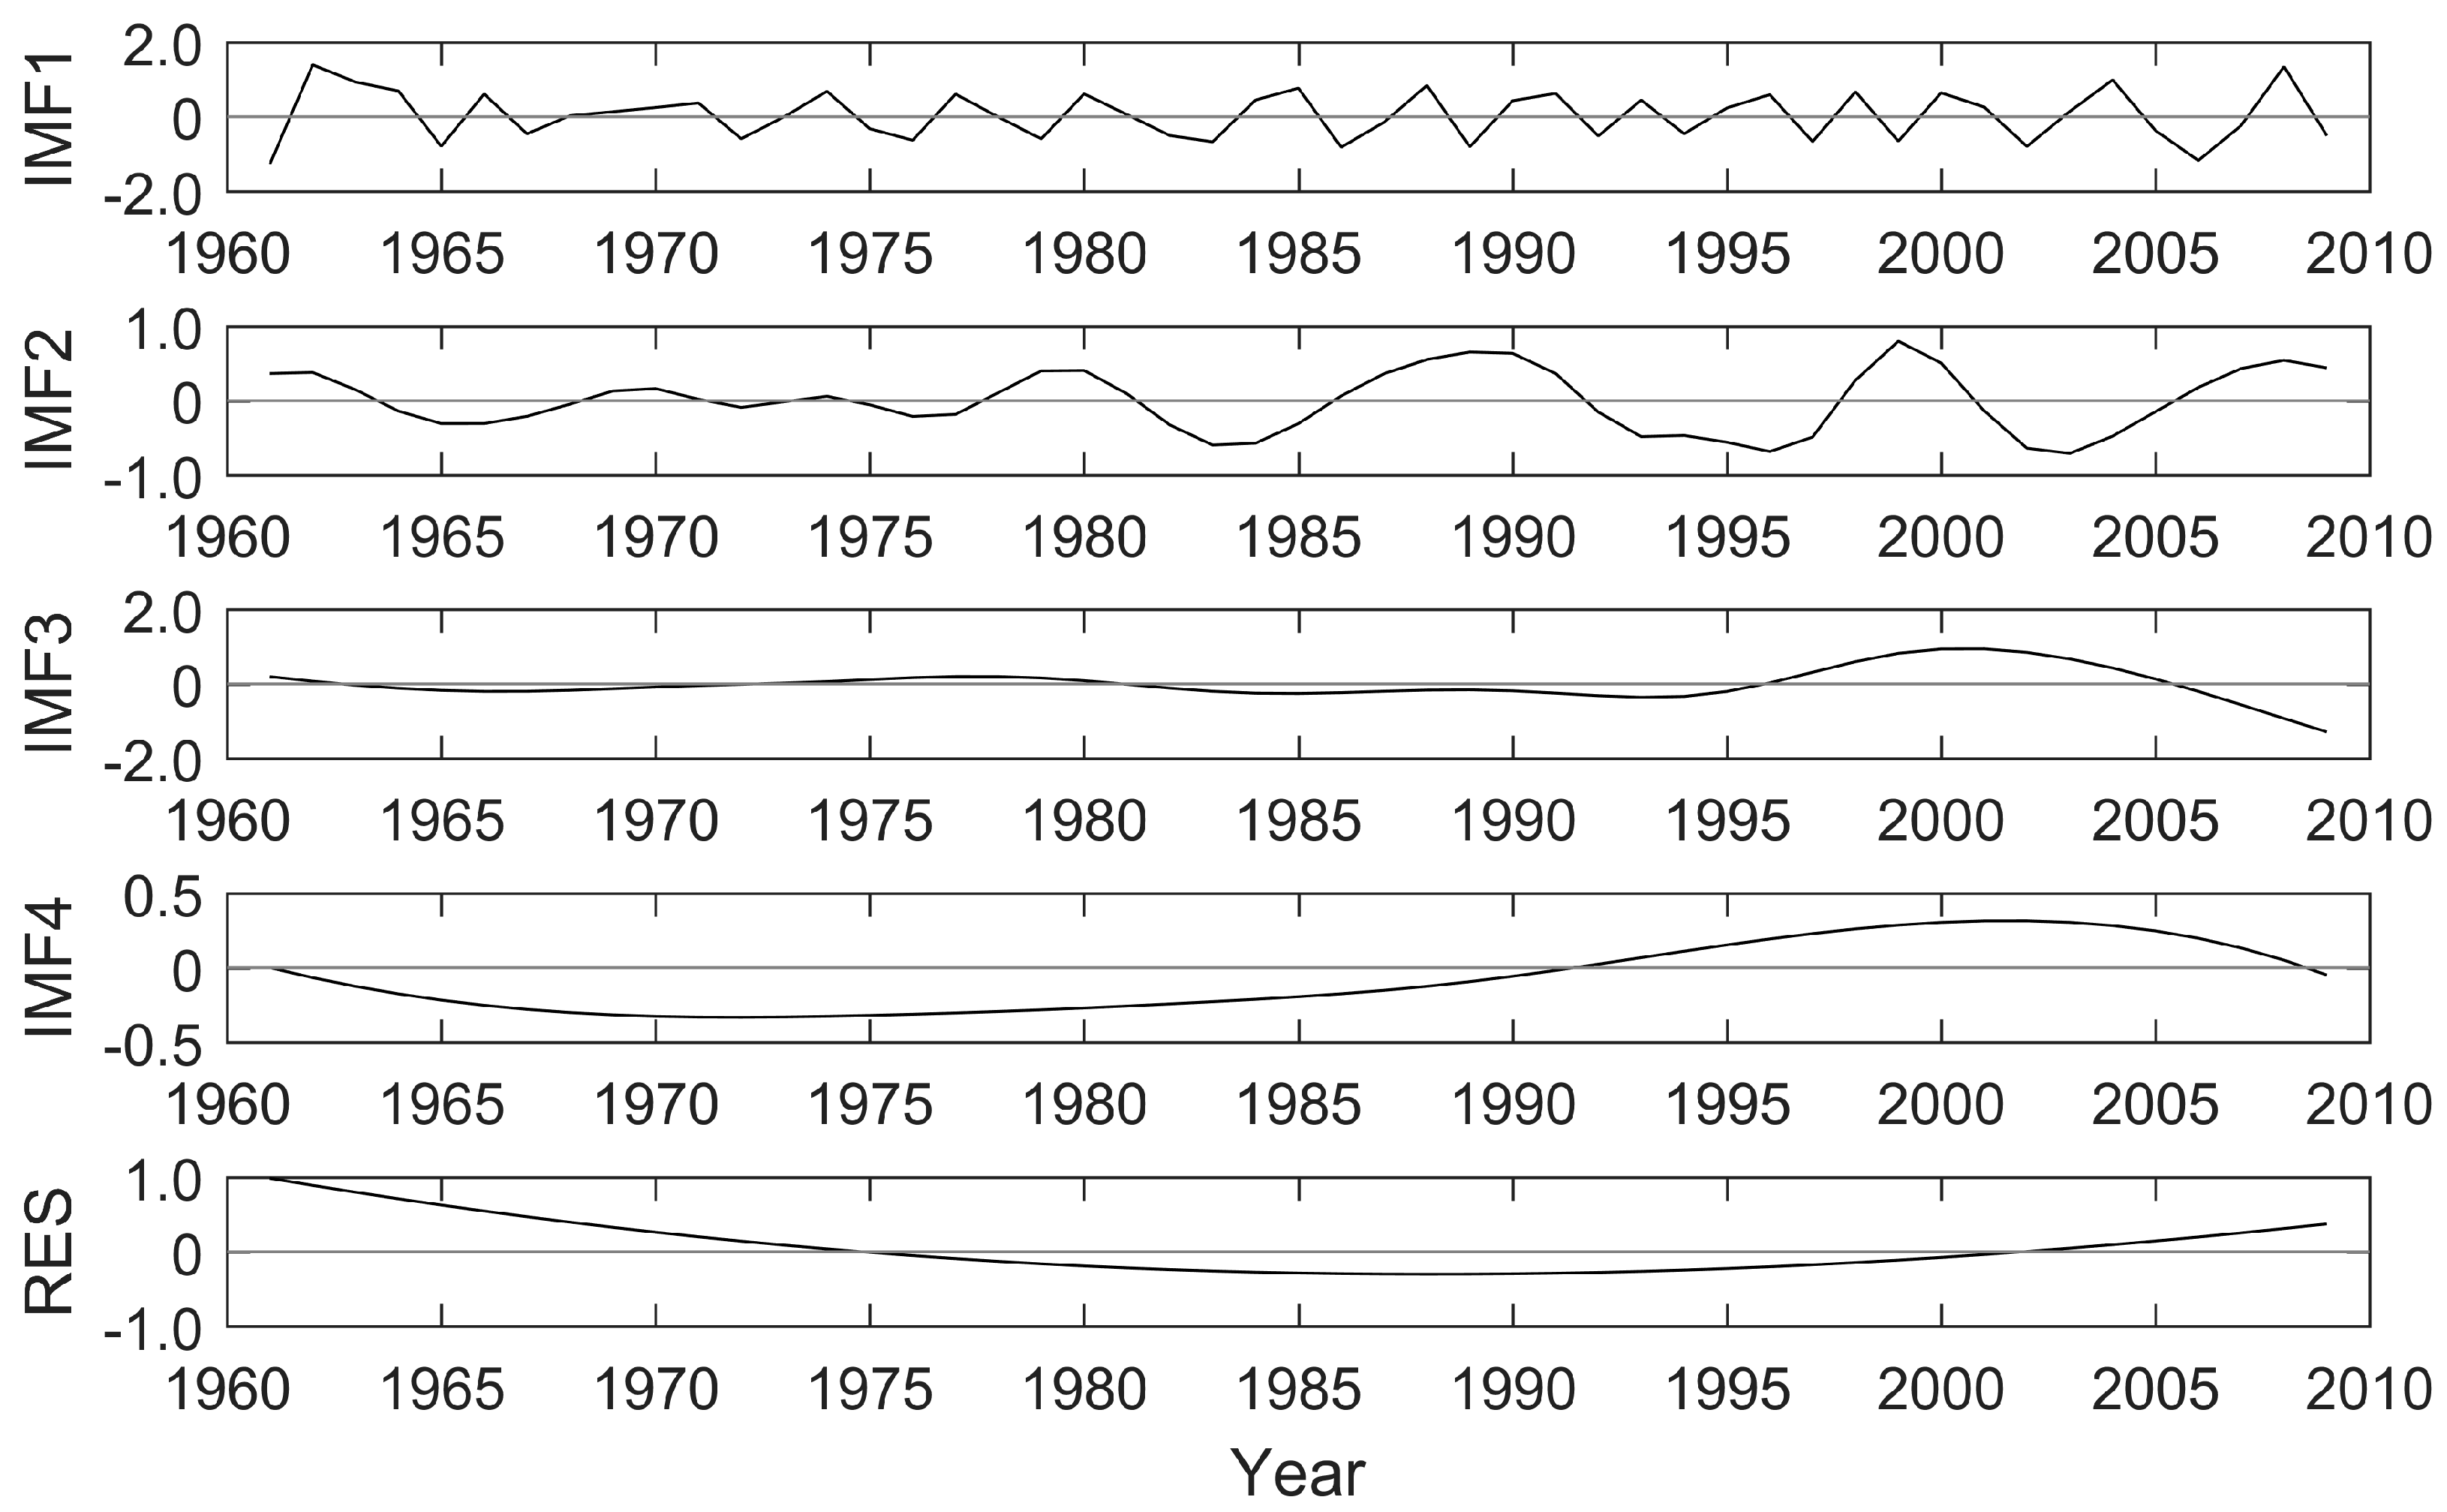
| IMF Components | IMF1 | IMF2 | IMF3 | IMF4 | RES |
|---|---|---|---|---|---|
| Quasi-period (year) | 3 | 5 | 12 | 46 | - |
| Contribution (%) | 43.2 | 16.7 | 18.6 | 8.0 | 13.5 |
| Time Scale | Pav vs. Runoff | Tavg vs. Runoff | TNn vs. Runoff | TXx vs. Runoff |
|---|---|---|---|---|
| IA vs. IA | 0.65 *** | −0.04 | −0.09 | −0.27 * |
| IA vs. ID | 0.23 | −0.09 | −0.06 | −0.10 |
| ID vs. IA | 0.22 | −0.17 | −0.27 * | −0.27 * |
| ID vs. ID | 0.61 *** | −0.02 | −0.07 | −0.31 ** |
© 2018 by the authors. Licensee MDPI, Basel, Switzerland. This article is an open access article distributed under the terms and conditions of the Creative Commons Attribution (CC BY) license (http://creativecommons.org/licenses/by/4.0/).
Share and Cite
Liu, J.; Zhang, W.; Liu, T.; Li, Q. Runoff Dynamics and Associated Multi-Scale Responses to Climate Changes in the Middle Reach of the Yarlung Zangbo River Basin, China. Water 2018, 10, 295. https://doi.org/10.3390/w10030295
Liu J, Zhang W, Liu T, Li Q. Runoff Dynamics and Associated Multi-Scale Responses to Climate Changes in the Middle Reach of the Yarlung Zangbo River Basin, China. Water. 2018; 10(3):295. https://doi.org/10.3390/w10030295
Chicago/Turabian StyleLiu, Jinping, Wanchang Zhang, Tie Liu, and Qilun Li. 2018. "Runoff Dynamics and Associated Multi-Scale Responses to Climate Changes in the Middle Reach of the Yarlung Zangbo River Basin, China" Water 10, no. 3: 295. https://doi.org/10.3390/w10030295