Abstract
Many dams have been constructed or are planned all around China. These dams significantly change the hydrological regime and sand concentration downstream, and subsequently affect the river habitat and riverbed substances. Therefore, a good understanding of the river habitat is urgently required to undertake efficient measures for fish diversity conservation. A multi-objective assessment method based on the Physical Habitat Simulation system (PHABSIM) was utilized to calculate the ecological river flow demand using maximum weighted usable area (WUA) and minimum river discharge as the main objectives. The study employed this method to assess ecological water flow demand in the National Nature Reserve for Rare and Endemic Fish in the Upper Reaches of the Yangtze River in China. Multiple factors such as the degree of endangerment, fish value (ecological value, economic value and scientific research value), data acquisition difficulty, and species representativeness were taken into consideration during selection of indicator fish for coupled habitat analysis. Requirements for both growth and breeding during the study period were considered. Ten species of fishes were chosen as indicator fishes, including floating egg and sinking egg fishes. Additionally, we applied the principle of “minimization of habitat demand and maximization of ecological demand” to include the needs of all indicator fishes. Further, this method comprehensively considered requirements for ecological flow and economic development. The results highlighted that an optimal ecological river flow demand of 2395 m3/s was needed to satisfy the needs for habitat protection and 1890 m3/s was required to meet the needs of social and economic development. The methods used in this study and results obtained, provide a valuable reference for water resources planning and ecosystem protection in other rivers and lakes.
1. Introduction
The study of ecological flow is important for ecological protection and restoration of natural water regimes. It plays a critical role in ecological evaluation during construction and operation of dams on rivers [1]. Currently, the National Nature Reserve for Rare and Endemic Fish in the Upper Reaches of the Yangtze River is under threat from upstream cascade reservoirs by the dams which have been built or are planned to be built [2]. Assessment of the ecological flow of the National Nature Reserve can improve the understanding of ecological flows of large rivers in China [3] and provide support for decision making regarding hydropower resource development in the drainage basins.
Several types of ecological flow methodologies have been proposed in different parts of the world that address different environmental goals and levels of protection. Also, numerous river flow assessment methods have been proposed in several countries over the past decades [4,5]. These methods have been classified as hydrological [6], hydraulic rating [7], habitat simulation [8], holistic [9], combination, and other methodologies [10]. The methods make different assumptions and differ in the data and methodology used to compute ecological flow requirement [11].
Hydrological methods rely solely on the recorded or estimated flow regime of the river and are favored globally for their simplicity. The Tennant method is one of the most widely known hydrological methods [6]. It proposes that the minimum and satisfactory ecological flows are 10% and 30% of the mean flow, respectively [12]. Other hydrological methods recommend flows based on the flow duration curve or the probability of exceedance of a low flow. In contrast, hydraulic methods are based on the relationships between the discharge and other hydraulic parameters of the water body, including width, depth, velocity, and wetted perimeter. The most commonly used hydraulic method is the wetted perimeter method [13], which considers the variation in wetted perimeter with discharge. Habitat methods are natural extensions of hydraulic methods as they focus on hydraulic conditions related to specific biological requirements [14]. The most widely known habitat method is the instream flow incremental methodology (IFIM) [8]. Holistic methodologies, mainly used in Australia and South Africa, utilize alternation in flow pattern and related biophysical environmental changes to assess the flow requirements of the ecosystem [14]. The Building Block Methodology [15], mainly used in South Africa, is the most frequently used holistic method. Combination methods such as the managed flood release approach [16] adopt elements from multiple approaches.
In summary, most river flow or water level assessment methods are only applicable to a specific water body or one kind of biological indicator [17]. Many of these methods do not consider the trade-offs between water uses by humans and ecosystems; and consider only a few factors that influence ecosystems, such as hydrological, hydraulic, or habitat factors [18]. In reality, several conflicting objectives such as social, economic, and environmental objectives have to be considered for river flow regulation. In traditional water resources planning, economic objectives are dominant [19]. Increasing volumes of water have been diverted from rivers to meet the demand for irrigation and municipal and industrial water uses, which has led to severe deterioration of the aquatic environment and riparian vegetation.
Therefore, biological indicators should be more comprehensive and acknowledge the trade-offs between water use by humans and ecosystems. The main objective of this study is to propose a general multi-objective evaluation programming model to determine minimum flow, while considering the requirements for both ecological flow and economic development (including industry, agriculture, domestic and shipping development). Additionally, the study applied this method in the National Nature Reserve for Rare and Endemic Fish in the Upper Reaches of the Yangtze River.
2. Materials and Methods
2.1. Study Area and Biological Indicators
The Yangtze River, the largest river in China and the third largest river in the world, is very rich in fish biodiversity and hydropower resources. It is considered as the cradle of freshwater fisheries in China due to its plentiful fish resources and is representative of areas with rich biological diversity [20].
The National Reserve of Yangtze Rare Fish Species (He Jiang to Leibo section) was inaugurated in April 2005 by the General Office of the State Council of the People’s Republic of China. It was considered important for the conservation of rare fish populations in the Upper Yangtze. In April 2005, the reserve was designated as the National Nature Reserve for the Rare and Endemic Fish in the Upper Reaches of the Yangtze River, and its scope was expanded to extend across Sichuan, Yunan, Guizhou, and Chongqing provinces. It is the longest and most extensive riverine nature reserve in China, including the main stem of the Yangtze between Xiangjiaba Dam and Masangxi Bridge with branches such as the Chishui and Minjiang Rivers, and has a total length of 1162.61 km and an area of 33,174.21 hm2. It is very important for biodiversity conservation and protects several rare and endemic fish species. The major protected species are the Chinese paddlefish (Psephurus gladius), Dabry’s sturgeon (Acipenser dabryanus), and Chinese sucker (Gyrinocheilus aymonieri), along with 67 other endemic species in the Upper Yangtze.
The Yangtze River environment has been of concern for many years [21]. Since the 1950s, extensive research has been conducted on the biology of its fish and fisheries to facilitate their protection. River water quality [22], flow velocity [23], flow discharge [24], and channel morphology [25] have been assessed. In recent years, measures such as ecological rehabilitation, fisheries management, artificial enhancement and release, fish reserves, and international assistance have contributed significantly [17,25,26]. However, nearly all the studies have focused on the river reaches below the Three Gorges dam or Chongqing City, which is upstream. Moreover, studies have focused on erosion and the sedimentation processes of the channel, river-lake relationships, and flood control [2,21]. However, the aquatic organisms or the biological aspects of the river environment have not been considered and therefore there has been little direct support for micro or meso-scale biodiversity management of the river.
Additionally, the Upper Yangtze is a rich hydropower resource (up to 1.21 × 10⁹ kW), constituting the largest hydropower energy base in China. Thus, further development of hydroelectric dams in the Upper Yangtze is inevitable. At present, about 27 dams have been constructed or are planned in the Jinsha River, an affluent of the Upper Yangtze main stream. Two large dams, namely the Xiluodu Dam and Xiangjiaba Dam, located on the upstream reach, are already operational or will be operating soon. The two dams will significantly change the hydrological regime and sand concentration downstream, which will subsequently affect the river habitat and riverbed substances. Therefore, a good understanding of the river habitat is urgently required to undertake efficient measures for fish diversity conservation.
A field survey using an echo sounder and ADCP was conducted in the Upper Yangtze River from Shuifu city, Yunnan Province (about 2 km downstream from the Xiangjiaba Dam) to Chongqing city (upper end of the Three Gorges Reservoir) (Figure 1 and Figure 2), covering a stretch of about 392 km [2]. This stretch of river passes through a mountainous area with elevations mostly less than 500 m above the river level. The river morphology within the study area is uneven and has many elevated points, central bars, and reef structures shaping the river bed, with riverbed gradients of 0.27−0.40%. At the Jinsha section (Shuifu-Yibin), the river is typically 150−200 m wide. The river widens downstream of Yibin, typically varying between 200−300 m and 600−800 m within and outside the gorges, respectively. The maximum river width broadens at certain points to 1000−2000 m. The average annual water level at Zhutuo during the period 1956−2014 was 200.13 m (daily mean range 196.21−216.31 m) with a flow rate of 8520 m3/s (daily mean range 1920−53,400 m3/s). Four major cities (Yibin, Luzhou, Jiangjin, and Chongqing) are located along the river and buildings have been constructed along the river banks (Figure 1). Since 2005, the reach of river from Shuifu to Chongqing (385.26 km, 98.3% of the length of the study area) has been a part of the Upper Yangtze National Reserve. Following an international designation from the United Nations Educational, Scientific, and Cultural Organization (UNESCO), biosphere reserves were demarcated into three inter-related zones: the core area, the buffer zone, and the transition area outside the buffer zone. The present study’s reach was designed to include the three zones (Figure 1). The main stream includes two sections of the core area, four buffer zones, and three transition areas. However, three additional dams, Shipeng, Zhuyangxi, and Xiaonanhai (Figure 2) are being planned for this river stretch.
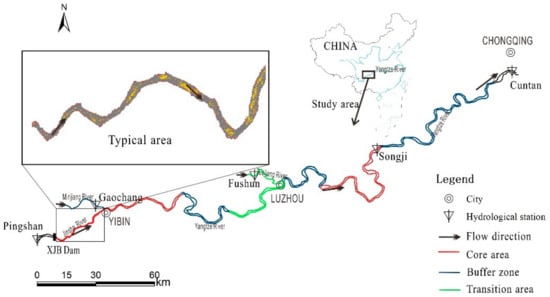
Figure 1.
Study area of the upper Yangtze reach from the Xiangjiaba Dam (XJB) to the upper end of the Three Gorges Reservoir (Chongqing), covering approximately 392 km of the river length. The two small red triangles indicate the start and end of the study area. The core area of the reach is displayed in red, the buffer zone in blue, and transition area in green. The expanded part shows the area chosen for weighted usable area (WUA) calculation.
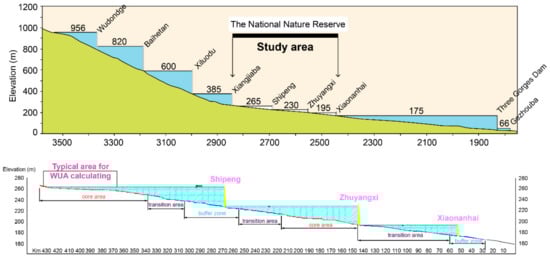
Figure 2.
Sketch map showing the study area between the dams of Shipeng, Zhuyangxi, and Xiaonanhai, which have been planned.
In this study, long-term endemic fish distribution data for the upper Yangtze River basin were used. Data was sourced from fish distribution data collected by Cao and Liu [27], monitoring data from the Ecological and Environmental Monitoring System of the Three Gorges Reservoir collected since 1997, and the results of other research results conducted by the Ecology and Conservation Biology of Freshwater Fish in the Institute of Hydrobiology, and bibliographic data including monographs and investigation papers.
Based on the topography, geomorphology, hydrology and hydrodynamics of the fish nature reserve, this study proposed an index system to show the characteristics of the fish habitat, which could be used for decision-making regarding the protection of fishery resources. In the coupling habitat analysis, multiple factors such as the degree of endangerment, ecological value, data acquisition difficulty, and species representativeness were taken into consideration during the selection of indicator fish for coupled habitat analysis. Requirements for both growth and breeding during the study period were considered.
According to the above screening process, the fish within the study area is divided into those that produce floating eggs and those that produce sinking eggs. Coreius guichenoti, Leptobotia elongate, Jinshaia sinensis and Chinese carp were selected as representative of floating egg fish; Psephurus gladius, Acipenser dabryanus, Myxocyprinus asiaticus, Procypris rabaudi, Schizothorax prenanti, Euchiloglanis kishinouyei were selected as indicators of sinking egg fish in torrent streams; and Megalobrama pellegrini were selected as indicators of sinking egg fish in slow streams.
On the basis of a full literature research, this paper further summarizes the characteristics of the fishes’ life cycle, such as fish growth and reproduction. Then, the “minimize habitat demand as well as maximize ecological demand” principle was implemented to meet the needs of all indicator fishes. Habitat requirements of indicator fishes was shown in Table 1.

Table 1.
Habitat requirements of indicator fishes.
2.2. General Workflow
A good understanding of the physical habitat of the river’s environment is vital for ecological flow assessment as factors such as water flow, discharge, depth, and channel index affect aquatic organisms [28]. The general workflow for assessing river habitat properties using an inductive literature search is shown in Figure 3. Several factors such as the degree of endangerment, ecological value, data acquisition difficulty, and species representativeness were taken into consideration during the selection of indicator fishes. Additionally, we analyzed growth and breeding requirements during the same period. Expert consultation and an extensive literature review was conducted to identify the principle for coupling analysis, namely, “minimization of habitat demand and maximization of ecological demand” to meet the needs of all indicator fishes. Finally, velocity suitability curves and depth suitability curves were utilized as the basic data for model operation.
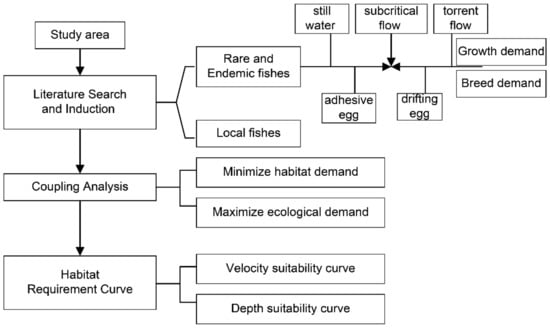
Figure 3.
General workflow of coupled habitat demand analysis for several kinds of indictor.
2.3. Ecological Flow Demand Calculation Based on PHABSIM
2.3.1. Data Set
An underwater geomorphologic map of the Upper Yangtze River was acquired from the Changjiang Water Resources Commission of the Ministry of Water Resources in a self-defined DEM format, which was scaled at 0.5 m × 0.5 m per grid.
In this study, hydrological data from the Pingshan, Gaoyang, Zhutuo, and Cuntan Hydrological Stations during 1956−2014 (59 years) were analyzed. Flow variation trends and differences before and after the construction of the Xiangjiangba Dam were investigated. Specific site details are given in Table 2.
Table 2.
Hydrological stations along the study area.
The Physical Habitat Simulation (PHABSIM) component of the IFIM is a popular technique used to predict habitat for aquatic species with change in water flow [41]. Multiple habitat suitability criteria for depth, velocity, substrate and cover, which are species specific and life-cycle related are used to predict depth and velocity of the water body. The weighted usable area (WUA) habitat index is computed using the predicted information along with substrate or cover-related information [42]. The WUA output is normally used to simulate the usable area for rivers, which includes a range of stream flows. This paper established a two-dimensional physical habitat model of the river segment based on the coupling of the hydrodynamic model and fish information model and calculated the ecological water demand of the river. The River2D model is suitable for microenvironment assessment and meso-scale habitat simulation, but unsuitable for large scale habitat simulation [26]. Therefore, we selected an important core area (Xiangjiaba-Yibin) as the study area for three reasons: (1) it is one of the two core areas in the National Nature Reserve; (2) it responds directly to the influence of upstream reservoir (Xiangjiaba) regulation; and (3) it serves as the spawning grounds as well as a fertile field for several rare and endemic fishes.
2.3.2. Hydrological Data Analysis
This study analyzed the basic hydrological parameters of the natural river course during the dry season, before the Xiangjiaba dam was constructed. The results in Figure 4, Figure 5, Figure 6, Figure 7, Figure 8, Figure 9 and Figure 10 illustrate various parameters of the natural hydrologic process. It provides the basis for ecological demand analysis of the downstream. We found that the hydraulic parameters differed for different periods/months.
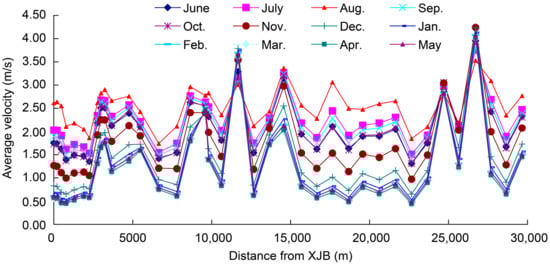
Figure 4.
Average velocity for each month during typical dry years in the study area.
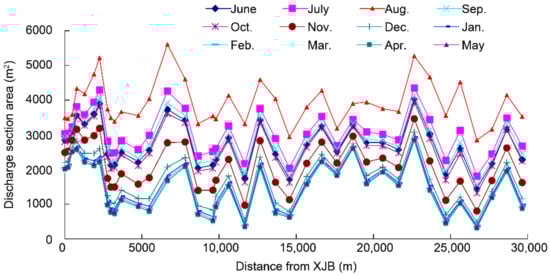
Figure 5.
Discharge section area for each month during typical dry years in the study area.
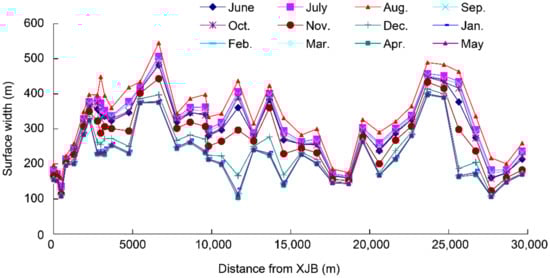
Figure 6.
Surface width for each month during typical dry years in the study area.
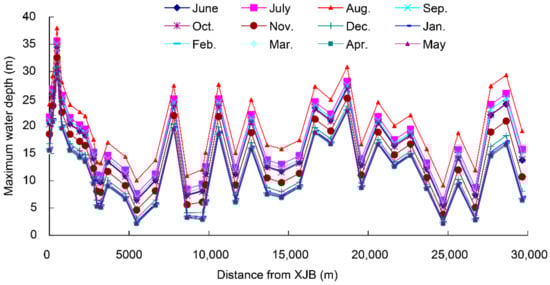
Figure 7.
Maximum water depth for each month during typical dry years in the study area.
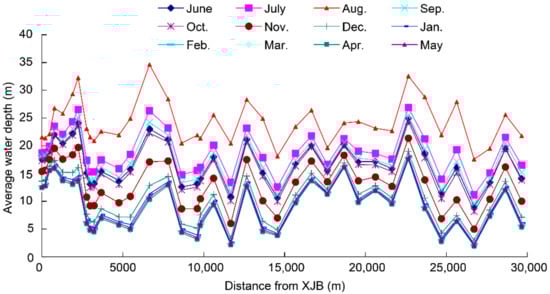
Figure 8.
Average water depth for each month during typical dry years in the study area.
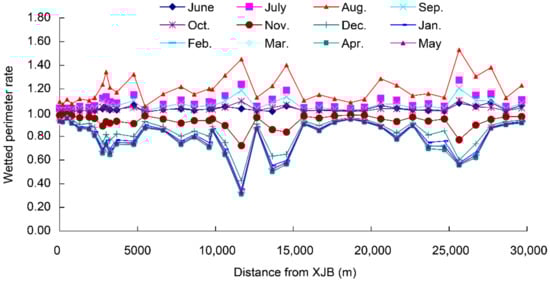
Figure 9.
Wetted perimeter rate for each month during typical dry years in the study area.
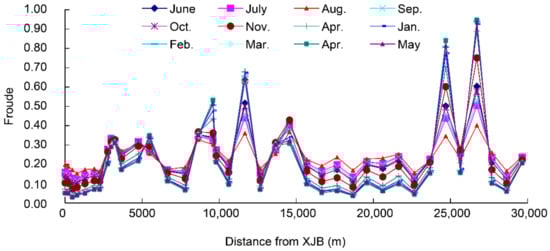
Figure 10.
Froude for each month during typical dry years in the study area.
2.4. Multi-Objective Assessment Model to Estimate Minimum Ecological Flows
To obtain an optimal ecological flow that considers the trade-offs between economic and environmental water uses, we regarded river flow regulation as a multiple criteria decision-making problem, with the objectives of minimum river discharge (indicating maximum water use for economical purpose) and maximum WUA (indicating maximum water use for environmental purposes). The ideal point method (IPM), an effective method for multi-objective programming, was used to determine the optimal ecological flow for regulated rivers based on the WUA-discharge curve [26].
WUA is used as the habitat index for target aquatic species and life stages in the River-2D model [11]. Considering habitat suitability criteria of water depth, velocity and channel index for the chosen target species and life stages, WUA-discharge (Q) relationship can be obtained using the habitat modeling function in River-2D. The peak of the WUA-Q curve generally indicates the river flow that provides the most suitable habitat for the target species [43].
Using the river discharge (Q) as the hydraulic parameter and WUA as the habitat index, the model [44] can be written as:
where, Z1 and Z2 are the two objective functions. Z1 represents the minimization of water index needed to supply more water for human consumption, while Z2 represents the maximization of habitat index needed to provide a greater amount of habitat for the aquatic ecosystem. The upper limit of discharge is set to the peak flow of the WUA-Q curve (Qp). Therefore, this model aims at providing more habitats with less water.
However, the two objectives in Equation (1) are incompatible. Usually optimal solutions when all the objectives reach their optimal values do not exist for such multi-objective optimization models. Only efficient solutions or Pareto solutions can be obtained using various algorithms of multi-objective programming, among which the IPM is an effective one [45]. The optimal value for an objective function is identified, ignoring other functions [46]. The optimal values are ranked based on their distances from the ideal point. The Pareto solution of the multi-objective optimization model will assume the values closest to the ideal point [47].
To solve the multi-objective problem of minimal discharge and maximal WUA, a hypothetical scenario (0, 1) with zero river discharge (Q = 0) and the original WUA can be taken as a reference situation. The distance (d) between a scenario (Q, WUA) and the hypothetical reference situation (0, 1) is:
where, ω1 and ω2 are non-negative weights and r is a scaling coefficient equal to or greater than 1. Generally, r takes the values of 1 or 2, and the corresponding distances represent the Hamming distance and Euclidean distance between a given scenario and the reference point, respectively [24]. Scenarios that are closer to the reference point are preferred to ones further away. Therefore, the scenario with minimum distance to the reference point can be used to define the optimal minimum environment flow. Equations (3) and (4) are used for IPM with r = 1 and r = 2, respectively.
3. Results
3.1. Coupling Analysis and Habitat Requirement Curves
The authors appended species distribution records, supplemented with newly published species information, and aggregated them after filtering out controversial species. The coupled flow rate habitat demand was 0.5–3 m/s, and the coupled water depth habitat demand was 0.5–20 m. The optimum flow rate demand was 1.2–1.5 m/s, and the optimum depth demand was 5–12 m/s, as shown in Figure 11 and Figure 12.
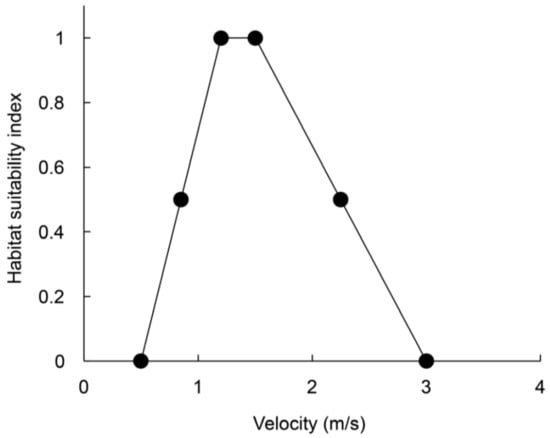
Figure 11.
Coupled velocity suitability index curve.
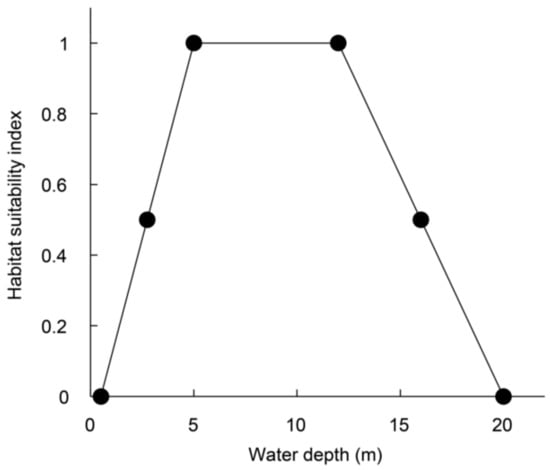
Figure 12.
Coupled depth suitability index curve.
Thus, the study has the potential to provide a reference for conservation related to fish spawning in addition to the entire life-history of fishes and possibly the entire Yangtze River Basin aquatic ecosystem.
3.2. Ecological Flow Demand
WUAs of typical areas at different discharges can be calculated using habitat suitability indices of flow velocity and water depth. We have chosen 14 different working conditions (10%, 15%, 20%, 25%, 30%, 35%, 40%, 45%, 50%, 55%, 60%, 65% of XJB dam’s average flow; average flow of dry season; average flow of dry season in dry year). This study used the PHABSIM to simulate the habitat environment of the study area using the River2D model, obtained the value of WUA under different flow rates, and formed a WUA-Q curve, as shown in Table 3 and Figure 13.
Table 3.
WUA of the study area during different discharges.
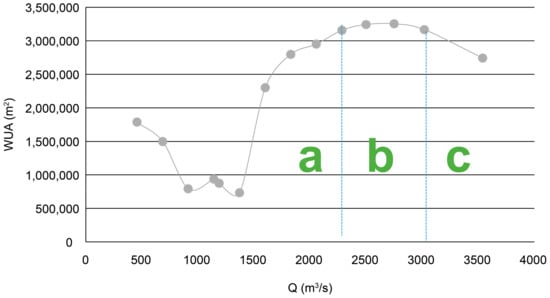
Figure 13.
WUA-Q curve for the study area.
The WUA-Q curve shown in Figure 13 peaks at Qp = 2750 m3/s and WUAp = 3,253,452 m2. The WUA value that met the coupling ecological demand of the typical area increased initially with the discharge and subsequently decreased. When the discharge was more than 1370 m3/s, WUA increased significantly with the discharge; when the discharge was between 2285–3020 m3/s, WUA increased slowly; once the discharge increased to more than 3020 m3/s, WUA decreases significantly.
3.3. Minimum Ecological Flow of the Study Area
Industrial, agricultural, and domestic water demand along the study area were comprehensively studied and social and economic water demand were estimated as shown in Table 4. In this paper, industrial water demand was calculated by the method of “average value (per 10 thousand yuan) of water consumption trend”; average value (per 10 thousand yuan) of water consumption data of 2016 is from the “Changjiang & Southwest Rivers Water Resource Bulletin”. Agricultural water demand mainly refers to the amount of water needed for irrigation, and this paper mainly considers the water demand of forest grass land, irrigated farmland crops and rain-fed agricultural crops. Domestic water demand forecast adopts the daily water quota method for urban residents; based on the data of the urban development planning target of the cities (counties) in the river section; the growth rate method is used to predict the population quantity.
Table 4.
Social and economic water demand in the study area.
The total social and economic water demand of the study area was 12,936.7 million m3, which is equivalent to a discharge of 410 m3/s. The Yangtze River is also an important shipping channel for cities located in west China. Thus, the discharge should guarantee navigation of 1000 ton-class ships all year round, and 2000–3000 ton-class during wet seasons. The study calculated that the water demand for shipping was 1540 m3/s. It is necessary to calculate the discharge for shipping demand and social and economic demand together. Therefore, the comprehensive water demand was calculated to be 1970 m3/s, while the corresponding Xiangjiaba releasing discharge was 1850 m3/s.
The study assigned equivalent weights for habitat protection, shipping, and economic and social water demand in Equation (2) for the multi-objective IPM calculation. Subsequently, the Hamming distance and Euclidean distance were calculated.
As shown in Table 5, when r was 1, the ecological flow requirement discharge of the fish spawning period was 2395 m3/s, which was 28.11% of the average annual flow (8520 m3/s, Zhutuo hydrological station). When r was 2, the ecological flow requirement discharge of the fish spawning period was 1890 m3/s, which was 22.18% of the average annual flow.
Table 5.
Ecological flow calculation based on the multi-objective method.
4. Conclusions
This study considered the National Nature Reserve for Rare and Endemic Fish in the Upper Reaches of the Yangtze River as the research area. Totally, 48 rare and endemic fishes belonging to 32 genera, 9 families, and 4 orders were analyzed, including first class nationally protected species such as Acipenser dabryanus and Psephurus gladius. The requirements for growth and breeding during the same period were considered in order to calculate the coupled habitat demand. The habitat demand for coupled flow velocity was 0.5–3 m/s, and for coupled water depth was 0.5–20 m. The optimum flow velocity demand was 1.2–1.5 m/s, and optimum depth demand was 5–12 m/s.
During ecological flow demand calculation, breakpoints on the WUA curves are generated by different effects of flow-dependent depth and velocity variations. WUA increases rapidly below the breakpoint because with flow increase, velocity remains quite low and, therefore, suitable. However, as depth increases above the breakpoint, velocity becomes unsuitable and flattens the WUA curve as an increase in depth is accompanied by a corresponding increase in velocity.
Considering the change in WUA as a function of discharge, three different areas can be recognized (Figure 13): an area (a), where the rate of WUA increase is higher, an area (b), where the curve appears linear with a small change in slope, almost constant with t; and an area (c) where WUA decreases significantly with an increase in discharge.
According to the existing evidence, the optimal ecological water demand of indicator species is determined by the peak flow or a turning point of the WUA-Q curve. This principle helps determine the coupled habitat requirements of the study area, which was 2750 m3/s (compared to Xiangjiaba’s releasing discharge of 2610 m3/s). This discharge provides the largest area that meets the needs of coupled habitat requirements for water depth and velocity, and guarantees the protection of quality and quantity of rare and endemic fish. Thus, the suitable flow range was 2285–3020 m3/s (compared to Xiangjiaba’s releasing discharge of 2170–2870 m3/s).
Ecological flow processes can provide essential protection for river ecosystems and serve as the basis for water resource allocation for economic and ecological water uses. A general multi-objective programming model was proposed in this study to determine minimum ecological flow for inland water bodies considering the trade-offs between water uses by humans and ecosystems. Ecological flow requirement considering shipping, social, and ecological demand was determined to be 2395 m3/s (r = 1) and 1890 m3/s (r = 2).
A good understanding of the river habitat and acknowledging the main fish species, is very important as it helps in designing efficient measures to conserve fish diversity. The analysis results of coupled habitat demand show significant correlations with the field survey of river habitat properties, confirming that the principle we selected, “minimization of habitat demand and maximization of ecological demand,” was appropriate for coupled habitat demand analysis.
The methods used in this study and results can provide a valuable reference for water resources planning and ecosystem protection in other rivers and lakes as well. However, coupled habitat demand calculation is still based on document retrieval and statistical analysis, and may not reflect the realistic demand of fish. Further detailed assessment of fish habitat demands should be conducted.
Acknowledgments
This paper was jointly supported by National Key Research and Development Project (2016YFC0402208, 2017YFC0404405), National Natural Science Foundation of China (Grant No. 51709276) and State Key Laboratory Simulation and Regulation Water Cycle in River Basin (2016CG05).
Author Contributions
All of authors contributed to the conception and development of this manuscript. Huan Wang conceived, designed the study, collected the data and wrote the paper. Hao Wang chose analysis model and organized the project implementation. Zhenchun Hao designed the system framework and developed the project implementation plan. Xu Wang participated in the results analysis and paper correction. Meng Liu and Yali Wang provided assistance in performing the calculations and producing the figures.
Conflicts of Interest
The authors declare no conflict of interest.
References
- Nilsson, C.; Reidy, C.A.; Dynesius, M.; Revenga, C. Fragmentation and Flow Regulation of the World’s Large River Systems. Science 2005, 308, 405–408. [Google Scholar] [CrossRef] [PubMed]
- Zhang, H.; Wang, C.Y.; Wu, J.M.; Du, H.; Wei, Q.W.; Kang, M. Physical habitat assessment of a remaining high-biodiversity reach of the upper Yangtze River, China. Appl. Ecol. Environ. Res. 2016, 14, 129–143. [Google Scholar] [CrossRef]
- Luo, P.; Apip, B.H.; Takara, K.; Xiong, Y.E.; Nover, D.; Duan, W.; Fukushi, K. Historical Assessment of Chinese and Japanese Flood Management Policies and Implications for Managing Future Floods. Environ. Sci. Policy 2015, 48, 265–277. [Google Scholar] [CrossRef]
- Tharme, R.E. A global perspective on environmental flow assessment: Emerging trends in the development and application of environmental flow methodologies for rivers. River Res. Appl. 2003, 19, 397–441. [Google Scholar] [CrossRef]
- Ahn, C.; Moser, K.F.; Sparks, R.E.; White, D.C. Developing a dynamic model to predict the recruitment and early survival of black willow (Salix nigra) in response to different hydrologic conditions. Ecol. Model. 2007, 204, 315–325. [Google Scholar] [CrossRef]
- Tennant, D.L. Instream flow regimens for fish, wild life recreation and related environmental resources. Fisheries 1976, 4, 359–373. [Google Scholar]
- Gippel, C.J.; Rhodes, T.; Gumiero, B.; Gaynor, M.M.; Stewardson, M.J.; Finlayson, B.L.; Marchant, R.; Jayasuriya, M.D.A.; Gan, K. Environmental impact of small water supply diversion weirs located on upland streams in Victoria, Australia. In Proceedings of the Victoria Falls Conference on Aquatic System, Elephant Hills, Victoria Falls, Zimbabwe, 15–19 July 1996; South African Society of Aquatic Scientists, Section 7A: Johannesburg, South Africa, 1996. [Google Scholar]
- Bovee, K.D. A Guide to Stream Habitat Analysis Using the Instream Flow Incremental Methodology; Instream Flow Information Paper: No. 12; Cooperative Instream Flow Service Group; US Fish and Wildlife Service: Fort Collins, CO, USA, 1982.
- Luo, P.; Zhou, M.; Deng, H.; Lyu, J.; Cao, W.; Takara, K.; Nover, D.; Schladow, S.G. Impact of forest maintenance on water shortages: Hydrologic modeling and effects of climate change. Sci. Total Environ. 2018, 615, 1355–1363. [Google Scholar] [CrossRef]
- Waddle, T.J. PHABSIM for Windows: User’s Manual and Exercises; U.S. Geological Survey: Fort Collins, CO, USA, 2001.
- Jowett, I.G. Instream flow methods: A comparison of approaches. Regul. River Res. Manag. 1997, 13, 115–127. [Google Scholar] [CrossRef]
- Boavida, I.; Santos, J.M.; Katopodis, C.; Ferreira, M.T.; Pinheiro, A. Uncertainty in predicting the fish-response to two-dimensional habitat modeling used field data. River Res. Appl. 2013, 29, 1164–1174. [Google Scholar] [CrossRef]
- King, J.M.; Tharme, R.E. Assessment of the Instream Flow Incremental Methodology, and Initial Development of Alternative Instream Flow Methodologies for South Africa; Report to the Water Research Commission, WRC Report No. 295:1:94; Freshwater Research Unit, Zoology Department, University of Cape Town: Rondebosch, South Africa, 1993. [Google Scholar]
- Jowett, I.G. Hydraulic geometry of New Zealand rivers and its use as a preliminary method of habitat assessment. Regul. River Res. Manag. 1998, 14, 451–466. [Google Scholar] [CrossRef]
- Acreman, M.C.; Farquharson, F.A.K.; McCartney, M.P.; Sullivan, C.; Campbell, K.; Hodgson, N.; Morton, J.; Smith, D.; Birley, M.; Knott, D.; et al. Managed Flood Releases from Reservoirs: Issues and Guidance; Report to DFID and the World Commission on Dams; Centre for Ecology and Hydrology: Wallingford, UK, 2000. [Google Scholar]
- Luo, P.; Apip, B.H.; Duan, W.; Takara, K.; Nover, D. Impact assessment of rainfall scenarios and land-use change on hydrologic response using synthetic Area IDF curves. J. Flood Risk Manag. 2018, 11, S84–S97. [Google Scholar] [CrossRef]
- Bain, M.B.; Stevenson, N.J. Aquatic Habitat Assessment: Common Methods; American Fishery Society: Bethesda, MD, USA, 1999. [Google Scholar]
- Baron, J.S.; Poff, N.L.; Angermeier, P.L.; Dahm, C.N.; Gleick, P.H.; Hairston, N.G.; Jackson, R.B.; Johnston, C.A.; Richter, B.D.; Steinman, A.D. Meeting ecological and societal needs for freshwater. Ecol. Appl. 2002, 12, 1247–1260. [Google Scholar] [CrossRef]
- Bunn, S.E.; Arthington, A.H. Basic principles and ecological consequences of altered flow regimes for aquatic biodiversity. Environ. Manag. 2002, 30, 492–507. [Google Scholar] [CrossRef]
- Santos, J.M.; Rivaes, R.; Boavida, I.; Branco, P. Structural microhabitat use by endemic cyprinids in a Mediterranean-type river: Implications for restoration practices. Aquat. Conserv. Mar. Freshw. Ecosyst. 2018, 28, 26–36. [Google Scholar] [CrossRef]
- He, Y.; Wang, J.; Lek, S.; Cao, W.; Lek-Ang, S. Structure of endemic fish assemblages in the Upper Yangtze River basin. River Res. Appl. 2011, 27, 59–75. [Google Scholar] [CrossRef]
- Shang, S.H. System Analysis of Water Resources: Methods and Applications; Tsinghua University Press: Beijing, China, 2006. [Google Scholar]
- Naiman, R.J.; Latterell, J.J.; Pettit, N.E.; Olden, J.D. Flow variability and the biophysical vitality of river systems. Comptes Rendus Geosci. 2008, 340, 629–643. [Google Scholar] [CrossRef]
- Shang, S.H. A multiple criteria decision-making approach to estimate minimum environmental flows based on wetted perimeter. River Res. Appl. 2008, 24, 54–67. [Google Scholar] [CrossRef]
- Botter, G.; Basso, S.; Porporato, A.; Rodriguez-Iturbe, I.; Rinaldo, A. Natural streamflow regime alterations: Damming of the Piave river basin (Italy). Water Resour. Res. 2010, 46, W6522. [Google Scholar] [CrossRef]
- Martínez-Capel, F.; García de Jalón, D.; Werenitzky, D.; Baeza, D.; Rodilla-Alamá, M. Microhabitat use by three endemic Iberian cyprinids in Mediterranean rivers (Tagus River basin, Spain). Fish. Manag. Ecol. 2009, 16, 52–60. [Google Scholar] [CrossRef]
- Cao, W.X; Liu, J.K. Institute of Hydrobiology, Chinese Academy of Sciences, Wuhan, China. Unpublished work, 1998. [Google Scholar]
- Christopher, J.G.; Michael, J.S. Use of wetted perimeter in defining minimum environmental flows. Regul. River Res. Manag. 1998, 14, 53–67. [Google Scholar] [CrossRef]
- SCYFIU (Sichuan Yangtze River Fisheries Investigation Unit). The Biology of the Sturgeon in Yangtze River and Their Artificial Propagation; Sichuan Science and Technology Publishing House: Chengdu, China, 1988. (In Chinese) [Google Scholar]
- Chen, X.H. The Biology of Acipenseriformes and Their Current Situation; Ocean Press: Beijing, China, 1988. (In Chinese) [Google Scholar]
- Li, Y.; Diao, X.; Liu, J. A preliminary study on the morphology, growth of juvenile Psephurus gladius on the upper reaches of the Changjiang (Yangtze) River and a survey of its spawning grounds. J. Southwest Agric. Univ. 1997, 19, 447–450. (In Chinese) [Google Scholar]
- Tu, M.Y.; Shen, Z. Natural reproduction and larvae development of Myxocyprinus asiaticus (Bleeker) in Minjiang River. Fish. Sci. Technol. 1981, 81, 19–27. (In Chinese) [Google Scholar]
- Tuo, Y. Artificial Propagation Techniques of Procypris rabaudi. Anhui Agri. Sci. Bull. 2008, 14, 141–142. (In Chinese) [Google Scholar]
- Li, W.J.; Wang, J.W.; Xie, C.X. Age structure and growth characteristics of Megalobrama pellegrini-an endemic fish living only in upper reaches of Yangtze River. J. Fish. Sci. China 2007, 14, 215–222. [Google Scholar]
- Shao, T.; Wang, Y.R.; Xu, S. Response relationship between flow changing and habitat indicator of Schizothorax prenanti. Resour. Environ. Yangtze Basin 2015, 24, 85–91. [Google Scholar]
- Liu, L.H.; Wu, G.X.; Wang, Z. Reproduction ecology of Coreius heterodon and Coreius guichenotj in the mainstream of the Yangtze River after the construction of Gezhouba Dam. Acta Hydrobiol. Sin. 1990, 14, 205–215. [Google Scholar]
- Wang, Q.Q. Fish Resources of Early Life and Their Early Development in Chishui Section of the Chishui River. Ph.D. Thesis, Central China Normal University, Wuhan, China, 2008. [Google Scholar]
- Tian, H.W.; Duan, X.B.; Xiong, X. Estimation of growth and population parameters of elongate loach (leptobotia elongata) in the upper reaches of the Yangtze River. Resour. Environ. Yangtze Basin 2013, 22, 1305–1311. [Google Scholar]
- Yu, Z.T.; Liang, Z.S.; Yi, B.L. The early development of Coreius heterodon and Coreius guichenoti. Acta Hydrobiol. Sin. 1984, 8, 371–388. [Google Scholar]
- Chen, Y.B.; Liao, W.G.; Peng, Q.D. A summary of hydrology and hydrodynamics conditions of four Chinese carp’s spawning. J. Hydroecol. 2009, 2, 130–133. [Google Scholar]
- Annear, T.C.; Conder, A.L. Relative bias of several fisheries instream flow methods. N. Am. J. Fish. Manag. 1984, 4, 531–539. [Google Scholar] [CrossRef]
- Bovee, K.D.; Milhous, R. Hydraulic Simulation in Instream Flow Studies: Theory and Techniques; Instream Flow Information Paper 5, US Fisheries and Wildlife Service, FWS:OBS-78:33; US Fisheries and Wildlife Service: Fort Collins, CO, USA, 1978.
- Vilizzi, L.; Copp, G.H.; Roussel, J.M. Assessing Variation in Suitability Curves and Electivity Profiles in Temporal Studies of Fish Habitat Use. River Res. Appl. 2004, 20, 605–618. [Google Scholar] [CrossRef]
- Hao, Z.C.; Shang, S.H. Multi-objective assessment method based on physical habitat simulation for calculating ecological river flow demand. J. Hydraul. Eng. 2008, 39, 557–561. (In Chinese) [Google Scholar] [CrossRef]
- Shang, S.H.; Hu, Q.F.; Lei, Z.D.; Yang, S.X. Ecological water use of forest-meadow land in a river valley in Xinjiang. In Proceedings of the International Symposium on Sustainable Water Resources Management and Oasis-Hydrosphere-Desert Interaction in Arid Regions, Beijing, China, 27–29 October 2005; Cheng, G.D., Lei, Z.D., Bengtsson, L., Eds.; Tsinghua University Press: Beijing, China, 2006; pp. 452–456. [Google Scholar]
- Vismara, R.; Azzellino, A.; Bosi, R.; Crosa, G.; Gentili, G. Habitat suitability curves for brown trout (Salmo truttafario L.) in the River Adda, Northern Italy: Comparing univariate and multivariate approaches. Regul. Rivers Res. Manag. 2001, 17, 37–50. [Google Scholar] [CrossRef]
- Van der Lee, G.E.M.; Van der Molen, D.T.; Van den Boogaard, H.F.P.; Van der Klis, H. Uncertainty analysis of a spatial habitat suitability model and implication for ecological management of water bodies. Landsc. Ecol. 2006, 21, 1019–1032. [Google Scholar] [CrossRef]
© 2018 by the authors. Licensee MDPI, Basel, Switzerland. This article is an open access article distributed under the terms and conditions of the Creative Commons Attribution (CC BY) license (http://creativecommons.org/licenses/by/4.0/).