Article

A Thermodynamical Approach for Evaluating Energy Consumption of the Nanofiltration-Crystallization Process on Selective Separation of Chloride and Sulfate

Beijing Key Laboratory of Membrane Materials and Engineering, Department of Chemical Engineering, Tsinghua University, Beijing 100084, China
*
Author to whom correspondence should be addressed.
Water 2018, 10(3), 331; https://doi.org/10.3390/w10030331
Submission received: 13 December 2017 / Revised: 31 January 2018 / Accepted: 7 March 2018 / Published: 16 March 2018

Abstract

:
Nanofiltration (NF) coupling processes have been applied to treat high salinity wastewater in many studies. The main reason that affects the industrialization of the wastewater treatment is the high cost, which is mainly caused by the energy consumption of the entire system. Therefore, how to evaluate the energy consumption of different process configurations is an important issue. In this work, a thermodynamical approach was explained in detail, which could be used for evaluating energy consumption for pressure-driven membrane processes (e.g., NF and reverse osmosis) and osmotically driven membrane processes (e.g., forward osmosis). The coupling process configurations of NF, reverse osmosis (RO) and crystallization (Cryst) were selected to evaluate the energy consumption for high NaCl and Na2SO4 concentration wastewater in this paper. Four different process configurations (NF-Cryst, RO-Cryst, RO-NF-Cryst, NF-RO-Cryst) were simulated using Aspen Plus. The processes were discussed using a thermodynamical approach with a customized NF model. The electrolyte Non-Random Two-Liquid (electrolyte-NRTL) model was employed to calculate the thermodynamic properties of the solutions. The simulation results showed that the energy consumption per cubic meter of treated water (Ewater) in NF-Cryst and NF-RO-Cryst processes were lower than that of RO-Cryst and RO-NF-Cryst. When c f , N a 2 S O 4 was low (e.g., 15 g·L−1), there was not much difference in energy consumption between NF-Cryst and NF-RO-Cryst processes. Moreover, the high efficiency of NF was revealed in the separation of salt and decrease in the energy consumption of the whole process.

1. Introduction

Among the wastewaters, high salinity wastewater is one of the most difficult to recycle due to its high salinity [1,2]. The main components are NaCl and Na2SO4 [3,4]. Treatment technology for high salinity water is still immature and energy consumption is relatively high [5]. Membrane technology is advantageous, with its low energy consumption and stable operation, and it is easy to scale up. The molecular weight cutoff (MWCO) of nanofiltration (NF) membrane is between the ultrafiltration (UF) membrane and the reverse osmosis (RO) membrane, about 200~2000 Da, and the active separation layer of NF membrane is charged. Hence, NF has a unique advantage in treating wastewater containing divalent and monovalent ions [6,7,8,9,10]. Recent treatment processes under development are coupled with NF, such as RO, FO, electrodialysis (ED), multistage flash (MS), multieffect distillation (MED), and ion exchange (IX), to decrease the overall energy consumption [11].
In order to recover salts from high salinity wastewater, it is common to adopt an integrated process to achieve salt separation and production. For example, NF is used to separate and concentrate the NaCl and Na2SO4 in high salinity wastewater, and afterwards the crystallization unit is used to produce sulfate. The concept of integrating membrane separation technologies with other unit operations was first proposed by Drioli et al. [12,13]. Drioli [14] utilized an UF-NF integrated membrane process for recovering CaCO3, NaCl and MgSO4·7H2O from NF retentate. It presented that seawater was first pretreated by UF and then concentrated by NF. The desired salts were finally obtained from the retentate by reaction crystallization or membrane crystallization. Curcio et al. [15] established a nanofiltration-membrane crystallization system for the recovery of sulphate from wastewater, which was generated by the production of nickel-metal hydride batteries. After pre-concentration by NF, a membrane crystallizer was used to produce Na2SO4 crystals of uniform size distribution. Wei et al. [16] used ED stacks consisting of monovalent selective ion-exchange membranes to treat seawater concentrate. Integrating with NF was, and would be a key strategy to lower the cost of current desalination processes [11]. Moreover, under different conditions, NF might be used to remove natural organic matter (NOM) [17,18], and recycle water from organized industrial zones (OIZ) [19]. Therefore, it is very important to evaluate different integrated membrane processes under certain criteria. Based on previous work reported, four different process configurations (NF-Cryst, RO-Cryst, RO-NF-Cryst, NF-RO-Cryst) were designed for separation and concentration, followed by the traditional crystallization operation to recover the sulfate from the wastewater in this paper.
To optimize the energy cost of RO, Zhu et al. [20] calculated the thermodynamic properties of the solutions based on thermodynamic restrictions. In the development of membrane integration processes, process simulation softwares like Aspen Plus [21] are powerful tools to help develop, design, analyze, and optimize a new industrial process. However, compared to other traditional unit operations, membrane separation technology is a relatively new separation operation, resulting in the lack of membrane process simulation. Customized membrane distillation unit models with Aspen Plus software were applied by Chang et al. [22]. Sharifian used a similar approach to simulate the gas separation process using hollow fiber membranes [23]. In both cases, the unit operation models for the membrane separation process were designed using the Formula Translation (FORTRAN) interface provided by Aspen Plus. Up to now, no work has been done on the simulation calculation of the membrane integration process for treating high salinity wastewater.
In the preceding paper [24], a thermodynamical approach for evaluating energy consumption of the FO process has been proposed. Zeng compared FO process performance using different draw solutes. In this paper, a much detailed approach was discussed and adopted to evaluate energy consumption of NF or RO integrated with crystallization. The process was employed to recover sulfate from high salinity wastewater containing mainly NaCl and Na2SO4. Meanwhile, relatively pure by-product NaCl solution obtained as permeate through the membrane separation process could be used as the feed of chlor-alkali industry. For this purpose, an operation model describing the membrane separation process was developed. Thermodynamic data such as salt solubility and osmotic pressure involved in the simulation, was calculated by the electrolyte Non-Random Two-Liquid model (electrolyte NRTL). The influence of concentration and concentration ratio of NaCl to Na2SO4 ( c f , N a C l / c f , N a 2 S O 4 ) on the membrane integration process was investigated. Meanwhile, different process configurations were designed and energy consumption was evaluated under different circumstances.

2. Materials and Methods

2.1. Thermodynamical Approach for Membrane Process

The main task of this study was to evaluate energy consumption under ideal conditions. Hence, membranes are assumed to be perfect, and processes are operated close to thermodynamic equilibrium. Consequently, the concentration polarization effect and the pressure drop effect were not considered for simplicity. For the FO process, membranes were considered perfect so that salt could be fully rejected.
For pressure-driven membrane processes and osmotically driven membrane processes, the mass transfer stopped when osmotic equilibrium is reached. The process is shown in Figure 1.
The model for the membrane process was built with the FORTRAN programming interface from the Aspen Plus software. The initial concentrations were known and given by the simulation flowsheet. The permeate and retentate (or draw and feed solution) concentrations were determined when the pressure difference was zero, as shown by Equation (1):
Δ P = Δ π = ( π 1 π 2 )
where ΔP is the applied pressure difference, and Δπ is the osmotic pressure difference which is the difference between π1 (feed solution or retentate) and π2 (draw solution or permeate).
By changing the amount of water migrating from the retentate (or feed solution) to permeate (or draw solution), osmotic pressure equilibrium is reached. The osmotic pressure is expressed as a function of the activity of water, which could be obtained by the following equation:
π = R T V A ¯ ln a A
where R is the gas constant which is 8.314 J·mol−1·K−1, and T is the temperature (K). V A ¯ is the partial molar volume of water and aA represents the activity of water, which is calculated by the electrolyte NRTL model. In the model, binary parameters are a and τ. a is set to 0.2 while τ is calculated by the following equation:
τ = C + D T + E [ T 0 T T + ln ( T T 0 ) ]
where T0 is 273.15 K. C, D, and E are adjustable parameters which could be regressed by experimental thermodynamic data.

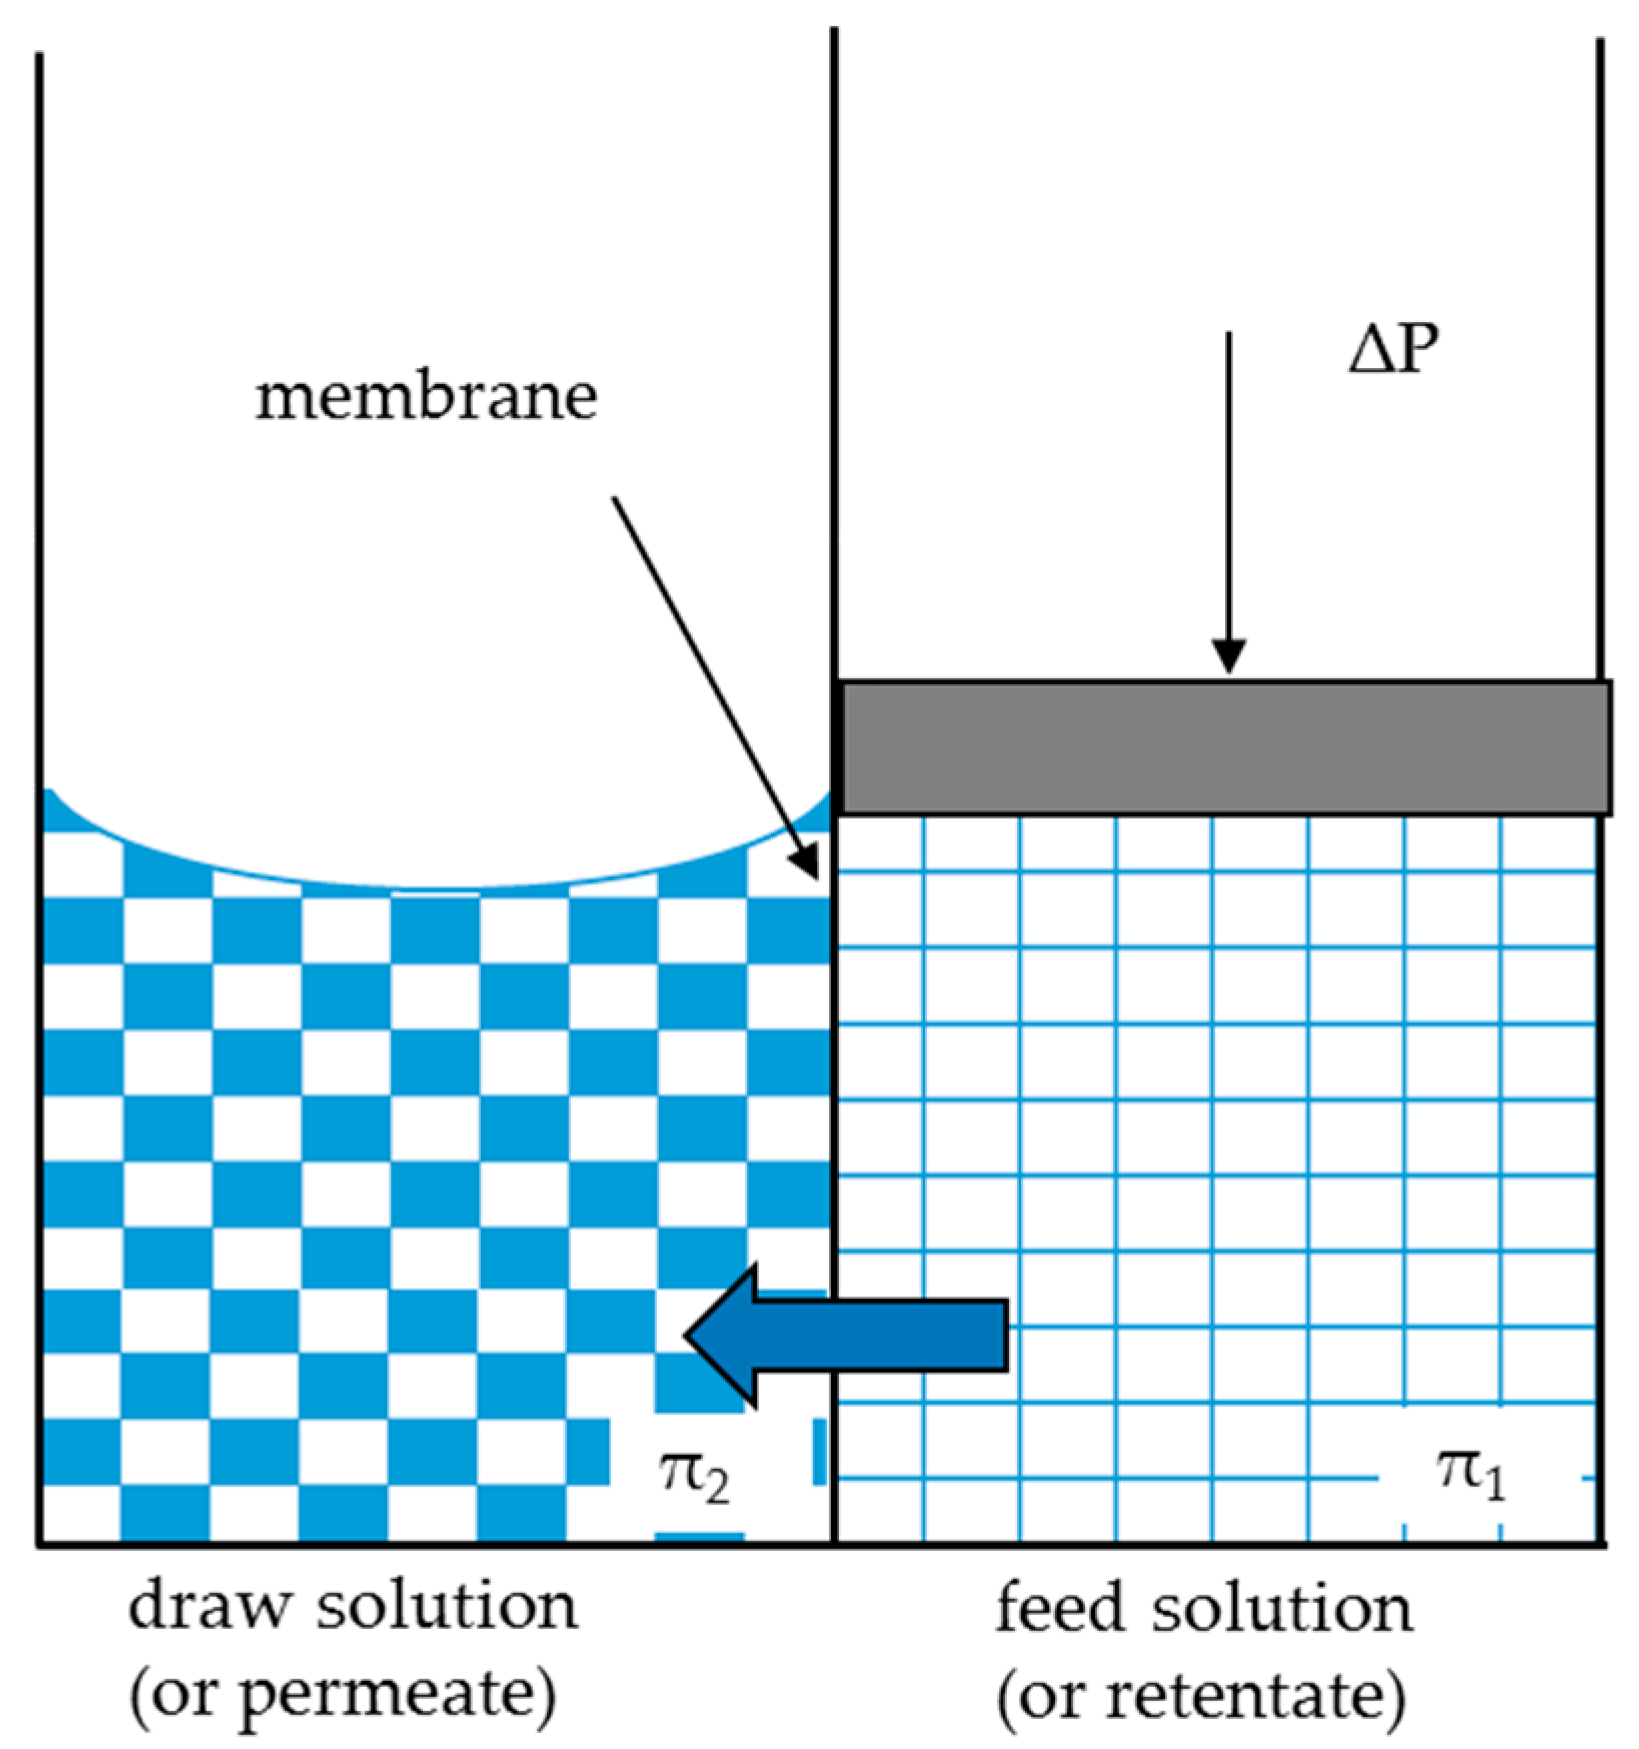
2.1.1. FO Unit Model

When the membrane process is osmotically driven, take FO for example, which is proposed in the preceding paper [24]. There is no applied pressure, and a high concentration of draw solution is used to obtain water from the feed solution. Therefore, for the FO process, ΔP = 0, the thermodynamical equilibrium is reached when Δπ = π1π2 = πfeedπdraw = 0.

2.1.2. NF Unit Model

When the process is pressure-driven, take NF for example, water migrates through a membrane from the retentate to the permeate under applied pressure. Therefore, the thermodynamical equilibrium is reached when ΔP = Δπ = πrπp. Where ΔP represents the transmembrane pressure difference, πr is the osmotic pressure of the retentate while πp is the osmotic pressure of the permeate.
The NF unit model has three parameters: operating pressure (P), Cl rejection ( R Cl ), SO42 rejection ( R SO 4 2 ). NF membranes have a low R Cl and a high R SO 4 2 for single salt solutions [25]. For binary salt solutions, NF membranes present slightly higher R SO 4 2 and much lower R Cl [26]. When the Na2SO4 concentration ( c N a 2 S O 4 ) was over a certain value, a negative R Cl is even observed [27]. Hence, under different total salt concentrations and different concentration ratios of NaCl over Na2SO4 ( c f , N a C l / c f , N a 2 S O 4 ), the NF membrane might present a different R SO 4 2 and R Cl . In this study, the R SO 4 2 and R Cl of the simulation NF process were set based on experimental data according to a previous study [28].
The RO unit operation also used the customized NF model to simulate the energy consumption, while only changing the three main parameters. The operating pressure and rejection were set higher.

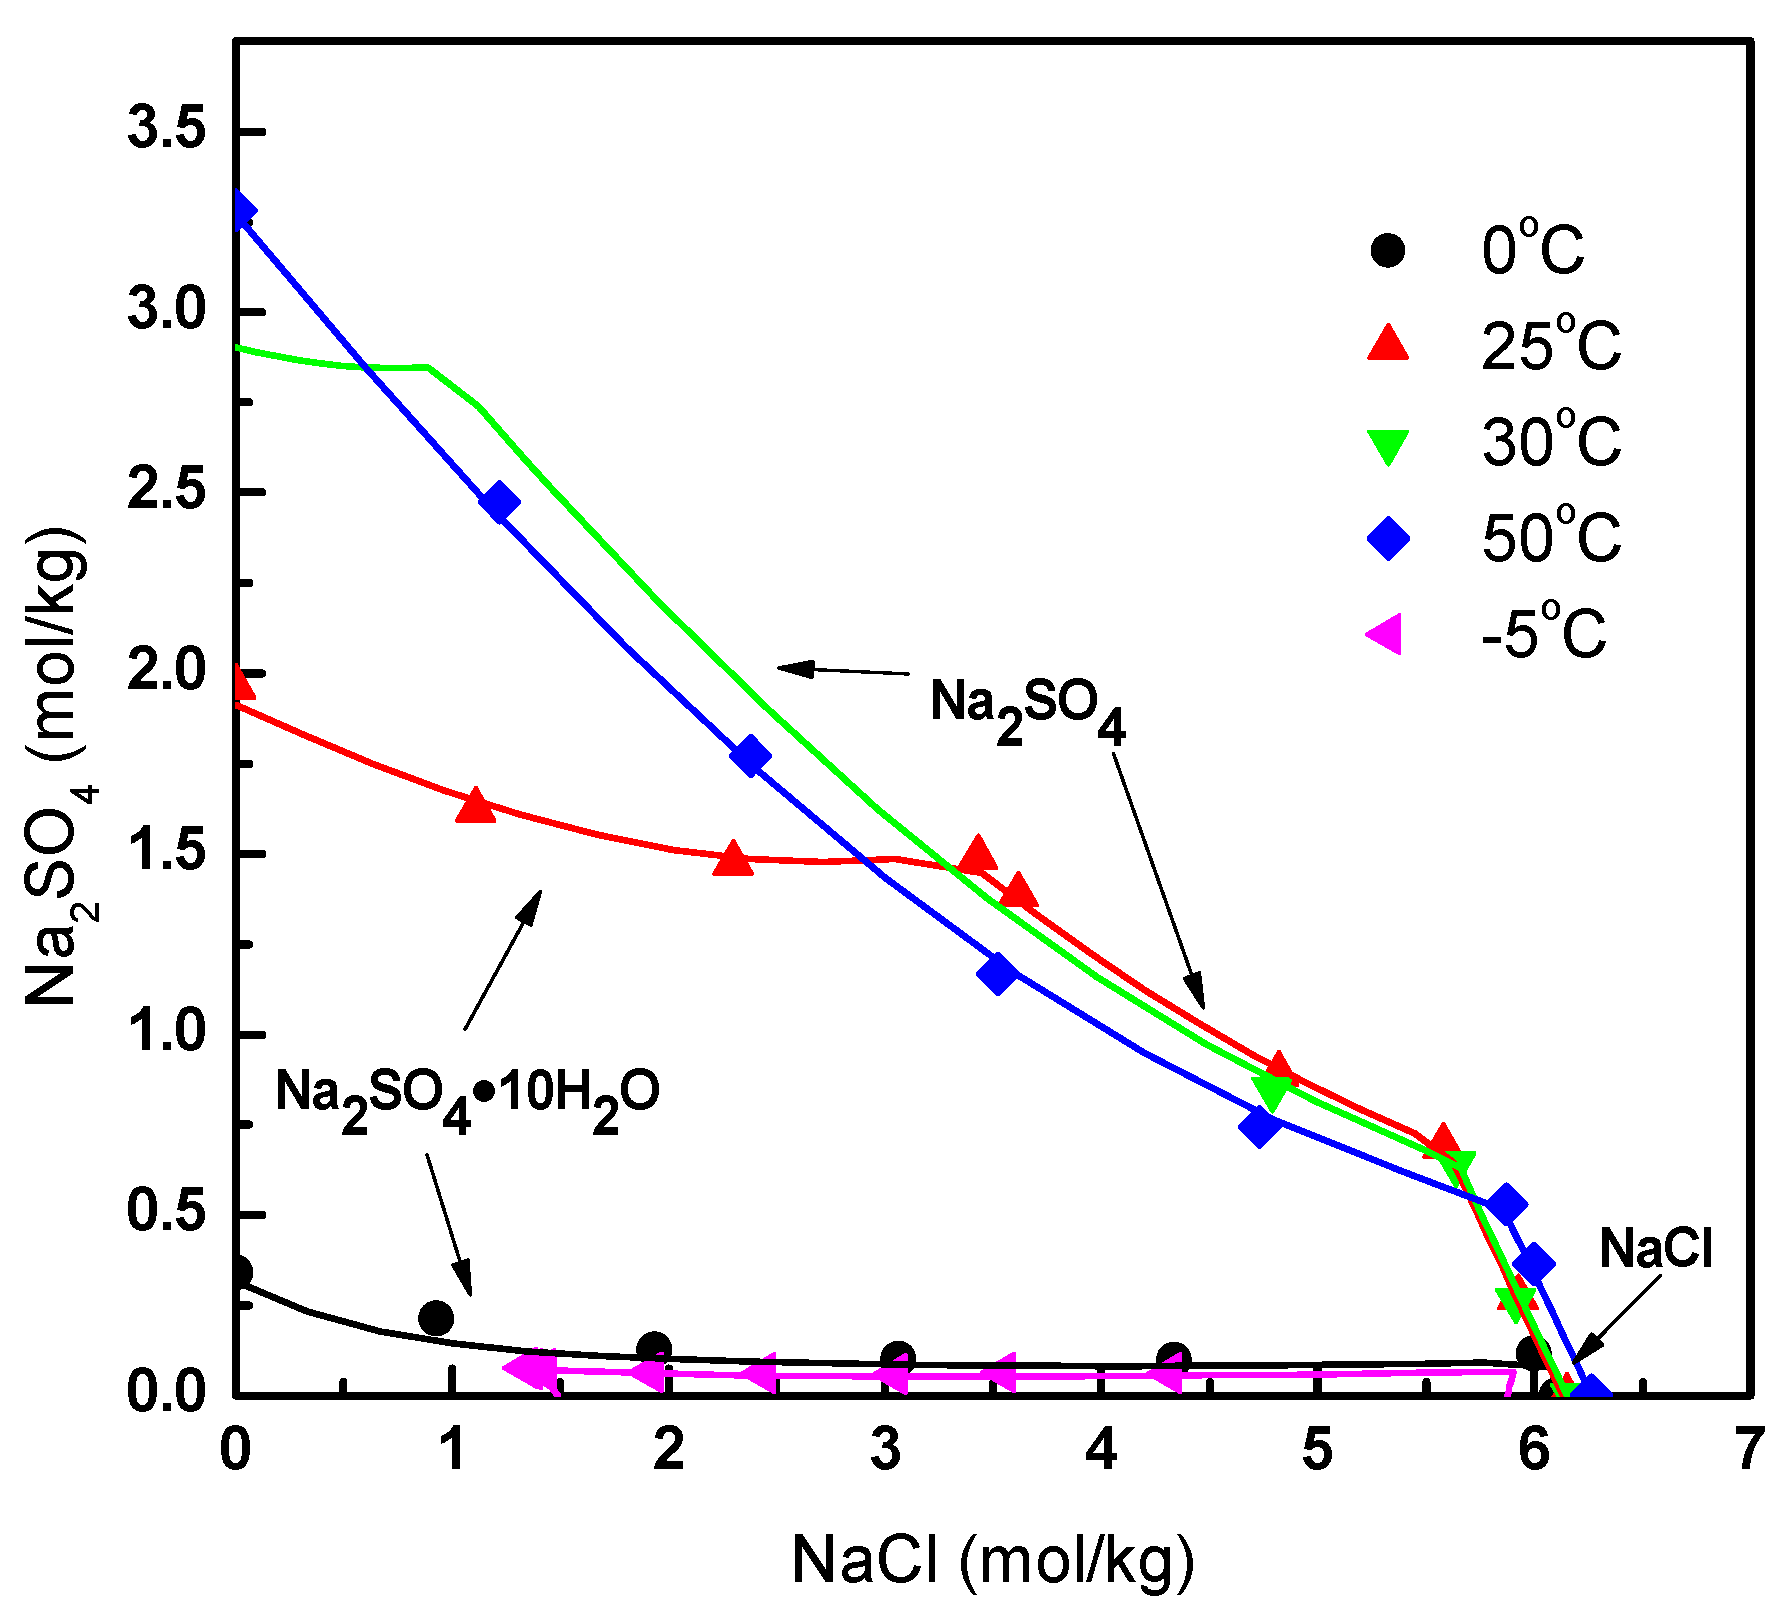
2.2. Thermodynamic Model
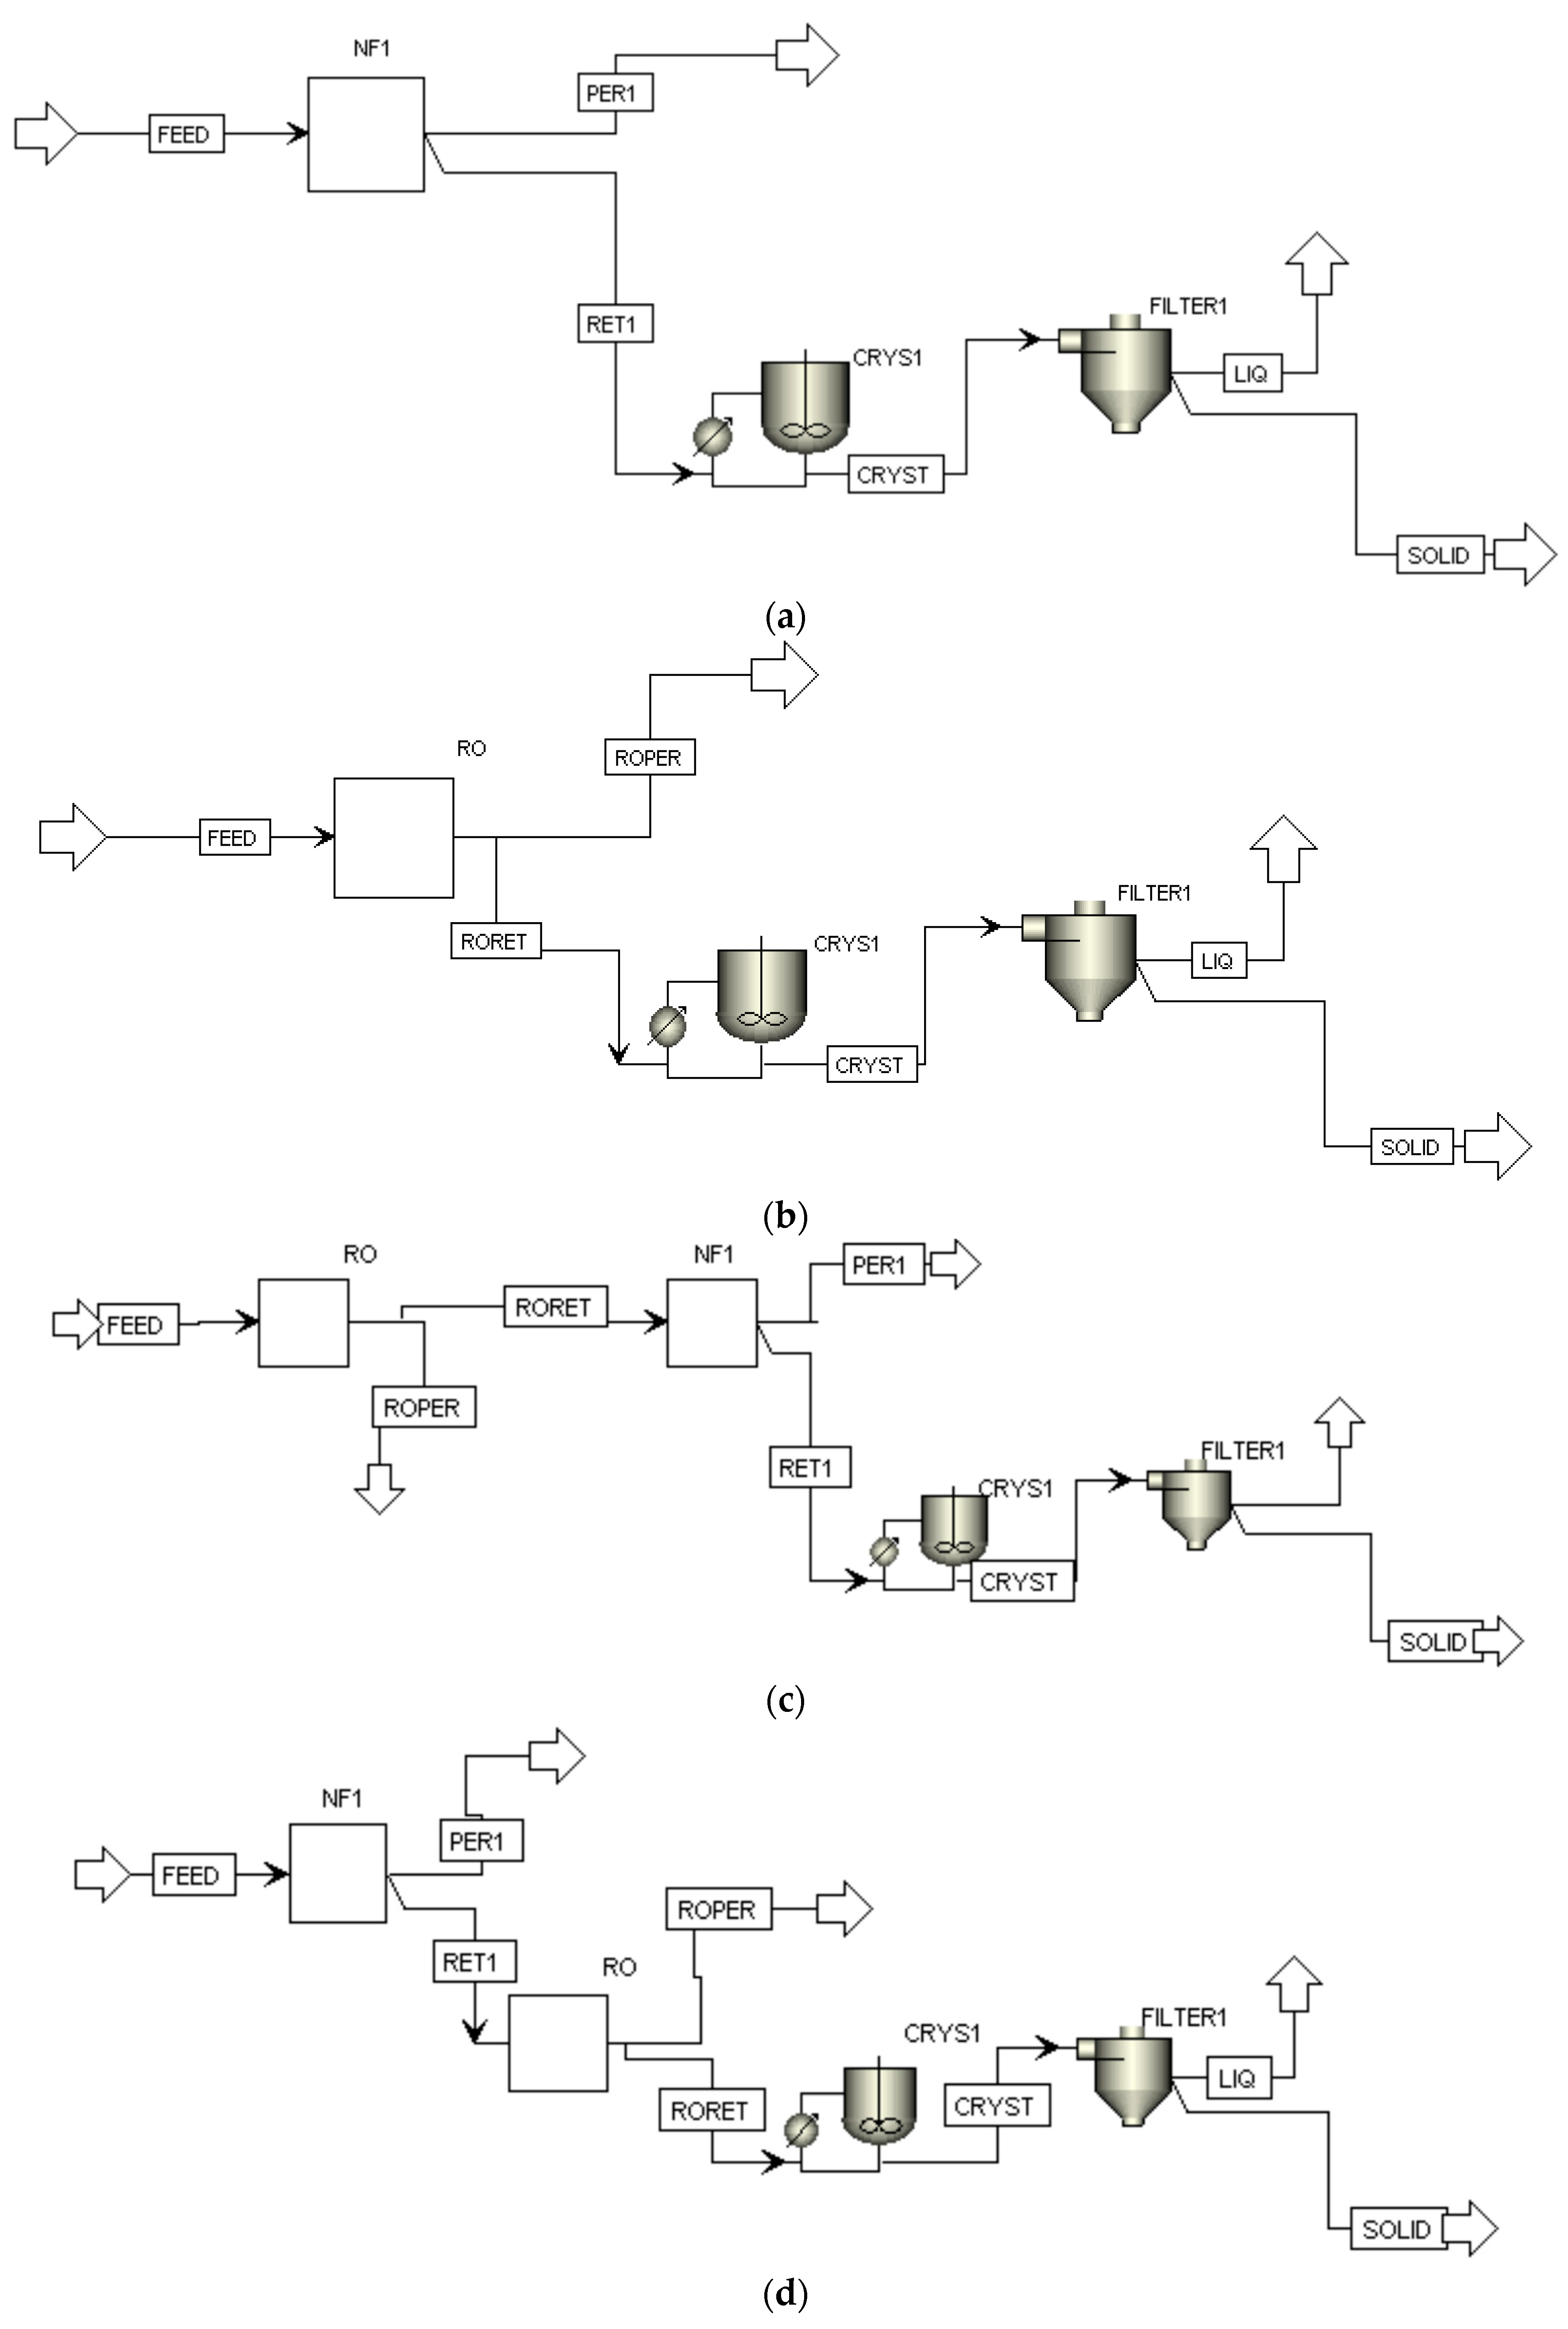
In the simulation process, the thermodynamic model was used to calculate physical properties such as osmotic pressure and solubility. Because the parameters of Aspen on the solubility calculation have a large deviation, the model parameters of NaCl-Na2SO4 system were regressed using the solubility data in the literature [29,30]. Regression parameters included the NRTL model interaction parameters of electrolytes between Na+, Cl–H2O; Na+, SO42−–H2O; Na+, Cl–Na+, and SO42− ions, and the solubility products of Na2SO4·10H2O, Na2SO4 and NaCl. The solubility product (Ksp) is a function of temperature (T) [29,30]:
ln ( K s p ) = A + B / T + C × ln ( T ) + D × T
The calculated solubilities using the new model parameters were compared with the experimental data in Figure 2. Based on the reported results in the literature, it could be seen that sulfate existed in the form of sodium sulfate decahydrate (Na2SO4·10H2O) at a low temperature. As the temperature or NaCl concentration increased, sulfate existed in Na2SO4. At low temperature, the Na2SO4·10H2O solubility decreased with increasing NaCl concentration due to the common ion effect. Except for the case when the NaCl concentration was particularly high (over 6 mol·kg−1), Na2SO4·10H2O could be recovered from NaCl–Na2SO4 system by freeze-crystallization. In addition, the calculated results of the model were in good agreement with the experimental data, which also showed that it is feasible to use the electrolyte NRTL model to calculate the thermodynamic properties of the system.

2.3. Process Design

For a given feed concentration, the max retentate concentration is reached when the process is operated close to the thermodynamic limit. Assuming that the concentration process is a batch operation, the component rejection remains constant. Wang [31] used an equation to calculate the final concentration multiple:
c f = c 0 ( V 0 / V f ) R
where cf is the final feed concentration, and c0 is the initial feed concentration. V0 is the initial volume of the feed and Vf is the final volume of the feed. R is the rejection and V0/Vf is the concentration multiple.
For the treatment of wastewater, besides the use of NF for concentration and separation, RO is commonly used for concentration. Therefore, NF, RO, Cryst were combined to design a proper process configuration. Figure 3a shows the most classical type of process configuration, which is wastewater treated by NF, and retentate further treated by crystallization (the NF-Cryst process) [13]. This process is simple and efficient, through which NF can separate chloride and sulfate and concentrate feed, while crystallization isolates Na2SO4·10H2O from the retentate. The RO-Cryst process (Figure 3b) was designed to highlight the difference between using NF and RO as the first membrane unit for concentration. The RO-NF-Cryst (Figure 3c) and NF-RO-Cryst (Figure 3d) processes were employed to discuss how additional membrane unit (NF or RO) affects the whole process. The influence of different process configurations on system energy consumption, salt production and other factors are explored in Figure 3a–d.
Figure 3a shows the NF-Cryst process configuration. After the wastewater was concentrated and separated by NF, the NF retentate was imported to the crystallization unit to produce sulfate. In Figure 3b, the NF unit in the previous configuration was replaced by RO, and the crystallizer was treated on the RO retentate. RO is very commonly used in wastewater treatment due to its lower cost and higher operating pressure, without selective separation on ions of different valence. Thus, RO and NF were compared to determine whether higher operating pressure could achieve higher V0/Vf. The third configuration (RO-NF-Cryst) is shown in Figure 3c. The wastewater was firstly preconcentrated by RO, and then the RO retentate was further concentrated by NF, lastly being treated by the crystallization unit. For the fourth configuration (NF-RO-Cryst) shown in Figure 3d, the NF retentate was further concentrated by RO and finally crystallized. Compared with the former two configurations, the latter two mainly highlighted the influence of more complex process configuration on total energy consumption.
In the simulation process, the membrane unit operation consumed electrical energy to drive the high-pressure pump, and the crystallization unit used the electric energy to cool the solution down. In addition, low-pressure pumps were also required to transport the solution in the process. However, the energy consumption of the low-pressure pumps was not considered in this study. The energy consumption of a low-pressure pump is much lower than that of a high-pressure pump or a crystallizer, and the energy consumption of the low-pressure pump of each process is generally similar. Hence, neglecting the energy consumption of the low-pressure pump did not have a great impact on the result. For the operation of the membrane unit, the energy recovery procedure was not considered, and the operating pressure was maintained at a fixed pressure. The high-pressure pump worked on the whole feed; this part of the energy consumption could be calculated using the following formula:
W m e m = P × V 0
where P is the system pressure and V0 is the initial volume of the feed. For the energy consumed by the crystallizer, the following formula was used:
W c r y s t = Q d C O P
where Qd is the heat transferred for cooling and the Coefficient of Performance (COP) is set constantly as 4.5. The energy of the whole process containing high-pressure pump and crystallizer is expressed as:
W t o t a l = W m e m + W c r y s t

3. Results

3.1. Effect of the Feed Concentration on NF-Cryst Process

Firstly, the NF-Cryst process configuration was discussed. The operating pressure of NF was set at 4 MPa. Rejection towards a certain ion depends on the flux and each component concentration. The Cl and SO42− ion rejections were estimated based on experiment data. Assuming that the flux was 50 L·m−2·h−1, the relevant rejections used in the simulation are given in Table 1. The table shows the apparent rejection. During the concentration process, the salt concentration was constantly changing, and the flux of the permeate decreased as the concentration proceeded. All of these factors resulted in varieties in the actual rejection. For simplicity, the rejections set in the simulation process did not change.

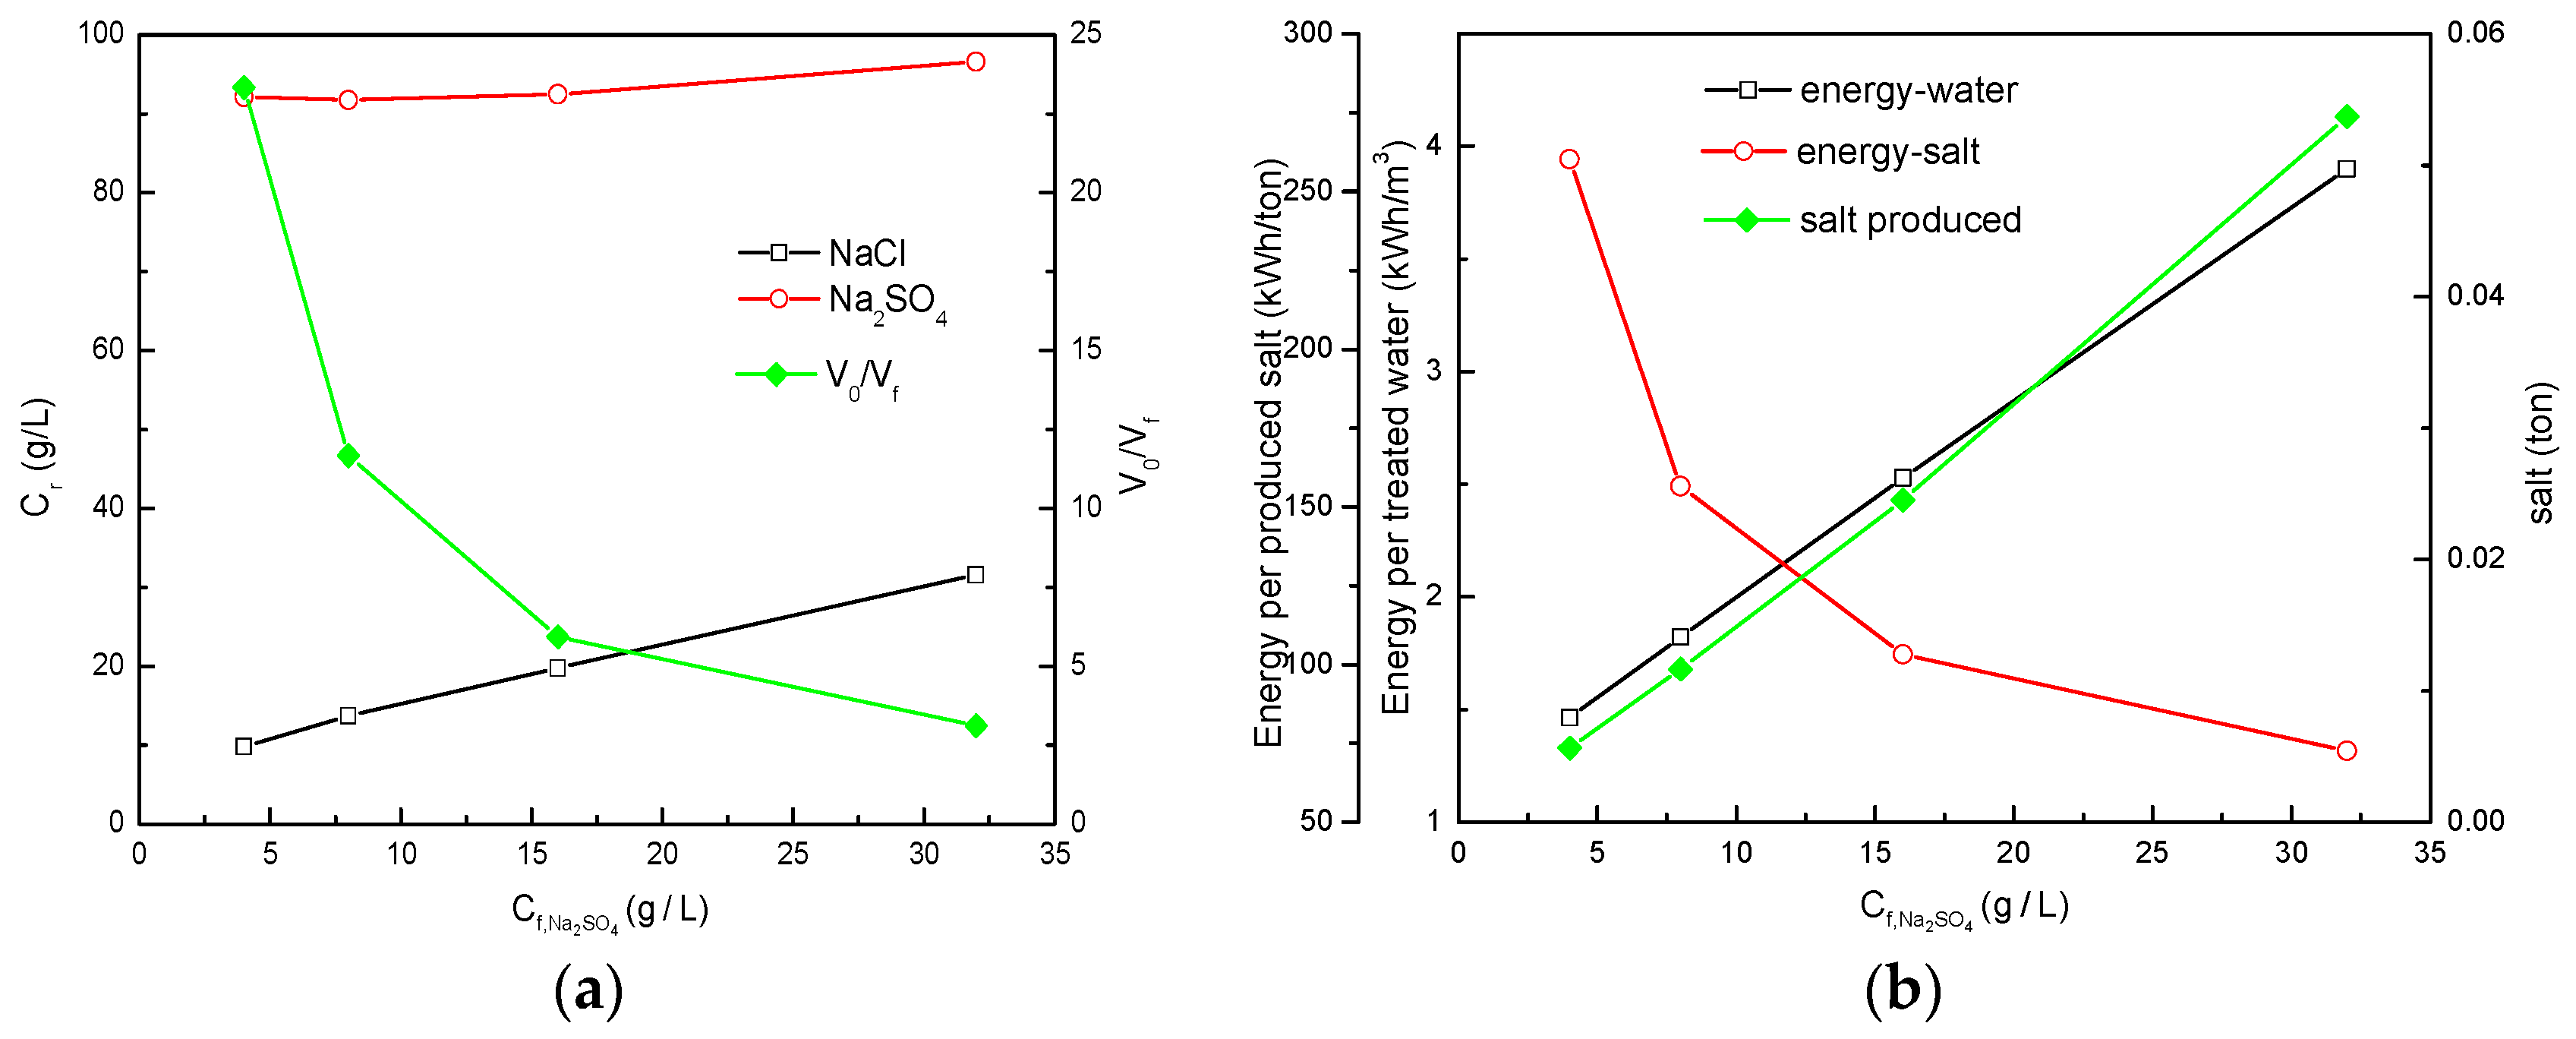
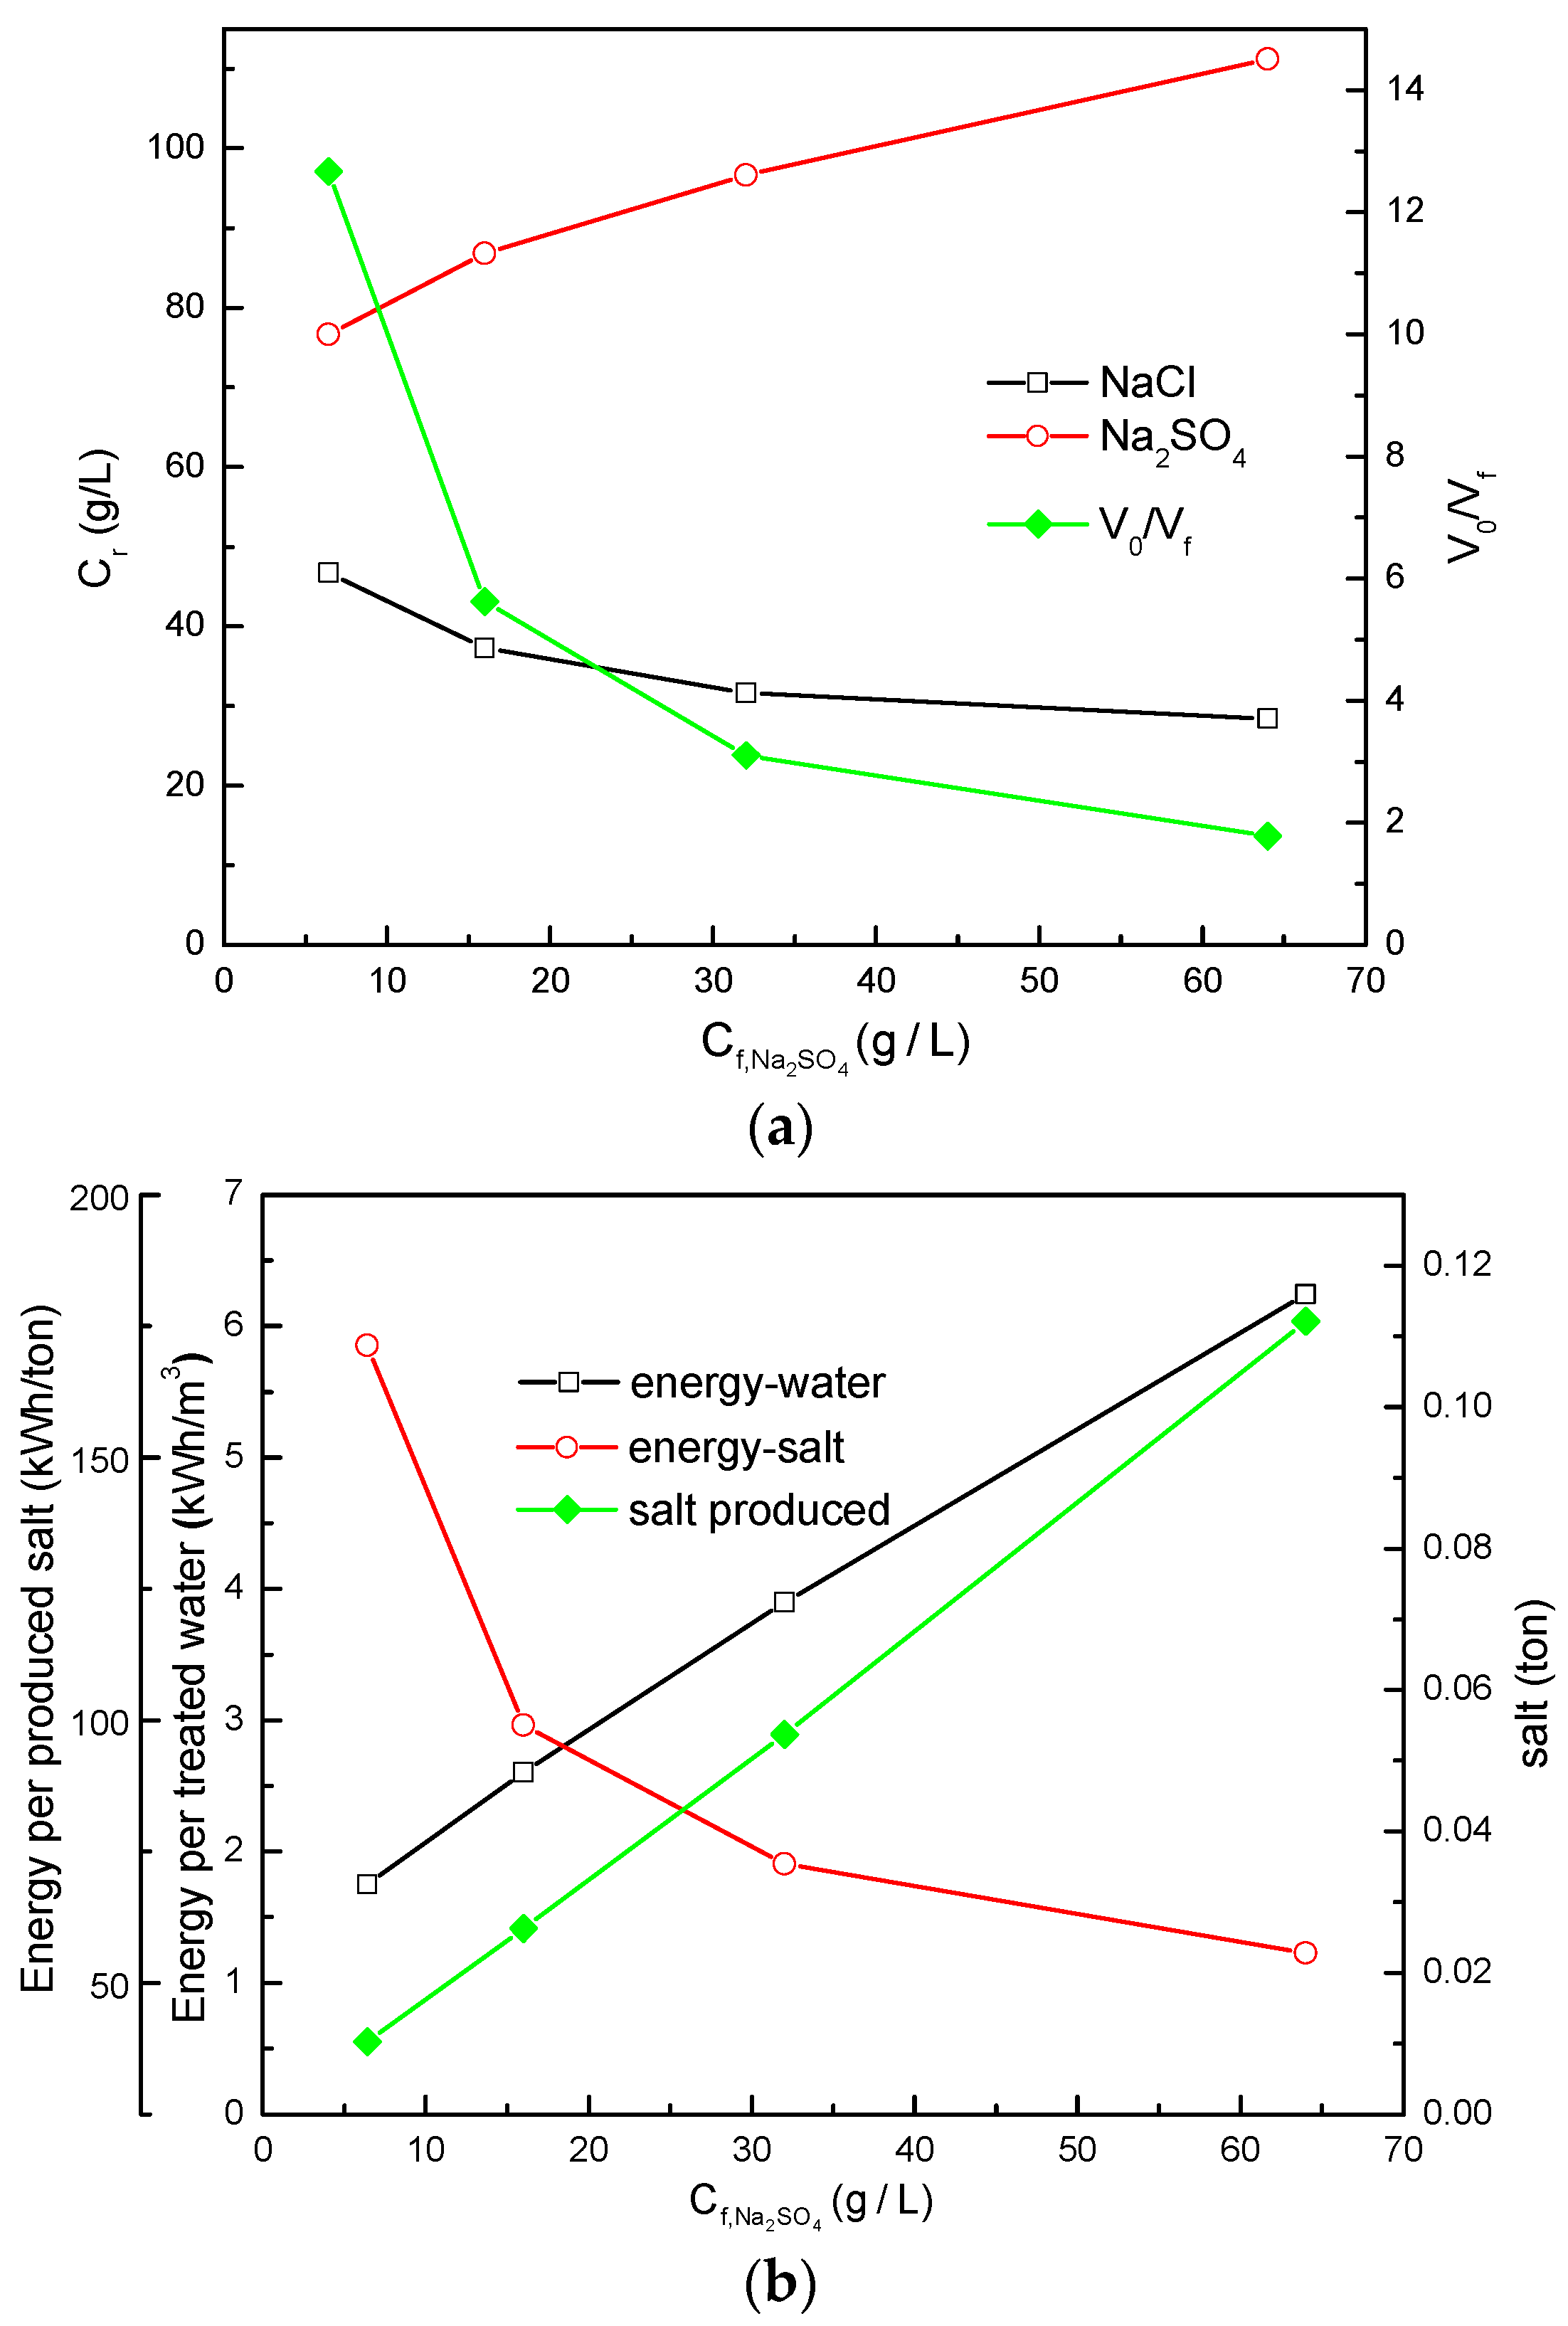
3.1.1. NF-Cryst Process Configuration Results under Different Total Salt Concentrations

Figure 4a shows the max V0/Vf and retentate concentration of NaCl ( c r , N a C l ) and Na2SO4 c r , N a 2 S O 4 ) as a function of the feed concentration at a fixed c f , N a C l / c f , N a 2 S O 4 . It could be seen that V0/Vf decreased as c f , N a 2 S O 4 increased, which was caused by the higher osmotic pressure of the feed solution at high salt concentrations. Although c f , N a 2 S O 4 increased from 4 to 32 g·L−1, c r , N a 2 S O 4 changed slightly and only increased from 92.1 to 96.6 g·L−1. When c f , N a C l increased from 4 to 32 g·L−1, the concentration difference of NaCl on both sides did not change much, therefore c r , N a 2 S O 4 reached the osmotic pressure balance under identical operating pressure. For NaCl concentration process, the salt concentration in the feed solution increased continuously. In terms of the ratio of Na2SO4 and NaCl concentration in the final retentate, when c f , N a C l / c f , N a 2 S O 4 was fixed, the separation efficiency of the two salts gradually became worse as the salt concentration increased.
Figure 4b shows the salt production per ton of wastewater treated by NF-Cryst at different feed concentrations, as well as the Ewater and energy consumption per ton of salt production (Esalt) under fixed c f , N a C l / c f , N a 2 S O 4 . With the increase of c f , N a 2 S O 4 , the amount of obtained Na2SO4·10H2O crystal also increased. Although c r , N a 2 S O 4 was similar at different concentrations before crystallization, the amount of retentate was more with higher c f , N a 2 S O 4 , resulting in a larger amount of salt production. The crystallization energy consumptions resulted in higher Ewater. However, from the point of salt production energy consumption, the energy consumption of NF per ton of salt became lower, and hence Esalt decreased.

3.1.2. NF-Cryst Simulation Results under Different c f , N a C l / c f , N a 2 S O 4

As shown in Figure 5a, c r , N a 2 S O 4 decreased rapidly from 12.7 times of the initial concentration to 1.8 when c f , N a C l / c f , N a 2 S O 4 was changed under fixed c f , N a C l . c r , N a 2 S O 4 increased, while c r , N a C l decreased. As can be seen from Table 1, R Cl decreased with the increase of c f , N a 2 S O 4 , and even negative rejection was achieved, which led to the decrease of c r , N a C l with the increase of c f , N a 2 S O 4 . In general, at a fixed c f , N a C l , the separation efficiency was better when c f , N a 2 S O 4 was higher.
From the perspective of energy consumption, as shown in Figure 5b, the increase of c f , N a 2 S O 4 resulted in the increase of Ewater and the decrease of Esalt. Under the condition of high Na2SO4 concentration, c r , N a 2 S O 4 increased and the amount of retentate increased. As a result, the salt production increased with the increase of c f , N a 2 S O 4 . In the feed containing 32 g·L−1 NaCl and 64 g·L−1 Na2SO4, up to 0.112 tons of Na2SO4·10H2O could be produced from one ton of feed with Esalt at 55.7 kWh/ton or Ewater 6.24 kWh/m3.

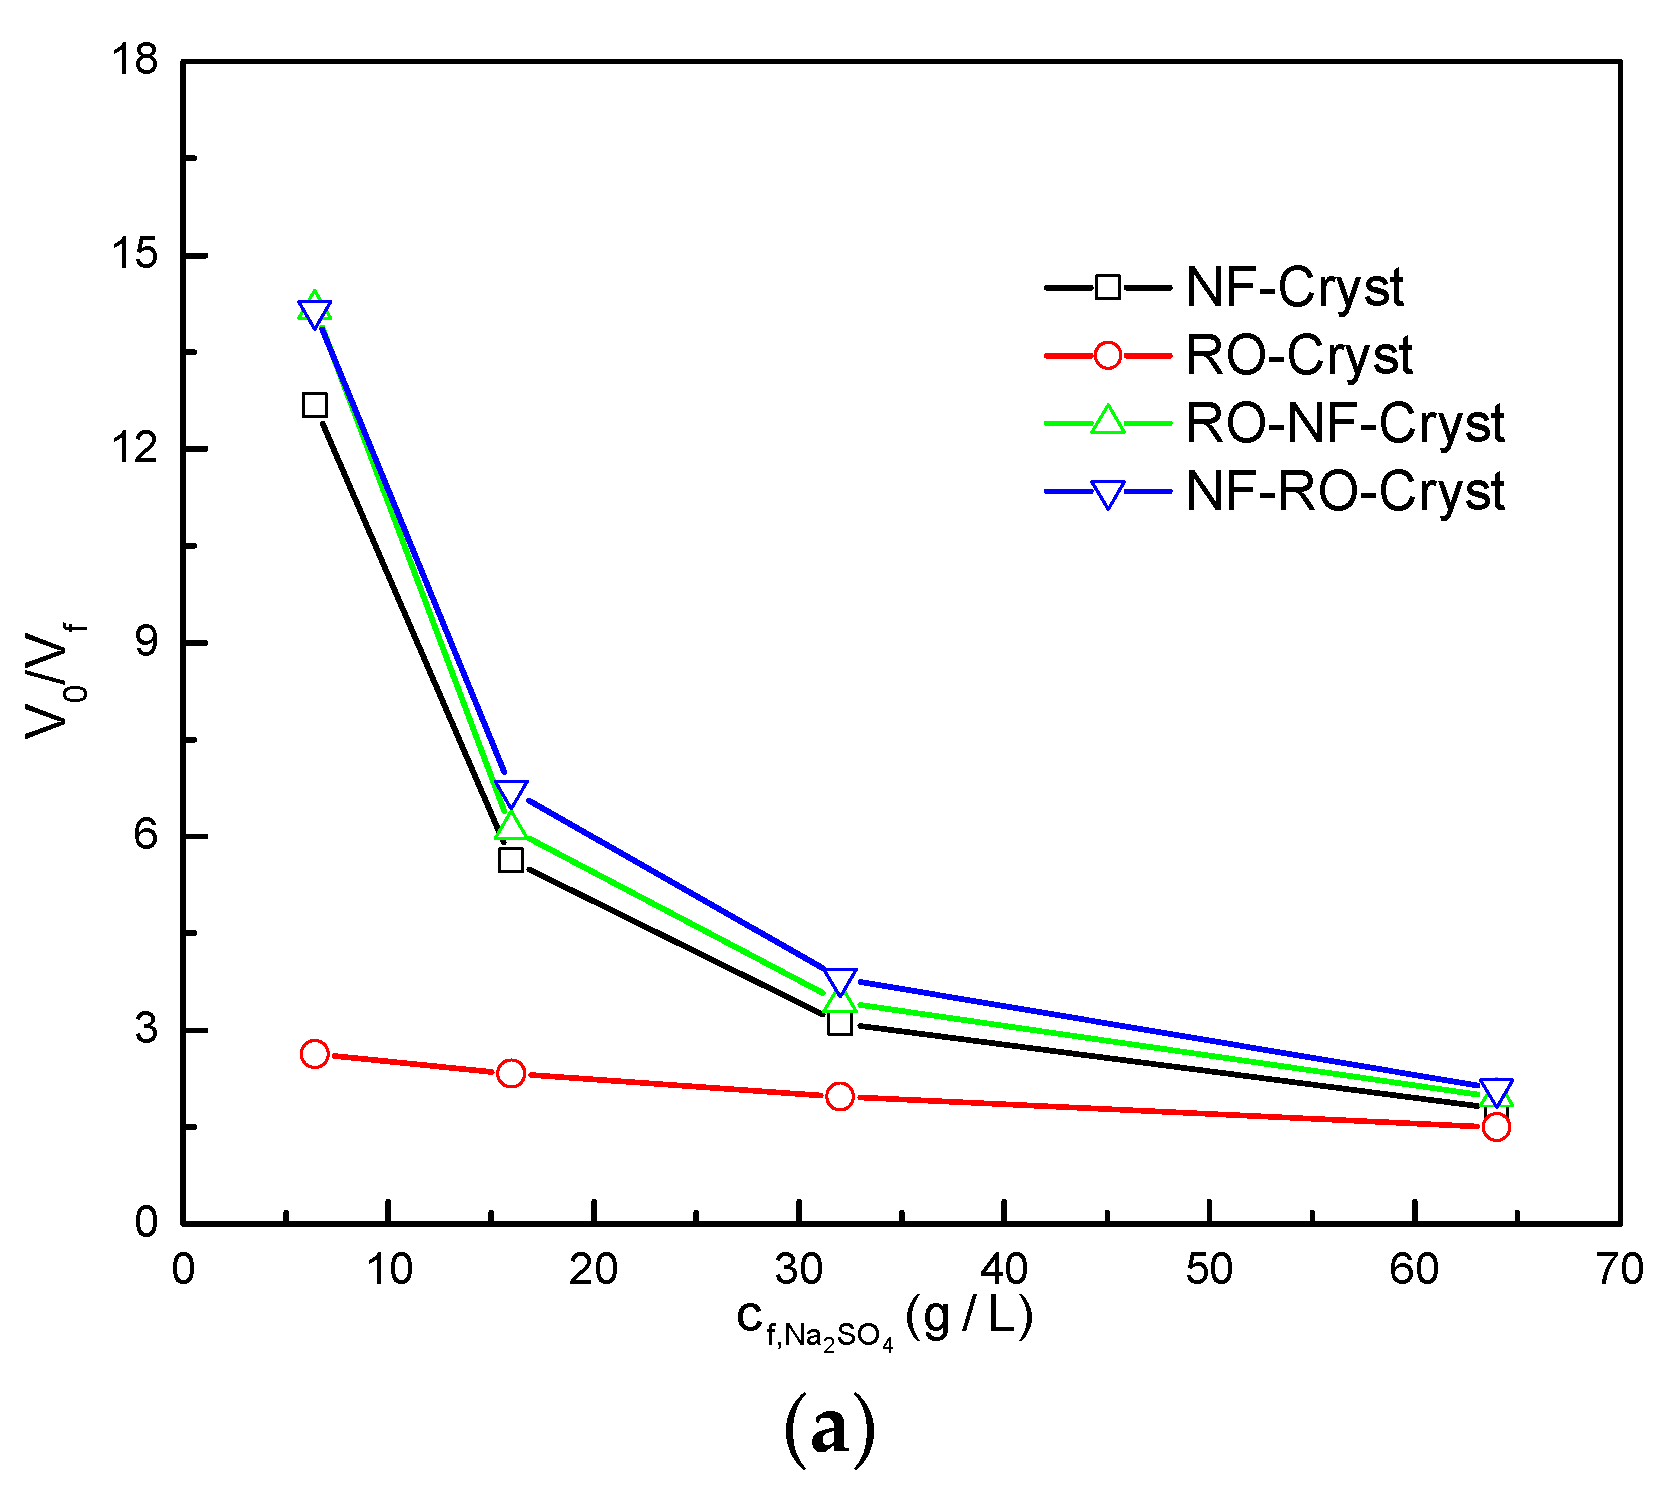
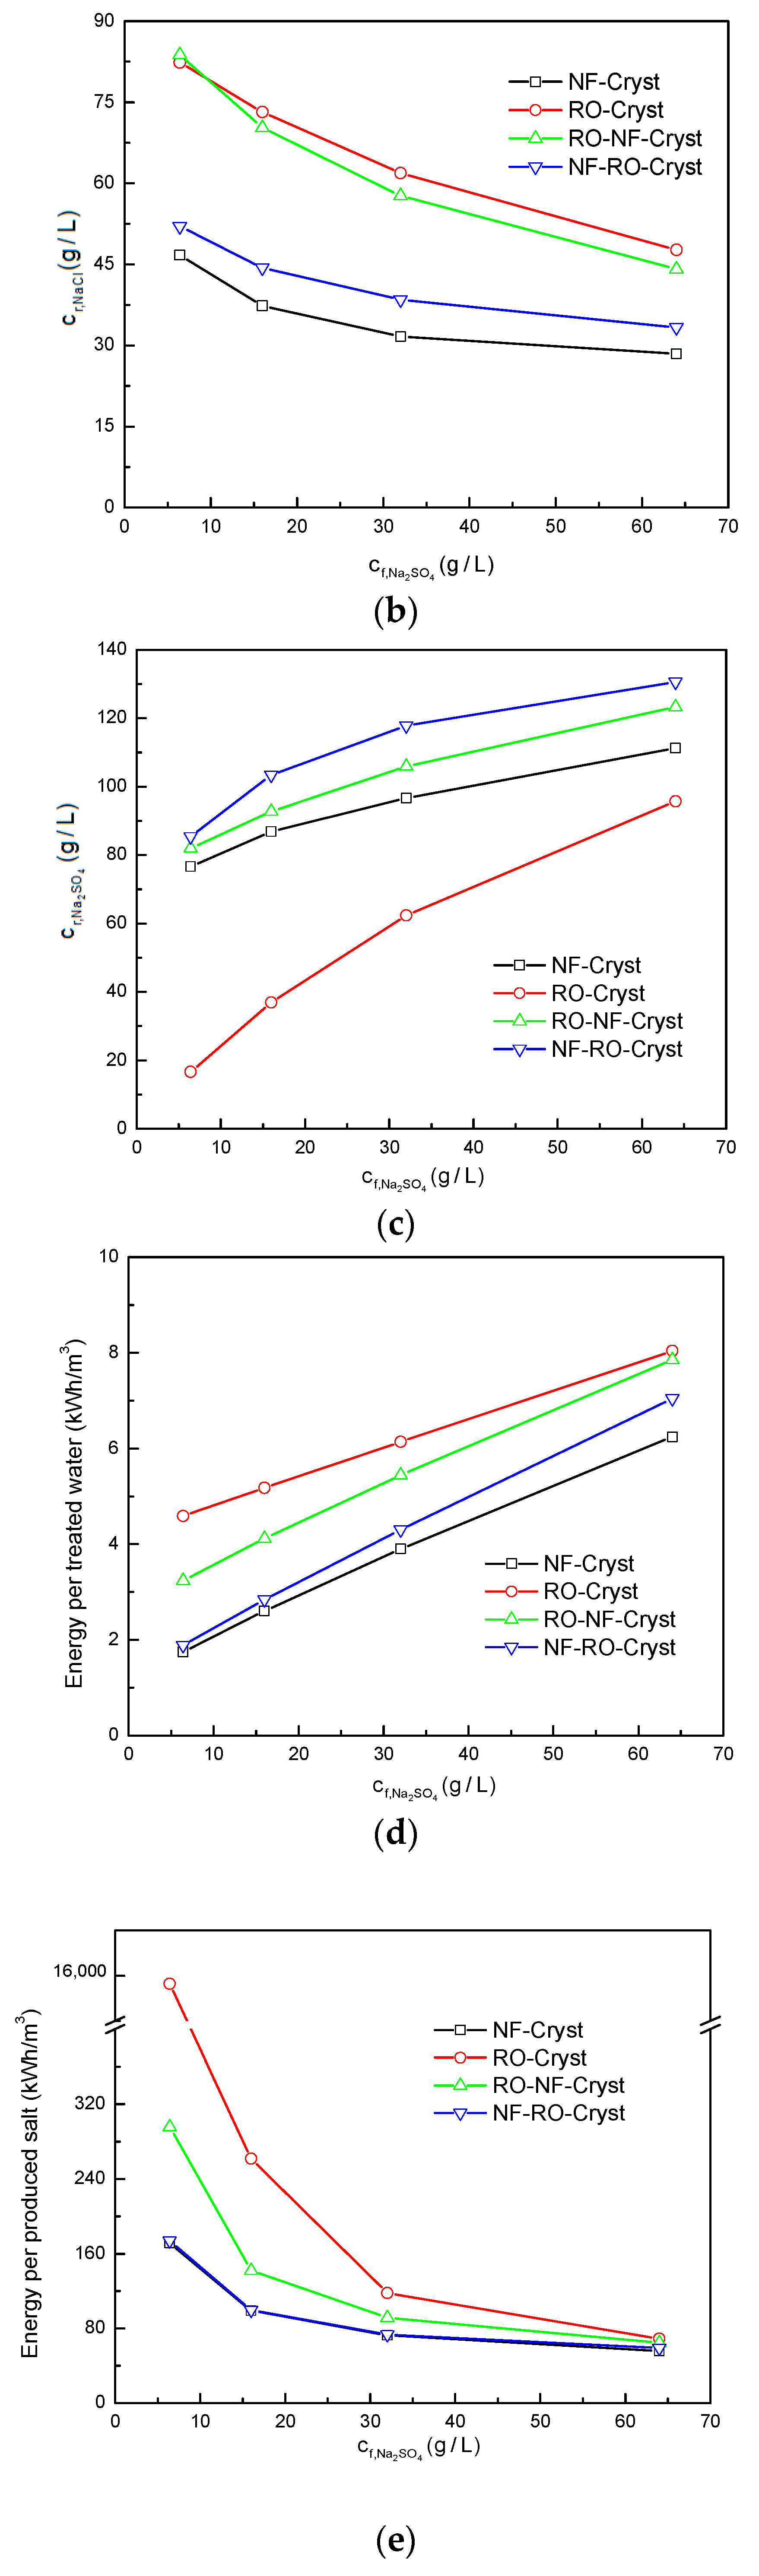
3.2. Comparison between Different Process Configurations

The process configurations of NF-Cryst, RO-Cryst, RO-NF-Cryst and NF-RO-Cryst under different feed concentrations were simulated and the results were discussed. For the NF-RO-Cryst process, since the feed concentration entering the NF operation unit was identical with that of the NF-Cryst, the rejection of the NF model also used the values shown in Table 1. However, for the RO-NF-Cryst process, since the NF unit was used to treat RO retentate, the rejection was re-evaluated according to Table 1. Because of the pre-concentration by RO, c f , N a 2 S O 4 increased compared with that of the feed, therefore the rejections all decreased to a certain extent.

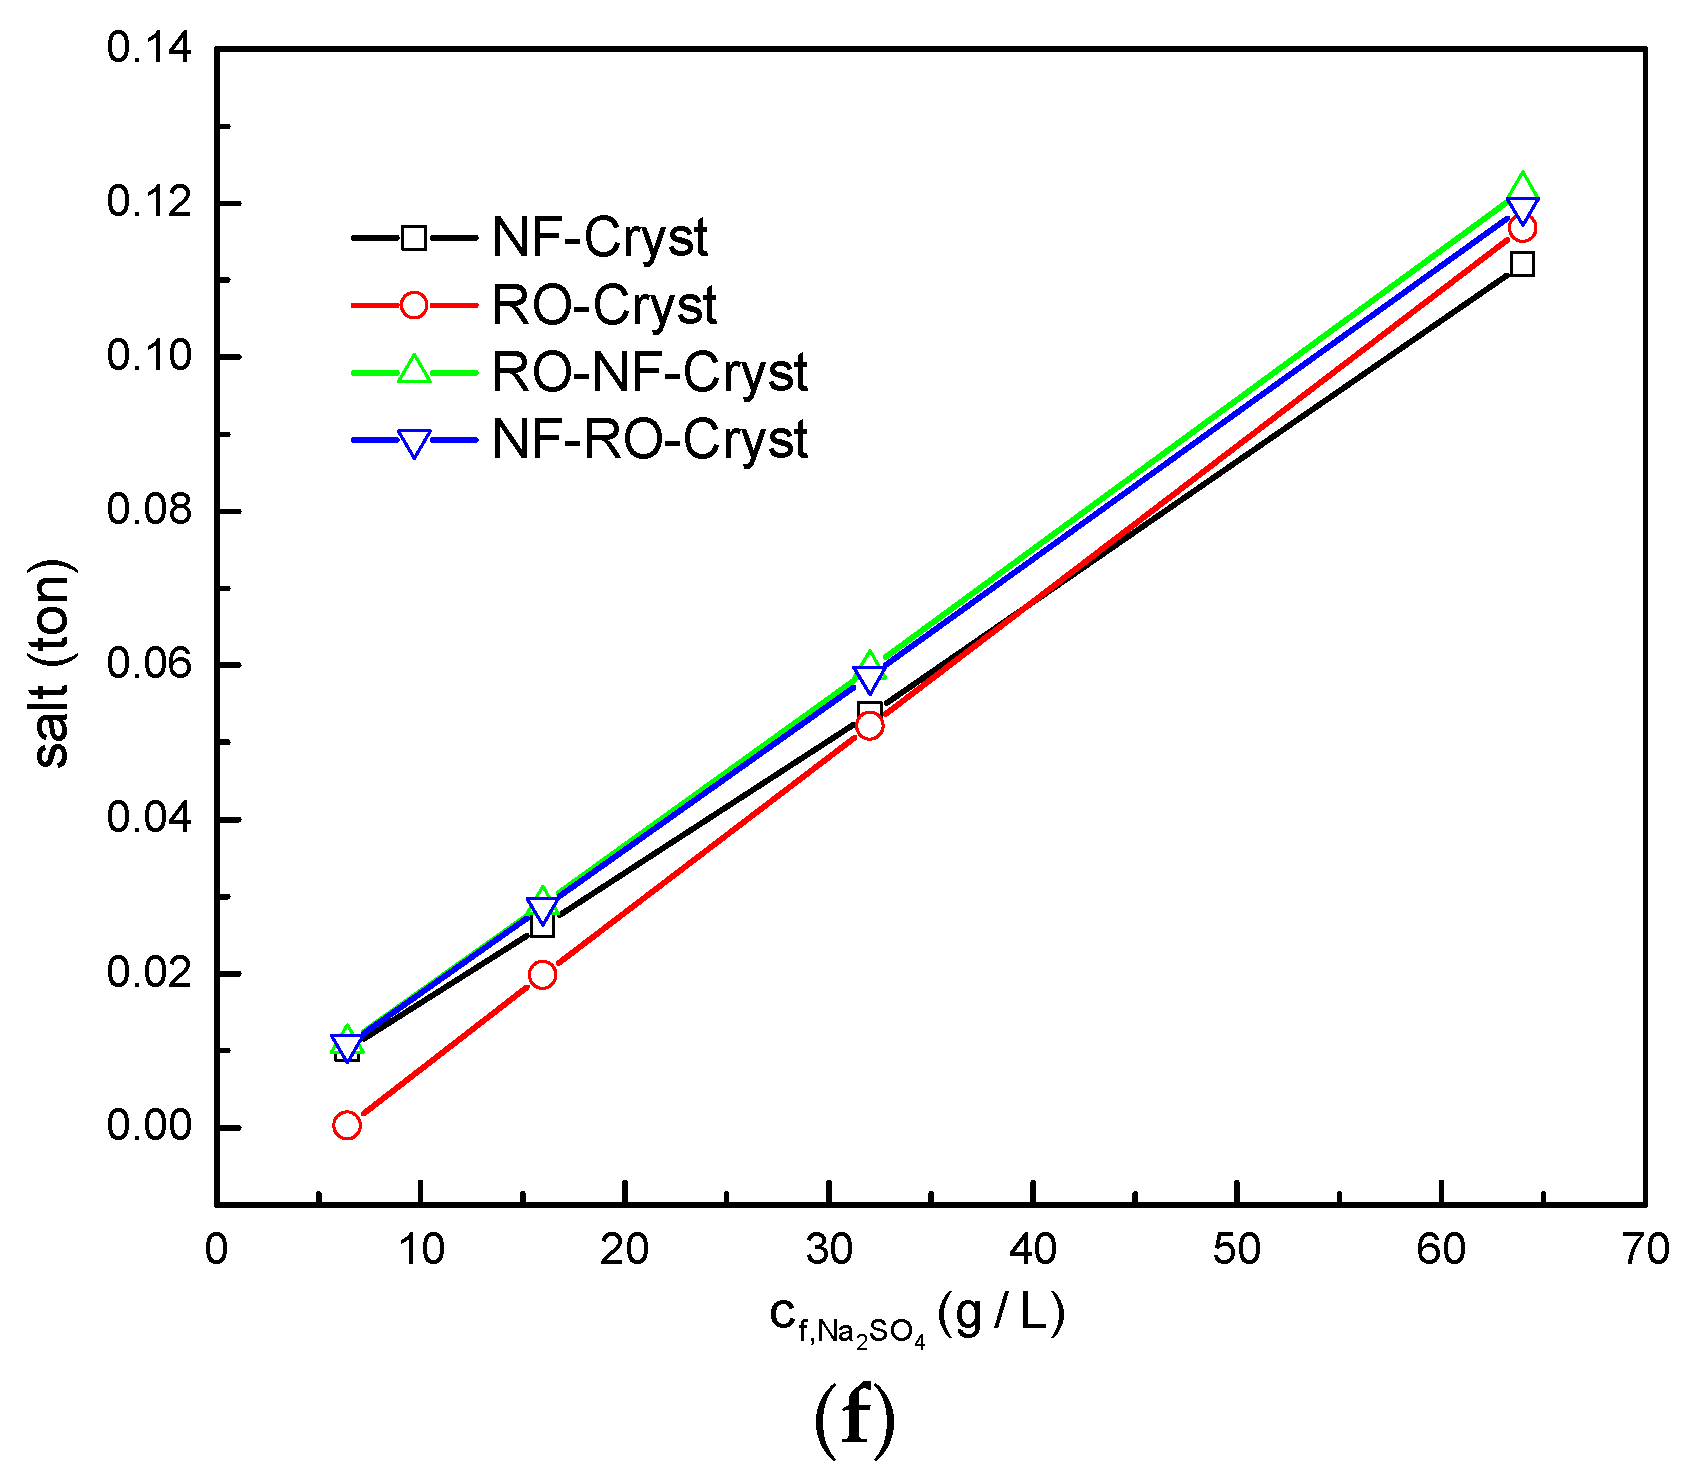
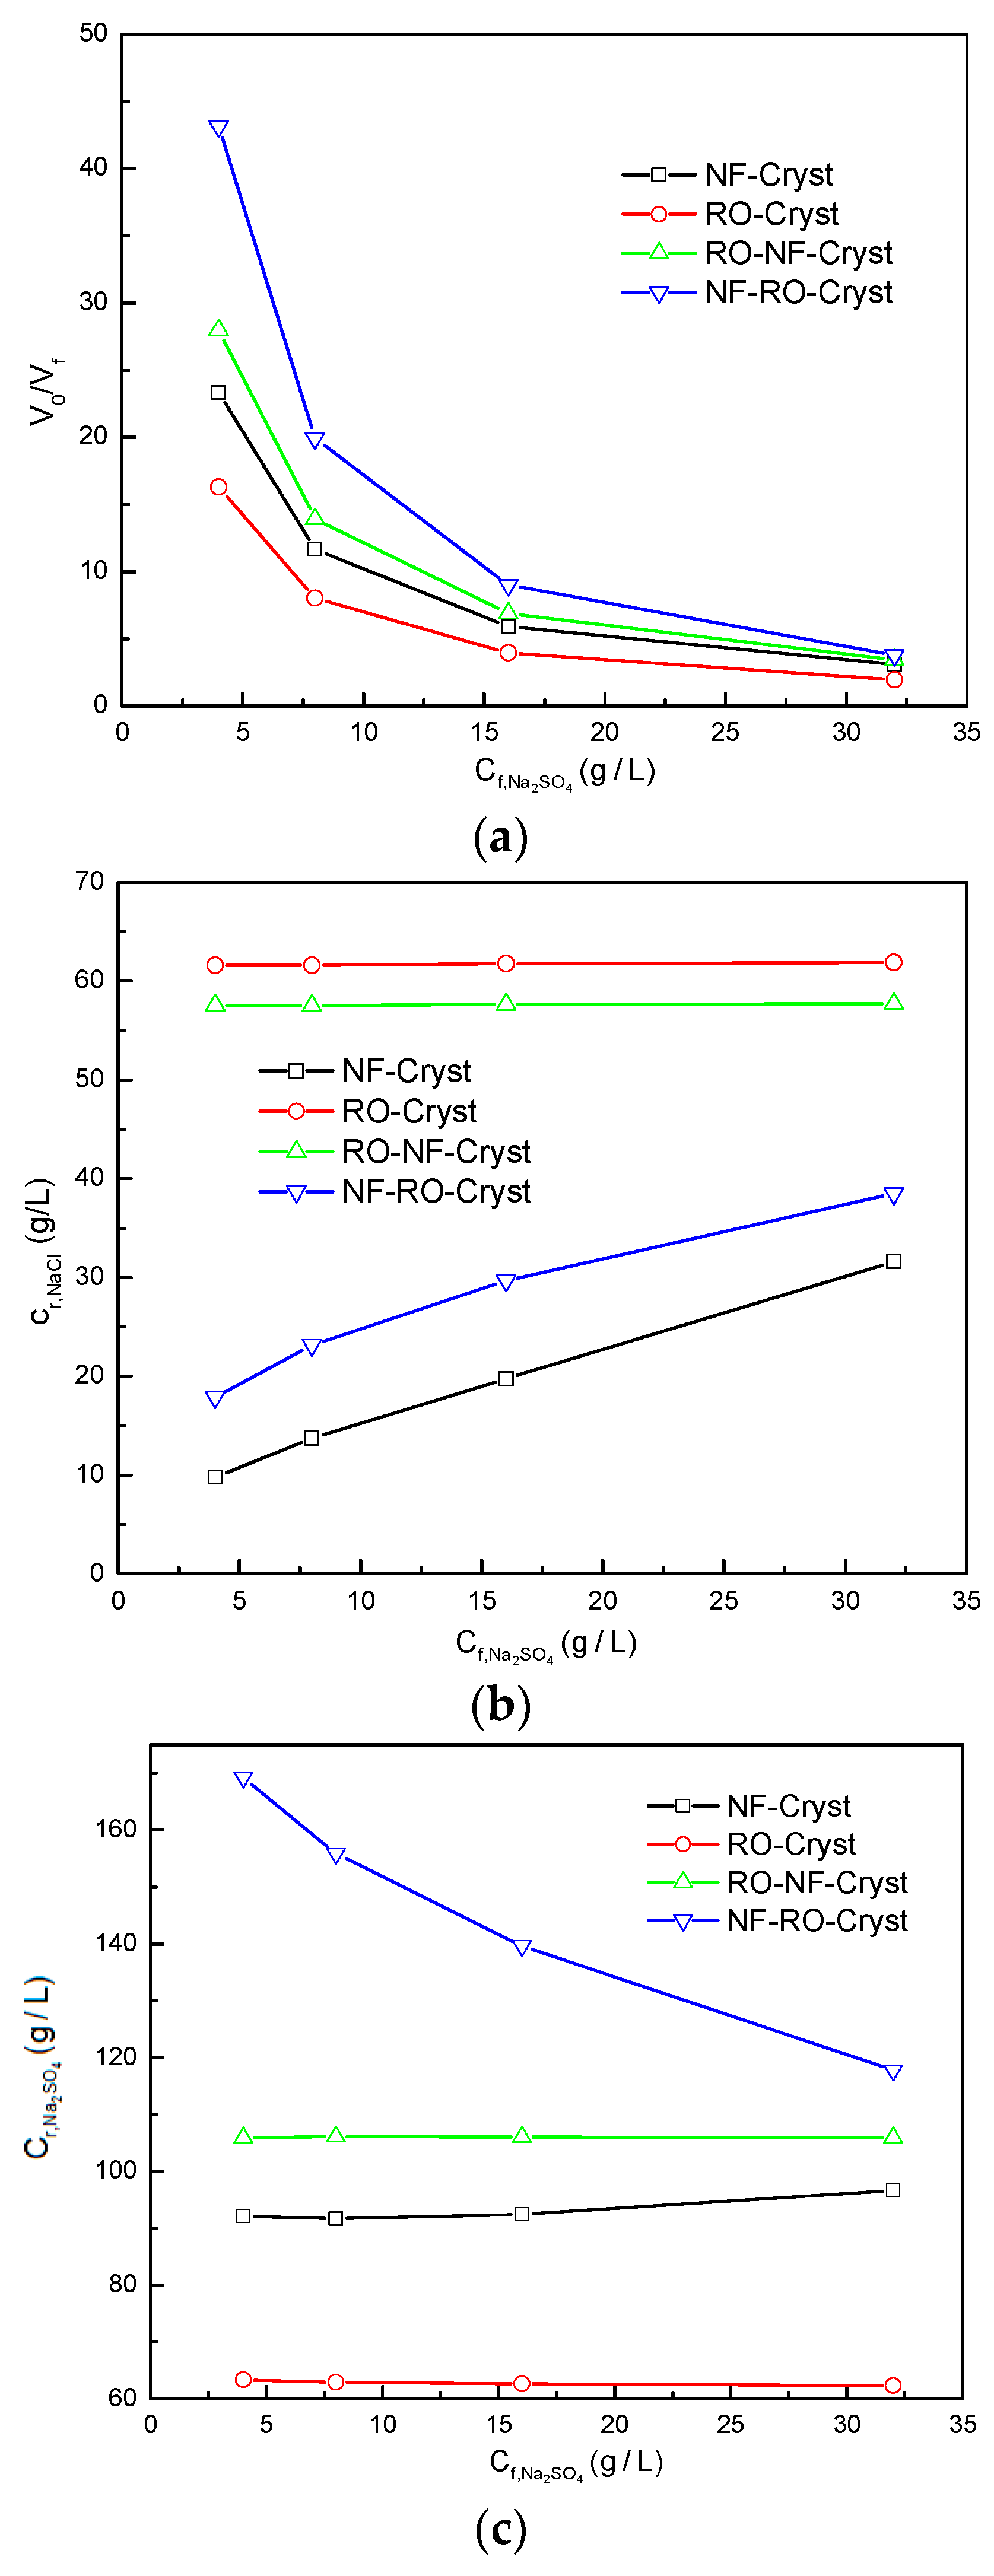
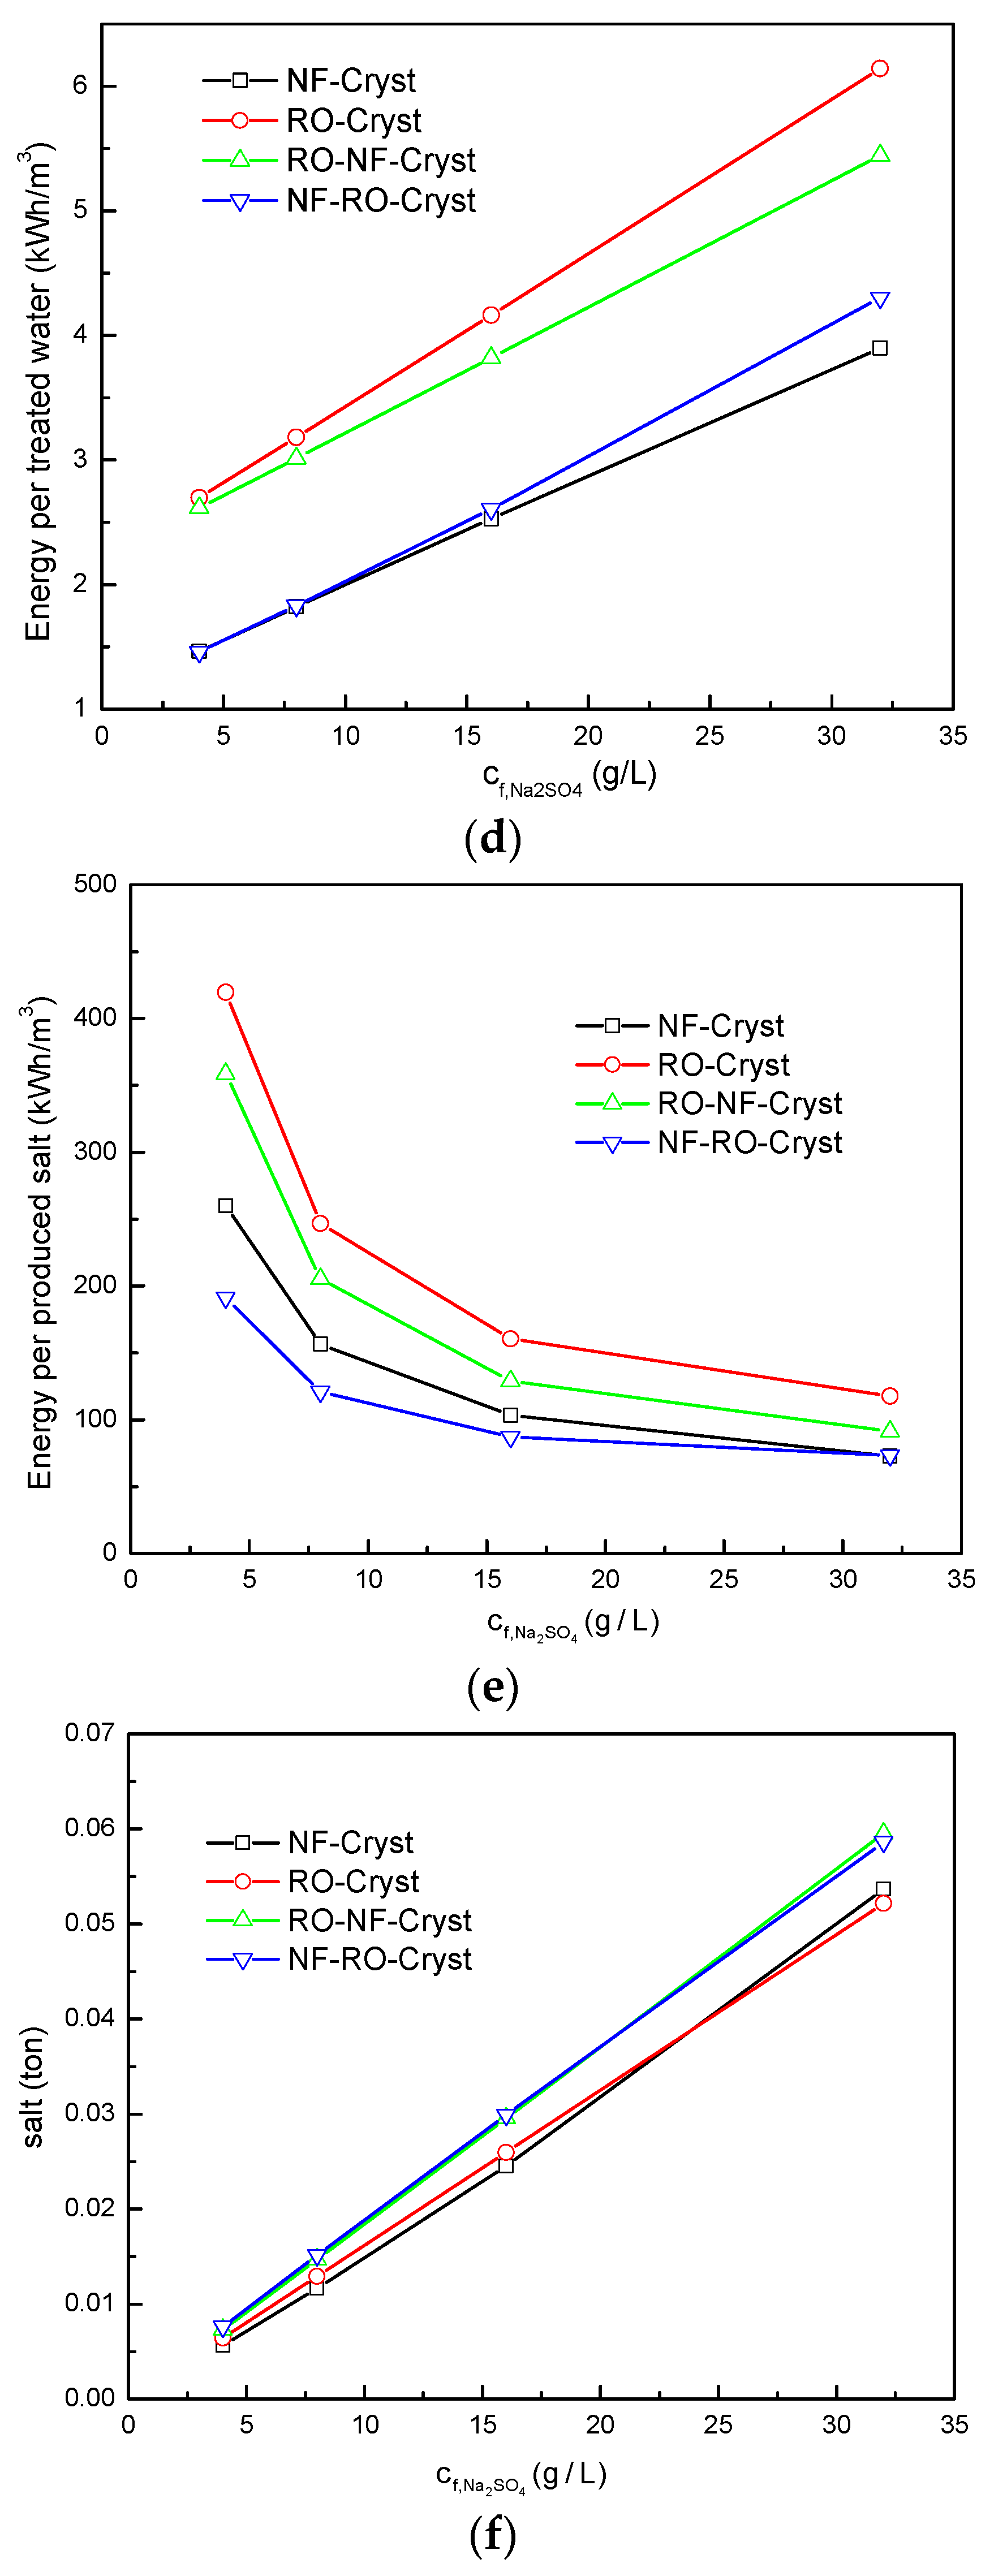
3.2.1. Comparison of Simulation Results under Different Total Salt Concentrations

The simulation results for different process configurations are shown in Figure 6a–f when c f , N a C l / c f , N a 2 S O 4 (1:1) is fixed. Among them, the retentate in RO-NF-Cryst and NF-RO-Cryst processes referred to the final retentate obtained after the feed was treated by a two-stage membrane unit and then entered the into the crystallizer. V0/Vf was the ratio between the retentate before entering the crystallizer and the feed, which was the concentration multiple achieved by the whole membrane process. From the comparison of the V0/Vf shown in Figure 6a, it can be seen that the NF-RO-Cryst process had the highest V0/Vf among the four investigated process configurations. The NF-RO-Cryst process achieved a maximum V0/Vf of 43.1 when the feed concentration of NaCl and Na2SO4 were both 4 g·L−1. The RO-NF-Cryst process had a lower V0/Vf than the NF-RO-Cryst process while it was higher than the NF-Cryst and RO-Cryst processes. Although NF-RO-Cryst and RO-NF-Cryst processes had higher V0/Vf, these two types of much complex process configurations required more initial investment and operating costs. It is interesting to notice from Figure 6a that although the RO operation in the RO-Cryst process was at a higher pressure (8 vs. 4 MPa), the achievable V0/Vf was still lower than that of NF-Cryst operated at a lower pressure. This was due to the high rejection towards NaCl and Na2SO4 in the feed during RO operation, resulting in a larger osmotic pressure that should be overcome, offsetting the effect of increased operating pressure. In addition, there was a tendency for V0/Vf to decrease with increasing concentrations in all four processes.
It can be noticed from Figure 6b that the RO-Cryst process concentrated directly through RO and had the highest concentrated NaCl concentration. In the RO-NF-Cryst process where the NF continued after the RO operation, c r , N a C l decreased due to the separation effect of the NF on the divalent salt. When the total concentration increased under fixed c f , N a C l / c f , N a 2 S O 4 , c r , N a C l in the RO-Cryst and RO-NF-Cryst processes remained almost constant. When rejections towards NaCl and Na2SO4 were close, the final concentration of NaCl to Na2SO4 was close to that of the feed. Hence, for the process started with RO, the final concentration was also close when c f , N a C l / c f , N a 2 S O 4 was fixed. For the NF-Cryst and NF-RO-Cryst processes, c r , N a C l also increased as the salt concentration in the feed increased due to the NF separation effect. Due to the subsequent RO concentration, c r , N a C l of the NF-RO-Cryst process was slightly higher than that of the NF-Cryst process.
In Figure 6c, the RO-Cryst process had the lowest c r , N a 2 S O 4 when c f , N a C l / c f , N a 2 S O 4 was fixed, even lower than that of the NF-Cryst process. The c r , N a 2 S O 4 of RO-NF-Cryst was slightly higher than that of NF-Cryst. However, c r , N a 2 S O 4 in NF-RO-Cryst was the highest, and reached 169.3 g·L−1 when c f , N a C l and c f , N a 2 S O 4 were both 4 g·L−1. c r , N a 2 S O 4 in the other three process configurations did not change much with the increase of total salt concentration. However, for the NF-RO-Cryst process, c r , N a 2 S O 4 decreased as the total salt concentration increased. In the NF-RO-Cryst process, Na2SO4 concentration in the NF retentate treated by RO did not change much. However, the NaCl concentration increased with the increase of the total salt concentration, resulting in a decrease in the concentration multiple of the RO and c r , N a 2 S O 4 .
Figure 6d,e show the comparison of energy consumption for different process configurations when c f , N a C l / c f , N a 2 S O 4 was fixed. Figure 6f compares the amount of salt that was produced by different processes. The RO-Cryst process had the highest Ewater and Esalt. This suggests that only using RO for the treatment of wastewater containing NaCl and Na2SO4 might not be economically viable. The NF-Cryst process had the lowest Ewater. This was due to the fact that it decreased the consumption of RO by contrasting the RO-NF-Cryst and NF-RO-Cryst processes. In particular, the RO should be operated at a higher pressure so that the energy consumption of the high-pressure pump can also increase. The NF-RO-Cryst process had lower Esalt and Ewater than that of the RO-NF-Cryst process. Compared NF-RO-Cryst process with NF-Cryst process, RO operation required additional energy consumption. Indicating further concentration of the NF retentate allowed salt production to increase, offsetting the increased RO energy consumption. The RO-NF-Cryst and NF-RO-Cryst processes were similar in salt production, both being higher than that of the NF-Cryst and RO-Cryst processes. The NF-RO-Cryst and RO-NF-Cryst process were both two-step membrane operations, and NF-RO decreased the concentration required for the next step, therefore there would be a higher V0/Vf. Without considering the initial investment of RO and NF, the simulation results showed that the RO arranged at the back of NF was economically beneficial.

3.2.2. Comparison of Simulation Results under Different c f , N a C l / c f , N a 2 S O 4

The comparison of simulation results of different processes under the fixed c f , N a C l of 32 g·L−1 and changing c f , N a C l / c f , N a 2 S O 4 is shown in Figure 7a–f. From Figure 7a, it can be seen that the RO-Cryst process had the lowest V0/Vf. Even when the feed concentrations of NaCl and Na2SO4 were 32 and 6.4 g·L−1, respectively, the V0/Vf was about 2.6. The NF-Cryst process, operating at a pressure of 4 MPa, achieved a concentration multiple of 12.7 for identical feed concentration. The concentration multiples of the NF-RO-Cryst and RO-NF-Cryst processes were higher than that of NF-Cryst process. However, the difference was not obvious when Na2SO4 concentration was high. As the Na2SO4 concentration increased, the osmotic pressure also increased significantly, therefore the concentration multiple of the process configuration containing NF unit decreased significantly.
Figure 7b,c show that the retentate concentrations of NaCl and Na2SO4 in different processes under different c f , N a C l / c f , N a 2 S O 4 are similar to the results at different total salt concentrations. The NF-Cryst process also had the lowest NaCl concentration, while c r , N a C l in the RO-Cryst process was the highest. For the Na2SO4 concentration, the highest c r , N a 2 S O 4 was obtained by the NF-RO-Cryst process. With the increase of c f , N a 2 S O 4 , V0/Vf decreased. When c f , N a C l was fixed, c f , N a C l of all process decreased. For c r , N a 2 S O 4 , all processes showed an increasing trend with the increase of c f , N a 2 S O 4 , while the increase rate slowed down. The Na2SO4 concentration could be doubled in the NF-RO-Cryst process even when c f , N a 2 S O 4 increased to 64 g·L−1.
As can be seen from Figure 7d,e, as c f , N a 2 S O 4 increased, Ewater increased and Esalt decreased. The NF-Cryst progress had the lowest energy consumption under different c f , N a C l / c f , N a 2 S O 4 . Ewater of NF-RO-Cryst was higher than that of NF-Cryst process, while Esalt was basically identical. This showed that for the NF-RO-Cryst process, the increase in the amount of salt produced offset the increase in total energy consumption, despite the increase in overall process energy consumption due to the addition of a RO unit. When c f , N a C l / c f , N a 2 S O 4 was high and c f , N a 2 S O 4 was low, c r , N a 2 S O 4 might not have reached the saturation concentration when the Na2SO4 concentration in the RO-Cryst process was low. For example, as can be seen from Figure 7f, when c r , Na 2 SO 4 was 6.4 g·L−1, the amount of salt produced in the RO-Cryst process was close to zero, resulting in enormous values of Esalt by this process. Moreover, it showed that the salt production was close, mainly because c p , N a 2 S O 4 was low in all four processes. Therefore, the mass of Na2SO4 in retentate was similar, and so was the salt production after the crystallization unit. In general, compared to a simple NF-Cryst process, as a much more complex process, the NF-RO-Cryst process increased the amount of produced salt as c f , N a 2 S O 4 increased while Esalt remained constant.

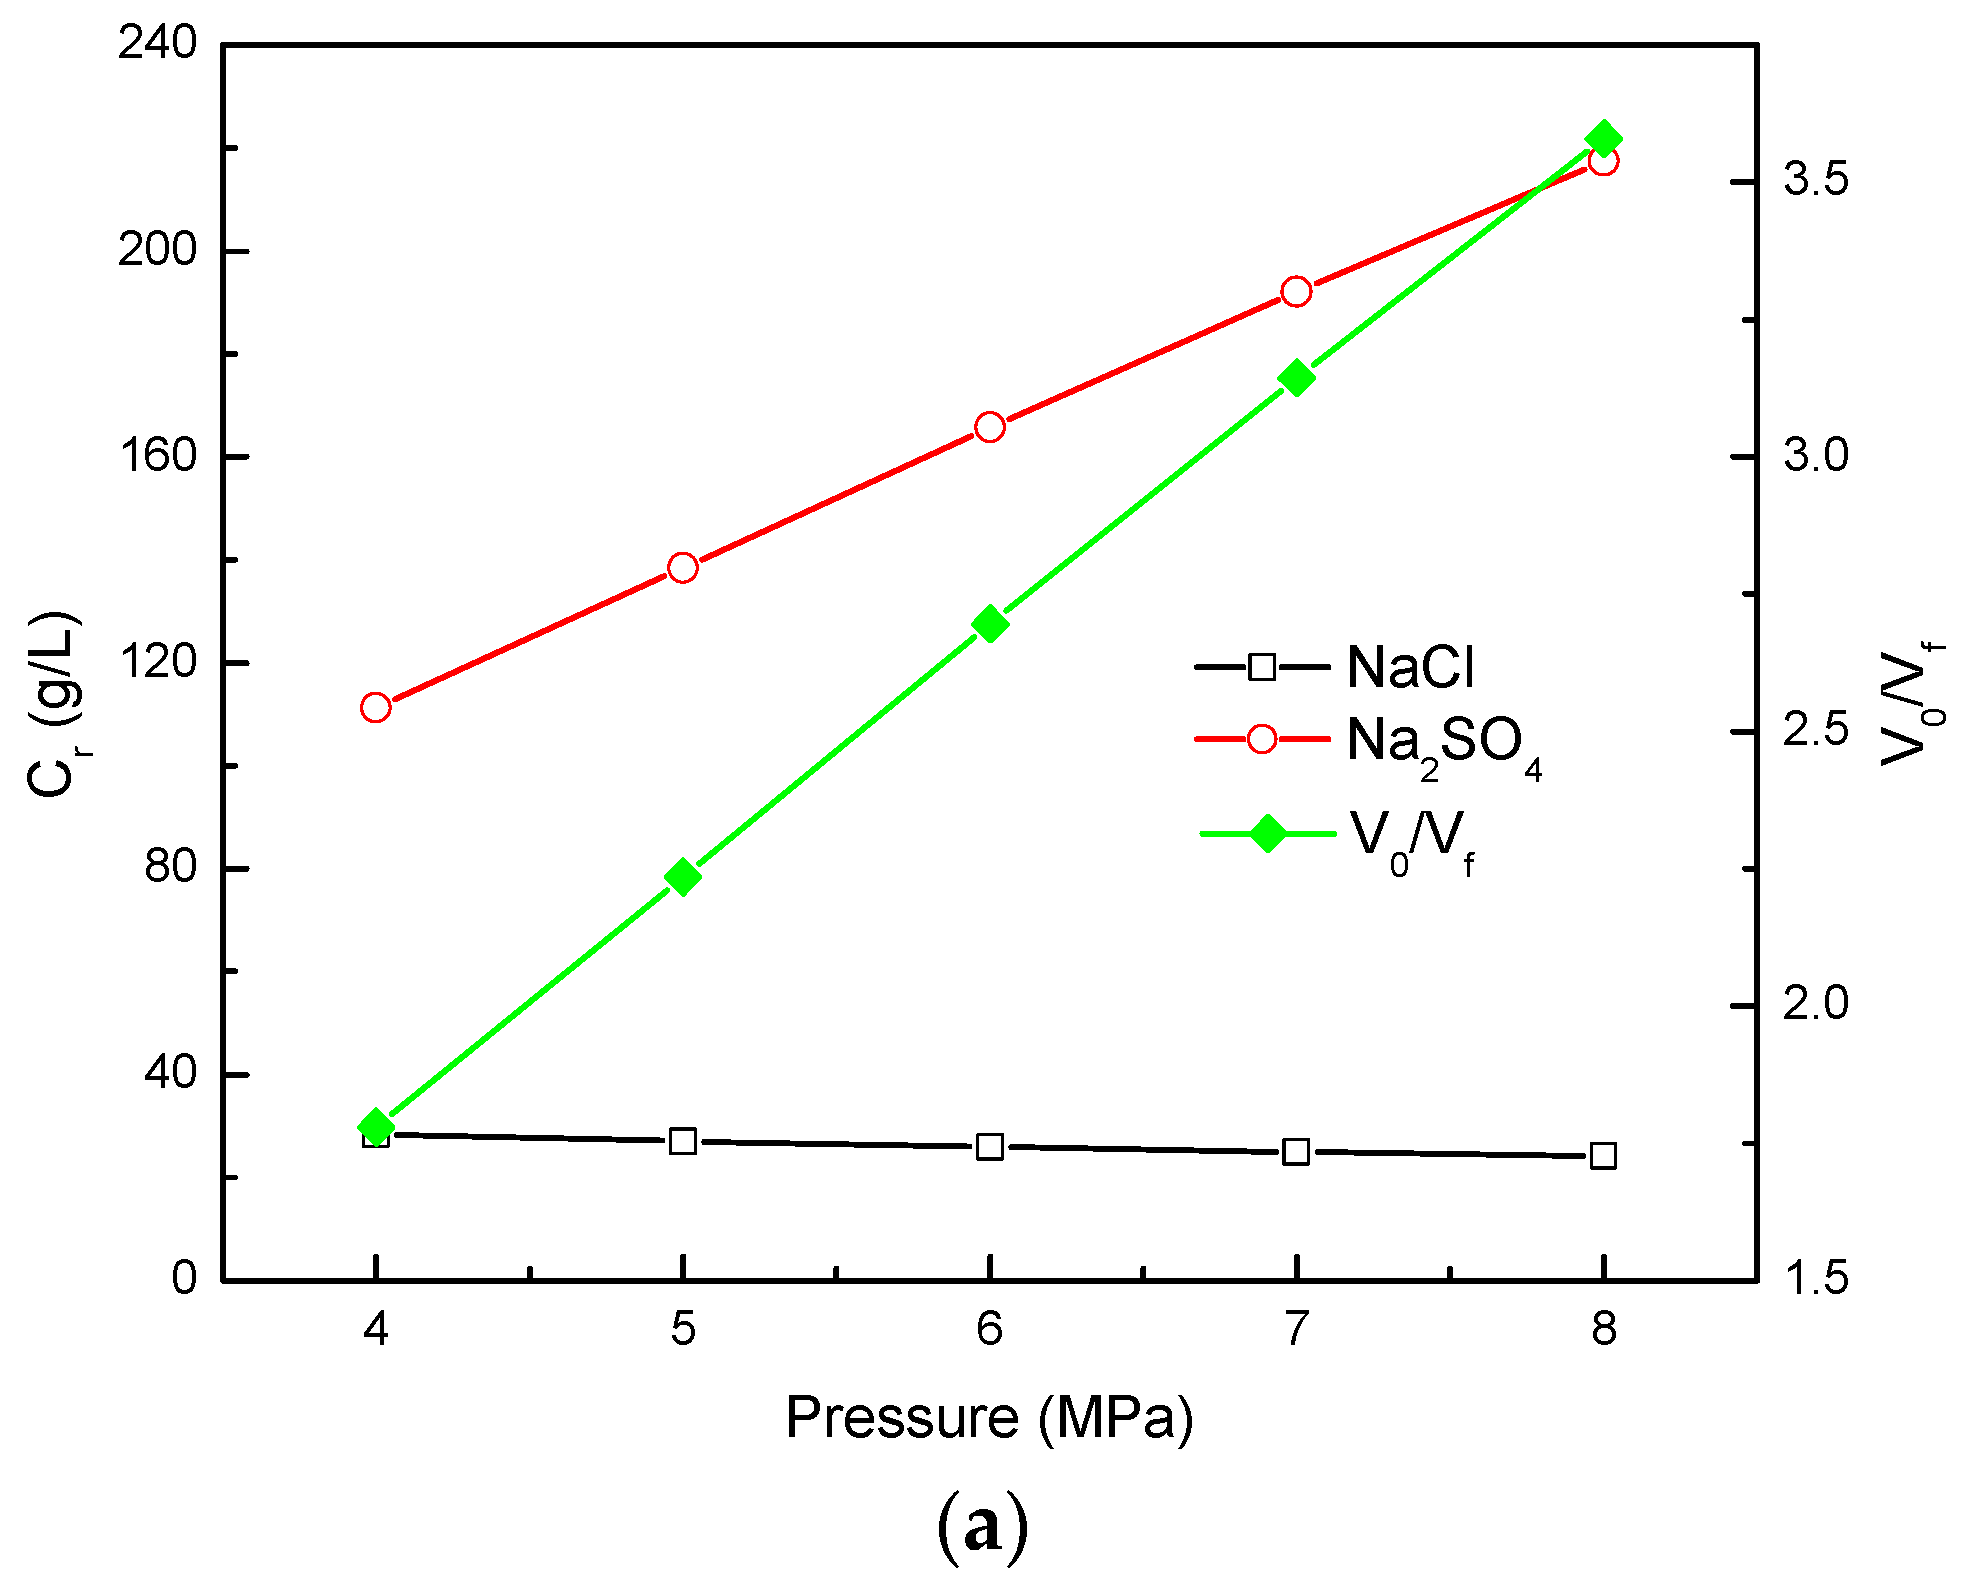
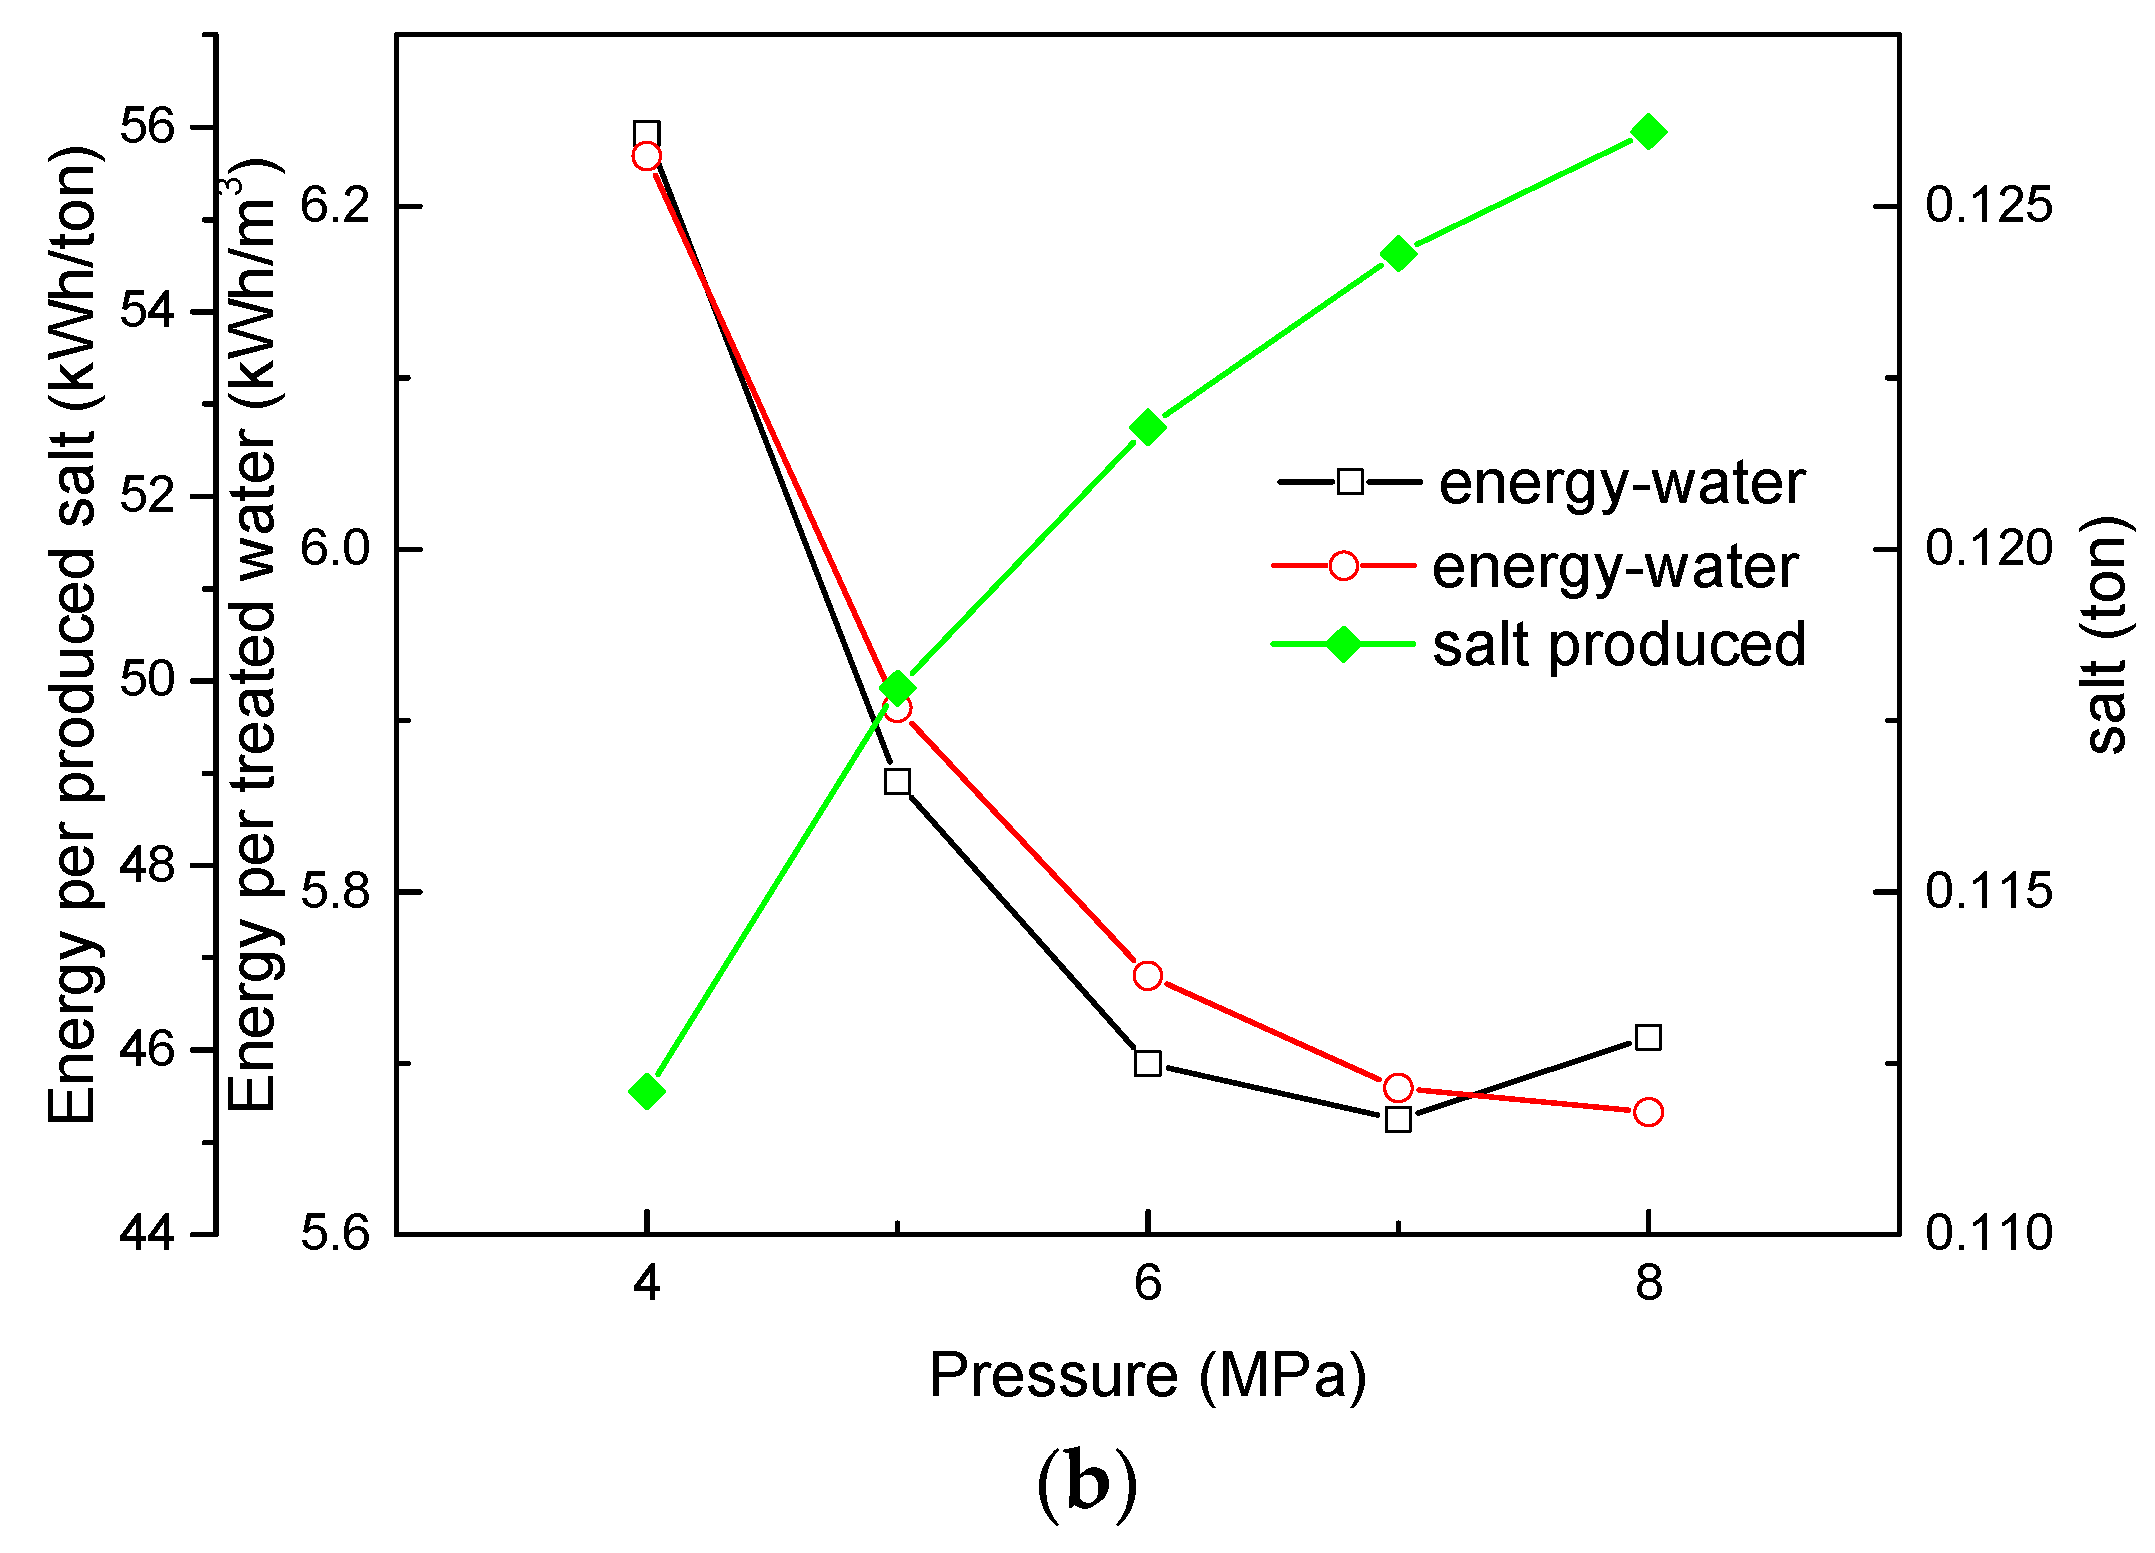
3.3. Effect of NF Operating Pressure

NF is sometimes referred to as low pressure RO, which traditionally has lower operating pressures [32]. For example, General Electric Company’s (GE) DL series of NF membranes, the operating pressure is usually limited to 4 MPa or less [33]. For the treatment of high salinity wastewater, there are commercialized high-pressure NF membranes. In order to investigate the influence of NF operation under high pressure on the membrane integration process, the NF operation pressure in NF-Cryst process was set at 4–8 MPa for simulation. The feed was a high salinity solution containing 32 g·L−1 NaCl and 64 g·L−1 Na2SO4. The rejection assumed identical values under different operating pressures, and Cl and SO42− rejection were set as −0.189 and 0.960, respectively. The results are shown in Figure 8a,b below.
As can be seen from Figure 8a, V0/Vf and c r , N a 2 S O 4 grew linearly as the operating pressure increased. At an operating pressure of 8 MPa, Na2SO4 could be concentrated up to 217.4 g·L−1. Since R Cl was negative, as the operating pressure increased, V0/Vf increased and c r , N a C l decreased slightly. Above all, high pressure NF operation is beneficial to improve the divalent salt separation efficiency and concentration multiple.
As the operating pressure increased, Figure 8b showed that Ewater decreased in the range of 4–7 MPa. At 8 MPa, further increasing the operating pressure would increase energy consumption. The concentration multiple in the higher operating pressure was higher; the amount of water which treated by the crystallizer would also be decreased. Although energy consumption of the high-pressure pump increased, the energy consumption of the crystallizer decreased, and the total energy consumption of the process decreased. Increasing the operating pressure could recover more sulfate from the wastewater and lower Esalt. Furthermore, it can be concluded that the use of NF membranes which could operate at higher pressures is beneficial for improving the efficiency of NF-crystallization integration processes.

4. Conclusions

A thermodynamical approach was described in detail, and was used for energy consumption evaluation. The performances of the nanofiltration-crystallization process on selective separation of chloride and sulfate were compared with four different process configurations. Moreover, the effect of the feed concentration and the operating pressure was discussed.
For concentration multiples at different salt concentrations under fixed c f , N a C l / c f , N a 2 S O 4 , when c f , N a 2 S O 4 was low (e.g., 5 g·L−1), the results of four processes were appreciably different while the concentration multiple of NF-RO-Cryst was the highest. However, when c f , N a 2 S O 4 was high (e.g., 30 g·L−1), the results of the four processes were similar.
The value of Ewater of the NF-Cryst and NF-RO-Cryst processes were lower than that of RO-Cryst and RO-NF-Cryst. Under fixed c f , N a C l / c f , N a 2 S O 4 , when c f , N a 2 S O 4 was low (e.g., 15 g·L−1), there was not much difference in energy consumption between the NF-Cryst and NF-RO-Cryst processes, therefore considering the fixed investment, NF-Cryst might be the proper choice. However, when c f , N a 2 S O 4 was high (e.g., 30 g·L−1), compared to NF-Cryst, NF-RO-Cryst had an obvious advantage.
The high efficiency of NF was revealed in the separation of salt and the decrease in the energy consumption for the whole process. Although RO could be operated under higher pressure, the concentration multiple and other indicators were lower than NF. For an integrated process design, it was advantageous to arrange RO after NF. The development of NF membranes with higher operating pressures could increase the concentration ratio while decreasing the volume of the retentate, therefore decreasing the crystallizer treated water volume, and finally decreasing the total energy consumption of the process.

Acknowledgments

The support of the National Key Technologies R&D Program of China (No. 2015BAE06B00) is gratefully acknowledged.

Author Contributions

M.-y.D. and L.-m.Z. conceived and designed the experiments; M.-y.D. performed the experiments; L.-m.Z. contributed programming tools; M.-y.D. and L.-m.Z. analyzed the data; M.-y.D. wrote the paper.

Conflicts of Interest

The authors declare no conflict of interest.

Glossary of Terms

The following abbreviations are used in this manuscript:
TermDefinition
R Cl Cl rejection
R SO 4 2 SO42− rejection
c f , N a C l concentration of NaCl in the feed
c f , N a C l / c f , N a 2 S O 4 concentration ratio of NaCl over Na2SO4 in the feed
V0/Vfconcentration multiple
Ewaterenergy consumption per cubic meter of treated water (kWh/m3)
Esaltenergy consumption per ton of salt production (kWh/ton)
SubscriptsDefinition
ffeed
ppermeate
rretentate

References

  1. Lefebvre, O.; Moletta, R. Treatment of organic pollution in industrial saline wastewater: A literature review. Water Res. 2006, 40, 3671–3682. [Google Scholar] [CrossRef] [PubMed]
  2. Li, F.; Xu, F.; Li, X.; Li, Q.; Cao, B. Research on Treatment of High Salinity Wastewater. Environ. Sci. Manag. 2014, 39, 72–75. [Google Scholar]
  3. Hajbi, F.; Hammi, H.; M’nif, A. Reuse of RO Desalination Plant Reject Brine. J. Phase Equilib. Diffus. 2010, 31, 341–347. [Google Scholar] [CrossRef]
  4. Gao, S. Study on the Comprehensive Utilization of High Salinity Wastewater. Master’s Thesis, Tianjin University, Tianjin, China, 2014. [Google Scholar]
  5. Rodriguez-DeLaNuez, F.; Franquiz-Suarez, N.; Esther Santiago, D.; Miguel Veza, J.; Jaime Sadhwani, J. Reuse and minimization of desalination brines: A review of alternatives. Desalination Water Treat. 2012, 39, 137–148. [Google Scholar] [CrossRef]
  6. Garcia-Aleman, J.; Dickson, J.M. Mathematical modeling of nanofiltration membranes with mixed electrolyte solutions. J. Membr. Sci. 2004, 235, 1–13. [Google Scholar] [CrossRef]
  7. Cavaco Morão, A.I.; Szymczyk, A.; Fievet, P.; Brites Alves, A.M. Modelling the separation by nanofiltration of a multi-ionic solution relevant to an industrial process. J. Membr. Sci. 2008, 322, 320–330. [Google Scholar] [CrossRef]
  8. Mohammad, A.W.; Teow, Y.H.; Ang, W.L.; Chung, Y.T.; Oatley-Radcliffe, D.L.; Hilal, N. Nanofiltration membranes review: Recent advances and future prospects. Desalination 2015, 356, 226–254. [Google Scholar] [CrossRef]
  9. Wang, X.; Shang, W.; Wang, D.; Wu, L.; Tu, C. Characterization and applications of nanofiltration membranes: State of the art. Desalination 2009, 236, 316–326. [Google Scholar] [CrossRef]
  10. Wang, X.L.; Tsuru, T.; Nakao, S.I.; Kimura, S. The electrostatic and steric-hindrance model for the transport of charged solutes through nanofiltration membranes. J. Membr. Sci. 1997, 135, 19–32. [Google Scholar] [CrossRef]
  11. Zhou, D.; Zhu, L.; Fu, Y.; Zhu, M.; Xue, L. Development of lower cost seawater desalination processes using nanofiltration technologies—A review. Desalination 2015, 376, 109–116. [Google Scholar] [CrossRef]
  12. Van der Bruggen, B.; Curcio, E.; Drioli, E. Process intensification in the textile industry: The role of membrane technology. J. Environ. Manag. 2004, 73, 267–274. [Google Scholar] [CrossRef] [PubMed]
  13. Van der Bruggen, B. Integrated Membrane Separation Processes for Recycling of Valuable Wastewater Streams: Nanofiltration, Membrane Distillation, and Membrane Crystallizers Revisited. Ind. Eng. Chem. Res. 2013, 52, 10335–10341. [Google Scholar] [CrossRef]
  14. Drioli, E.; Curcio, E.; Criscuoli, A.; Profio, G.D. Integrated system for recovery of CaCO3, NaCl and MgSO4·7H2O from nanofiltration retentate. J. Membr. Sci. 2004, 239, 27–38. [Google Scholar] [CrossRef]
  15. Curcio, E.; Ji, X.; Quazi, A.M.; Barghi, S.; Di Profio, G.; Fontananova, E.; Macleod, T.; Drioli, E. Hybrid nanofiltration–membrane crystallization system for the treatment of sulfate wastes. J. Membr. Sci. 2010, 360, 493–498. [Google Scholar] [CrossRef]
  16. Zhang, W.; Miao, M.; Pan, J.; Sotto, A.; Shen, J.; Gao, C.; Van der Bruggen, B. Separation of divalent ions from seawater concentrate to enhance the purity of coarse salt by electrodialysis with monovalent-selective membranes. Desalination 2017, 411, 28–37. [Google Scholar] [CrossRef]
  17. Lidén, A.; Persson, K. Feasibility Study of Advanced NOM-Reduction by Hollow Fiber Ultrafiltration and Nanofiltration at a Swedish Surface Water Treatment Plant. Water 2016, 8, 150. [Google Scholar] [CrossRef]
  18. Keucken, A.; Wang, Y.; Tng, K.; Leslie, G.; Spanjer, T.; Köhler, S. Optimizing Hollow Fibre Nanofiltration for Organic Matter Rich Lake Water. Water 2016, 8, 430. [Google Scholar] [CrossRef]
  19. Uyanık, O.; Özkan, O.; Koyuncu, O. NF-RO Membrane Performance for Treating the Effluent of an Organized Industrial Zone Wastewater Treatment Plant: Effect of Different UF Types. Water 2017, 9, 506. [Google Scholar] [CrossRef]
  20. Zhu, A.; Christofides, P.D.; Cohen, Y. Effect of Thermodynamic Restriction on Energy Cost Optimization of RO Membrane Water Desalination. Ind. Eng. Chem. Res. 2009, 48, 6010–6021. [Google Scholar] [CrossRef]
  21. Chemical Process Optimization Software—Chemical Process Design. Available online: http://www.aspentech.com/products/engineering/aspen-plus/ (accessed on 10 November 2017).
  22. Chang, H.; Liau, J.; Ho, C.; Wang, W. Simulation of membrane distillation modules for desalination by developing user’s model on Aspen Plus platform. Desalination 2009, 249, 380–387. [Google Scholar] [CrossRef]
  23. Sharifian, S.; Harasek, M.; Haddadi, B. Simulation of Membrane Gas Separation Process Using Aspen Plus® V8.6. Chem. Prod. Process Model. 2016, 11. [Google Scholar] [CrossRef]
  24. Zeng, L.; Du, M.; Wang, X. A Thermodynamical Approach for Evaluating Energy Consumption of the Forward Osmosis Process Using Various Draw Solutes. Water 2017, 9, 189. [Google Scholar] [CrossRef]
  25. Ghizellaoui, S.; Chibani, A.; Ghizellaoui, S. Use of nanofiltration for partial softening of very hard water. Desalination 2005, 179, 315–322. [Google Scholar] [CrossRef]
  26. Schaep, J.; Van der Bruggen, B.; Uytterhoeven, S.; Croux, R.; Vandecasteele, C.; Wilms, D.; Van Houtte, E.; Vanlergberghe, F. Removal of hardness from groundwater by nanofiltration. Desalination 1998, 119, 295–301. [Google Scholar] [CrossRef]
  27. Pérez-González, A.; Ibáñez, R.; Gómez, P.; Urtiaga, A.M.; Ortiz, I.; Irabien, J.A. Nanofiltration separation of polyvalent and monovalent anions in desalination brines. J. Membr. Sci. 2015, 473, 16–27. [Google Scholar] [CrossRef]
  28. Yan, Z.Q.; Zeng, L.M.; Li, Q.; Liu, T.Y.; Matsuyama, H. Selective separation of chloride and sulfate by nanofiltration for high saline wastewater recycling. Sep. Purif. Technol. 2016, 166, 135–141. [Google Scholar] [CrossRef]
  29. Stephen, H.; Stephen, T. Binary Systems: Solubilities of Inorganic and Organic Compounds; Pergamon: Oxford, UK, 2013. [Google Scholar]
  30. Zhu, Z. Water and Salt System Phase Diagram and Its Application; Tianjin University Press: Tianjin, China, 2002. [Google Scholar]
  31. Wang, X.L.; Ding, N. Technology and Application of RO and NF; Chemical Industry Press: Beijing, China, 2005. [Google Scholar]
  32. Freeman, S.D.N.; Stocker, T.F. Comparison of two thin-film composite membranes: Low pressure FT-30 to very low pressure NF40HF. Desalination 1987, 62, 183–191. [Google Scholar] [CrossRef]
  33. GE Osmonics Membranes. Available online: http://www.lenntech.com/products/membrane/osmonics/osmonics.htm (accessed on 10 November 2017).
Figure 1. Pressure-driven membrane processes and osmotically driven membrane processes. For the pressure-driven membrane process, water migrates from retentate to permeate under applied pressure ΔP. For the osmotically driven membrane process, water migrates from the feed solution to the draw solution under osmotic pressure difference π1π2.
Water 10 00331 g001
Figure 2. Comparison of experimental (point) and calculated values (line) of NaCl–Na2SO4 solubility.
Water 10 00331 g002
Figure 3. Aspen Plus flowsheet of the processes (a) nanofiltration-crystallization (NF-Cryst); (b) reverse osmosis (RO)-Cryst; (c) RO-NF-Cryst; (d) NF-RO-Cryst.
Water 10 00331 g003
Figure 4. (a) Salt concentration in the retentate and V0/Vf; (b) energy consumption and salt production; as a function of different c f , N a 2 S O 4 under fixed c f , N a C l / c f , N a 2 S O 4 (1:1).
Water 10 00331 g004
Figure 5. (a) Salt concentration in the retentate and V0/Vf; (b) energy consumption and salt production; as a function of c f , N a 2 S O 4 under fixed c f , N a C l = 32 g·L−1.
Water 10 00331 g005
Figure 6. (a) V0/Vf; (b) c r , N a C l ; (c) c r , N a 2 S O 4 ; (d) Ewater; (e) Esalt; (f) salt production; as a function of c f , N a 2 S O 4 at different process configurations under fixed c f , N a C l / c f , N a 2 S O 4 = 1:1.
Water 10 00331 g006aWater 10 00331 g006b
Figure 7. (a) V0/Vf; (b) c r , N a C l ; (c) c r , N a 2 S O 4 ; (d) Ewater; (e) Esalt; (f) salt production; as a function of c f , N a 2 S O 4 at different process configurations under fixed c f , N a C l (32 g·L−1).
Water 10 00331 g007aWater 10 00331 g007bWater 10 00331 g007c
Figure 8. (a) Salt concentration in the retentate and V0/Vf; (b) Ewater, Esalt and salt production as a function of operating pressure.
Water 10 00331 g008aWater 10 00331 g008b
Table 1. Feed concentrations and NF rejections.
c f , N a C l (g·L−1) c f , N a 2 S O 4 (g·L−1) R Cl R SO 4 2
440.2880.996
880.2240.993
16160.1250.986
32320.0000.974
326.40.1550.978
32160.0970.979
32320.0000.974
3264−0.1890.960

