Comparison of Public Perception in Desert and Rainy Regions of Chile Regarding the Reuse of Treated Sewage Water


Abstract
:1. Introduction
2. Methodology
2.1. Context of the Study
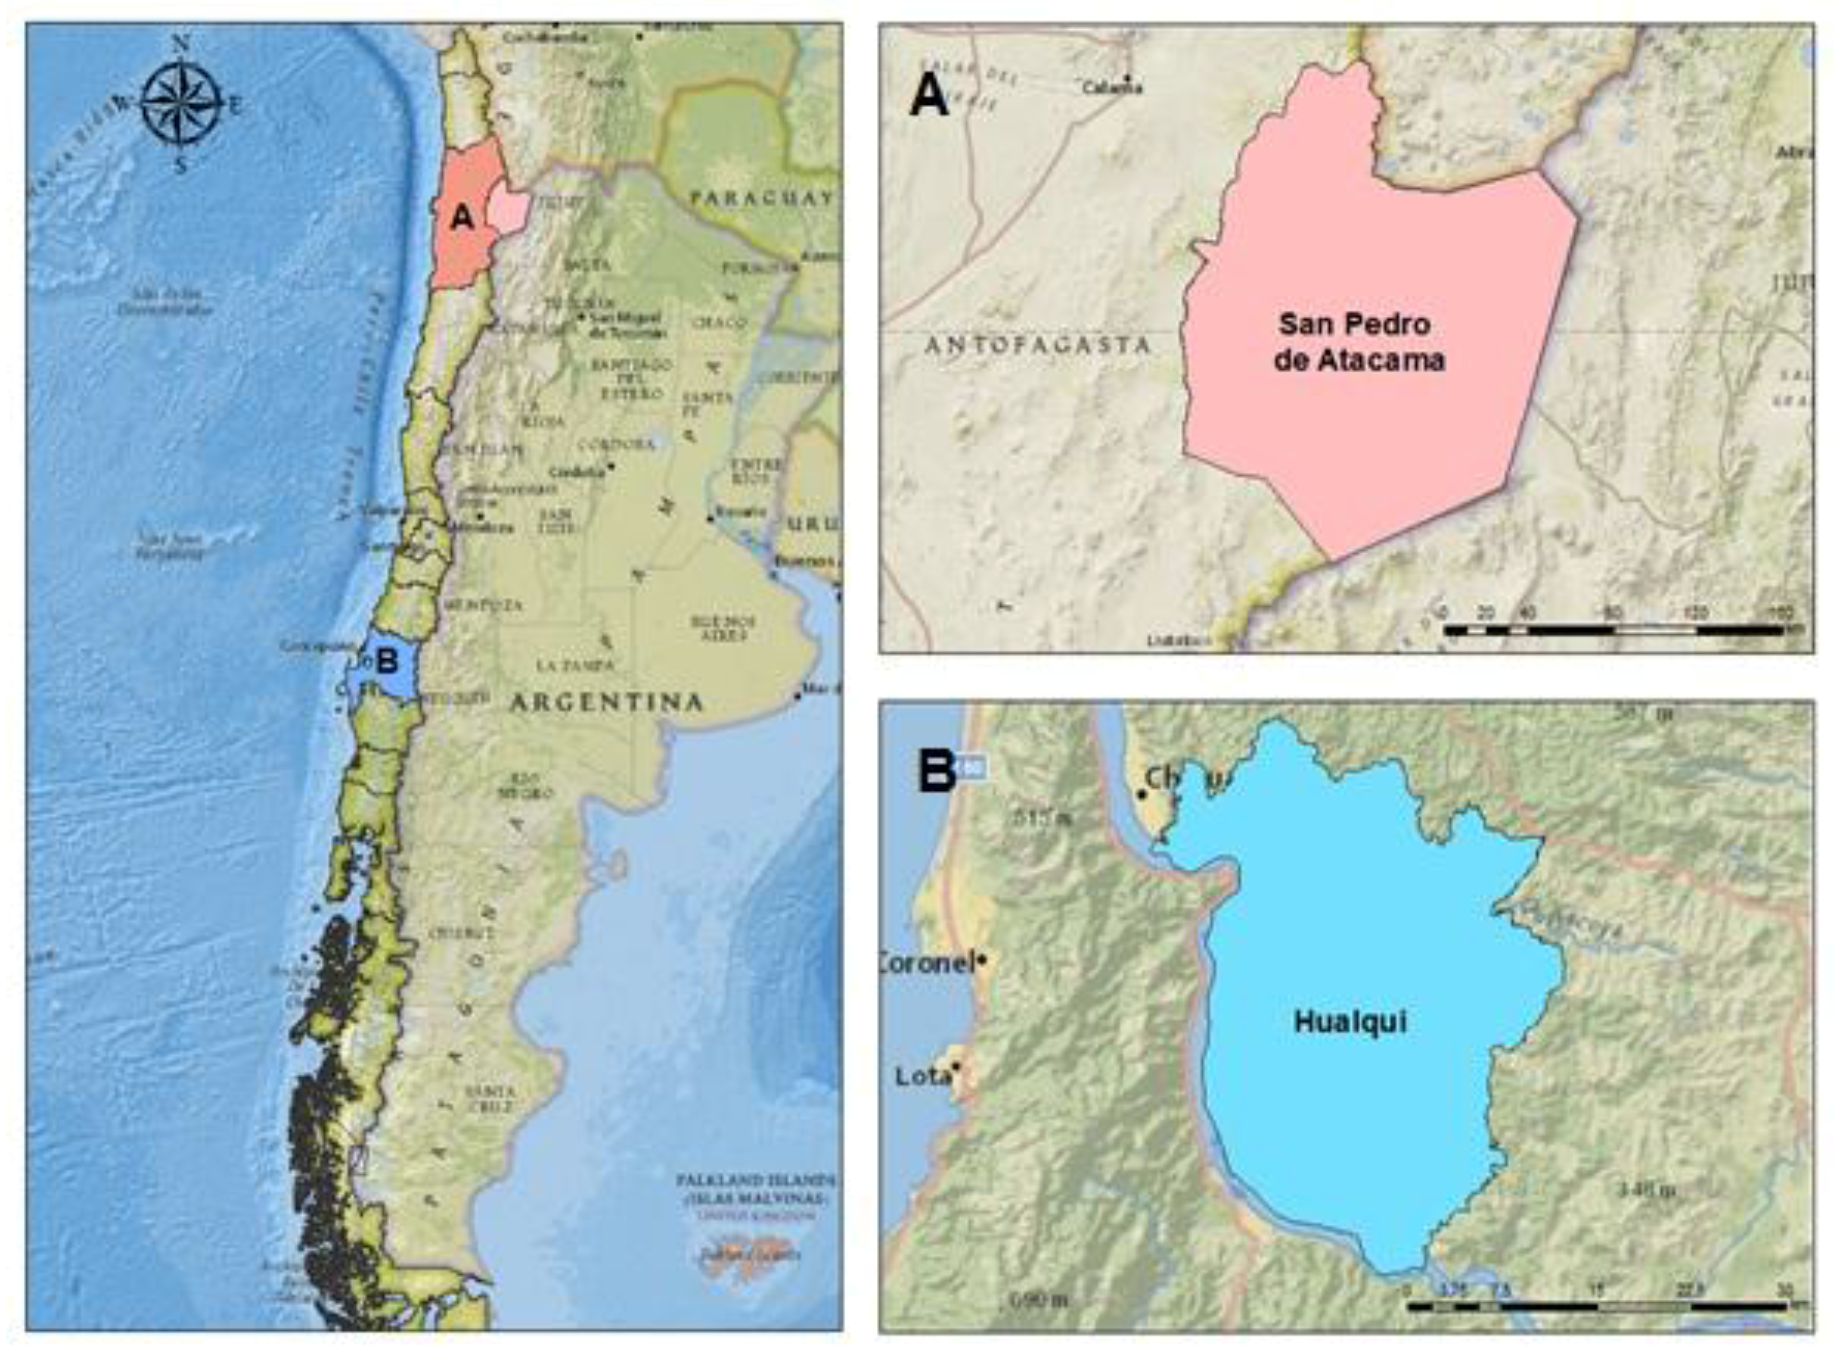
2.1.1. Characteristics of the Study Area
2.1.2. Participants in the Study Areas
2.2. Instrument and Its Application
2.2.1. Determination of the Sample
2.2.2. Adaptation and Validation of the Instrument
2.2.3. Application of the Instrument
2.3. Data Analysis
2.3.1. Frequency Analysis
2.3.2. Chi Square Test
2.3.3. Intention of Use
3. Results
3.1. Knowledge of Water Source and Treated Sewage Water
3.2. Public Perception towards Treated Sewage Reuse
3.3. Public Acceptability of Treated Sewage Reuse
4. Discussion
4.1. Availability and Uses of Water Resources in Chile
4.2. Sewage Treatment in Chile
4.3. Public Perception of the Reuse of Treated Sewage Water
5. Conclusions
Acknowledgments
Author Contributions
Conflicts of Interest
References
- Ministry of the Interior and Public Security (MIPS). National Policy for Water Resources. Chilean Government, 2015. Available online: http://www.interior.gob.cl/media/2015/04/recursos_hidricos.pdf (accessed on 15 August 2016). (In Spanish)
- Center for Climate Science and Resilience (CR2). The Mega Drought 2010–2015: A Lesson for the Future. 2015. Available online: http://www.forestal.uach.cl/manejador/resources/2015informe-a-la-nacinla-megasequia-2010-2015una-leccion-para-el-futuro-1.pdf (accessed on 20 September 2016). (In Spanish).
- Elimelech, M. The global challenge for adequate and safe water. J. Water Suppl. Res. Technol. AQUA 2006, 55, 3–10. [Google Scholar] [CrossRef]
- Pereira, L.S.; Oweis, T.; Zairi, A. Irrigation management under water scarcity. Agric. Water Manag. 2002, 57, 175–206. [Google Scholar] [CrossRef]
- Superintendence of Sanitary Services (SSS). Wastewater Treatment System. Chilean Government, 2016. Available online: http://www.siss.gob.cl/577/w3-article-4373.html (accessed on 15 May 2016).
- Ministry of Social Development (MSD). Methodology Formulation and Evaluation of Evacuation Projects, Treatment and Sewage Disposal in Rural Sector. Chilean Government, 2015. Available online: http://docplayer.es/17138750-Metodologia-formulacion-y-evaluacion-de-proyectos-de-evacuacion-tratamiento-y-disposicion-de-aguas-servidas-sector-rural.html (accessed on 15 August 2016).
- Recycled Water Task Force. White Paper of the Public Information, Education and Outreach Workgroup on Better Public Involvement in the Recycled Water Decision Process; The State of California Department of Water Resources: Sacramento, CA, USA, 2003.
- Po, M.; Nancarrow, B.; Kaercher, J. Literature Review of Factors Influencing Public Perceptions of Water Reuse; Report to Australian Urban Water Conservation and Reuse Research Program; CSIRO Land and Water: Floreat, Australia, 2003. [Google Scholar]
- Zhang, Z.; Balay, J. How much is too much?: Challenges to water withdrawal and consumptive use management. J. Water Resour. Plan. Manag. 2014, 140, 01814001. [Google Scholar] [CrossRef]
- Gu, Q.; Chen, Y.; Pody, R.; Cheng, R.; Zheng, X.; Zhang, Z. Public perception and acceptability toward reclaimed water in Tianjin. Resour. Conserv. Recycl. 2015, 104, 291–299. [Google Scholar] [CrossRef]
- Jeffrey, P.; Jefferson, B. Public receptivity regarding “in-house” water recycling: Results from a UK survey. Water Sci. Technol. Water Suppl. 2013, 3, 109–116. [Google Scholar]
- Baggett, S.; Jeffrey, P.; Jefferson, B. Risk perception in participatory planning for water reuse. Desalination 2006, 187, 149–158. [Google Scholar] [CrossRef]
- Hartley, T. Public perception and participation in water reuse. Desalination 2006, 187, 115–126. [Google Scholar] [CrossRef]
- Yañez, N.; Molina, R. Indigenous Waters in Chile; LOM Editions: Santiago, Chile, 2014. (In Spanish) [Google Scholar]
- National Statistics Institute (INE). Preliminary Results Census of Population and Housing. Chilean Government, 2012. Available online: https://www.cooperativa.cl/noticias/site/artic/20120831/asocfile/20120831161553/resultados_preliminares_censo_2012.pdf (accessed on 16 August 2016).
- National Statistics Institute (INE). Social Statistics of Indigenous People in Chile. Chilean Government, 2002. Available online: www.ine.cl/docs/default-source/FAQ/estadisticas.zip?sfvrsn=4 (accessed on 31 August 2017).
- EducarChile. Indigenous People of Chile. 2003. Available online: http://www.educarchile.cl/ech/pro/app/detalle?ID=185562 (accessed on 1 September 2017).
- Sampieri, R.; Collado, C.F.; Lucio, P.B. Research Methodology; Editorial Mc Graw Hill: Mexico City, México, 2006; pp. 260–270. [Google Scholar]
- Huerta, J. Procedure for Writing and Validating Questionnaires for Research and Evaluation Studies; University of Puerto Rico, Mayagüez Campus: Mayagüez, Puerto Rico, 2005. [Google Scholar]
- Vicéns, J.; Medina, E. Análisis de Datos Cualitativos (Versión Electrónica). 2005. Available online: https://www.uam.es/personal_pdi/economicas/eva/pdf/tab_conting.pdf (accessed on 31 January 2017).
- Buchi, H. The Economic Transformation of Chile; From Statism to Economic Freedom; Norma Editorial Group: SantaFé de Bogotá, Colombia, 1993. (In Spanish) [Google Scholar]
- Vera, I.; Sáez, K.; Vidal, G. Performance of 14 full-scale sewage treatment plants: Comparison between four aerobic technologies regarding effluent quality, sludge production and energy consumption. Environ. Technol. 2013, 34, 2267–2275. [Google Scholar] [CrossRef] [PubMed]
- Vera, I.; García, J.; Sáez, K.; Moragas, L.; Vidal, G. Performance evaluation of eight years’ experience from constructed wetlands systems in Catalonia as alternative treatment for small communities. Ecol. Eng. 2011, 37, 364–371. [Google Scholar] [CrossRef]
- Chamorro, S.; Hernandez, V.; Matamoros, V.; Dominguez, C.; Becerra, J.; Vidal, G.; Piña, B.; Bayona, J.M. Chemical characterization of organic microcontaminant sources and biological effects in riverine sediments impacted by urban sewage and pulp mill discharges. Chemosphere 2013, 90, 611–619. [Google Scholar] [CrossRef] [PubMed]
- Vera, I.; Araya, F.; Andrés, E.; Sáez, K.; Vidal, G. Enhanced phosphorus removal from sewage in subsurface treatment wetland through zeolite as medium and artificial aeration. Environ. Technol. 2014, 35, 1639–1649. [Google Scholar] [CrossRef] [PubMed]
- Yeber, M.C.; Soto, C.; Riveros, R.; Navarrete, J.; Vidal, G. Copper (II) and toxicity removal using a photocatalytic process with TiO2 as semiconductor. Chem. Eng. J. 2009, 152, 14–19. [Google Scholar] [CrossRef]
- Dishman, C.M.; Sherrard, J.H.; Rebhun, M. Gaining public support for direct potable water reuse. J. Prof. Issues Eng. 1989, 115, 154–161. [Google Scholar] [CrossRef]
- Marks, J.; Cromar, N.; Fallowfield, H.; Oemcke, D. Community experience and perceptions of water reuse. Water Sci. Technol. Water Suppl. 2003, 3, 9–16. [Google Scholar]
- Vidal, G.; Araya, F. Sewage and Its Treatment in Rural Areas: Current Situation and Challenges; Editions University of Concepcion: Concepcion, Chile, 2014; p. 118. ISBN 978-956-227-378-7. [Google Scholar]
- Hurlimann, A.; McKay, J. Urban Australians using recycled water for domestic non-potable use—An evaluation of the attributes price, colour and odour using conjoint analysis. J. Environ. Manag. 2007, 83, 93–104. [Google Scholar] [CrossRef] [PubMed]


| Characteristics | San Pedro de Atacama | Hualqui |
|---|---|---|
| Region | Antofagasta | Biobío |
| Province | El Loa | Concepción |
| Latitude | 22°55′0′′ | 36°57′36′′ |
| Longitude | 68°12′0′′ | 72°55′48′′ |
| Weather/climate | Cold desert | Warm temper |
| Average/annual range temperature (°C) | 17 °C (−1 to 25 °C) | 12 °C (9 to 18 °C) |
| Average annual precipitation | 44.57 mm | 663.11 mm |
| Primary and secondary economic activities | Extractions of borax, sodium, potassium and lithium | Agriculture, pine plantations |
| Tertiary economic activity | Tourism | Tourism |
| Main indigenous group | Atacameños | Mapuches |
| Demographic Characteristics | Options | San Pedro de Atacama | Hualqui | ||
|---|---|---|---|---|---|
| Percentage | Frequency | Percentage | Frequency | ||
| Gender | Male | 46.3 | 118 | 36.6 | 98 |
| Female | 53.7 | 137 | 63.4 | 170 | |
| 15–29 | 19.2 | 49 | 18.7 | 50 | |
| Age | 30–44 | 41.2 | 105 | 23.5 | 63 |
| 45–64 | 30.6 | 78 | 39.9 | 107 | |
| >65 | 9.0 | 23 | 17.9 | 48 | |
| Student | 1.6 | 4 | 10.1 | 27 | |
| Housewife | 11.4 | 29 | 30.6 | 82 | |
| Occupation | Self-employed | 43.9 | 112 | 31.0 | 83 |
| Hired worker | 35.7 | 91 | 17.9 | 48 | |
| Unemployed | 2.4 | 6 | 3.4 | 9 | |
| Retired | 51 | 13 | 7.1 | 19 | |
| Total | - | 100% | 255 | 100% | 268 |
| Social Background |
|---|
| 1. Gender: A. Male; B. Female |
| 2. Age: A. 15–29; B. 30–44; C. 45–64; D. > 65 |
| 3. Education: A. No studies; B. Incomplete basic studies; C. Complete basic studies; D. Incomplete media studies; E. Complete media studies; F. Incomplete technician; G. Incomplete university; H. Complete technician; I. Complete university |
| 4. Occupation: A. Student; B. Housewife; C. Self-employed; D. Hired worker; E. Unemployed; F. Pensioner |
| Knowledge of Water Resources and Treated Sewage Reuse |
| 5. Does your house have a sewage disposal system? A. Yes; B No |
| 6. What is the main potable water source in your region? A. Drinking water supply; B. Groundwater; C. Water well; D. Rivers and reservoirs; E. Water truck; F. Another source |
| 7. Which sector is the biggest user of water in the region? |
| A. Agricultural; B. Domestic; C. Industry; D. Mining; E. Energy; F. Forest; G. Aquaculture; H. Tourism; I. No idea |
| 8. Does your region have sufficient water? |
| A. Severe shortage; B. Summer shortage; C. Sufficient water supply; D. No idea |
| 9. Where are the wastewater primarily discharged to? |
| A. Wastewater treatment plant (WWTP); B. Rivers and reservoirs without treatment; C. Sea; D. Groundwater infiltration; E. No idea |
| 10. Do you use responsible water in your home? |
| A. Yes; B. No |
| 11. What activity uses the most water in your house? |
| A. Cooking; B. Bathing and laundry; C. House cleaning; D. Others |
| 12. Do you use water-saving measures in your home? |
| A. Yes; B. No |
| 13. Have you ever been asked to use water-saving measures? |
| A. Yes; B. No |
| 14. Is public usage a waste of water? |
| A. Yes; B. No |
| 15. Do you know about treated sewage reuse? |
| A. Yes; B. No |
| 16. If the previous answer was yes, where do you have this knowledge? |
| A. Media; B. Social organization; C. Government organization; D. Friends or Family; E. Professional knowledge; F. No idea |
| 17. What do you understand by treated sewage reuse? |
| 18. Do you have previous experience with treated sewage reuse? |
| A. Yes; B. No |
| 19. In your opinion, is treated sewage reuse useful to face water shortages? |
| A. Yes; B. No |
| 20. In your opinion, who must be in charge of generating treated sewage reuse? |
| A. Government; B. Private Company; C. Community; D. Other |
| 21. Will you trust in the water quality? |
| A. Yes; B. No; C. No idea; D. No comment |
| 22. Would you be willing to pay for the additional treatment? |
| A. Yes; B. No; C. No idea; D. No comment |
| Public Acceptability toward Treated Sewage Reuse |
| 23. Do you accept reuse of treated sewage for potable domestic purpose? |
| A. Strongly agree; B. Agree; C. Neither agree nor disagree; D. In disagreement; E. Strongly disagree |
| 24. Do you accept reuse of treated sewage for non-potables domestic purposes? |
| A. Strongly agree; B. Agree; C. Neither agree nor disagree; D. In disagreement; E. Strongly disagree |
| 25. Do you accept reuse of treated sewage for fountains? |
| A. Strongly agree; B. Agree; C. Neither agree nor disagree; D. In disagreement; E. Strongly disagree |
| 26. Do you accept reuse of treated sewage for landscape irrigation? |
| A. Strongly agree; B. Agree; C. Neither agree nor disagree; D. In disagreement; E. Strongly disagree |
| 27. Do you accept reuse of treated sewage for toilet flushing? |
| A. Strongly agree; B. Agree; C. Neither agree nor disagree; D. In disagreement; E. Strongly disagree |
| 28. Do you accept reuse of treated sewage for car washing? |
| A. Strongly agree; B. Agree; C. Neither agree nor disagree; D. In disagreement; E. Strongly disagree |
| 29. Do you accept reuse of treated sewage for road dust control? |
| A. Strongly agree; B. Agree; C. Neither agree nor disagree; D. In disagreement; E. Strongly disagree |
| 30. Do you accept reuse of treated sewage for groundwater infiltration? |
| A. Strongly agree; B. Agree; C. Neither agree nor disagree; D. In disagreement; E. Strongly disagree |
| 31. Do you accept reuse of treated sewage for agricultural irrigation at ground level? |
| A. Strongly agree; B. Agree; C. Neither agree nor disagree; D. In disagreement; E. Strongly disagree |
| 32. Do you accept reuse of treated sewage for agricultural trees irrigation? |
| A. Strongly agree; B. Agree; C. Neither agree nor disagree; D. In disagreement; E. Strongly disagree |
| 33. Do you accept reuse of treated sewage for industrial processes? |
| A. Strongly agree; B. Agree; C. Neither agree nor disagree; D. In disagreement; E. Strongly disagree |
| Question | Options | San Pedro de Atacama | Hualqui | ||
|---|---|---|---|---|---|
| Percentage | Frequency | Percentage | Frequency | ||
| What is the main potable water source in your region? | Drinking water supply | 84.7 | 216 | 78.4 | 210 |
| Groundwater | - | - | 7.8 | 21 | |
| Water well | 4.7 | 12 | 1.5 | 4 | |
| Rivers and reservoirs | 4.7 | 12 | 6.3 | 17 | |
| Water truck | 5.1 | 13 | 4.5 | 12 | |
| Another source | 0.8 | 2 | 1.5 | 4 | |
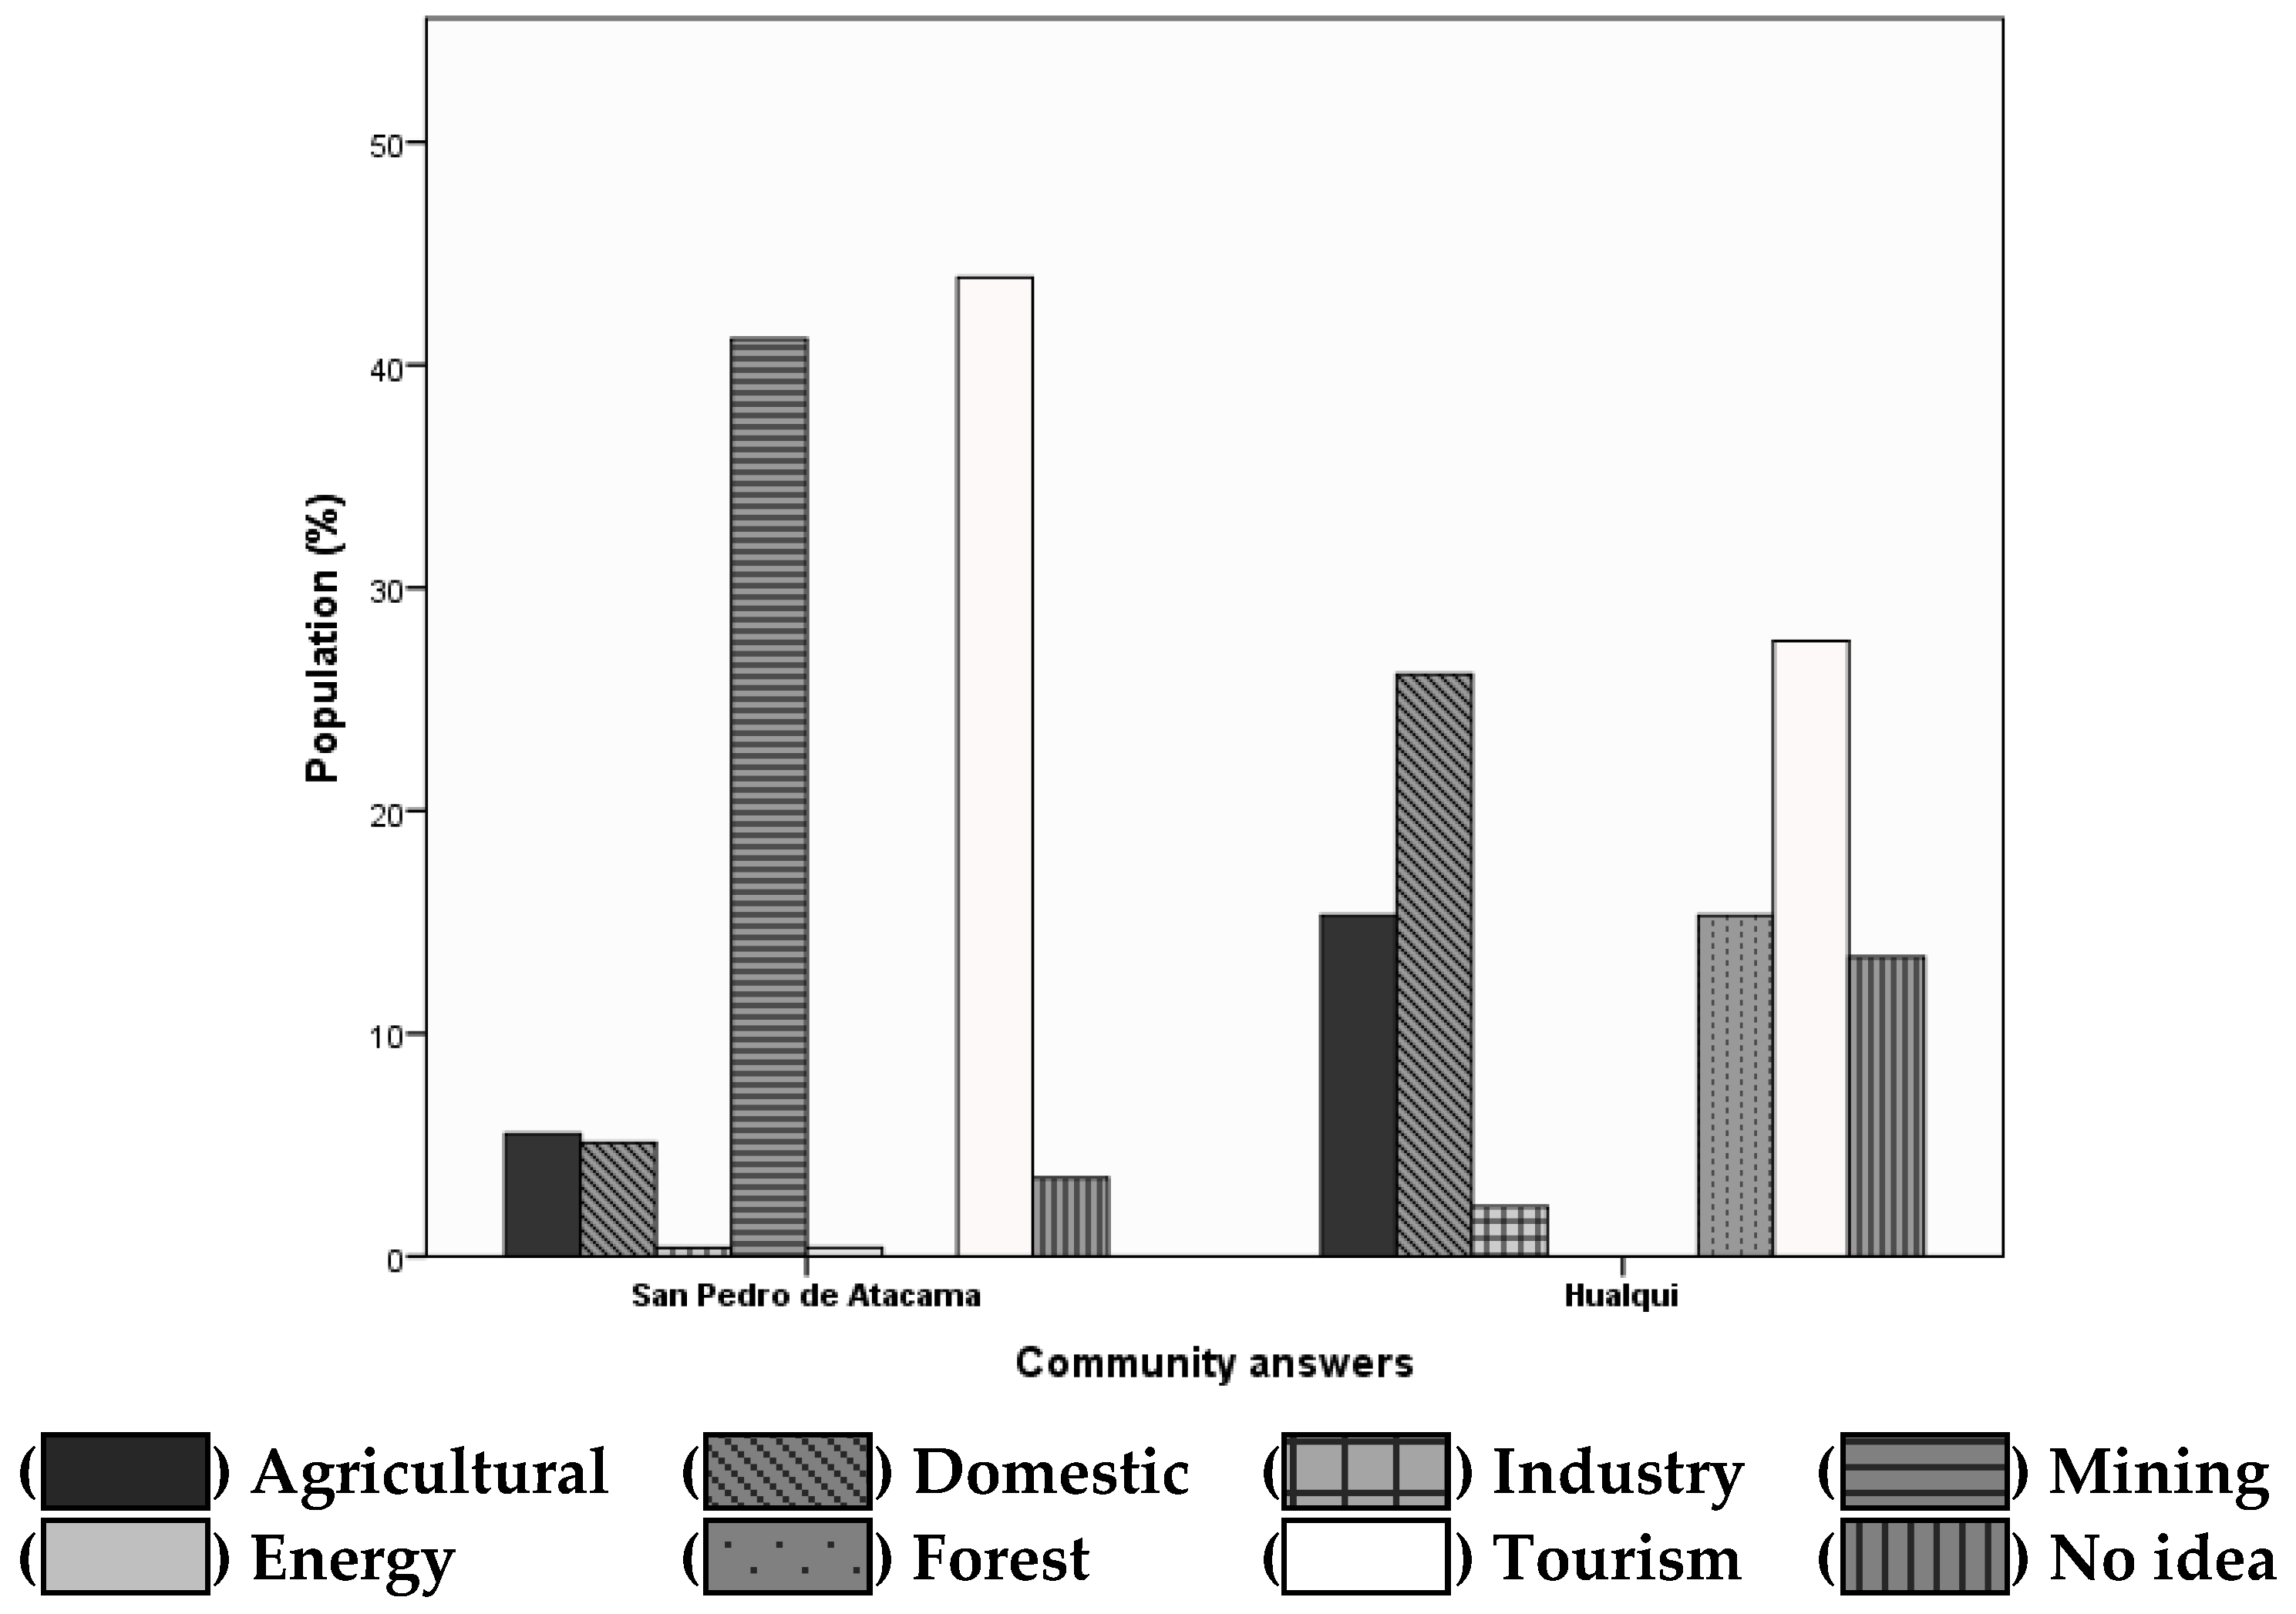
| Which sector is the biggest user of water in the region? | Agricultural | 5.5 | 14 | 15.3 | 41 |
| Domestic | 5.1 | 13 | 26.1 | 70 | |
| Industry | 0.4 | 1 | 2.2 | 6 | |
| Mining | 41.2 | 105 | - | - | |
| Energy | 0.4 | 1 | - | - | |
| Forest | - | - | 15.3 | 41 | |
| Aquaculture | - | - | - | - | |
| Tourism | 43.9 | 112 | 27.6 | 74 | |
| No idea | 3.5 | 9 | 13.4 | 36 | |
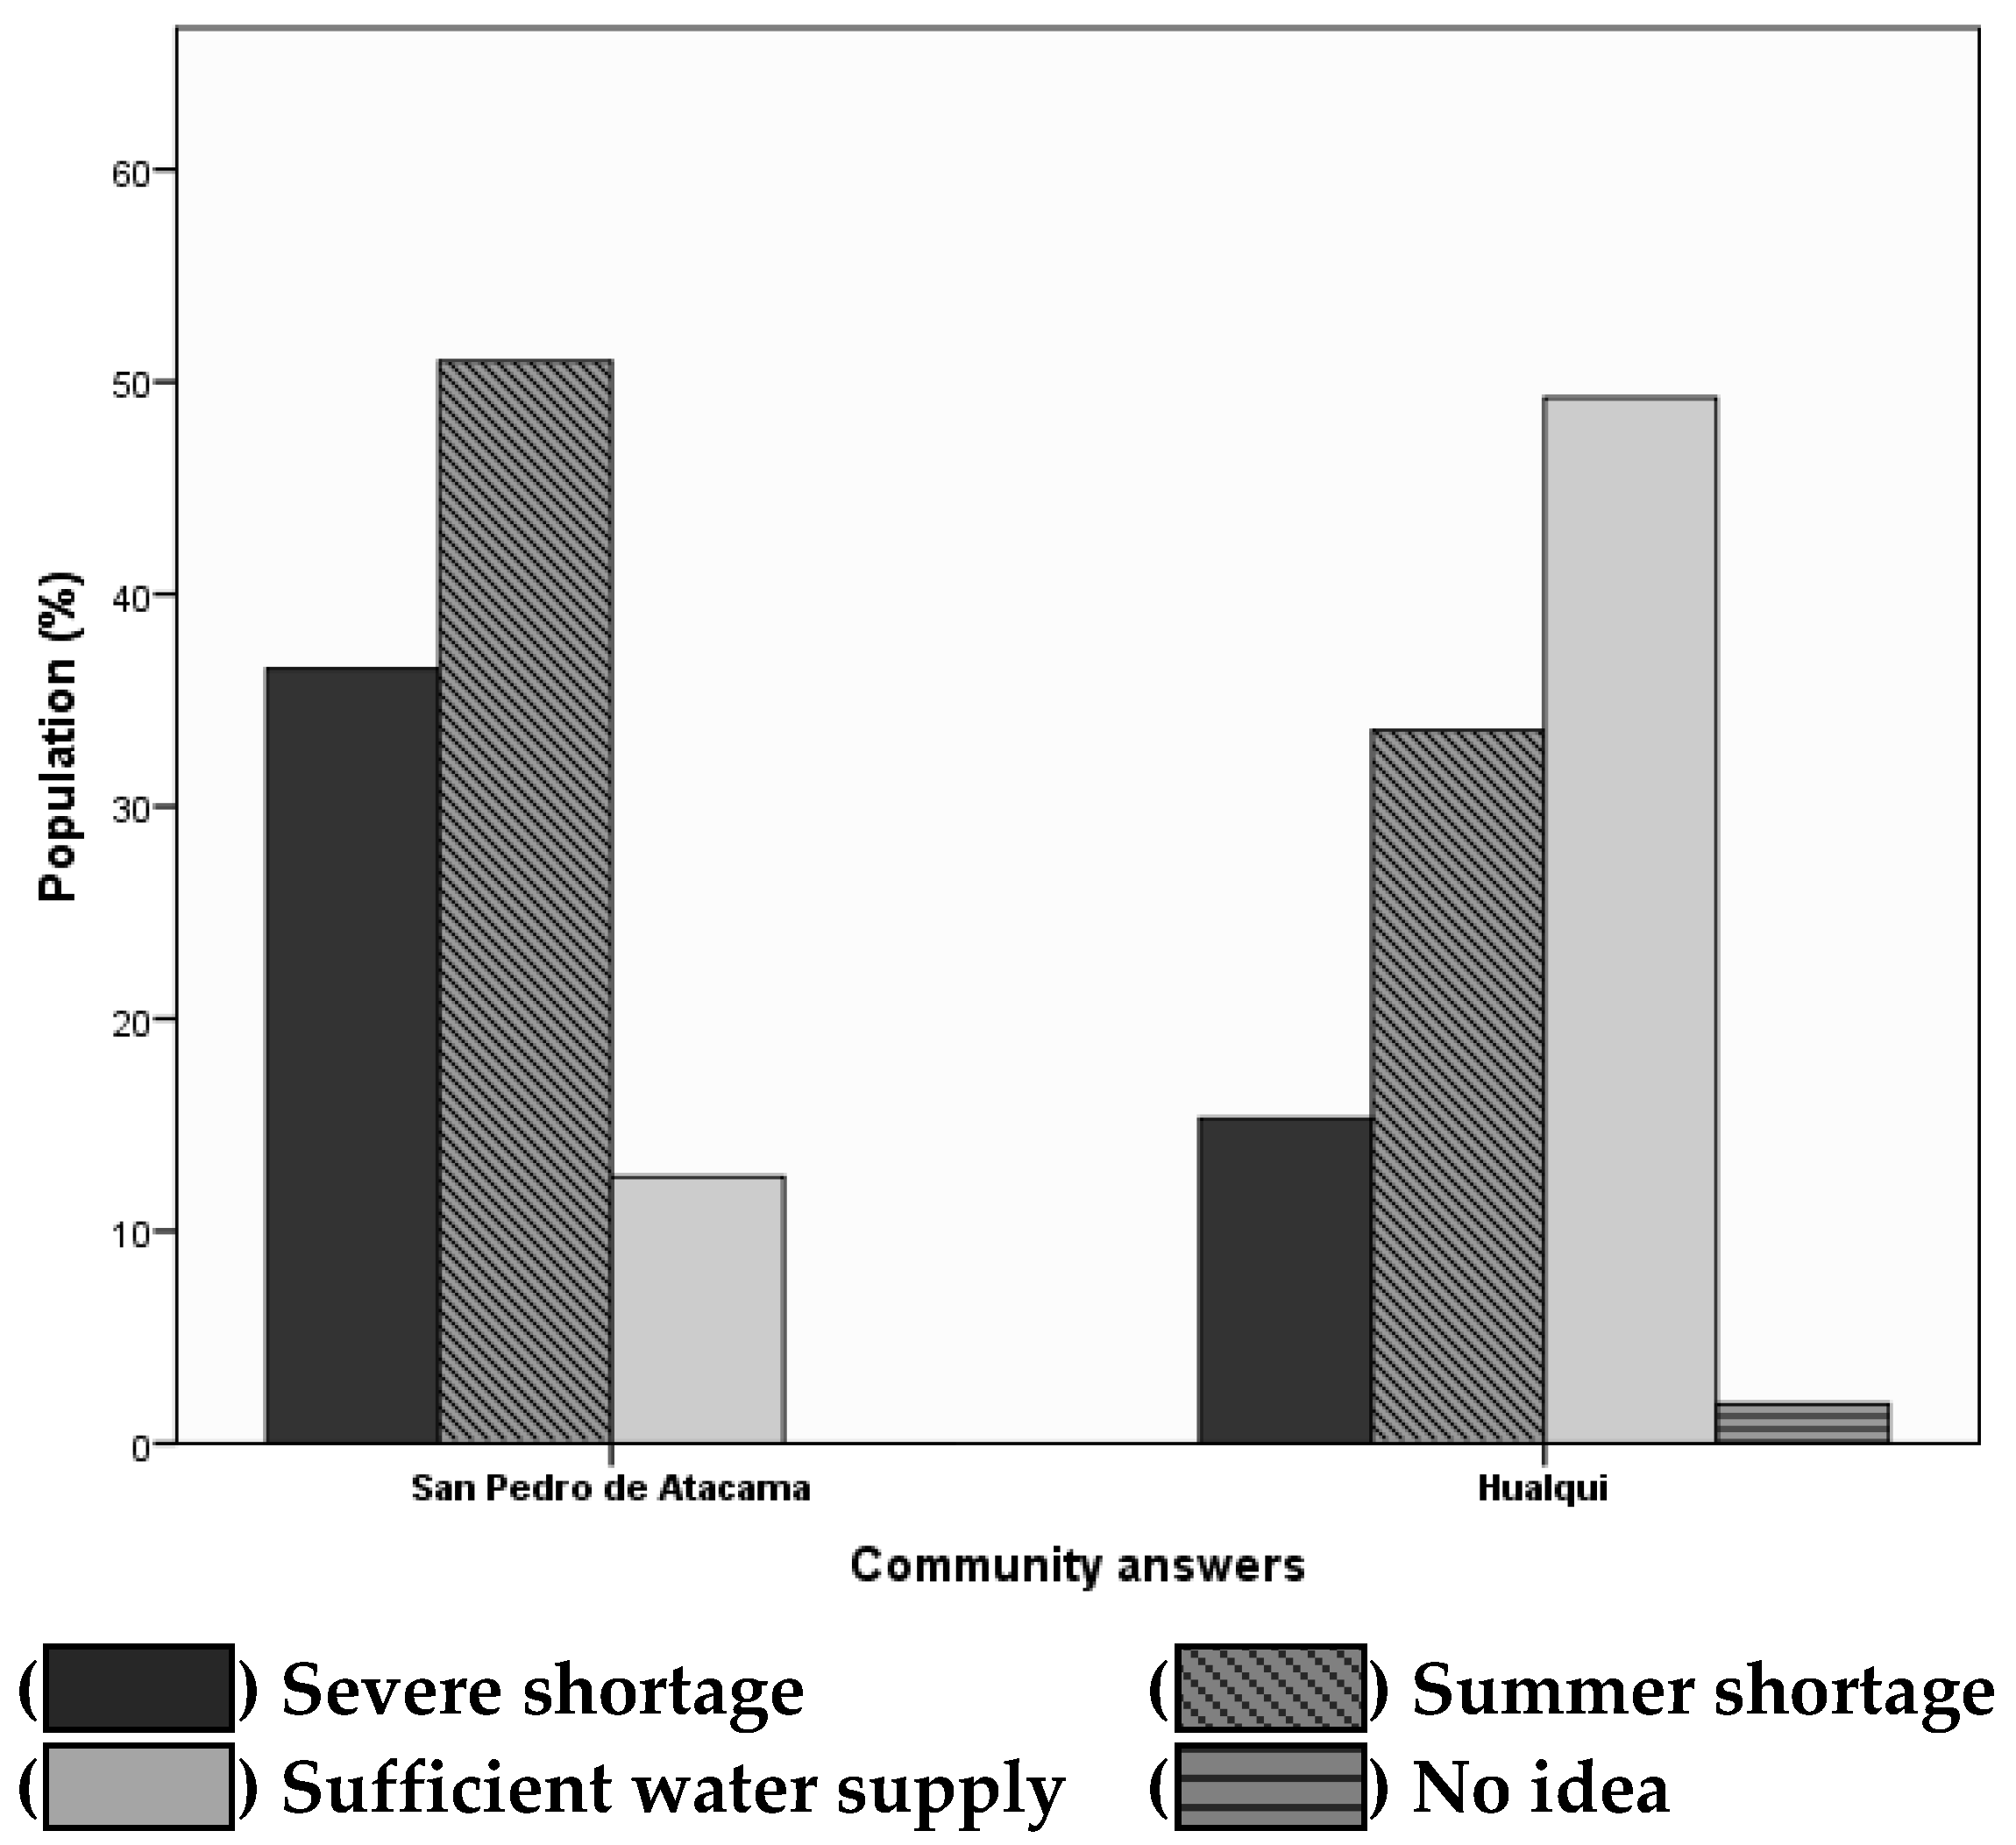
| Does your region have sufficient water? | Severe shortage | 36.5 | 93 | 15.3 | 41 |
| Summer shortage | 51.0 | 130 | 33.6 | 90 | |
| Sufficient water supply | 12.5 | 32 | 49.3 | 132 | |
| No idea | - | - | 1.9 | 5 | |
| Where are the wastewater primarily discharged to? | WWTP | 76.1 | 194 | 65.3 | 175 |
| Rivers and reservoirs without treatment | 0.4 | 1 | 4.1 | 11 | |
| Groundwater infiltration | 21.6 | 55 | 25.7 | 69 | |
| No idea | 2.0 | 5 | 4.9 | 13 | |
| Total | - | 100% | 255 | 100 % | 268 |
| Question | Options | San Pedro de Atacama | Hualqui | ||
|---|---|---|---|---|---|
| Percentage | Frequency | Percentage | Frequency | ||
| Do you know about treated sewage reuse? | Yes | 47.1 | 120 | 29.1 | 78 |
| No | 52.9 | 135 | 70.9 | 190 | |
| If the previous answer was yes, where do you have this knowledge? | Media | 16.1 | 41 | 17.9 | 48 |
| Social Organization | 7.5 | 19 | 1,1 | 3 | |
| Government Organization | 0.8 | 2 | - | - | |
| Friends or Family | 6.3 | 16 | 2.2 | 6 | |
| Professional Knowledge | 16.5 | 42 | 7.8 | 21 | |
| No idea | 52.9 | 135 | 70.9 | 190 | |
| Total | - | 100% | 255 | 100% | 268 |
| Question | Options | San Pedro de Atacama | Hualqui | ||
|---|---|---|---|---|---|
| Percentage | Frequency | Percentage | Frequency | ||
| In your opinion, the treated sewage reuse it’s useful to face water shortage? | Yes | 90.6 | 231 | 79.5 | 213 |
| No | 9.4 | 24 | 20.5 | 55 | |
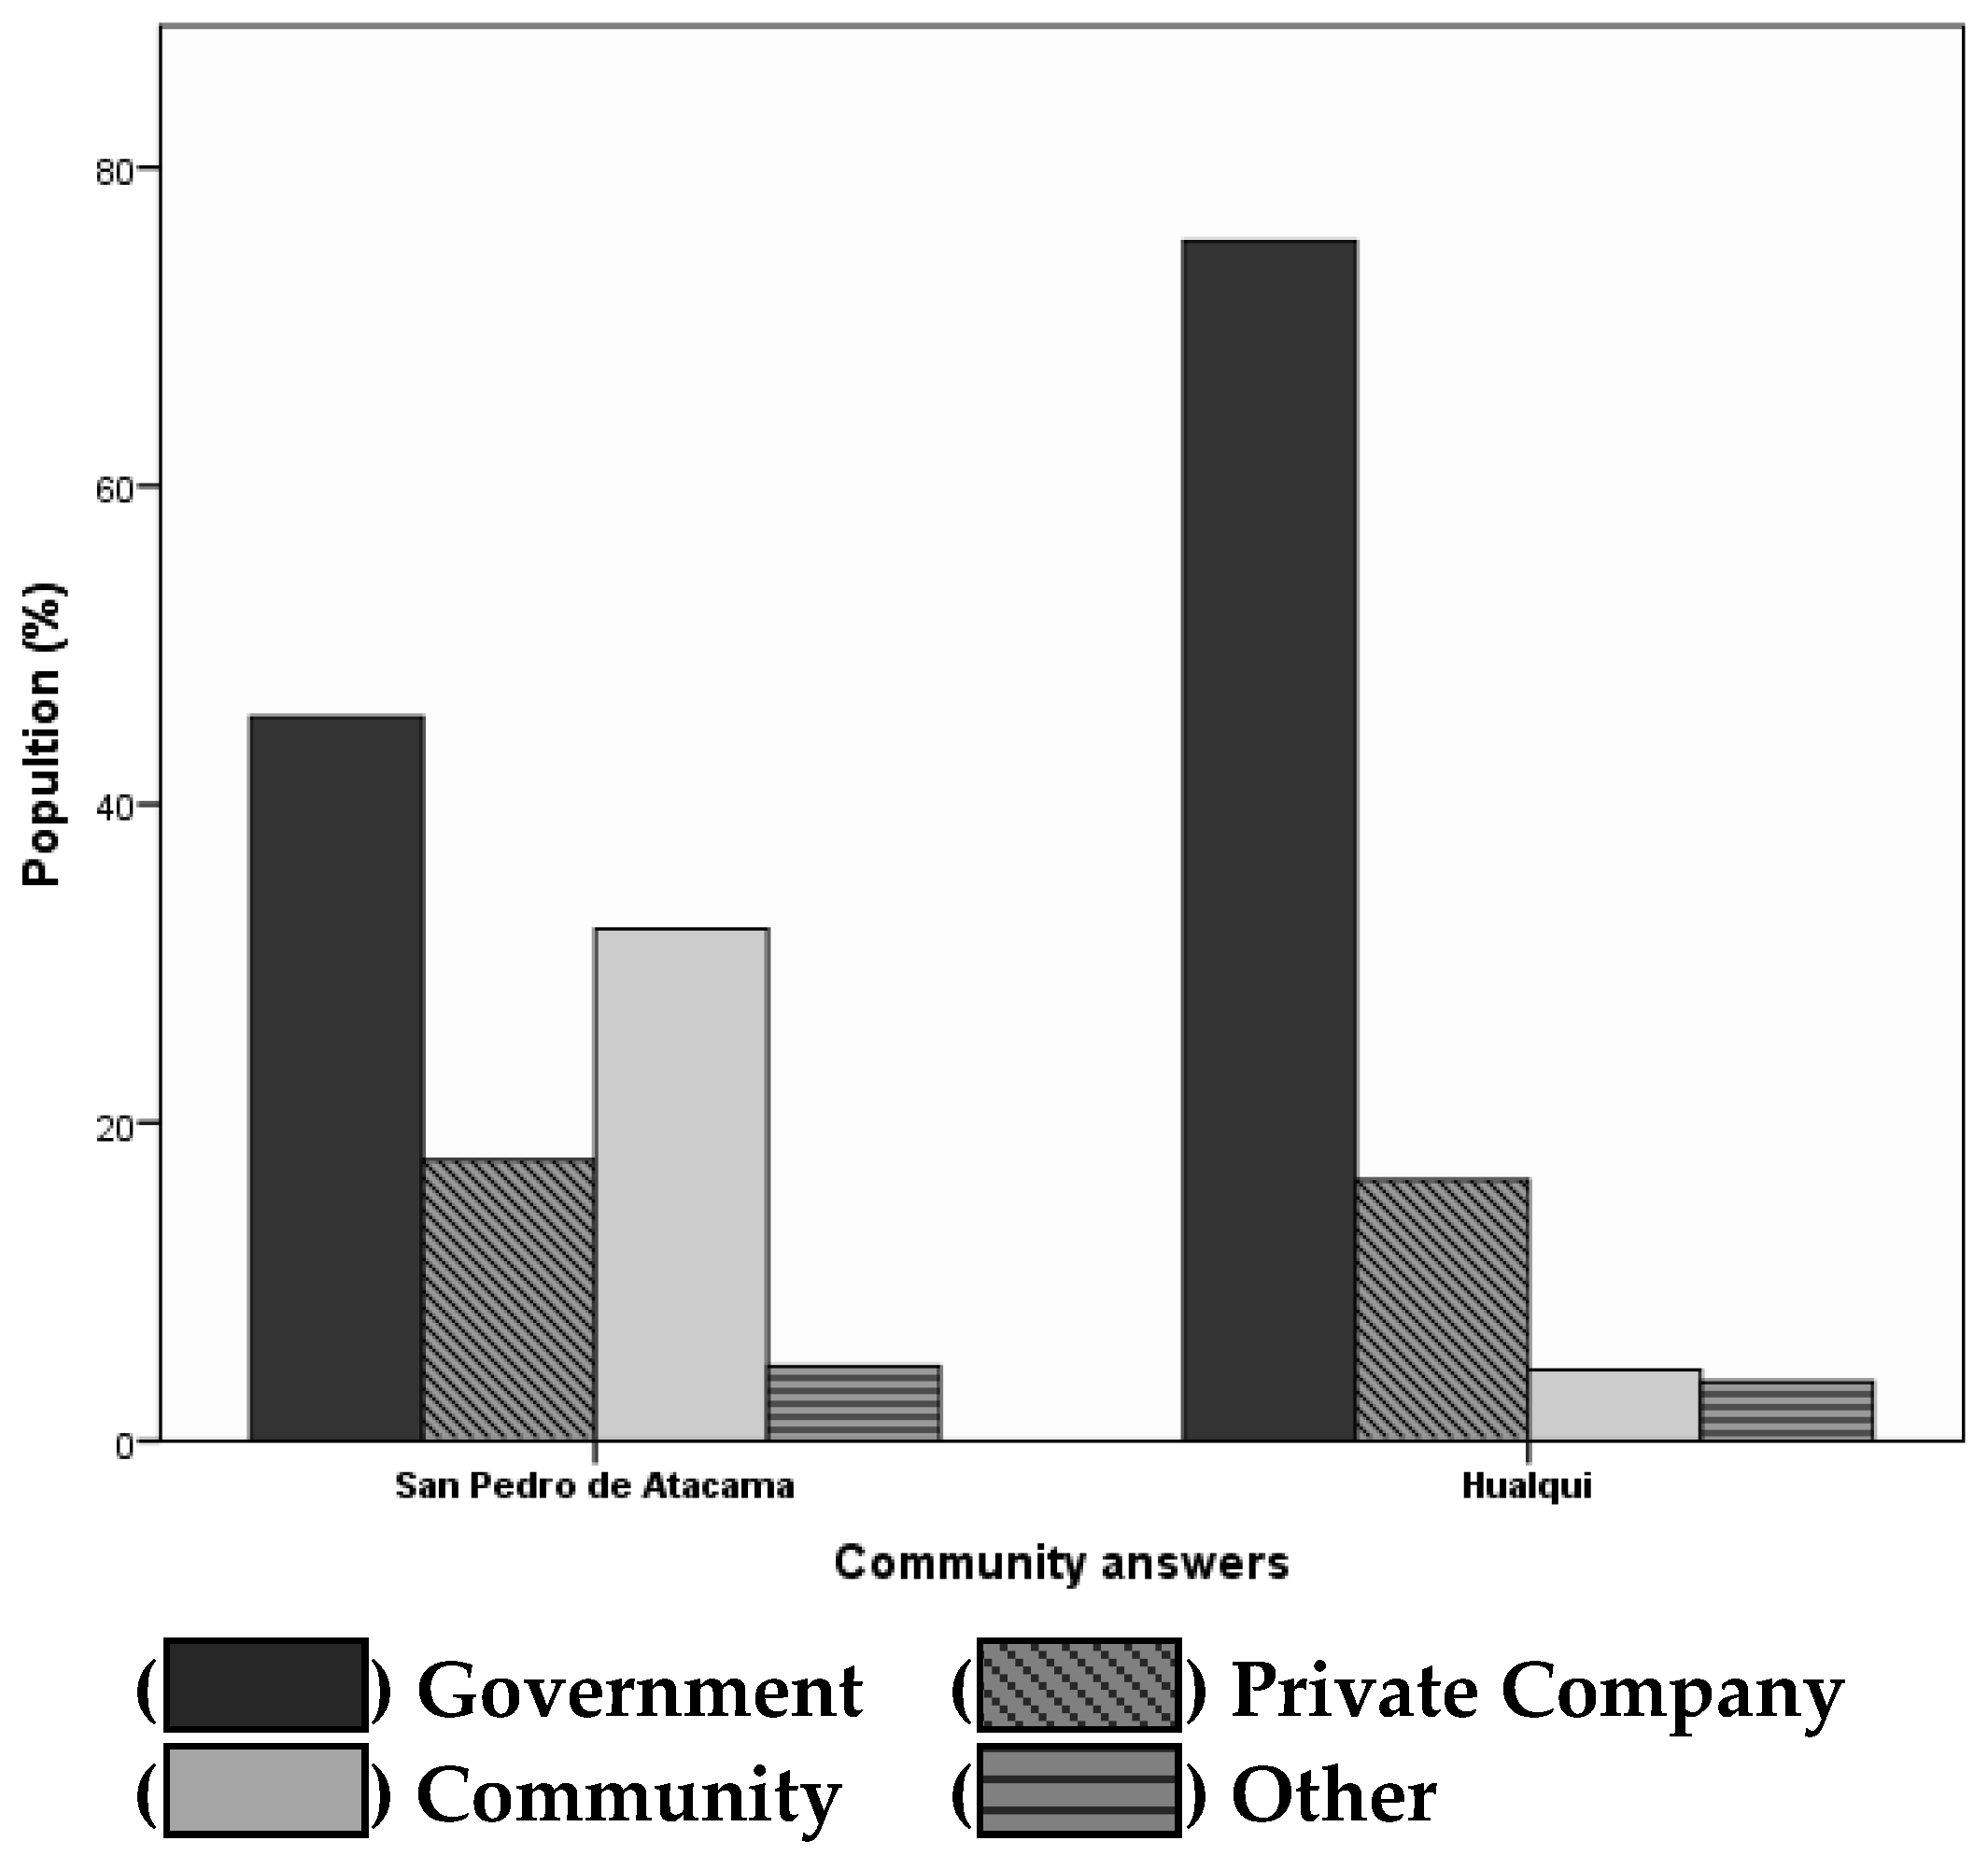
| In your opinion, who must be in charge of generating treated sewage reuse? | Government | 45.5 | 116 | 75.4 | 202 |
| Private Company | 17.6 | 45 | 16.4 | 44 | |
| Community | 32.2 | 82 | 4.5 | 12 | |
| Other | 4.7 | 12 | 3.7 | 10 | |
| Will you trust in the water quality? | Yes | 69.8 | 178 | 49.3 | 132 |
| No | 24.7 | 63 | 42.9 | 115 | |
| No idea | 5.5 | 14 | 7.8 | 21 | |
| No comment | - | - | - | - | |
| Would you be willing to pay for the additional treatment? | Yes | 71.8 | 183 | 60.8 | 163 |
| No | 21.6 | 55 | 34.0 | 91 | |
| No idea | 5.5 | 14 | 4.9 | 13 | |
| No comment | 1.2 | 3 | 0.4 | 1 | |
| Total | - | 100% | 255 | 100% | 268 |
| Question # | San Pedro de Atacama | Hualqui | ||||||||||
|---|---|---|---|---|---|---|---|---|---|---|---|---|
| SA | A | NN | ID | SD | UI | SA | A | NN | ID | SD | UI | |
| 23 | 4.3 | 35.3 | 5.5 | 32.9 | 22.0 | 2.67 | 1.1 | 33.6 | 5.6 | 50.0 | 9.7 | 2.66 |
| 24 | 14.9 | 65.1 | 7.5 | 7.8 | 4.7 | 3.78 | 8.6 | 72.8 | 3.4 | 14.2 | 1.1 | 3.74 |
| 25 | 25.9 | 50.6 | 3.5 | 13.7 | 6.3 | 3.76 | 5.6 | 72.4 | 1.1 | 18.3 | 2.6 | 3.60 |
| 26 | 34.1 | 62.0 | - | 3.5 | 0.4 | 4.26 | 7.5 | 83.6 | 0.4 | 7.5 | 1.1 | 3.89 |
| 27 | 37.3 | 56.1 | 0.8 | 5.5 | 0.4 | 4.26 | 10.8 | 85.8 | 0.4 | - | 3.0 | 4.04 |
| 28 | 31.4 | 51.8 | 1.2 | 12.2 | 3.5 | 3.95 | 9.0 | 72.8 | 0.7 | 14.9 | 2.6 | 3.71 |
| 29 | 36.9 | 45.1 | 2.0 | 14.5 | 1.6 | 4.01 | 9.3 | 73.1 | 0.7 | 13.1 | 3.7 | 3.71 |
| 30 | 14.9 | 49.8 | 9.4 | 17.6 | 8.2 | 3.45 | 4.5 | 64.6 | 4.1 | 25.0 | 1.9 | 3.45 |
| 31 | 29.4 | 53.7 | 5.1 | 11.0 | 0.8 | 4.00 | 4.9 | 70.1 | 1.5 | 21.3 | 2.2 | 3.54 |
| 32 | 31.8 | 57.3 | 2.4 | 7.8 | 0.8 | 4.11 | 5.6 | 84.0 | 1.1 | 8.6 | 0.7 | 3.85 |
| 33 | 27.5 | 47.1 | 7.5 | 14.5 | 3.5 | 3.80 | 9.0 | 68.7 | 4.9 | 17.2 | 0.4 | 3.68 |
| Wastewater Treatment Plant | Capacity (m3/s) | Type of Technology | Receiver Course | Start of Operations |
|---|---|---|---|---|
| WWTP—Gran Concepción | 1.7 | Activated mud | Biobío river | 2002 |
| WWTP—Hualqui | 0.026 | Activated mud | Hualquiestero | 2005 |
| WWTP—Gran Antofagasta | 1.5 | Submarine outfalls | Sea | 2003 |
| WWTP—San Pedro de Atacama | 0.011 | Desalination | Infiltration | 1998 |
| WWTP—El Trebal | 4.4 | Activated mud | Mapocho river | 2001 |
| WWTP—La Farfana | 8.5 | Activated mud | Mapocho river | 2003 |
© 2018 by the authors. Licensee MDPI, Basel, Switzerland. This article is an open access article distributed under the terms and conditions of the Creative Commons Attribution (CC BY) license (http://creativecommons.org/licenses/by/4.0/).
Share and Cite
Segura, D.; Carrillo, V.; Remonsellez, F.; Araya, M.; Vidal, G. Comparison of Public Perception in Desert and Rainy Regions of Chile Regarding the Reuse of Treated Sewage Water. Water 2018, 10, 334. https://doi.org/10.3390/w10030334
Segura D, Carrillo V, Remonsellez F, Araya M, Vidal G. Comparison of Public Perception in Desert and Rainy Regions of Chile Regarding the Reuse of Treated Sewage Water. Water. 2018; 10(3):334. https://doi.org/10.3390/w10030334
Chicago/Turabian StyleSegura, Daniela, Valentina Carrillo, Francisco Remonsellez, Marcelo Araya, and Gladys Vidal. 2018. "Comparison of Public Perception in Desert and Rainy Regions of Chile Regarding the Reuse of Treated Sewage Water" Water 10, no. 3: 334. https://doi.org/10.3390/w10030334
APA StyleSegura, D., Carrillo, V., Remonsellez, F., Araya, M., & Vidal, G. (2018). Comparison of Public Perception in Desert and Rainy Regions of Chile Regarding the Reuse of Treated Sewage Water. Water, 10(3), 334. https://doi.org/10.3390/w10030334