Article

Gas Exchanges and Stem Water Potential Define Stress Thresholds for Efficient Irrigation Management in Olive (Olea europea L.)

1
Department of Land Air and Water Resources, 213, Veihmeyer Hall, University California Davis, One Shields Ave., Davis, CA 95616, USA
2
Dipartimento Scienze Agrarie, Alimentari e Forestali, Università di Palermo, Viale delle Scienze Edificio 4 Ingresso H, 90128 Palermo, Italy
3
Department of Plant Sciences, Wickson Hall, University of California Davis, One Shields Avenue, Davis, CA 95616, USA
*
Author to whom correspondence should be addressed.
Water 2018, 10(3), 342; https://doi.org/10.3390/w10030342
Submission received: 4 February 2018 / Revised: 13 March 2018 / Accepted: 15 March 2018 / Published: 20 March 2018
(This article belongs to the Special Issue Advances in Agriculture Water Efficiency)

Abstract

:
With climate change and decreased water supplies, interest in irrigation scheduling based on plant water status is increasing. Stem water potential (ΨSWP) thresholds for irrigation scheduling in olive have been proposed, however, a physiologically-based evaluation of their reliability is needed. A large dataset collected at variable environmental conditions, growing systems, and genotypes was used to characterize the relation between ΨSWP and gas exchanges for olive. Based on the effect of drought stress on the ecophysiological parameters monitored, we described three levels of stress: no stress (ΨSWP above about −2 MPa), where the high variability of stomatal conductance (gs) suggests a tight stomatal control of water loss that limit ΨSWP drop, irrigation volumes applied to overcome this threshold had no effect on assimilation but reduced intrinsic water use efficiency (iWUE); moderate-stress (ΨSWP between about −2.0 and −3.5 MPa), where iWUE can be increased without damage to the photosynthetic apparatus of leaves; and high-stress (ΨSWP below about −3.5 MPa), where gs dropped below 150 mmol m−2 s−1 and the intercellular CO2 concentration increased proportionally, suggesting non-stomatal limitation to photosynthesis was operative. This study confirmed that olive ΨSWP should be maintained between −2 and −3.5 MPa for optimal irrigation efficiency and to avoid harmful water stress levels.

1. Introduction

Olive (Olea europaea L.) is a drought resistant crop traditionally grown under rainfed condition in low density plantation. Recently, with the introduction of the super-high-density (SHD) system, characterized by very high planting density (1600–2000 trees per ha) and trees trained as hedgerows, olive orchard management has changed deeply. SHD orchards offer many advantages: they reach productivity very few years after planting, allow mechanization of harvesting and partial mechanization of pruning (tree topping) and a significant reduction in production costs [1,2,3]. However, increased planting density increases light interception [4], root competition [5], and plant sensitivity to drought [6]. This suggests irrigation parameters may also need to change. Irrigation is generally based on orchard water use (e.g., crop evapotranspiration, ETc), but multiple studies have demonstrated this method, because it does not consider plant water status, may overestimate the irrigation required for optimal yield [7,8,9] and reduce orchard water use efficiency.
More efficient, plant-based irrigation scheduling would be of great benefit as climate change advances and water supplies dwindle [10,11]. Plant-based irrigation methods recognize the tree as the best indicator of its water status, and allow growers tailoring water applications to actual tree’s needs and status, thus potentially reducing the non-beneficial water uses and ensuring a precise stress control.
Among the current water status measurements available, stem water potential (ΨSWP) measured at midday, is the most reliable, and most widely studied [7,12,13,14,15]. It is used as reference of water status to calibrate new methodologies, define waters stress levels and manage deficit irrigation methodologies. However, the reported values of ΨSWP are not consistent. This lack of consistent results is probably a function of environmental variability among orchards, primarily evaporative demand [16] and the different drought resistance mechanisms of the different olive genotypes [6,17].
When stomatal conductance is used as stress indicator common pattern on the response of photosynthesis to stress intensity are found [16].
Three stages of photosynthesis inhibition as a function of water stress intensity are reported [18,19,20,21].
Under mild-to-moderate drought-stress, a parallel decline in An and gs is observed [12]. In this first stage stomata close to prevent water loss, reducing stomatal conductance (gs), photosynthetic rate (An) [22,23], and shoot growth and fruit production [24]. Therefore, intrinsic water use efficiency (iWUE) increases with stress.
More severe water deficits (stage II and III) strongly and directly affect net photosynthesis [18,25,26,27,28] and the tree’s ability to recover from stress [29,30].
In stage II Ci and gs are directly correlated showing that stomatal limitation are still predominant while in stage III Ci increases as stomata close suggesting metabolic impairments to the photosynthetic system are predominant. In this last stage, iWUE decreases.
Collectively, the results demonstrate that a physiological characterization of stress levels is needed for a more sensitive plant based deficit irrigation scheduling, with the objective of increasing WUE while maintaining yield.
In this study, we aim to characterize the relationship between midday stem water potential and gas exchange for olive at variable crop conditions. We used a large dataset from two different experiments carried out in recent years [7,17].
The variability of environmental conditions (two different locations in two different years), genotypes (‘Arbequina’, ‘Nocellara del Belice’, and ‘Olivo di Mandanici’) and planting design and tree density (super high density, high density, and low density) provide sufficient wide dataset to smooth out variability in physiological behavior generally associated to difference in experimental conditions [31].
The different mechanisms involved in stomatal and non-stomatal control of photosynthesis at the different stress levels are investigated and used to define ΨSWP thresholds for irrigation of olive orchards that satisfy good physiologically-based criteria for a sustainable and efficient irrigation management.
Overall aim was to provide practical recommendation to improve irrigation management and avoid harmful stress while maintaining orchard productivity.

2. Materials and Methods

Data were collected during two different experiments. The first experiment was carried out in 2009 season in the same SHD orchard (cultivar ‘Arbequina’, 1905 trees/ha) where Marra et al. [7] made their experiment.
The orchard was planted in 2004 on a private farm located in Southern Italy (37°48′0′′ N, 12°26′0′′ E, 12 m altitude). The climate of the area and the experimental soil have been described in Marra et al. [7].
Five different irrigation treatments were imposed, corresponding to 16%, 21%, 41%, 62% and 83% of Crop Water Requirement (CWR). The FAO CROPWAT model for deficit irrigation scheduling was used to calculate CWR starting from the ETc and rain data.
ETc was established a priori using FAO procedure published as FAO Irrigation and Drainage Paper No. 56 [32]. In particular, ETc was calculated as ETc = ETo × Kc × Kr, where ETo (30-year average reference evapotranspiration) was estimated using the Penman–Monteith equation and environmental data provided by a public weather station (SIAS, Servizio Informativo Agrometeorologico Siciliano), located in the proximity of the orchard; Kc is crop coefficient obtained from literature [32,33,34,35,36] and varied from 0.50 to 0.75, depending on the phenology of the trees; Kr is a coefficient related to the percentage of ground covered by the crop and resulted 0.58 based on measurements of canopy volume and subsequent calculations of the percentage of ground area coverage (42%).
Details on the irrigation system and orchard practices were also given in Marra et al. [7].
A randomized block design was used with 5 blocks of 45 trees each (9 trees per treatment), distributed between three adjacent rows; within each block one tree per irrigation treatment was randomly selected in the central row and subsequently monitored. Stem water potential (ΨSWP) and gas exchanges were measured on the 11 August, when the trees are more resistant to drought, and 1 September, when the trees are sensitive to drought [37].
The second experiment was carried out in 2014, in two adjoining olive orchards located near Sciacca (37′32′′ N, 150 m above sea level) in southwest Sicily (Italy), the same area where Marino et al. [15] conducted their experiment. A more detailed description of the climate and the soil is reported in Marino et al. [6].
Out of the two adjoining orchards, one was a traditional 10-year-old widely spaced (200 trees/ha) orchard (cv. ‘Nocellara del Belice’). Trees were trained as vase shape and rain-fed all over the season.
The adjoining orchard was a hedgerow trained high density (HD, 1000 trees/ha) 3-year-old orchard. Two genotypes (‘Nocellara del Belice’ and ‘Olivo di Mandanici’), characterized by different vigor and productive potential [38] were monitored for their response to short term water deficit. The irrigation was supplied from June, every 7–10 days. At the beginning of July, irrigation was stopped for a number of days until the midday ΨSWP decreased below −2.5 MPa [7,26]. A re-watering period followed. Detail about orchard characteristics, experimental design and irrigation management are reported in Marino et al. [6]. Stem water potential and gas exchange were monitored every 10 days, from June until October.
Stem water potential was measured at midday using a pressure chamber (PMS Instrument Co., Corovallis, OR, USA). Fully-exposed shoots of the current growth season with five or six expanded leaves were covered with plastic envelopes and aluminum reflective foil at least 1 h before measurement in order to reduce leaf transpiration [39] and equilibrate stem water potential with branch water potential. On the same days when the ΨSWP was measured, we conducted a series of leaf gas exchange measurements on fully expanded leaves, using a CIRAS-2 (PP system®) portable gas exchange system (CO2 and H2O) connected to a gas exchange chamber (Parkinson Leaf Cuvette). The system measured principal eco-physiological parameters, such as light-saturated net CO2 assimilation (An, μmol m−2 s−1), stomatal conductance (gs, mmol m−2 s−1), atmospheric pressure, air and leaf temperature, and air CO2 and intercellular CO2 concentration (Ci) [40,41]. Intrinsic water use efficiency (iWUE, mmol mol−1) was calculated as the relationship between An and gs.
A commercial software package (TableCurve 2D; SYSTAT Software Inc., Chicago, IL, USA) was used to find the best-fit and the function parameters of the relationship between the principal eco-physiological variables.
Statistical analysis of the data (GLM) was carried out using the Systat (SYSTAT Software Inc., Chicago, IL, USA); significance was set at p ≤ 0.05.

3. Results

As shown in Figure 1, An and gs were well correlated with midday ΨSWP (r2 of 0.61 and 0.51, respectively).
The ΨSWP ranged from minimum values of −7 MPa to maximum values of −1 MPa. gs ranged from 30 mmol m−2 s−1 at ΨSWP lower than −6 MPa up to 600 mmol m−2 s−1 at ΨSWP higher than −2 MPa; for the same ΨSWP range, An varied from maximum values of 20 μmol m−2 s−1 to minimum values of 0.5 μmol m−2 s−1.
Data were fitted against a double exponential function. The high variability of the response of gs and An relative to ΨSWP at different degree of stress supports this approach of curve fitting and distinguished three regions of ΨSWP.
For ΨSWP under the threshold of approximately −3.5 MPa, gas exchange maintained relatively constant and low rates, and ΨSWP slightly affected gas exchange. For instance, each unit increase in ΨSWP increased gs by 25 mmol m−2 s−1 (8% of total gs increase) and An of 1.7 μmol m−2 s−2 (12% of total An increase).
When ΨSWP increased, its relative influence on gas exchange was higher. One unit increase in ΨSWP within the range of −3.5 to −2 MPa increased gs by 88 mmol m−2 s−1 (25% of total gs increase) and An by 2.6 μmol m−2 s−2 (18% total An increase).
Above the threshold of −2 MPa, for each unit increase in ΨSWP, gs increased by 137 mmol m−2 s−1 (40% of total gs increase) while An increased by 5 (35% of total An increase). Higher dispersion of data points around the curve was observed at increasing ΨSWP, suggesting the superimposition of other factor at low stress levels. This was particularly clear at ΨSWP above −2 MPa where, for the same ΨSWP value, gs varied from 98 to 547 mmol m−2 s−1.
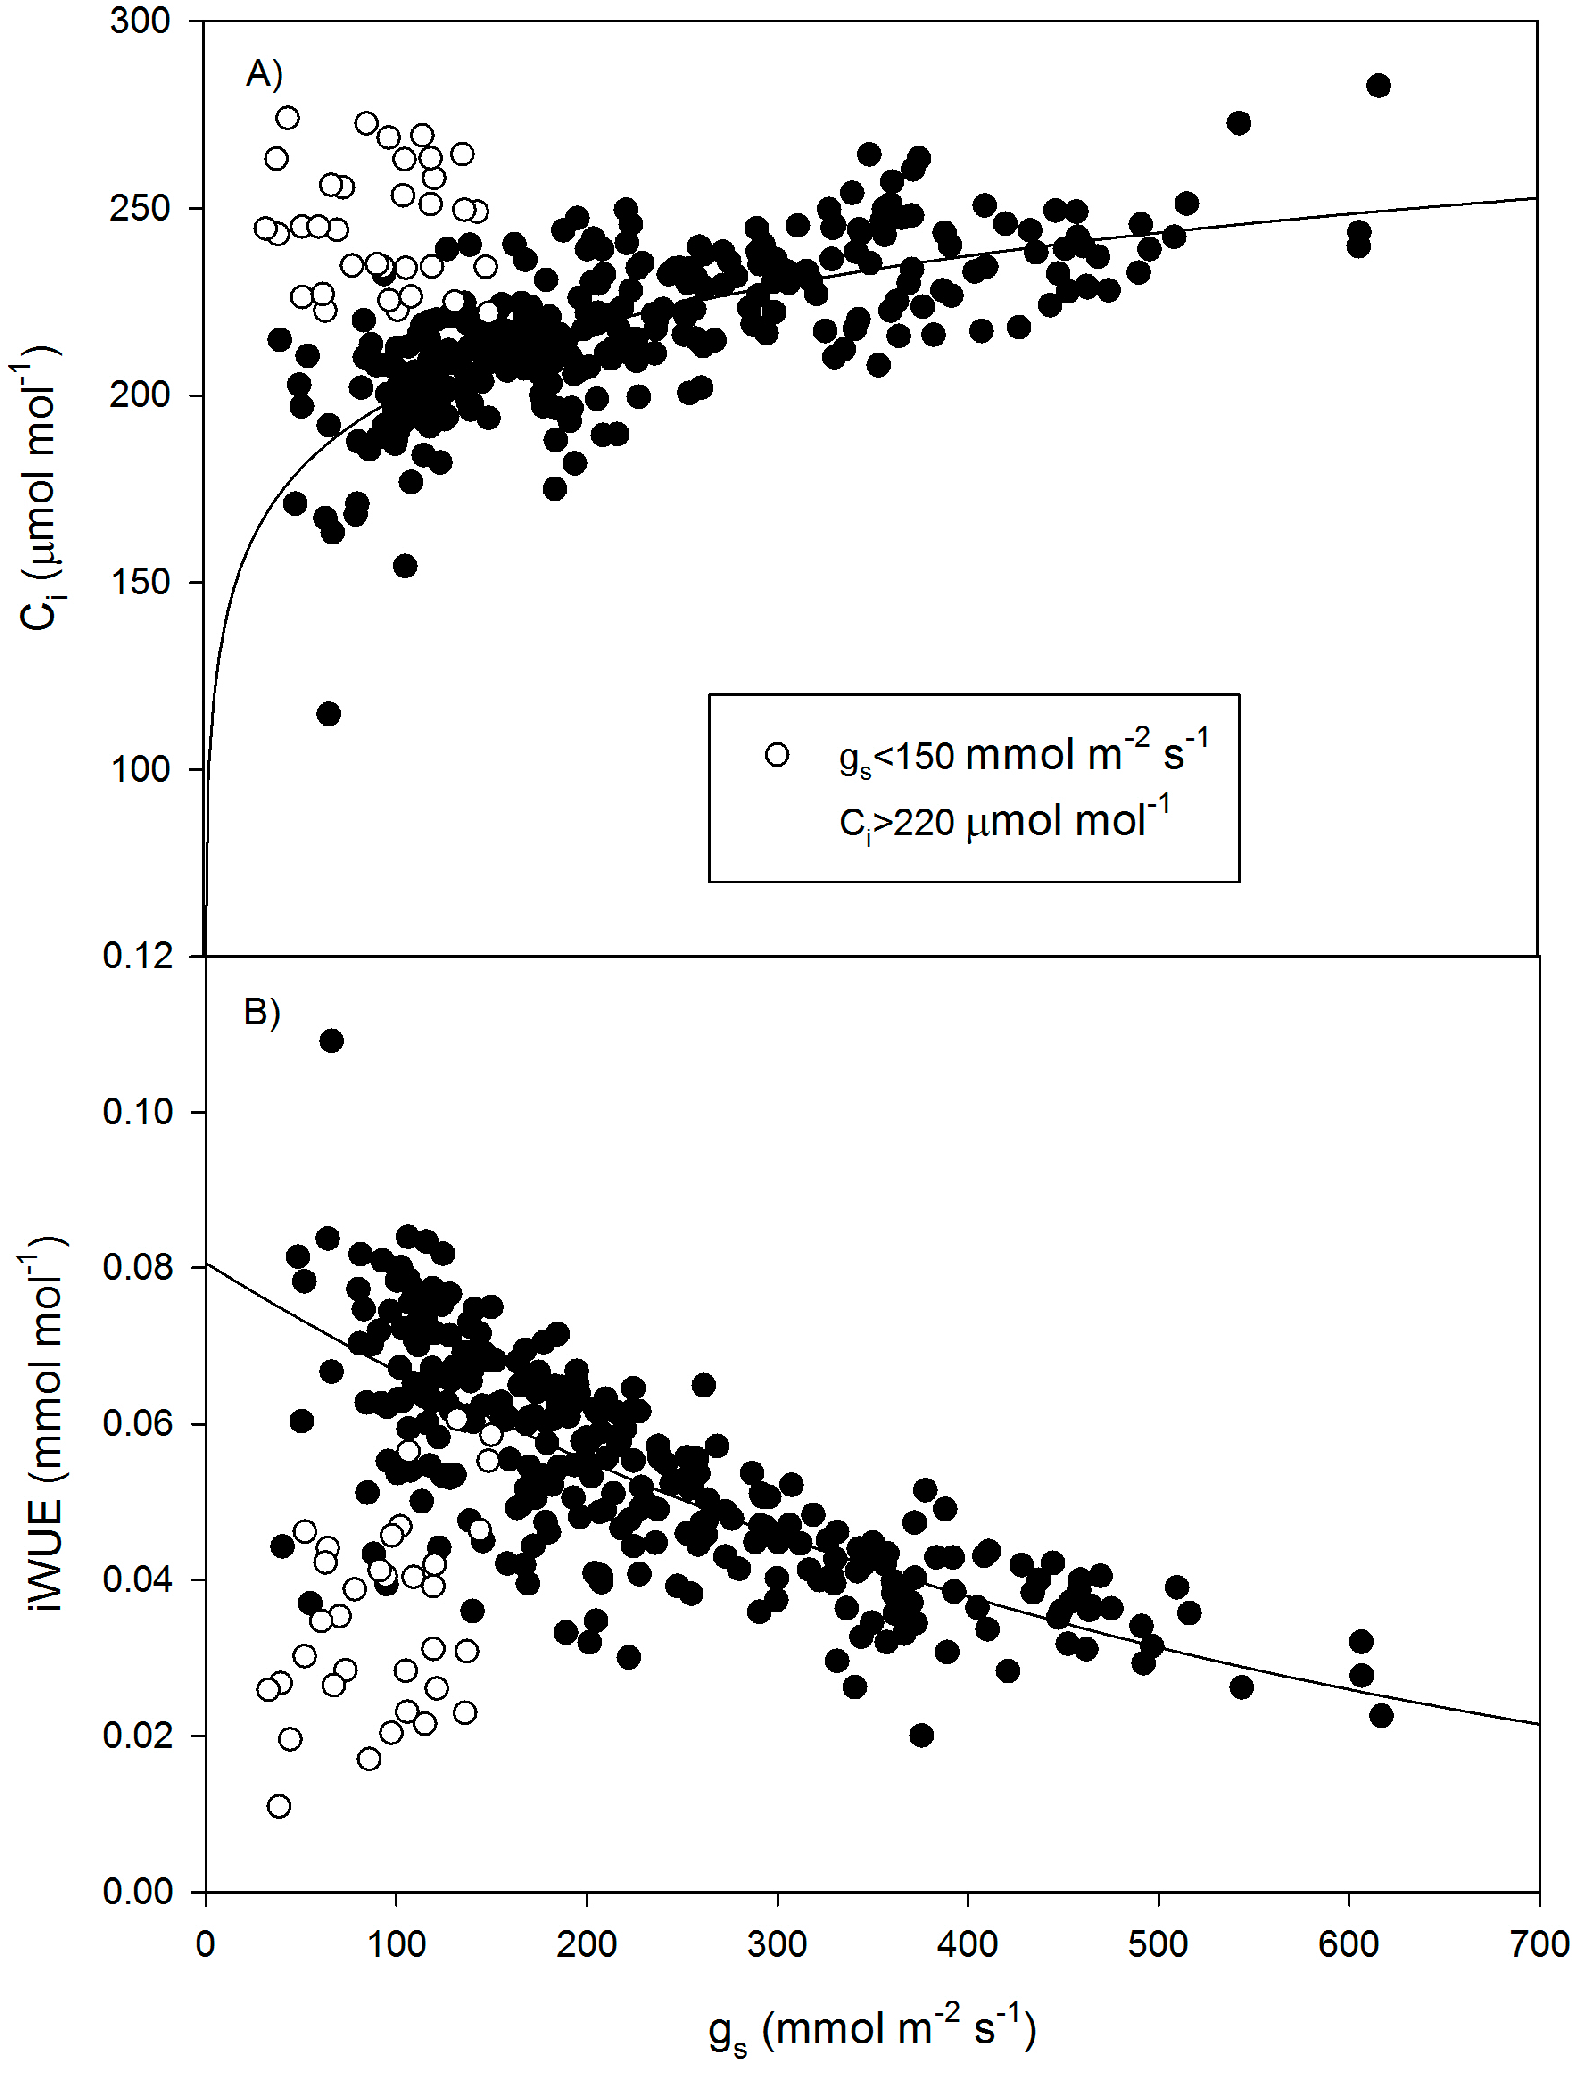
Sub-stomatal CO2 concentration (Ci) curvilinearly decreased, from approx. 250 μmol mol−1 to minimum values of 160 μmol mol−1, as gs decreased from 600 to 100 mmol m−2 s−1, a (Figure 2). For gs under the threshold of 150 mmol m−2 s−1 a deviation from the curve was observed and Ci started to increase for a group of datapoints. These datapoints, characterized by gs lower than 150 mmol m−2 s−1 and Ci higher than 220 μmol mol−1 (average of all the data), were plotted separately and were all characterized by ΨSWP lower than −3.5 MPa.
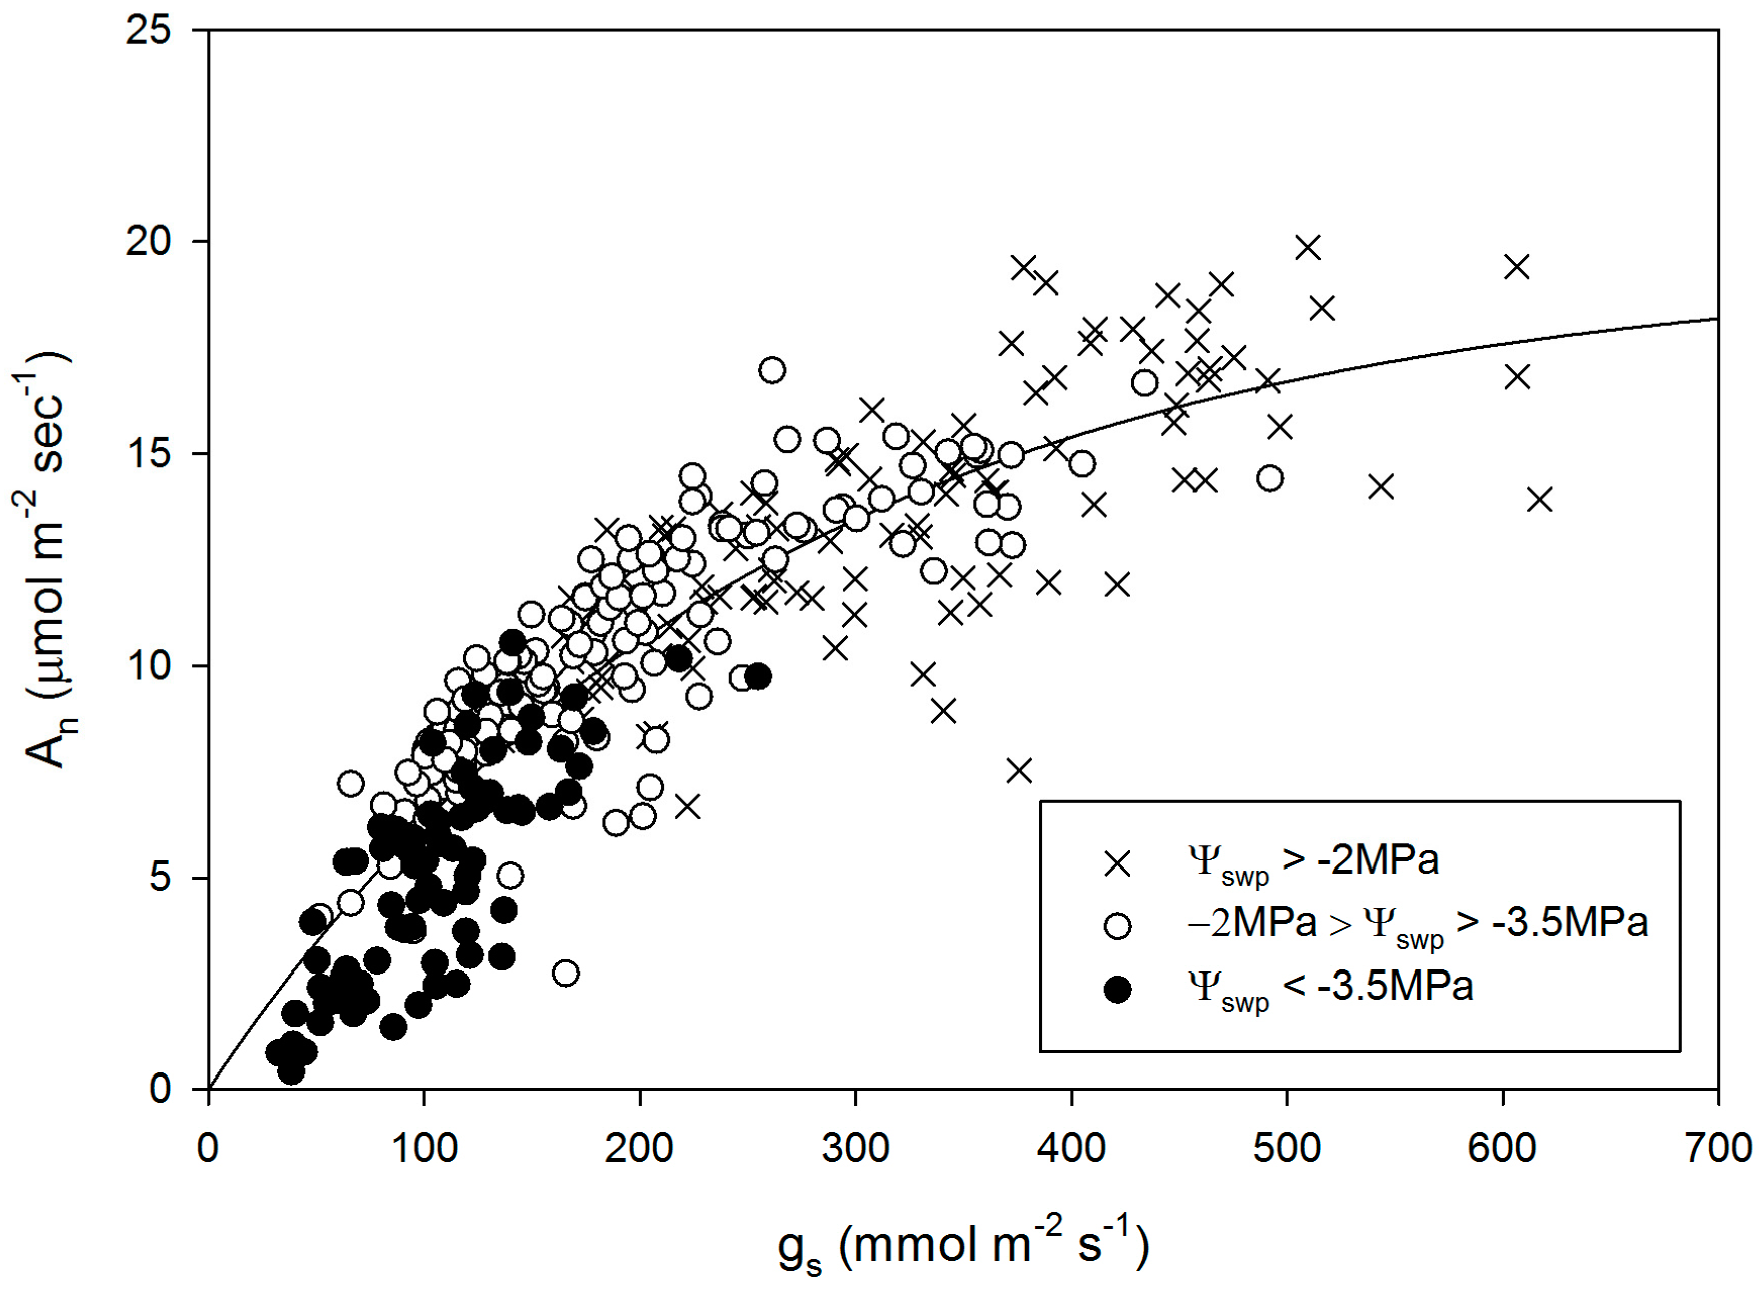
The relation between gs and An was positive and exponential (Figure 3). To better visualize the effect of the stress on stomatal control of photosynthesis, we separately plotted data in three groups based on the analysis of the previous curves (Figure 1 and Figure 2): data characterized by ΨSWP lower than −3.5 MPa, data characterized by ΨSWP between −3.5 and −2 MPa and data characterized by ΨSWP higher than −2 MPa.
For ΨSWP below −3.5 MPa, gs values were below approx. 150 mmol m−2 s−1 and the An increased sharply and linearly from 0 to 8 μmol m−2 s−1 as stomata progressively opened. For ΨSWP ranging from −2 to −3.5 MPa, the relation between gs and An was curvilinear. An increased from 8 to 15 μmol m−2 s−1 and gs from 150 to 350 mmol m−2 s−1. The points characterized by a ΨSWP above −2 MPa were in the asymptotic part of the curve highlighting a wide variability in gs (ranging from 350 to 600 mmol m−2 s−1) corresponding to a low variability in An (from 15 to 17 μmol m−2 s−1).
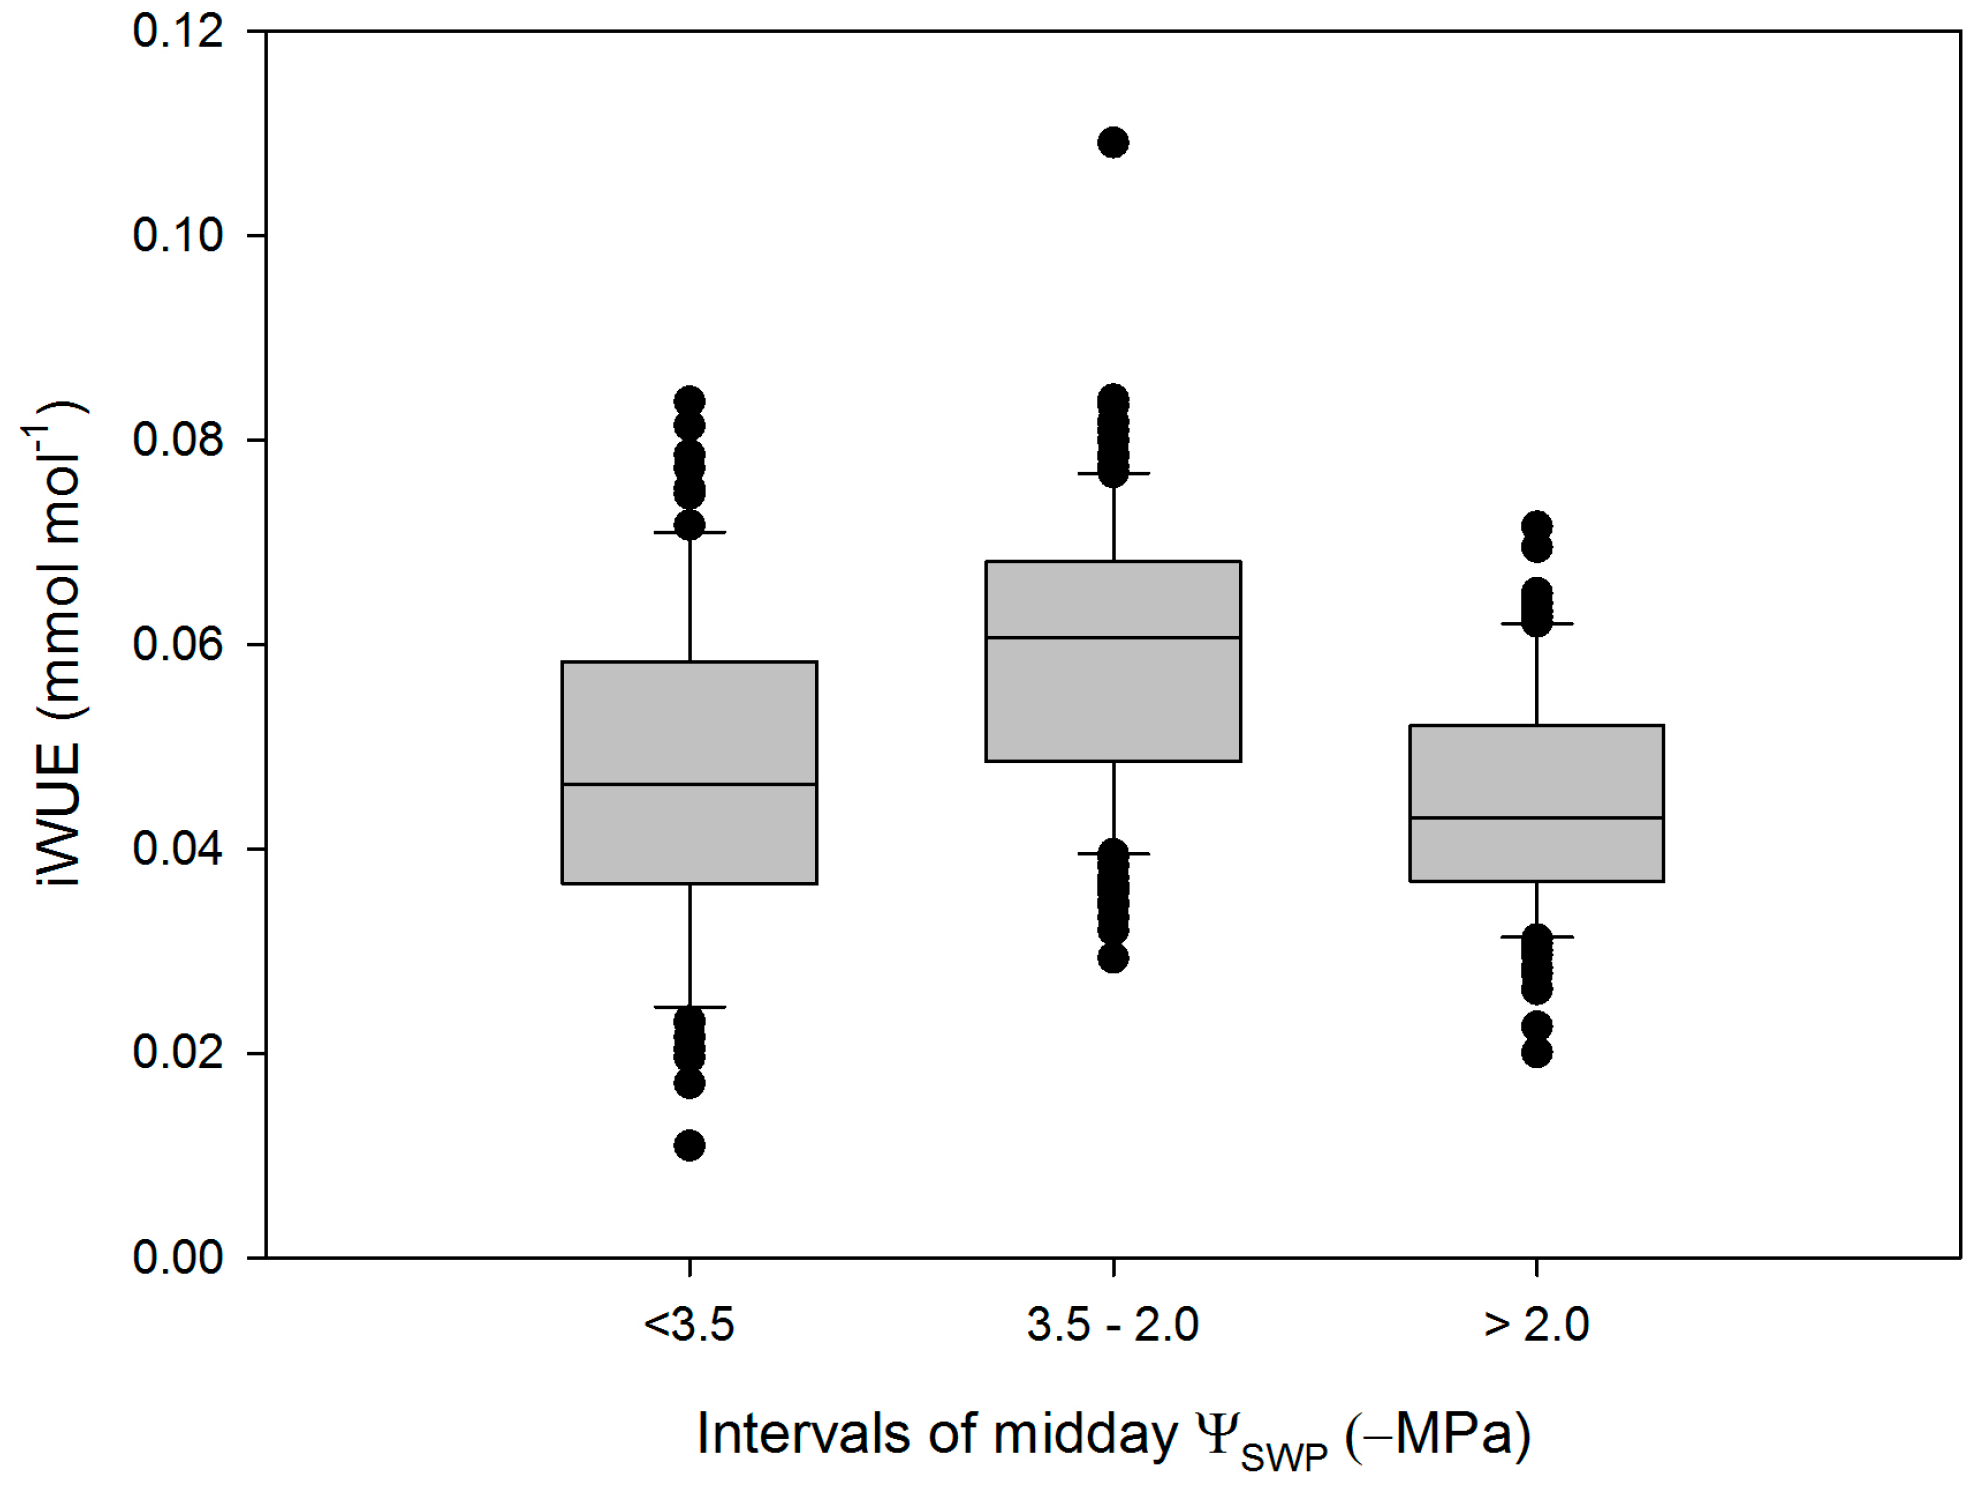
Intrinsic water use efficiency (iWUE) had the highest values (median of 0.06 mmol mol−1) in plants characterized by ΨSWP between −3.5 and −2 MPa. Lower iWUE values (about 0.04 mmol mol−1) were observed when ΨSWP decreased below −3.5 MPa or increased above −2 MPa (Figure 4).

4. Discussion

The non-linear relation observed by analyzing the pooled data of ΨSWP and gs clearly suggests that the mechanisms involved in stomatal control vary according to the stress level [42].
Multiple studies have reported on the threshold for this relationship [23,26,43]. Generally, the best fit, in accordance to our study, is positive and exponential [44,45,46] but also linear [23] and logistic regressions were observed [26]. The main reason for this discrepancy can be the limited variability of ΨSWP values. ΨSWP data set of this experiment widely ranged, from −1 to −7 MPa, and gs increased from 20 to more than 600 mmol m−2 s−1. If only the data points characterized by a ΨSWP above −3.5 MPa are used, a linear and weaker regression is observed also in this work (data not shown); if only data above −2 MPa are analyzed no relationship between ΨSWP and gs is observed.
The marked variability in gs (ranging from 600 to 250 mmol m−2 s−1) detected in this work for ΨSWP above −2 MPa, suggest that a ΨSWP-gs model at very low level of stress is not reliable.
Such high variability of gs is probably due to the superimposition of environmental factors affecting stomatal behavior in well-irrigated trees [42]. This has been previously demonstrated for olive by Moriana et al. [12], reporting vapor pressure deficit to affect the relationship between ΨSWP andgs only at low to moderate stress while no effect was observed at high stress. Oscillation of stomatal conductance that occur in olive, mainly in non-stressed plants [47,48], may contribute to increased variability in measured gs values at low to no-stress conditions.
As the stress intensified (−3.5 MPa < ΨSWP < −2 MPa in this work), stomata progressively closed suggesting hydraulic feedback largely controls the mechanism [42]. Mildly stressed olive trees restrict excessive water loss and prevent an excessive drop in ΨSWP by modulating stomatal closure [49], which is the earliest response to drought, and the major limitation to photosynthesis at mild to moderate drought [27].
At very high levels of stress (ΨSWP < −3.5 MPa) the small variation of both gs and An in response to ΨSWP confirm that water deficit override the effect of other parameters on olive physiology and on stomatal control of gas exchange [50].
A double exponential equation was used because allowed to better distinguish the different mechanisms involved in stomatal response to drought [42] with respect to a single exponential curve. Variation in gs affected the assimilation rate differently depending on the drought level as demonstrated by the analysis of the curve in Figure 3. This allows definition of different regions in this relationship, characterized by the different effects of drought on photosynthesis.
The first region is represented by the curvilinear and slight decrease in An for gs decreasing from maximum values to 250 mmol m−2 s−1. Very high maximum values of gs were observed reaching up to 600 mmol m−2 s−1. These values are higher then what reported by different authors [31,51,52]. However, similarly to what reported by Fernandez et al. [32], the increase in transpiration did not correspond to an increase in An that showed maximum value of 20 μmol m−2 s−1.
In this range of values, a decrease in gs corresponded to a parallel decline in the sub-stomatal CO2 concentration (Figure 2), which directly affected the photosynthetic rate.
Considering that plants were characterized by ΨSWP values above −3.5 MPa, this suggested that at low to mild stress levels, stomatal limitations to photosynthesis were dominant. At this level of stress, consistent with earlier reports [49,53,54], progressive drought increased iWUE (Figure 2B and Figure 4).
Non-stomatal factors were predominant at higher levels of stress. For example, as ΨSWP dropped to −3.5 MPa and gs dropped below 150 mmol m−2 s−1, Ci increased proportionally (Figure 3), reflecting the impaired photosynthetic metabolism in these plants, and, consequentially, iWUE decreased (Figure 2A and Figure 4). For instance, a steeper slope of the function An for gs, observed for values lower than 150 mmol m−2 s−1, reflects the superimposition of non-stomatal factors affecting photosynthesis (Figure 2). Other authors found a similar pattern with Ci, initially declining with increasing stress and then increasing as drought stress became more severe [55]. Other studies confirm the possibility of using Ci as an indicator of the stomatal or non-stomatal limitations to photosynthesis [27,56,57]. In an experiment conducted on nine different conifer species, Brodribb [58] observed that a rapid increase in Ci values at certain levels of water stress was accompanied by a rapid loss of fluorescence from PSII, suggesting damage to the photosynthetic apparatus of plants under drought beyond the minimum Ci, also called the Ci inflexion point by Flexas et al. [20]. Finally, analysis with data from literature, using gs as a reference [19,25], demonstrated that the point at which Ci starts to increase is accompanied by a steep reduction in the net photosynthetic rate (An, reduced by 70%), in the CO2-saturated rate of photosynthesis (Asat, reduced by 50%), in the apparent carboxylation efficiency (ε, reduced by 50%) and in the rate of light-saturated electron transport (ETR, reduced by 40%).

5. Conclusions

The results of this experiment provide physiological data to support the plant based irrigation schedule of an olive orchard designed to increase water use efficiency.
Based on the effects of drought stress on the principal ecophysiological parameters, we were able to define three different levels of stress represented by thresholds in ΨSWP values. The first, ΨSWP above about −2.0 MPa, is characterized by the absence of stress. In this state, a wide variation in stomatal conductance is observed unrelated to ΨSWP variation.
Superimposition of environmental and plant or site specific factors affects stomatal behavior in well-irrigated trees.
Increased gs in this state was not clearly improving leave assimilation rates and, as a consequence, resulted in reduced iWUE.
Moderate stress was described by a ΨSWP between about −2 and −3.5 MPa, and was characterized by stomatal regulation of gas exchange. A reduction in water volume remaining in this range of potential improved iWUE, determining water savings. On the basis of the study conducted by Marra et al. [7], this stress level benefits oil quality without affecting system productivity. Finally, below about −3.5 MPa, non-stomatal limits to photosynthesis are predominant. This represents a threshold value for high stress levels, which should be avoided because it is dangerous to the plant and has a marked and negative effect on both gas exchange and productivity.

Author Contributions

G.M. performed the experiments, analyzed data and wrote the paper. T.C. conceived and designed the experiments and revised the manuscript. L.F. edited the English and revised the manuscript. F.P.M. conceived and designed the experiment, analyzed data and revised the manuscript.

Conflicts of Interest

The authors declare no conflict of interest.

References

  1. Camposeo, S.; Godini, A. Preliminary observations about the performance of 13 varieties according to the super high density oliveculture training system in Apulia (southern Italy). Adv. Hortic. Sci. 2010, 24, 16–20. [Google Scholar]
  2. Tous, J.; Romero, A.; Plana, J.; Hermoso, J.F. Olive oil cultivars suitable for very high density planting conditions. Acta Hortic. 2008, 791, 403–408. [Google Scholar] [CrossRef]
  3. Tous, J.; Romero, A.; Hermoso, J.F. New trends in olive orchard design for continuous mechanical harvesting. Adv. Hortic. Sci. 2010, 24, 43–52. [Google Scholar]
  4. Pastor, M.; García-Vila, M.; Soriano, M.A.; Vega, V.; Fereres, E. Productivity of olive orchards in response to tree density. J. Hortic. Sci. Biotechnol. 2007, 82, 555–562. [Google Scholar] [CrossRef]
  5. Policarpo, M.; Talluto, G.; Lo Bianco, R. Vegetative and productive responses of ‘Conference’ and ‘Williams’ pear trees planted at different in-row spacing. Sci. Hortic. 2006, 109, 322–331. [Google Scholar] [CrossRef]
  6. Marino, G.; Pernice, F.; Marra, F.P.; Caruso, T. Validation of an online system for the continuous monitoring of tree water status for sustainable irrigation managements in olive (Olea europaea L.). Agric. Water Manag. 2016, 177, 298–307. [Google Scholar] [CrossRef]
  7. Marra, P.F.; Marino, G.; Marchese, A.; Caruso, T. Effects of different irrigation regimes on a super-high density olive grove cv. ‘Arbequina’, vegetative growth, productivity and polyphenol content of the oil. Irrig. Sci. 2016, 34, 1–13. [Google Scholar] [CrossRef]
  8. Grattan, S.R.; Berenguer, M.J.; Connell, J.H.; Polito, V.S.; Vossen, P.M. Olive oil production as influenced by different quantities of applied water. Agric. Water Manag. 2006, 85, 133–140. [Google Scholar] [CrossRef]
  9. Gómez-del-Campo, M. Summer deficit-irrigation strategies in a hedgerow olive orchard cv. ‘Arbequina’: Effect on fruit characteristics and yield. Irrig. Sci. 2013, 31, 259–269. [Google Scholar] [CrossRef]
  10. Turner, N.C. Plant water relations and irrigation management. Agric. Water Manag. 1990, 17, 59–73. [Google Scholar] [CrossRef]
  11. Fereres, E.; Goldhamer, D. Deciduous fruit and nut trees. In Irrigation of Agricultural Crops. Agronomy Monograph No. 30; Stewart, B.A., Nielsen, D.R., Eds.; American Society of Agronomy: Madison, WI, USA, 1990; pp. 987–1017. [Google Scholar]
  12. Moriana, A.; Pérez-López, D.; Prieto, M.H.; Ramírez-Santa-Pau, M.; Pérez-Rodriguez, J.M. Midday stem water potential as a useful tool for estimating irrigation requirements in olive trees. Agric. Water Manag. 2012, 112, 43–54. [Google Scholar] [CrossRef]
  13. Gómez-del-Campo, M.; Leal, A.; Pezuela, C. Relationship of stem water potential and leaf conductance to vegetative growth of young olive trees in a hedgerow orchard. Aust. J. Agric. Res. 2008, 59, 270–279. [Google Scholar] [CrossRef]
  14. Gómez-del-Campo, M. Physiological and growth responses to irrigation of a newly established hedgerow Olive orchard. HortScience 2010, 45, 809–814. [Google Scholar]
  15. Gómez-del-Campo, M. Summer deficit irrigation in a hedgerow olive orchard cv. Arbequina: Relationship between soil and tree water status, and growth and yield components. Span. J. Agric. Res. 2013, 11, 547–557. [Google Scholar] [CrossRef]
  16. Corell, M.; Pérez-López, D.; Martín-Palomo, M.J.; Centeno, A.; Girón, I.; Galindo, A.; Moreno, F. Comparison of the water potential baseline in different locations. Usefulness for irrigation scheduling of olive orchards. Agric. Water Manag. 2016, 177, 308–316. [Google Scholar] [CrossRef]
  17. Di Vaio, C.; Marallo, N.; Marino, G.; Caruso, T. Effect of water stress on dry matter accumulation and partitioning in pot-grown olive trees (cv. Leccino and Racioppella). Sci. Hortic. 2013, 164, 155–159. [Google Scholar] [CrossRef]
  18. Flexas, J.; Bota, J.; Cifre, J.; Mariano, E.J.; Galmés, J.; Gulías, J.; Lefi, E.-K.; Martínez-Cañellas, S.F.; Moreno, M.T.; Ribas-Carbó, M.; et al. Understanding down-regulation of photosynthesis under water stress: Future prospects and searching for physiological tools for irrigation management. Ann. Appl. Biol. 2004, 144, 273–283. [Google Scholar] [CrossRef]
  19. Medrano, H.; Escalona, J.M.; Bota, J.; Gulías, J.; Flexas, J. Regulation of photosynthesis of C3 plants in response to progressive drought: The interest of stomatal conductance as a reference parameter. Ann. Bot. 2002, 89, 895–905. [Google Scholar] [CrossRef] [PubMed]
  20. Flexas, J.; Bota, J.; Escalona, J.M.; Sampol, B.; Medrano, H. Effects of drought on photosynthesis in grapevines under field conditions: An evaluation of stomatal and mesophyll limitations. Funct. Plant Biol. 2002, 29, 461–471. [Google Scholar] [CrossRef]
  21. Flexas, J.; Escalona, J.M.; Evain, S.; GulÌas, J.; Moya, I.; Osmond, C.B.; Medrano, H. Steady-state chlorophyll fluorescence (Fs) measurements as a tool to follow variations of net CO2 assimilation and stomatal conductance during water-stress in C3 plants. Physiol. Plant. 2002, 114, 231–240. [Google Scholar] [CrossRef] [PubMed]
  22. Fernández, J.E.; Moreno, F.; Girón, I.F.; Blázquez, O.M. Stomatal control of water use in olive tree leaves. Plant Soil 1997, 190, 179–192. [Google Scholar] [CrossRef] [Green Version]
  23. Giorio, P.; Sorrentino, G.; d’Andria, R. Stomatal behaviour, leaf water status and photosynthetic response in fieldgrown olive trees under water deficit. Environ. Exp. Bot. 1999, 42, 95–104. [Google Scholar] [CrossRef]
  24. Bongi, G.; Palliotti, A. Olive. In Handbook of Environmental Physiology of Fruit Crops; Temperate Crops Volume I; Shaffer, B., Anderson, P.C., Eds.; CRC Press: Boca Raton, FL, USA, 1994; pp. 165–187. [Google Scholar]
  25. Angelopoulos, K.; Dichio, B.; Xiloyannis, C. Inhibition of photosynthesis in olive trees (Olea europaea L.) during water stress and rewatering. J. Exp. Bot. 1996, 47, 1093–1100. [Google Scholar] [CrossRef]
  26. Di Vaio, C.; Marra, F.P.; Scaglione, G.; La Mantia, M.; Caruso, T. The effect of different vigour olive clones on growth, dry matter partitioning and gas exchange under water deficit. Sci. Hortic. 2012, 134, 72–78. [Google Scholar] [CrossRef]
  27. Flexas, J.; Medrano, H. Drought-inhibition of photosynthesis in C3 plants: Stomatal and non-stomatal limitation revisited. Ann. Bot. 2002, 89, 183–189. [Google Scholar] [CrossRef] [PubMed]
  28. Jones, H.G. Partitioning stomatal and non-stomatal limitations to photosynthesis. Plant Cell Environ. 1985, 8, 95–104. [Google Scholar] [CrossRef]
  29. Düring, H. CO2 assimilation and photorespiration of grapevine leaves: Responses to light and drought. Vitis 1988, 27, 199–208. [Google Scholar]
  30. Quick, W.P.; Chaves, M.M.; Wendler, R.; David, M.; Rodrigues, M.L.; Passaharinho, J.A.; Pereira, J.S.; Adcock, M.D.; Leegood, R.C.; Stitt, M. The effect of water stress on photosynthetic carbon metabolism in four species grown under field conditions. Plant Cell Environ. 1992, 15, 25–35. [Google Scholar] [CrossRef]
  31. Fernández, J.E.; Diaz-Espejo, A.; D’Andria, R.; Sebastiani, L.; Tognetti, R. Potential and limitations of improving olive orchard design and management through modelling. Plant Biosyst. 2008, 142, 130–137. [Google Scholar] [CrossRef]
  32. Allen, R.G.; Pereira, L.S.; Raes, D.; Smith, M. Crop evapotranspiration. In Guidelines for Computing Crop Water Requirements; Irrigation and Drainage Paper 56; FAO: Rome, Italy, 1998. [Google Scholar]
  33. Fernández, J.E.; Díaz-Espejo, A.; Infante, J.M.; Durán, P.; Palomo, M.J.; Chamorro, V.; Girón, I.F.; Villagarcía, L. Water relations and gas exchange in olive trees under regulated deficit irrigation and partial rootzone drying. Plant Soil 2006, 284, 273–291. [Google Scholar] [CrossRef]
  34. Orgaz, F.; Villalobos, F.; Testi, L.; Pastor, M.; Hidalgo, J.C.; Fereres, E. Programación de riegos en plantaciones de olivar. Metodología para el cálculo de las necesidades de agua de riego en el olivar regado por goteo. In Cultivo Del Olivo Con Riego Localizado; Pastor, M., Ed.; Mundi-Prensa: Madrid, Spain, 2005; pp. 83–138. [Google Scholar]
  35. Orgaz, F.; Fereres, E.; Riego, D.B. El Cultivo Del Olivo; Barranco, D., Fernández-Escobar, R., Rallo, L., Eds.; Mundi-Prensa: Madrid, Spain, 1997; pp. 251–272. [Google Scholar]
  36. Testi, L.; Villalobos, F.J.; Orgaz, F. Evapotranspiration of a young irrigated olive orchard in southern Spain. Agric. Meteorol. 2004, 121, 1–18. [Google Scholar] [CrossRef]
  37. Fernández, J.E. Understanding olive adaptation to abiotic stresses as a tool to increase crop performance. Env. Exp. Bot. 2014, 103, 158–179. [Google Scholar] [CrossRef]
  38. Marino, G.; Macaluso, L.; Marra, F.P.; Ferguson, L.; Marchese, A.; Campisi, G.; Volo, P.; Laudicina, V.A.; Caruso, T. Horticultural performance of 23 Sicilian olive genotypes in hedgerow systems: Vegetative growth, productive potential and oil quality. Sci. Hortic. 2017, 217, 217–225. [Google Scholar] [CrossRef]
  39. Begg, J.E.; Turner, N.C. Water potential gradients in field tobacco. Plant Physiol. 1970, 46, 343–346. [Google Scholar] [CrossRef] [PubMed]
  40. Parkinson, K.J. Porometry in SEB. In Symposium of Instrumentation for Environmental Physiology; Cambridge University Press: Cambridge, UK, 1983. [Google Scholar]
  41. Parkinson, K.J.; Day, W.; Leach, J.E. A portable system for measuring the photosynthesis and transpiration of graminaceous leaves. J. Exp. Bot. 1980, 31, 1441–1453. [Google Scholar] [CrossRef]
  42. Jones, H.G. Stomatal control of photosynthesis and transpiration. J. Exp. Bot. 1998, 49, 387–398. [Google Scholar] [CrossRef]
  43. Fernández, J.E.; Moreno, F.; Martín-Aranda, J. Water status of olive trees under dry-farming and drip-irrigation. Acta Hortic. 1993, 335, 157–164. [Google Scholar] [CrossRef]
  44. Erel, R.; Ben-Gal, A.; Dag, A.; Schwartz, A.; Yermiyahu, U. Sodium replacement of potassium in physiological processes of olive trees (var. Barnea) as affected by drought. Tree Physiol. 2014, 34, 1102–1117. [Google Scholar] [CrossRef] [PubMed]
  45. Fernandes, R.D.M.; Cuevas, M.V.; Hernandez-Santana, V.; Rodriguez-Dominguez, C.M.; Padilla-Díaz, C.M.; Fernández, J.E. Classification models for automatic identification of daily states from leaf turgor related measurements in olive. Comput. Electron. Agric. 2017, 142, 181–189. [Google Scholar] [CrossRef]
  46. Naor, A.; Schneider, D.; Ben-Gal, A.; Zipori, I.; Dag, A.; Kerem, Z.; Birger, R.; Peres, M.; Gal, Y. The effects of crop load and irrigation rate in the oil accumulation stage on oil yield and water relations of ‘Koroneiki’ olives. Irrig. Sci. 2013, 31, 781–791. [Google Scholar] [CrossRef]
  47. López-Bernal, A.; García-Tejera, O.; Testi, L.; Orgaz, F.; Villalobos, F.J. Stomatal oscillations in olive trees: Analysis and methodological implications. Tree Physiol. 2017, 1–12. [Google Scholar] [CrossRef] [PubMed]
  48. Fernández, J.E.; Rodriguez-Dominguez, C.M.; Perez-Martin, A.; Zimmermann, U.; Rüger, S.; Martín-Palomo, M.J.; Torres-Ruiz, J.M.; Cuevas, M.V.; Sann, C.; Ehren-berger, W.; et al. Online-monitoring of tree water stress in a hedgerow olive orchard using the leaf patch clamp pressure probe. Agric. Water Manag. 2011, 100, 25–35. [Google Scholar] [CrossRef]
  49. Tognetti, R.; d’Andria, R.; Lavini, A.; Morelli, G. The effect of deficit irrigation on crop yield and vegetative development of Olea europaea L. (cvs. Frantoio and Leccino). Eur. J. Agron. 2006, 25, 356–364. [Google Scholar] [CrossRef]
  50. Moriana, A.; Villalobos, F.J.; Fereres, E. Stomatal and photosynthetic responses of olive (Olea europaea L.) leaves to water deficits. Plant Cell Environ. 2002, 25, 395–405. [Google Scholar] [CrossRef]
  51. Diaz-Espejo, A.; Walcroft, A.S.; Fernandez, J.E.; Hafidi, B.; Palomo, M.J.; Giron, I.F. Modeling photosynthesis in olive leaves under drought conditions. Tree Physiol. 2006, 26, 1445–1456. [Google Scholar] [CrossRef] [PubMed]
  52. Cuevas, M.V.; Torres-Ruiz, J.M.; Álvarez, R.; Jiménez, M.D.; Cuerva, J.; Fernández, J.E. Assessment of trunk diameter variation derived indices as waterstress indicators in mature olive trees. Agron. Water Manag. 2010, 97, 1293–1302. [Google Scholar] [CrossRef]
  53. Chartzoulakis, K.; Michelakis, N.; Tzombanakis, I. Effect of water amount and application date on yield and water utilisation efficiency of ‘Koroneiki’ olives under drip irrigation. Adv. Hortic. Sci. 1992, 2, 82–84. [Google Scholar]
  54. Wahbi, S.; Wakrim, R.; Aganchich, B.; Serraj, R. Effects of partial rootzone drying (PRD) on adult olive tree (Olea europaea) in field conditions under arid climate. I. Physiological and agronomic responses. Agric. Ecosyst. Environ. 2005, 106, 289–301. [Google Scholar] [CrossRef]
  55. Lawlor, D.W. The effects of water deficit on photosynthesis. In Environment and Plant Metabolism: Flexibility and Acclimation; Smirnoff, N., Ed.; BIOS Scientific Publishers: Oxford, UK, 1995; pp. 129–160. [Google Scholar]
  56. Cornic, G.; Massacci, A. Leaf photosynthesis under drought stress. In Advances in Photosynthesis: Photosynthesis and the Environment Volume 5; Baker, N.R., Ed.; Kluwer Academic Publishers: Dordrecht, The Netherlands, 1996; pp. 347–366. [Google Scholar]
  57. Ort, D.R.; Oxborough, K.; Wise, R.R. Depressions of photosynthesis in crops with water deficits, In Photoinhibition of Photosynthesis: From Molecular Mechanisms to the Field; Baker, N.R., Bowyer, J.R., Eds.; BIOS Scientific Publishers: Oxford, UK, 1994; pp. 315–329. [Google Scholar]
  58. Brodribb, T. Dynamics of changing intercellular CO2 concentration (ci) during drought and determination of minimum functional ci. Plant Physiol. 1996, 111, 179–185. [Google Scholar] [CrossRef] [PubMed]
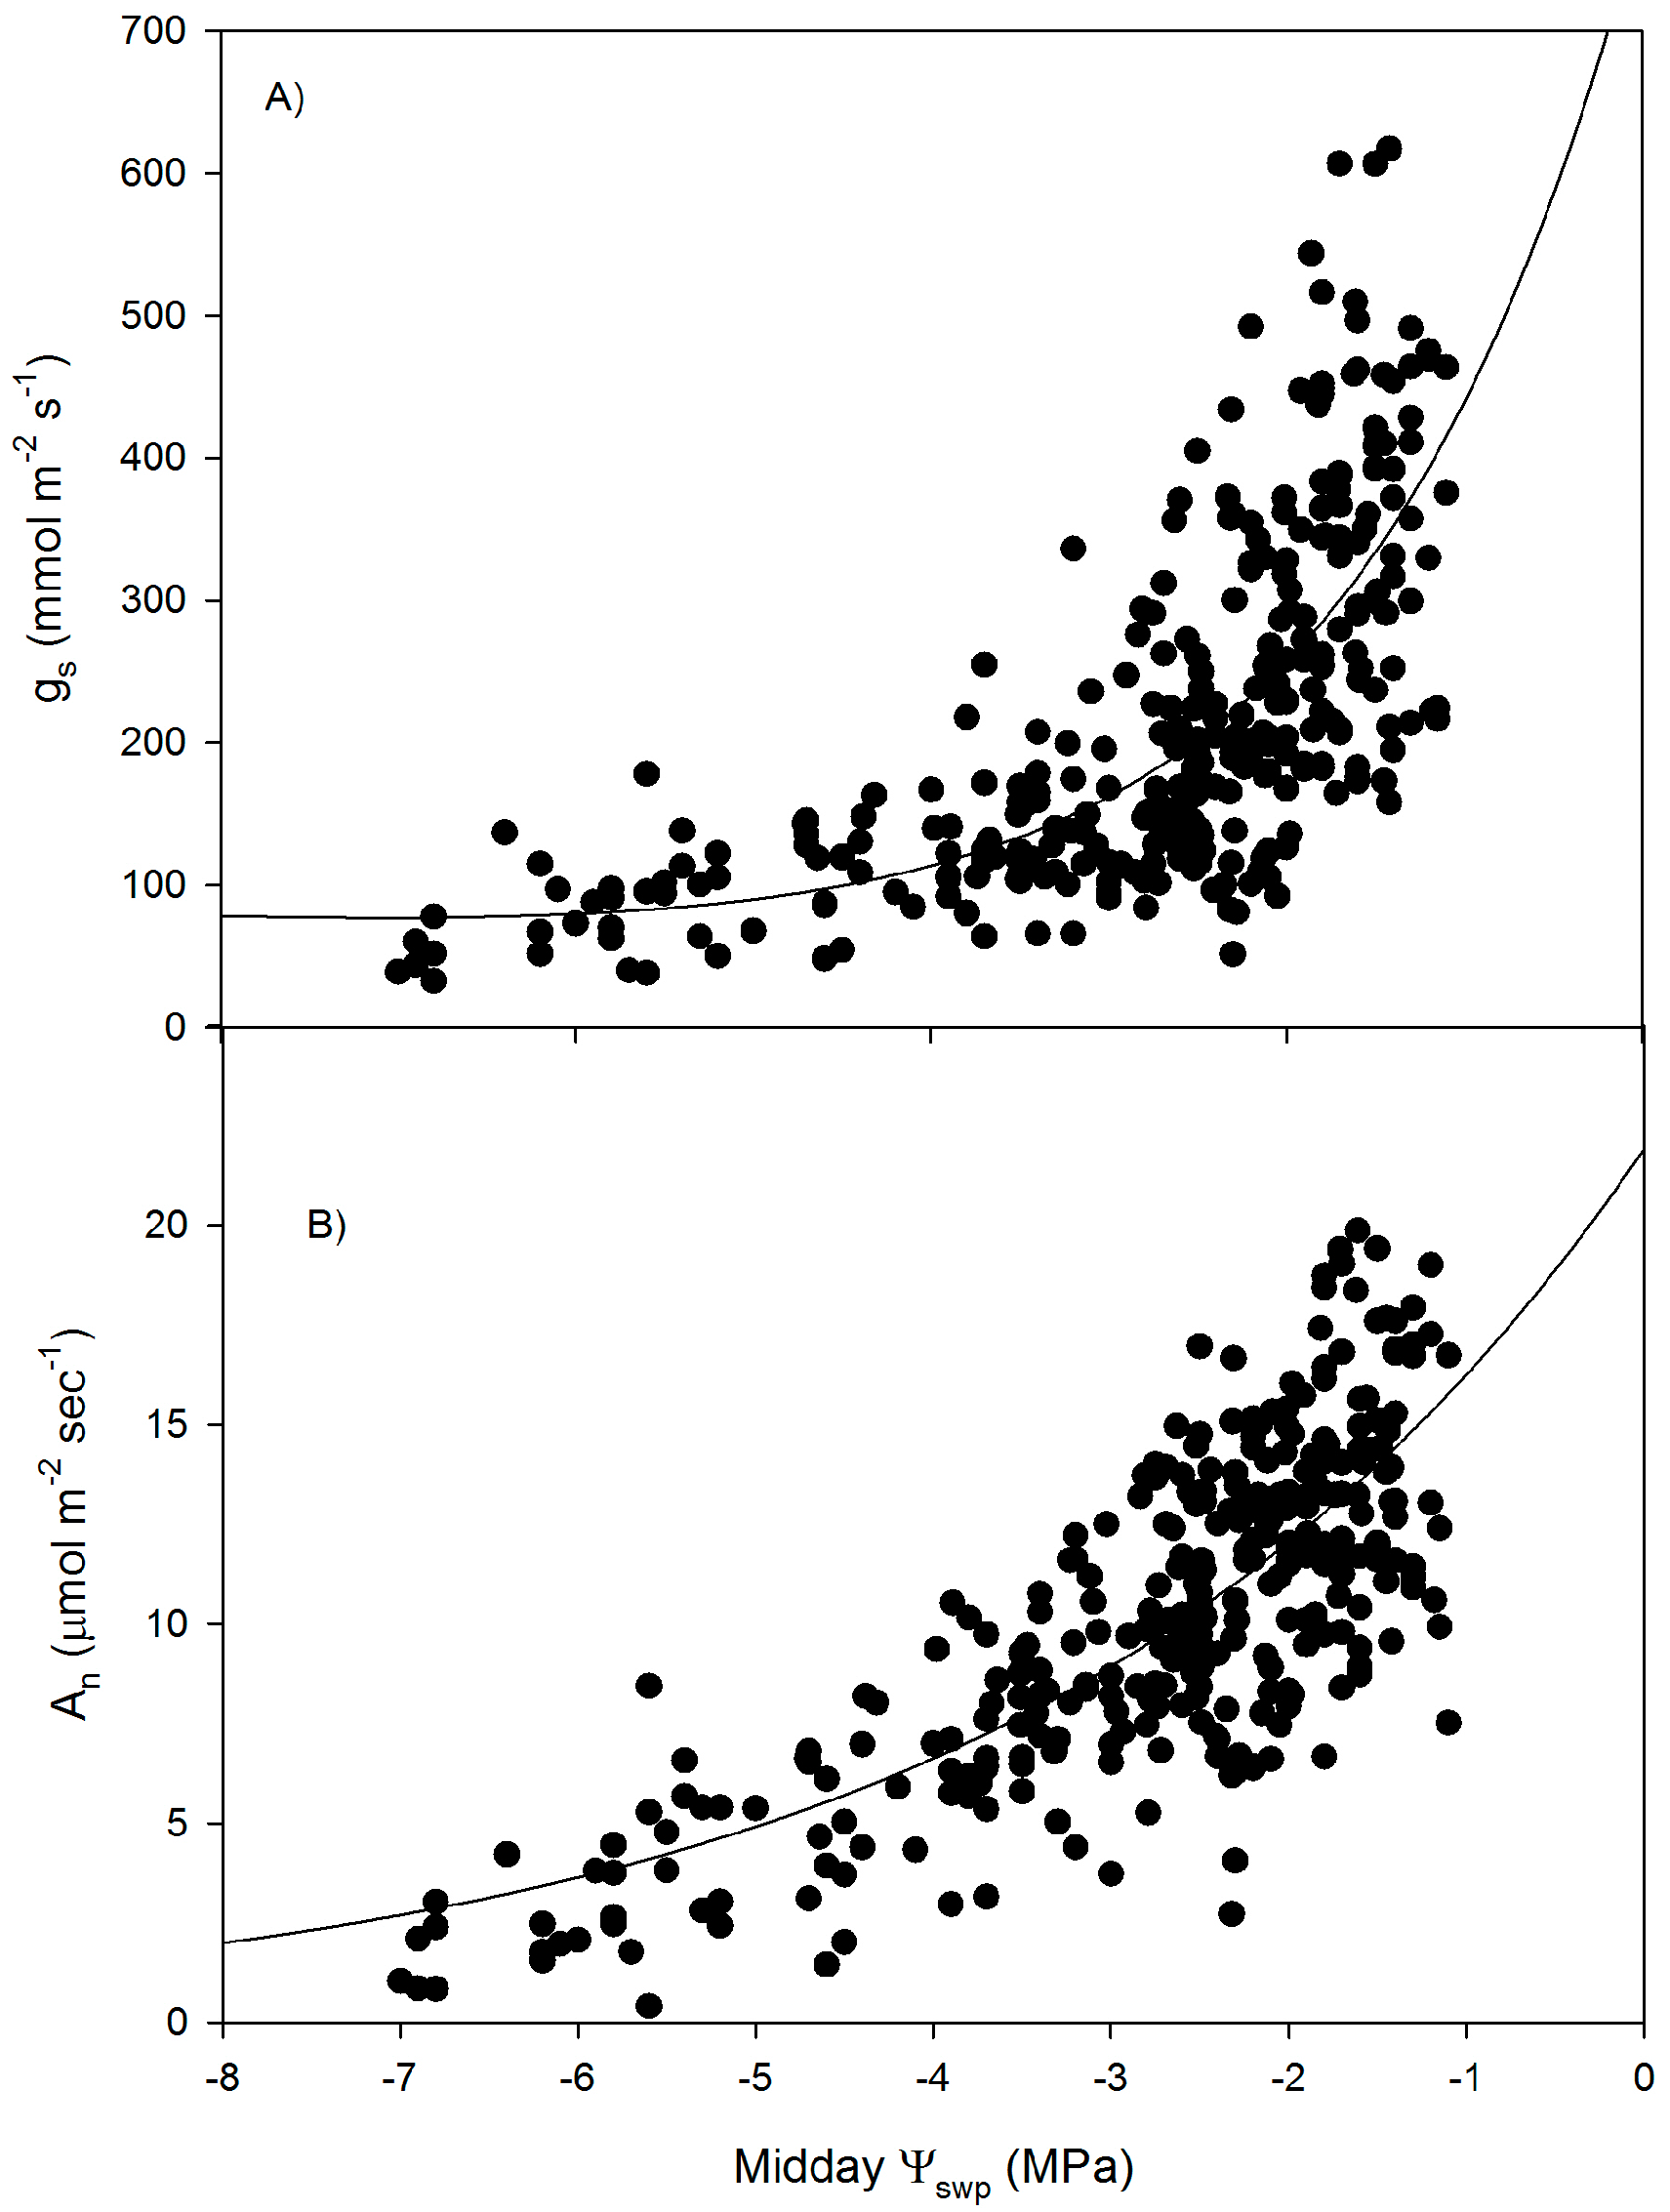
Figure 1. Relationship between (A) stomatal conductance (gs, mmol m−2 s−1) and (B) net photosynthesis (An, μmol m−2 s−1) relative to the stem water potential (ΨSWP, MPa) measured at midday. The best fit relationship for the entire gs data pool was performed using a double exponential function: y = 39 × e(−0.08x) + 744 × e (0.63x); r2 = 0.51: p < 0.0001; the best fit relationship for the entire An data pool was performed using a double exponential function: y = 3.1 × e(0.29x) + 18.9 × e(0.30x); r2 = 0.61, p < 0.0001.
Water 10 00342 g001
Figure 2. Relationship between (A) the sub stomatal CO2 concentration (Ci, μmol mol−1) and (B) intrinsic water use efficiency (iWUE, mmol mol−1) relative to stomatal conductance (gs, mmol m−2 s−1). Data characterized by gs < 150 mmol m−2 s−1 and Ci > 220 μmol mol−1 (average of the population) were plotted separately. The best fit relationship for Ci was performed using a logarithmic function: y = 71.8 + 26.7 × ln(abs(x)); r2 = 0.52. The best fit relationship for iWUE was performed using an exponential function: y = 0.80 × e(−0.019x); r2 = 0.58.
Water 10 00342 g002
Figure 3. Relationship between net photosynthesis (An, μmol m−2 s−1) and stomatal conductance (gs mmol m−2 s−1)). The best fit relationship, for the entire data pool, was obtained using an exponential function: y = 19.4 × (1 − e(−0.0039x)); r2 = 0.80; p < 0.0001.
Water 10 00342 g003
Figure 4. Intrinsic water use efficiency (iWUE, mmol mol−1) for the selected midday stem water potential (ΨSWP, MPa) intervals.
Water 10 00342 g004