Article

The Risk Assessment of River Water Pollution Based on a Modified Non-Linear Model

1
Key Laboratory of Disaster Monitoring and Mechanism Simulating in Shaanxi Province, College of Geography and Environment, Baoji University of Arts and Sciences, Baoji 721013, China
2
UCD Dooge Centre for Water Resources Research, School of Civil Engineering, University College Dublin, Belfield, Dublin 4, Ireland
3
Institute of Water Resources and Hydro-electric Engineering, Xi’an University of Technology, Xi’an 710048, China
*
Author to whom correspondence should be addressed.
Water 2018, 10(4), 362; https://doi.org/10.3390/w10040362
Submission received: 27 February 2018 / Revised: 17 March 2018 / Accepted: 17 March 2018 / Published: 23 March 2018
(This article belongs to the Section Hydrology)

Abstract

:
The water resource system is a non-linear system, featuring variability and randomness. Its risk assessment is very different from that of a linear system. Considering the effects of river flow on the pollutant diffusion, migration, and maximum tolerable concentration, a modified non-linear model (MNLM) was established, while the forcing terms were introduced to model functions for water pollution risk assessment. Taking the Weihe River Basin in China as an example, the risk assessment values were divided into five levels: negligible risk, acceptable risk, marginal risk, unacceptable risk, and catastrophic risk. As such, the risk variation of the river pollution interval was analyzed. The results showed that the BOD5, COD, and nitrite nitrogen are the main pollutants, leading to great risks of river water pollution. Moreover, it was found that the risk in the dry season is higher than that in the flood season, while the risk based on MNLM is 10.9% higher than that of linear methods. Verification indicates that MNLM is considered more suitable for risk assessment of complex river water pollution. However, the forcing term coefficient should be corrected for actual situations in different river water systems. The explored MNLM is expected to give insights into regional river water environment management.

1. Introduction

Water resource shortage and pollution have greatly prevented the sustainable use of water and it has become an important issue that requires efficient surface water quality monitoring and pollution risk assessment [1,2,3,4]. In recent years, the surface water environment in China has been facing a serious pollution crisis and the shortage of water resources is continuously exacerbating. The sewage discharge from industrial enterprises and residents along the riverside area has seriously hindered the development of the regional economy and affected people’s daily life. Due to the excessive pollutant emissions, the water quality in most regions fails to meet the criteria of the national standard. Therefore, accurate assessment of river water pollution is of great significance to the water environment management and protection. The water resource system is a non-linear system with the features of variability, uncertainty, and randomness. The risk assessment of river water pollution should reveal the potential hazards, assess the feasibility of potential measures for handling the contaminants entering the water, and propose appropriate management measures.
In order to better coordinate the water resource problem, actually, many efforts have been made towards the water resource risk assessment, which include groundwater contaminations [5,6,7], water environmental health [8], sources of urban water supply [9], water quality and water environment capacity assessment, water pollution index, and so on [10,11,12], and all these efforts have made meaningful achievements.
Regarding the technical approaches of the risk assessment, Liu et al. [13] evaluated the water environment risk by using the comprehensive index based on GIS and achieved useful conclusions for the prevention and control of river pollution. Many other approaches have also been used, including the relative risk model [14,15], the fuzzy set and weighted average [16,17,18], the water pollution risk discrimination [19,20], the artificial neural network and internal-stochastic methods [21,22], as well as the multivariate statistical technique and the analytical hierarchy process [23,24]. In addition, comprehensive risk assessment indexes and hybrid approaches were applied for the exposure assessment of the water environment [25,26]. Meanwhile, in recent years, the fuzzy theory was increasingly applied for decision-making and assessment processes in imprecise situations. For example, the fuzzy logic and fuzzy set theory-based evaluation models have been established to deal with uncertainty problems and to describe characters of classified water quality bounds reflecting the actual water quality [27,28]. Overall, those methods/approaches are better for the risk assessment of water pollution in small-scale rivers.
Apart from this, in previous studies [13,28,29,30], the variation of the composite index formula was used and it can improve the gap between the calculation results of the pollution index and the water quality standard. However, it does not directly determine the water quality grade from the relationship between the calculation results and the standard. Rather, it does so using the actual synthesis pollution indexes and the water quality grades. The membership function of the fuzzy comprehensive evaluation method has been used to characterize the membership degree of contaminants to two adjacent grades, and it provides a sound decision basis for the scientific management of water bodies as well as for the prevention and control of pollution. Unfortunately, the construction of the membership function tends to be subjective and the expression of pollutant concentration in the water quality standard is discontinuous. It is noted that the variation of water quality is continuous so that the artificial assessment by specific grading standards would lead to more information loss. Gray relational analysis is a method used to measure the degree of correlation between factors according to the similarities or dissimilarities of the development trends between the factors. In the process of system development, if the tendency of the change of two factors is consistent (i.e., the degree of synchronization changes is higher), the correlation between the two factors is higher. Otherwise, it is lower. It has the advantages of high reliability, simple calculation, and so on. However, this method has no uniqueness, symmetry, or comparability, and the same level of relevance degree does not equate to a good or bad quality. Therefore, the employment of the correlation analysis method to assess the environment quality may pose a large deviation. The artificial neural network in the assessment phase is relatively simple and it can be fixed after long-term use of training. However, its accuracy is not high until a large number of training samples are used and the pre-calculation of the workload is required.
Although the risk assessment of the water environment has been successfully carried out with different methods, each method has specific disadvantages or limitations and therefore, no single method can be applied for all the different research objectives. In this study, a modified non-linear parameter functions model was established for the river water pollution risk assessment to solve the problems associated with the uncertainties and degrees of risk discrimination when dealing with varying pollutant concentrations and parameters during the assessment process. Taking the case study of the Weihe River Basin in Northwest China as an example, the results are expected to provide a sound basis for the regional river water management, pollution control, and scientific decision-making.

2. Materials and Methods

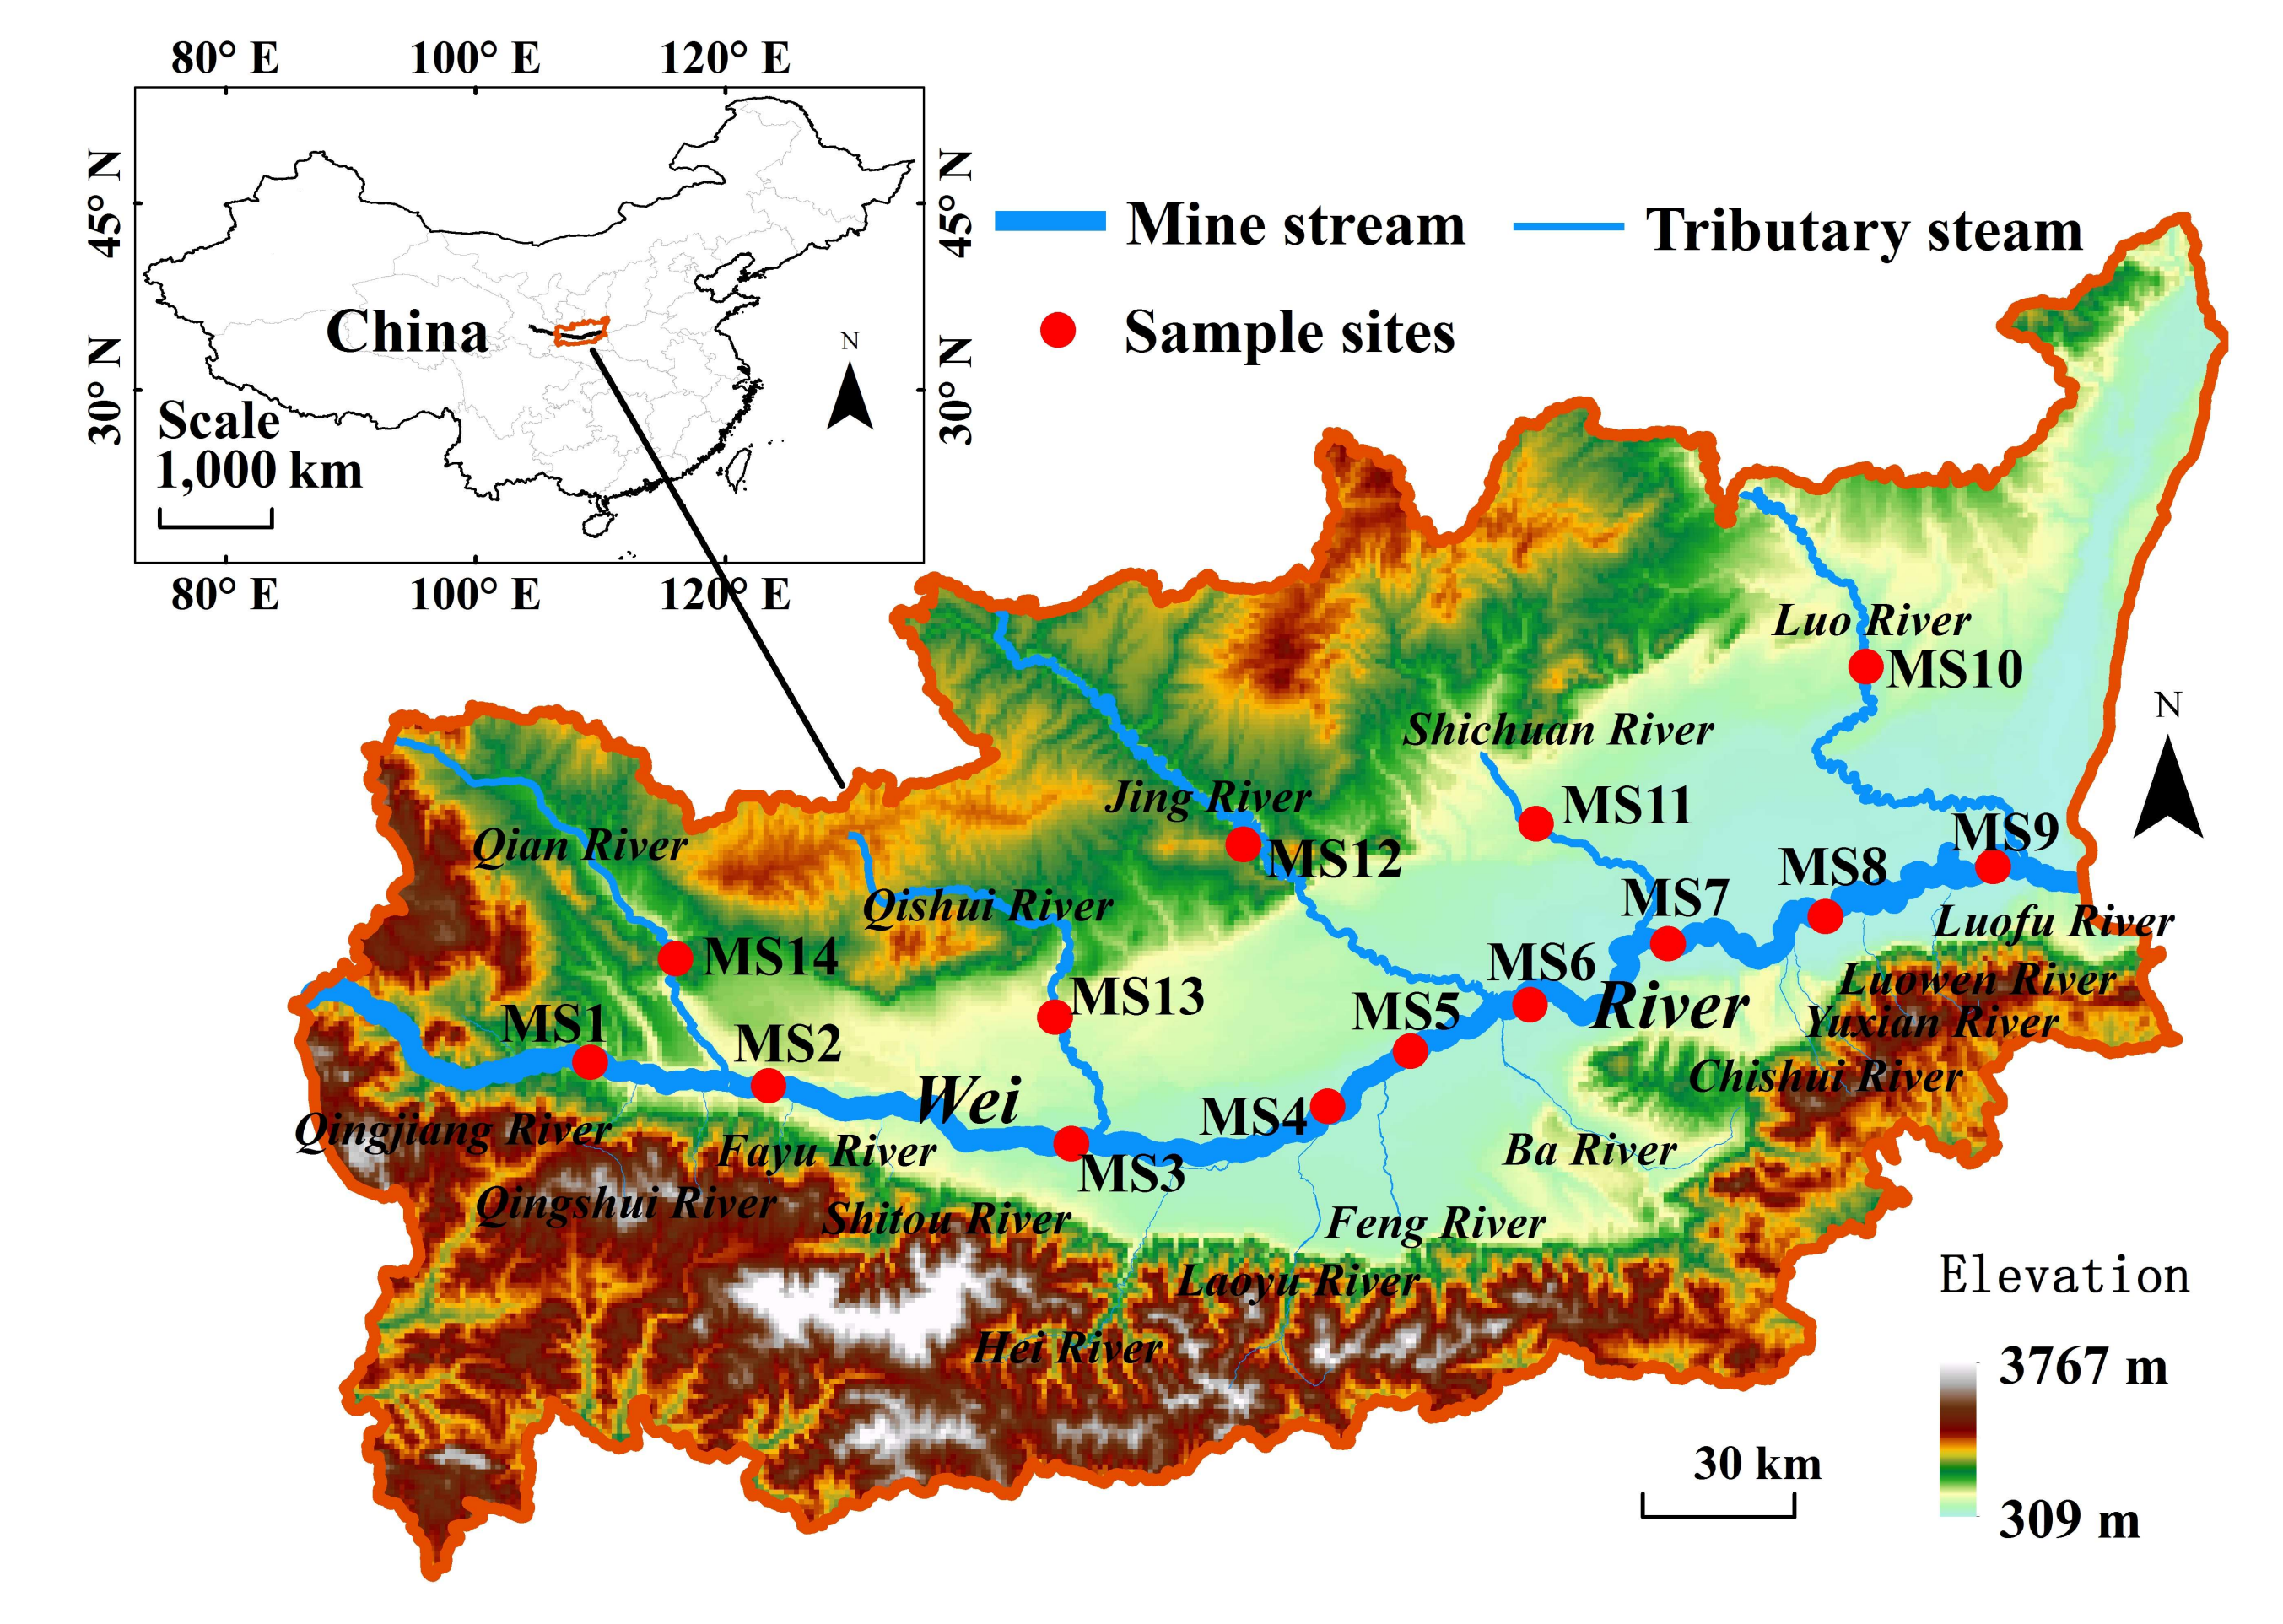
2.1. Study Area and Data

The Weihe River Basin in the Shaanxi Province, China, is the largest tributary of the Yellow River, with a total length of 818 km (Figure 1). It can be divided into three sections (upper, middle, and lower). The upper section of the Weihe River is narrow and flows fast. The middle section—with a length of 180 km—is located from Baoji City to Xianyang City. Compared with the upper section, it is wider, contains more sand, and has more water dispersion. The lower section—from Xianyang City to Tongguan City—has a length of 208 km. Recently, due to the rapid urbanization, many factors in the Weihe River Basin (including abundant industrial and economic activities, rapidly increasing population, serious water pollution of the surface water and groundwater, high water resource scarcity, and ecological imbalance) are jointly restricting the economic development. Moreover, industrial enterprises are the main source of waste water discharge in the Weihe River. Thus, the present situation of river water pollution of the region can be revealed by taking the Weihe River Basin as an example.
Water samples were collected twice a month from 14 monitoring sites in the Weihe River Basin following the order of Linjiacun (MS1), Guizhenqiao (MS2), Changxingqiao (MS3), Xingping (MS4), Nanying (MS5), Tianjiangrendu (MS6), Xinfengzhenqiao (MS7), Shawangdu (MS8), Tongguandiaoqiao (MS9), Chengchen (MS10), Shanyuan (MS11), Chunhua (MS12), Yongshou (MS13), and Qianyang (MS14) (Figure 1) in the upper and lower reaches of the Weihe River. According to the characteristics of major water pollution sources, the sample monitoring was mainly focused on six main parameters as risk assessment indexes: Ammonia nitrogen, Nitrite nitrogen, BOD5 (biochemical oxygen demand of 5 days), COD (chemical oxygen demand), Petroleum, and Potassium permanganate index (PPI). These pollution parameters can better represent the water quality of the Weihe River. After water sample collection, they were sent to the laboratory and filtered immediately with medium-speed filter paper.
A total of 336 water samples were monitored in 2015 and the sampling time was the early period of each month. All samples were collected and stored in accordance with the requirements of the surface water and waste water monitoring technical specifications (HJ/T91-2002). The water samples were returned to the laboratory and filtered immediately with medium-speed filter paper (with an aperture of 30–50 microns). Then, they were transferred into conical flasks (3L per sample) covered with gauze plugs and placed in the constant temperature water bath at 30 °C for the measurement of various items on a daily basis.
The monitoring of ammonia was based on the sodium colorimetry (GB7481-87), while BOD monitoring was done using the microbial electrode method. The permanganate index was measured using the acid potassium permanganate method. COD was monitored according to the potassium dichromate method (GB/T11914-1989). The amount of petroleum was determined using the infrared spectrophotometry (GB/T16488-1996), while the amount of nitrite was directly determined according to UV absorption.
In order to further analyze the risk of water pollution with runoff changes, the river water period in the Weihe River Basin and other river basins in northern China was generally divided into the dry season, the flat water period, and the flood season. The length of each water period was related to the physical geography, meteorological conditions, and human activities, among which precipitation was the most important factor. According to the multi-year precipitation data of the Weihe River Basin, the dry season is defined as December, January, and February, the flood period is from June to September, and the flat water period includes March–May, October, and November.

2.2. Assessment Model

The water environment system is a non-linear system which is usually much more complex than a linear system. In order to better reflect the actual situation, the risk assessment of water pollution in this study was conducted using a combination of a fuzzy method and non-linear forcing terms.
The fuzzy comprehensive method is often used to establish a hierarchical fuzzy set to quantify fuzzy parameters in order to calculate the risk assessment indexes and to determine the risk grades based on a fuzzy transformation principle. In a multi-index evaluation model, the index weight often affects the resolution of the assessment results since the weight reflects the contribution rates of the parameters. Moreover, the weight coefficient of each index varies with the measured sample. In a linear fuzzy model—because of the relatively low concentrations of toxic pollutants—the weight coefficient of pollutants is reduced, thereby causing much information loss and affecting the assessment results. In order to alleviate the information loss, the coefficients of pollutant concentrations exceeding the regulated water quality criteria were calculated. Meanwhile, considering the influences of pollutant diffusion, the migration or degradation activities on different spatiotemporal scales, the stochastic vibration coefficients, and a non-linear perturbation coefficient were added to the linear fuzzy terms to calculate the weight of the risk indexes and classify the risk level. The main steps are as follows.
(1) Establishing a non-linear water quality parameter function model as shown in Equations (1)–(4).
C = { C ( t ) i j }
C ( t ) i j = μ A G ( c , t ) C ( t ) d t + ξ ( t )
ξ ( t ) = 2 ε i j 2 δ ( t t 0 )
A = { a i j }
where C is a non-linear water quality parameter set, C(t)ij represents the non-linear parameter function of the non-linear matrix C, µ is the diffusion coefficient of the contaminant parameter (e.g., constant);G(c,t) represents an n dimensional variable coefficient matrix, C(t) represents an n-dimensional vector, ξ(t)represents the random disturbance of tiny random factors, εij2 represents the random process intensity(εij2 may be taken as 0, 0.5, 0.8, 1.0···, and represents the discrete degree sequence value; the larger the εij2, the greater the dispersion of the random process interference), δ is the generalized function, A is the observed water quality parameter set, and aij represents the observed value of the jth indicator for the ith sample.
(2) Solving the probability density function of C(t)ij based on the finite difference method.
Because C(t) is a stochastic vector in the Markov process, C(t)ij can be solved using the Markov theory procedure. Thus, Equation (5) can be obtained by differentiating Equation (2), and then it can be expressed using the Fokker–Brown equation as shown in Equation (6).
d C ( t ) / d t = K G ( c , t ) C ( t ) + d ξ ( t ) / d t
C ( t ) t = j = 1 n λ i [ μ G ( c , t ) C ( t ) ] + i , j = 1 n ε i j 2 2 C x i x j
where λ represents the diagonal element of matrix C.
Using Fourier difference, the analytical solution of Equation (6) can be obtained as shown in Equation (7):
C ( c , t ) = ( 1 / ( 2 π ) n U ) exp [ ( A B ) T U 1 ( A B ) / 2 ]
where elements bi of vector Band elements uij of matrix U can be calculated as follows:
b i = μ a i e λ i ( t t 0 )
u i j = [ 2 ε i j 2 / ( λ i + λ j ) ] [ exp [ ( λ i + λ j ) ( t t 0 ) ] 1 ]
(3) Setting up the risk assessment criteria D, as shown in Equation (10):
D = ( d 1 , d 2 , , d k ) = { d k }
where k is the number of risk assessment grades; dk is the kth water risk assessment grade.
At present, risk classification is still a fuzzy concept and there is no standard limit. Based on the water quality criteria of China’s standard (GB3838-2002), the water pollution risk is divided into five levels: relatively low risk, lower risk, medium risk, high risk, and particularly high risk. Accordingly, the degrees of risk are negligible risk, acceptable risk, marginal risk, unacceptable risk, and catastrophic risk.
(4) Obtaining a fuzzy membership matrix V by C and D, as shown in Equation (11):
V = ( v i j ) m × n
where νij represents the membership of the jth indicator for the ith sample. The membership functions are as follows:
v i j = { 0 c i = d i j , j = 2 , 3 , , m 1 ; c i d i ( j + 1 ) , j = 1 ; c i d i ( j 1 ) , j = m c i d i ( j 1 ) c i j d i ( j 1 ) d i j c i d i ( j 1 ) , j = 2 , 3 , , m 1 ; d i ( j 1 ) c i d i j , j = m c i d i ( j + 1 ) c i j d i ( j + 1 ) c i ( j + 1 ) c i c i j , j = 1 , 2 , 3 , m 1 ; d i ( j + 1 ) c i c i j , j = m 1 c i d i j , j = 2 , 3 , , m 1 ; c i d i j , j = 1 ; c i d i j , j = m
(5) Building the indicator weight matrix W, as shown in Equation (13).
In the water pollution risk assessment, the determination of the index weights is a pivotal step. The weight reflects the contribution rate of each pollutant to the overall water pollution. In order to avoid subjectivity and information loss, the combination of entropy and non-linear factors can be used to determine the comprehensive weight. In this way, non-linear factors are added to the risk assessment for achieving more reasonable and reliable risk assessment results. The non-linear factors may be non-linear stochastic perturbations caused by the flow, migration, and diffusion of pollutants across the contaminated areas, or by the low concentrations of excessive pollutants that would still generate high pollution risk.
W = ( w i j ) m × n
w i j = η 1 × α i j + η 2 × β i j + η 3 × γ i j
where ωij represents the indicator weight, αij represents the linear weighting coefficient, βij and γij represent the non-linear weighting coefficients (forcing term coefficient), and η represents the proportion of each weighting coefficient. α is calculated using the entropy method, β can be obtained using the non-linear perturbation method, and γ is calculated using the excessive concentration method, as shown in Equations (15)–(17).
α = 1 h j j = 1 n ( 1 h j ) ,   h j = 1 ln ( n ) i = 1 m p i j ln p i j ,   p i j = a i j i = 1 m a i j
β = ξ j j = 1 n ξ i j
γ = f j f 0 j 1
where f0j represents the pollution standard concentration of the jth indicator, and fj represents the monitored concentration.
(6) Building a risk assessment index RI by V and W, as shown in Equation (18).
R I = V × W
(7) Calculating the composite risk index CRI with the weighted average, as shown in Equation (19).
C R I = j = 1 n ( v i j × w j ) / j = 1 n v i j
Using the above non-linear model can reduce the loss of information in the risk assessment of pollutants. For example, for low ammonia concentrations, the risk value calculated by a linear model may be 13.8% lower than that of the risk of a non-linear model. Moreover, the non-linear results are consistent with the actual situation

3. Results and Discussion
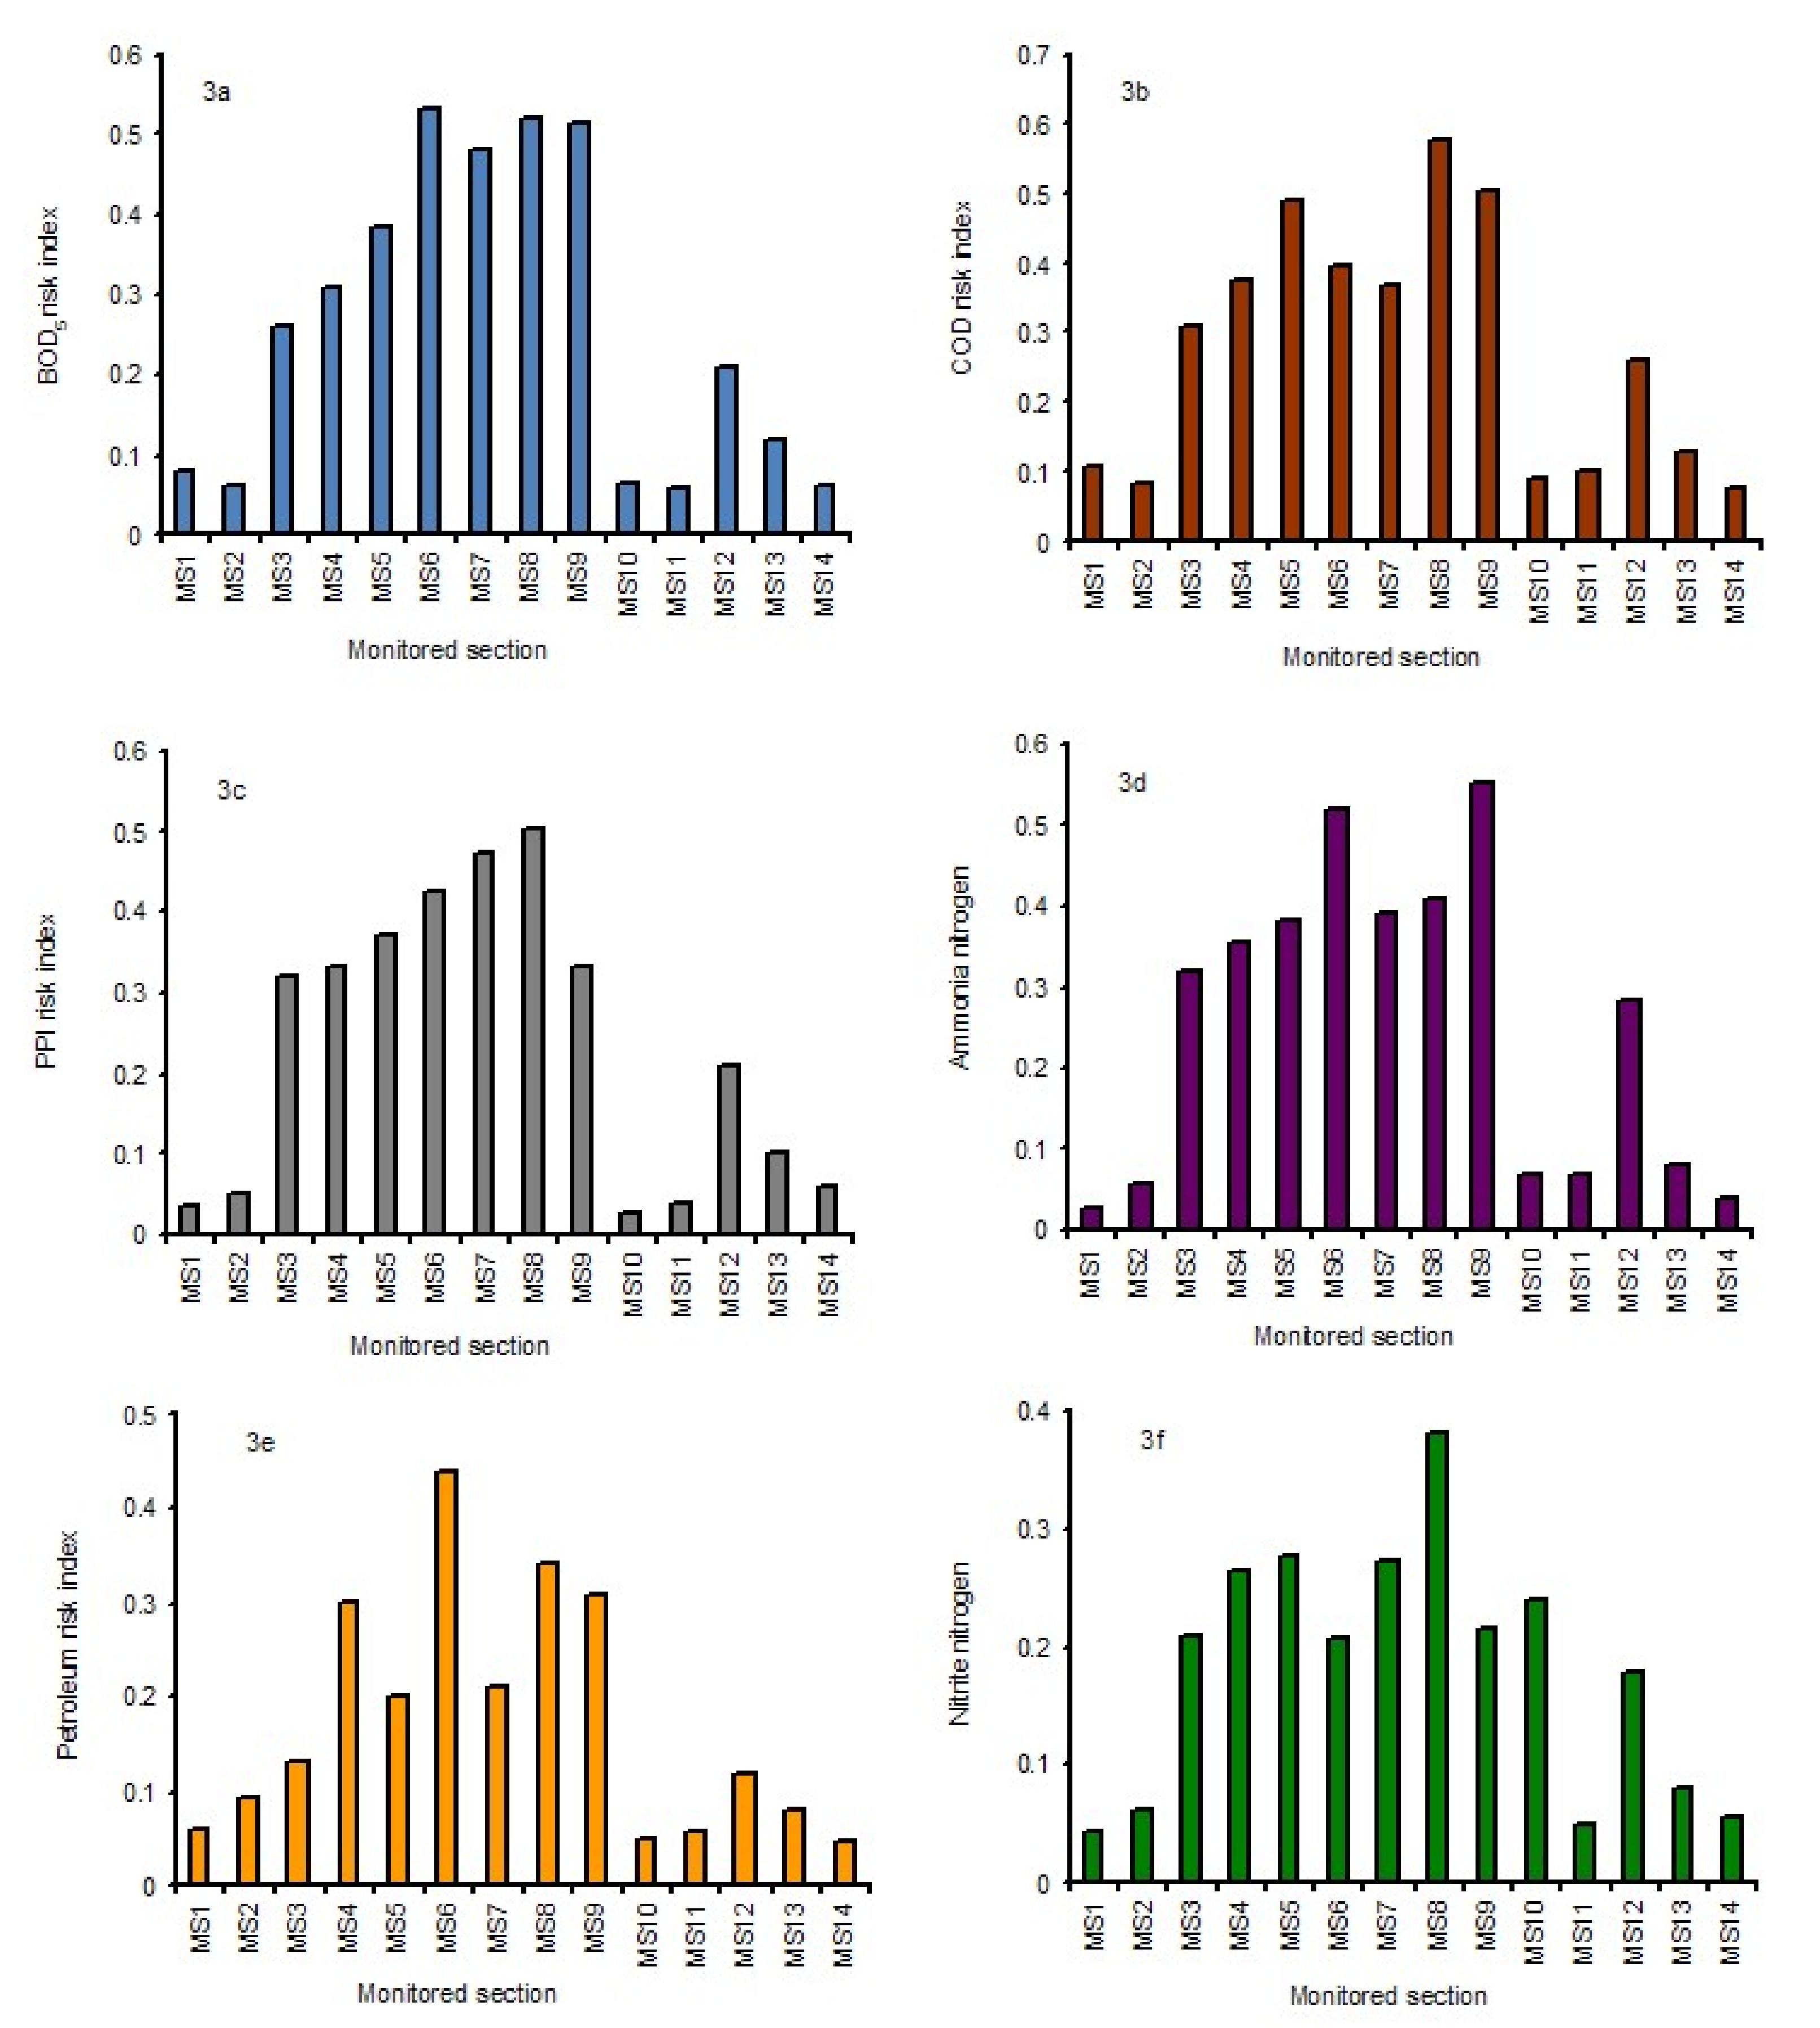
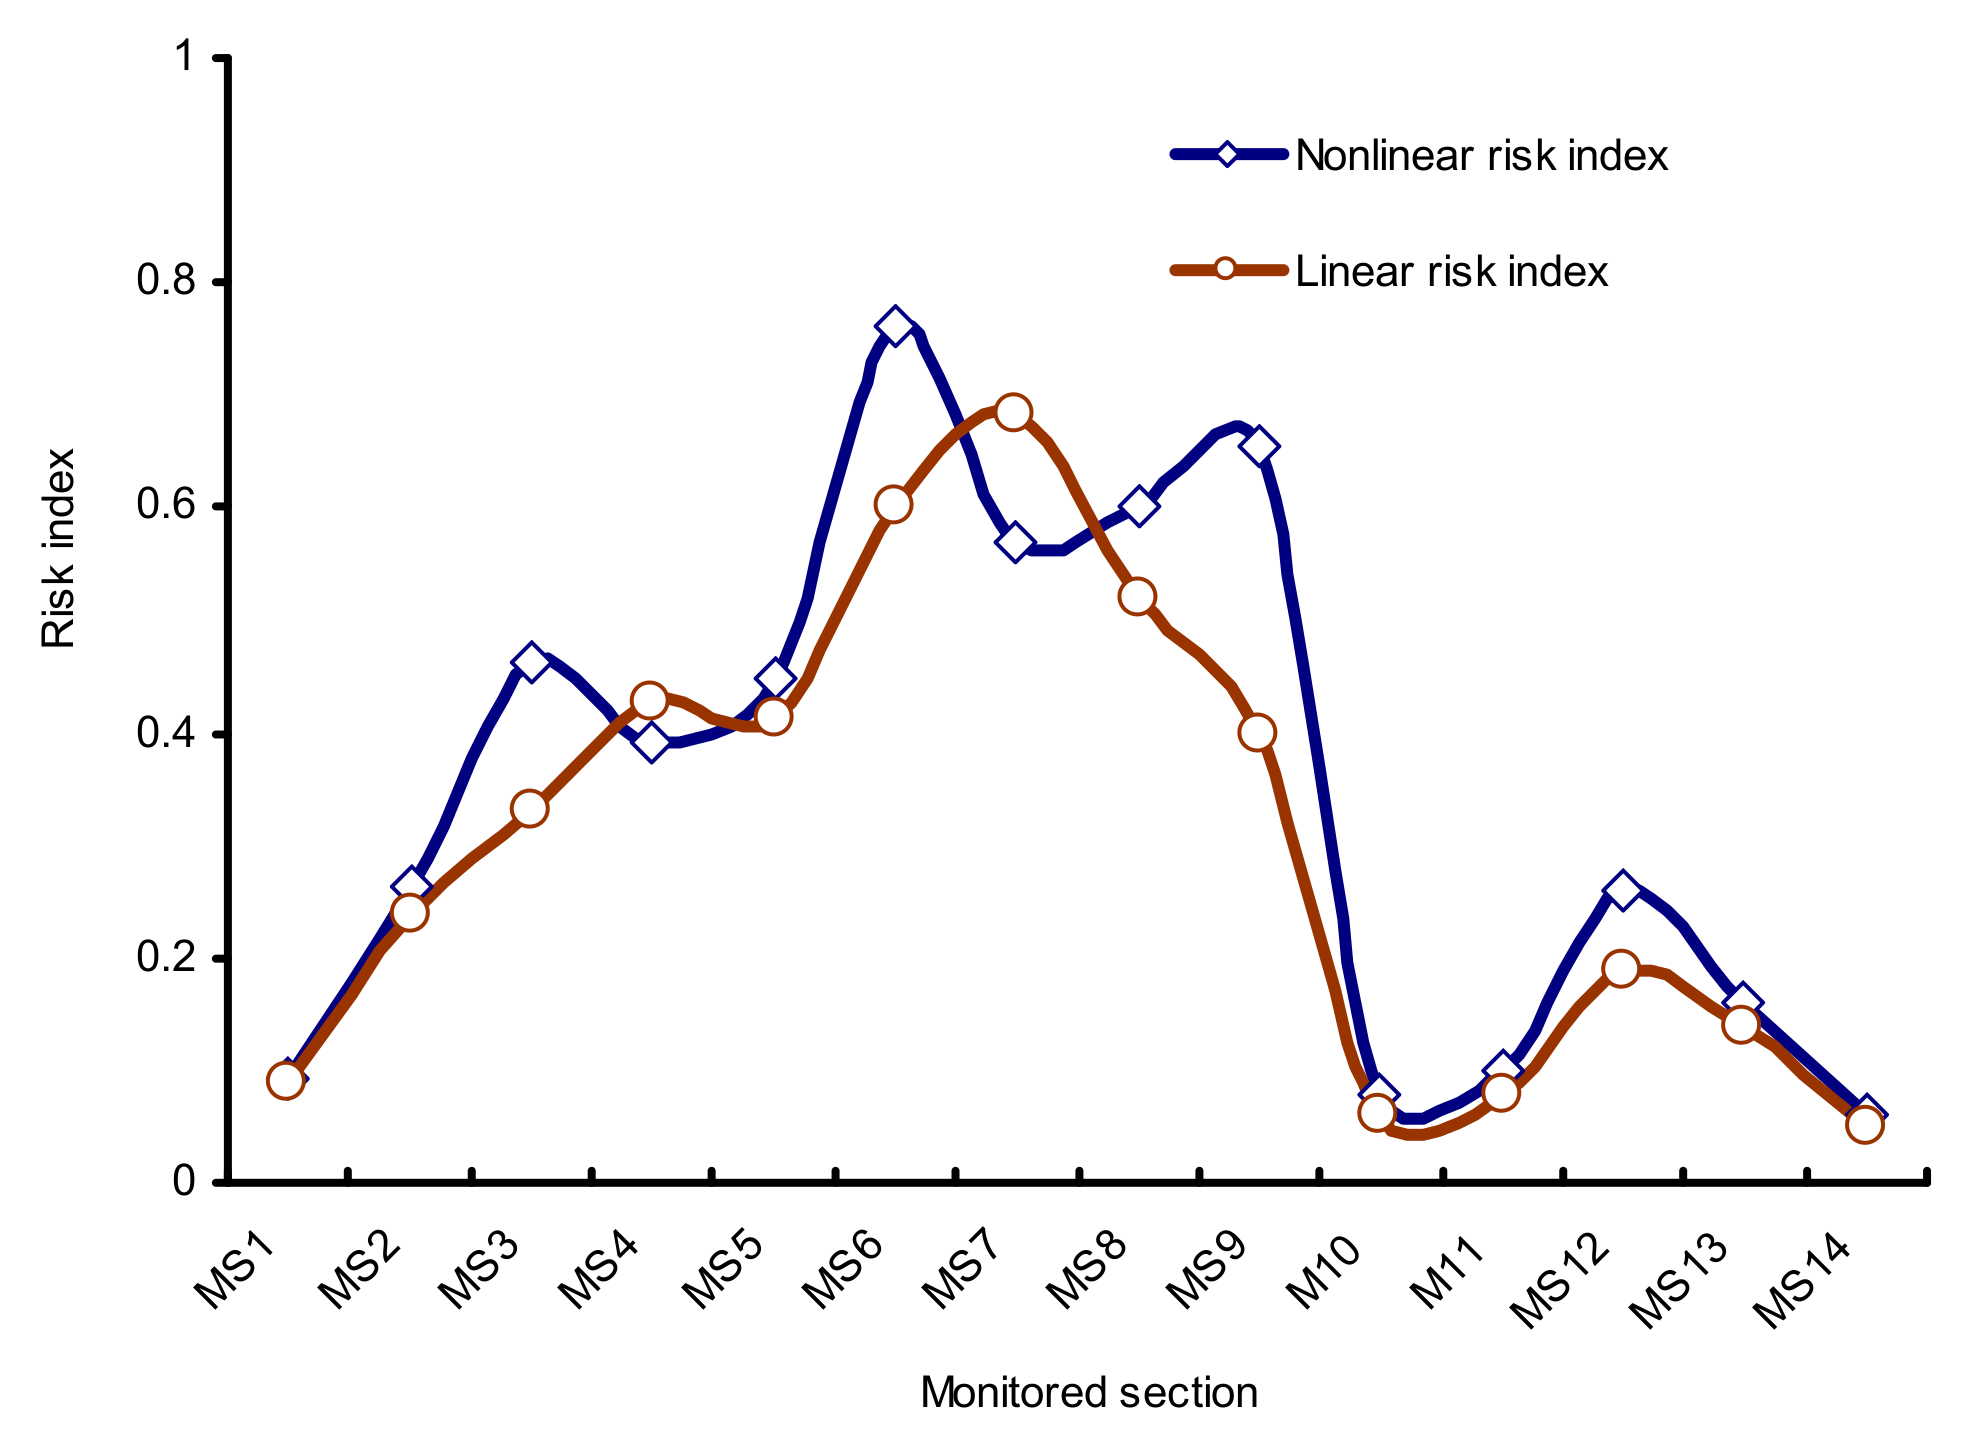
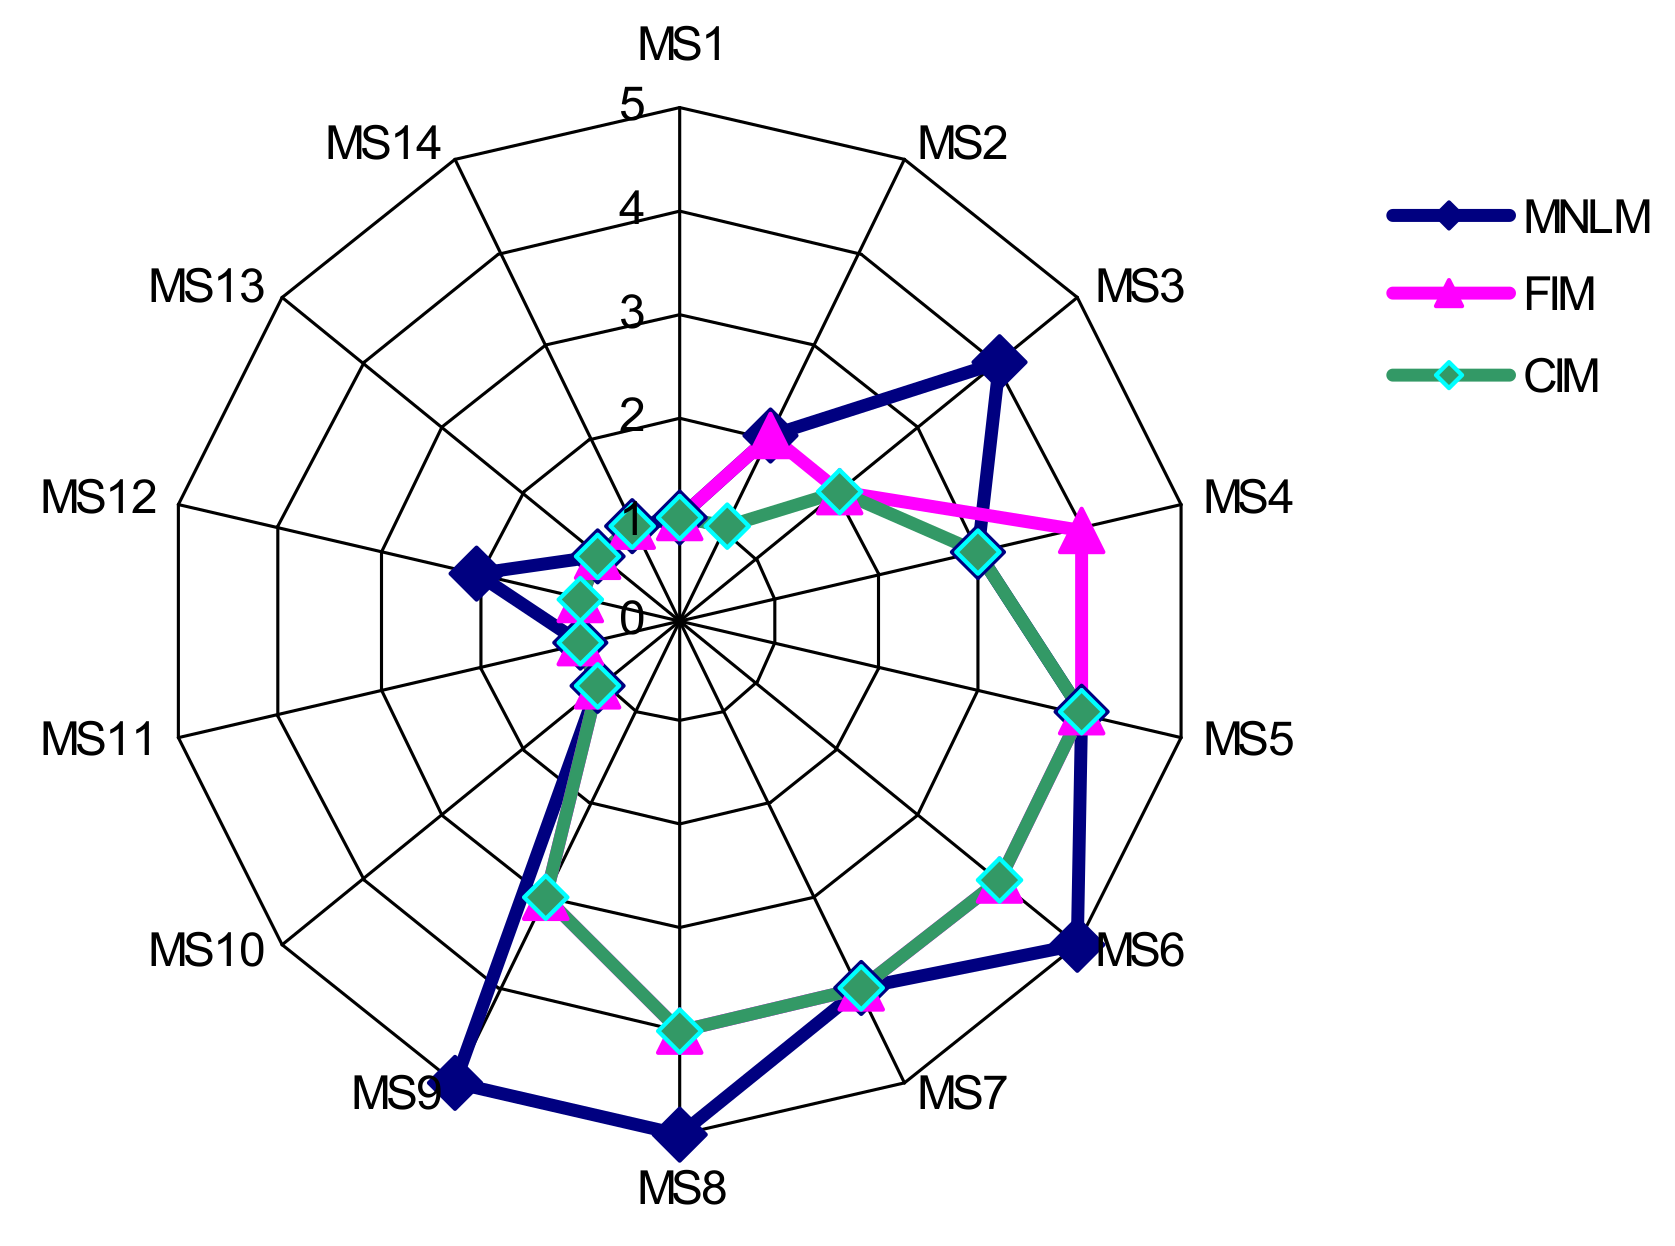
3.1. Results

The distribution of water pollutant concentrations in the Weihe River Basin from the monitoring sampleis presented in Figure 2. As can be seen, among the six water pollutants, the concentrations of COD and permanganate index, with average values of 45 mg L−1 and 15 mg L−1, respectively, are significantly higher than those of the others, especially in the middle and lower reaches of the mainstream of the Weihe River, while all pollutant concentrations are low in the tributaries of the River. The monitored data indicate that the middle and lower reaches of the Weihe River are seriously polluted.
The weight coefficients and the risk assessment grades of water pollution for the six pollution indexes in the monitoring site are calculated using the above models, while the results are shown in Table 1 and Table 2. As can be seen, the weights of COD and ammonia nitrogen are relatively high, indicating that both high-concentration and low-concentration pollutants can cause great risks of river water pollution. Figure 3 illustrates the risk indexes of different pollutants at 14 monitoring sites. It clearly shows the risk indexes of BOD5, COD, potassium permanganate, and ammonia nitrogen at MS3–MS9 are all above the Chinese water quality III level/standard (Environmental Quality Standard for Surface Water China GB3838-2002), although some of the pollutants in these monitoring sites are relatively small. In particular, the concentration of ammonia and petroleum is relatively low, but the risk index is relatively high. This indicates that using the non-linear model can reduce the loss of information in the risk assessment of pollutants.
Using the above non-linear model, the water pollutant comprehensive risk indexes were estimated. Figure 4 displays the river water pollutant risk distribution at each monitoring site. As can be clearly seen, at most monitoring sites of the Weihe River, the water pollutant comprehensive risk indexes are high, especially in the middle reach of the River where the greatest risk is above 0.584. More significantly, the risk values are the highest in MS6, MS8, and MS9, although the pollutant concentration in these areas is not the highest. The low-risk indexes are in the upper reach and in the tributaries. The river section from site MS3 to MS9 accounts for nearly 67% of the total river length and is located in the high-risk areas. This indicates that two-thirds of the river monitoring sites have risk indexes that are at least above risk level III, while some sites even have risk indexes reaching risk level V. Moreover, it was found that the comprehensive indexes/results of the non-linear assessment are larger than those of the linear risk assessment except for MS4 and MS7. In addition, the average non-linear assessment risk indexes of water pollution are 10.9% higher than the linear assessment and the maximum risk differences are in the MS6 and MS9 sections. The difference is very obvious, especially in the middle reach. Comparison between Figure 3 and Figure 4 shows that the high-risk indexes of water pollutants are primarily observed in the areas with serious water pollution. In those areas, despite the low concentrations of ammonia and petroleum, the excessive pollution is relatively severe, which leads to a relatively high comprehensive pollution risk index.
The runoff size also affects the water pollution risk through the diffusion and migration of contaminants, especially in the dry and flood seasons. From Figure 5, it can be seen that in the dry season (e.g., December), the risk index of the water pollution is higher than that in the flood season (e.g., July). Moreover, the risk indexes of water pollution at large-runoff sites are lower than those at small-runoff sites, and the risk index increased by 11.7% when the difference of runoff is 2.9 × 10⁸ m. In the middle and lower reaches of the Weihe River, COD and BOD5concentrations are high. The concentrations of insoluble oil and ammonia nitrogen also greatly exceed the water quality criteria of the national standards of environmental quality standard for surface water (GB3838-2002). Moreover, a large runoff can result in the vigorous diffusion and migration of contaminants, thus leading to a relatively large risk of regional water pollution. In the dry season, pollutant diffusion and migration are slow and the natural purification of water bodies is weak, so the risk of contamination in the dry season is even greater than that in the flood season.

3.2. Discussion

In order to verify the reliability of the MNLM method, the results of this study are compared with those of the comprehensive index method (CIM) and the fuzzy identification method (FIM). At each monitoring site in the Weihe River, a profile of water pollution risk assessment levels is showed in Figure 6. As can be seen, the results of the NLM method are similar to those of Reference [31] but higher than those of CIM and FIM.
Previous reports and actual situations indicate that, from Xianyang City to Tongguan City, the industrial wastewater, domestic sewage, and non-point source pollution accounted for a great proportion of water pollution, which caused serious water quality deterioration in the middle and lower reaches of the Weihe River [9,12,13,32]. As a result, the water quality was poor and the risk was high. Comparative analysis implied that the risk assessment results of water pollution by the MNLM method were more consistent with the actual situations, but there are differences with the existing research, especially in high/low concentrations of contaminated individual areas. Risk assessment with the MNLM method displayed a clear advantage over that with the linear evaluation method. It was able to overcome the disadvantages of the traditional gray clustering method and the comprehensive fuzzy evaluation method [7,9,18] when the distribution of pollutant concentration is discrete and causes information loss. In the MNLM method, a non-linear coefficient is introduced to objectively define each assessment index for the polluted river water quality. By modifying the calibration model of the weight coefficients of the pollution factors, the different role and the weight of each factor in different pollution levels can be considered in order to avoid the average weighting information of evaluation factors, thus improving the accuracy and resolution of risk assessment. Due to the relatively short timeframe of the monitoring data, the calculated results may have certain limitations, such as the risk reduction/increase in MS6–MS9 due to changes in pollutant concentration. A larger timeframe of monitoring data should be expected and used to verify and correct model parameters. It should be noted that the forcing term coefficients may vary in the case of a large runoff and special river water quality, so the forcing term coefficients should be corrected according to the actual conditions.

4. Conclusions

The MNLM method is more convenient, accurate, and objective than other traditional methods for the risk assessment of the water pollution in river basins, which may improve our capability to make more accurate judgments about the main pollutants leading to water pollution risk assessment and risk degrees. It is especially important that in different areas of high and high/low concentration of pollutants and pollutants, the non-linear perturbation terms are introduced into the model, thus the risk of river water pollution can be estimated more accurately by avoiding the loss of some important information.
The results of the water pollution risk assessment in the case study of the Weihe river showed that the river water pollution risk is relatively high in MS3, MS6, MS9, and MS12, and the BOD5, COD, and NH3-N discharged by industrial enterprises are the main sources of the pollution of river water, while the water pollution risk in the dry season is higher than that in the flood season. However, it should be noted that the forcing term coefficients may largely vary for different river basins. Hence, the forcing term coefficients need to be corrected according to the actual situations of different river basins.

Acknowledgments

This work was supported by National Natural Science Foundation of China (No. 41771048, 41572235), National Social Science Foundation of China (No. 15XZZ012), Key Laboratory Foundation of Shaanxi Province (No. 13JS010), Key Project of Baoji University of Arts and Sciences (No. ZK16061) and Geography Key Discipline Project.

Author Contributions

Y. Liu and Y. Zhao conceived and designed the experiments; J. Zhang performed the experiments; Y. Liu and J. Zhang analyzed the data; Y. Zhao contributed reagents/materials/analysis tools; Y. Liu wrote the paper.

Conflicts of Interest

The authors declare no conflict of interest.

References

  1. Landis, W.G.; Thomas, J.F. Regional risk assessment as a part of the long-term receiving water study. Integr. Environ. Assess. Manag. 2009, 5, 234–247. [Google Scholar] [CrossRef] [PubMed]
  2. Aouissi, J.; Benabdallah, S.; Chabaâne, Z.L.; Cudennec, C. Modeling Water Quality to Improve Agricultural Practices and Land Management in a Tunisian Catchment Using the Soil and Water Assessment Tool. J. Environ. Qual. 2014, 43, 18–25. [Google Scholar] [CrossRef] [PubMed]
  3. Koch, M.; Missimer, M.T. Water Resources Assessment and Management in Drylands. Water 2016, 8, 239. [Google Scholar] [CrossRef]
  4. Goonetilleke, A.; Vithanage, M. Water Resources Management: Innovation and Challenges in a Changing World. Water 2017, 9, 281. [Google Scholar] [CrossRef]
  5. Shakhawat, C.; Tahir, H.; Neil, B. Fuzzy rule based modeling from human health risk from naturally occurring radioactive material sing produced water. J. Environ Radioact. 2006, 89, 1–17. [Google Scholar] [CrossRef] [PubMed]
  6. Dahiya, S.; Singh, B.; Gaur, S.; Garg, V.K.; Kushwaha, H.S. Analysis of groundwater quality using fuzzy synthetic evaluation. J. Hazard. Mater. 2007, 147, 938–946. [Google Scholar] [CrossRef] [PubMed]
  7. Wang, J.J.; He, J.T.; Chen, H.H. Assessment of groundwater contamination risk using hazard quantification, a modified drastic model and groundwater value. Beijing Plain, China. Sci. Total Environ. 2012, 432, 216–226. [Google Scholar] [CrossRef] [PubMed]
  8. Zou, B.; Zeng, Y.N.; Benjamin, F.Z.; Yang, L.B.; Zang, H.H. Spatial and Temporal Health Risk Assessment of Water Environment in Urban Area. Geogr. Geo-Inf. Sci. 2009, 25, 94–98. [Google Scholar]
  9. Guo, Q.C.; He, Z.F.; Li, L.; Kou, L.Q. Application of BP Neural Network on Water Environmental Quality Evaluation of Weihe River. Bull. Soil Water Conserv. 2011, 31, 112–115. [Google Scholar]
  10. Li, J.K.; Li, H.E.; Shen, B.; Qin, Y.M.; Dong, W. Monitoring and estimating non-point source pollution on typical sections along the Weihe River. Adv. Water Sci. 2011, 22, 818–828. [Google Scholar] [CrossRef]
  11. Wang, T.R.; Sun, G.N.; Liu, S.Y. Relationship between Spatiotemporal Variation of Water Pollution and Runoff Volume of Mainstream Section of the Weihe River in Shaanxi Province. Arid Zone Res. 2011, 28, 599–615. [Google Scholar] [CrossRef]
  12. Guan, J.L.; Wang, L.; Pei, X.L.; Yang, Y.Z.; Xing, Y.; Liu, Y. Trends of Major Pollutants Found in Weihe Rive in Shaanxi Provicnce. Bull. Soil Water Conserv. 2012, 32, 51–60. [Google Scholar] [CrossRef]
  13. Liu, Y.G.; Wang, N.L.; Wang, L.G.; Zhao, Y.Q.; Wu, X.B. Application of GIS in regional ecological risk assessment of water resources. Environ. Eng. Manag. J. 2013, 12, 1465–1474. [Google Scholar]
  14. Wang, Y.; He, B.; Duan, W.L.; Li, W.H.; Lou, P.P.; Razafindrabe, N.H.B. Source Apportionment of Annual Water Pollution Loads in River Basins by Remote-Sensed Land Cover Classification. Water 2016, 8, 361. [Google Scholar] [CrossRef]
  15. Chen, Q.; Liu, J.; Ho, K.C.; Yang, Z. Development of a relative risk model for evaluating ecological risk of water environment in the Haihe River Basin estuary area. Sci. Total Environ. 2012, 420, 79–89. [Google Scholar] [CrossRef] [PubMed]
  16. Ding, A.W.; Chong, X.; Bao, Z.F.; Xue, X.; Zhang, S.H. Fuzzy Comprehensive Assessment Method Based on the Entropy Weight Method and Its Application in the Water Environmental Safety Evaluation of the Heshangshan Drinking Water Source Area, Three Gorges Reservoir Area, China. Water 2017, 9, 329. [Google Scholar] [CrossRef]
  17. Lermontov, A.; Yokoyama, L.; Lermontov, M.; Machado, M.A. River quality analysis using fuzzy water quality index: Ribeira do Iguape river watershed, Brazil. Ecol. Indic. 2009, 9, 1188–1197. [Google Scholar] [CrossRef]
  18. Geng, Y.N.; Zhang, J.; Zhou, Q.; Xu, C.D.; Zhao, Y.Q. Fuzzy synthetic evaluation of Weihe water quality. Environ. Eng. Manag. J. 2011, 10, 1477–1484. [Google Scholar]
  19. Peng, Y.; Xu, Q.X. Source Water Pollution Risk Discrimination Technique and its Application. Environ. Monit. Forewarn. 2009, 10, 1–4. [Google Scholar]
  20. VonderOhe, P.C.; Dulio, V.; Slobodnik, J.; Deckere, E.; Kühne, R.; Ebert, R.U.; Ginebreda, A.; Cooman, W.D.; Schüürmann, G.; Brack, W. A new risk assessment approach for the prioritization of 500 classical and emerging organic microcontaminants as potential river basin specific pollutants under the European Water Framework Directive. Sci. Total Environ. 2011, 409, 2064–2077. [Google Scholar] [CrossRef] [PubMed]
  21. Singh, K.P.; Basant, A.; Malik, A.; Jain, G. Artificial neural network modeling of the river water quality—A case study. Ecol. Model. 2009, 220, 888–895. [Google Scholar] [CrossRef]
  22. Liu, J.; Li, Y.P.; Huang, G.H.; Fan, Y.R. A Semi-Infinite Interval-Stochastic Risk Management Model for River Water Pollution Control under Uncertainty. Water 2017, 9, 351. [Google Scholar] [CrossRef]
  23. Noori, R.; Sabahi, M.S.; Karbassi, A.R.; Baghvand, A.; Zadeh, H.T. Multivariate statistical analysis of surface water quality based on correlations and variations in the data set. Desalination 2010, 260, 129–136. [Google Scholar] [CrossRef]
  24. Hall, K.K.; Evanshen, B.G.; Maier, K.J.; Scheuerman, P.R. Application of Multivariate Statistical Methodology to Model Factors Influencing Fate and Transport of Fecal Pollution in Surface Waters. J. Environ. Qual. 2014, 43, 358–370. [Google Scholar] [CrossRef] [PubMed]
  25. Wang, T.X.; Xu, S.G.; Liu, J.W. Dynamic Assessment of Comprehensive Water Quality Considering the Release of Sediment Pollution. Water 2017, 9, 375. [Google Scholar] [CrossRef]
  26. Santhi, C.; Kannan, N.; White, M.; Luzio, M.D.; Arnold, J.G.; Wang, X.; Williams, J.R. An Integrated Modeling Approach for Estimating the Water Quality Benefits of Conservation Practices at the River Basin Scale. J. Environ. Qual. 2014, 43, 177–198. [Google Scholar] [CrossRef] [PubMed]
  27. Zhu, H.N.; Yuan, X.Z.; Jang, J.L.; Zeng, G.M.; Jiang, H.W. An integrated model for assessing the risk of water environmental pollution based on fuzziness. China Environ. Sci. 2011, 31, 516–521. [Google Scholar]
  28. Xue, Y.; Song, J.X.; Zhang, Y.; Kong, F.H.; Wen, M.; Zhang, G.T. Nitrate Pollution and Preliminary Source Identification of Surface Water in a Semi-Arid River Basin, Using Isotopic and Hydrochemical Approaches. Water 2016, 8, 328. [Google Scholar] [CrossRef]
  29. Liu, Y.G.; Fu, Z.J. Ecological risk integrated assessment and driving factors for water resources in Shaanxi province. Bull. Soil Water Conserv. 2012, 32, 273–278. [Google Scholar] [CrossRef]
  30. Hoang, L.; Griensven, A.; Keur, P.; Refsgaard, J.C.; Troldborg, L.; Nilsson, B.; Mynett, A. Comparison and Evaluation of Model Structures for the Simulation of Pollution Fluxes in a Tile-Drained River Basin. J. Environ. Qual. 2014, 43, 86–99. [Google Scholar] [CrossRef] [PubMed]
  31. Environmental Monitoring Division of Ministry of Environmental Protection. Twelfth Five-Year Environment Monitoring Workbook; Environmental Monitoring Division of Ministry of Environmental Protection: Beijing, China, 2012.
  32. Liu, Y.G.; Yang, Y.X.; Xu, C.D. Risk evaluation of water pollution in the middle catchment of Weihe River. J. Residuals Sci. Technol. 2015, 12, 133–136. [Google Scholar] [CrossRef]
Figure 1. The distribution of monitoring sites in the Weihe River Basin.
Water 10 00362 g001
Figure 2. The distribution of the river water pollutant concentrations at each monitoring site.
Water 10 00362 g002
Figure 3. The risk indexes of different pollutants at each monitoring site. The risk indexes including BOD5 (a); COD (b); PPI (c); Ammonia nitrogen (d); Petroleum (e); Nitrite nitrogen (f).
Water 10 00362 g003
Figure 4. The comprehensive risk index at each monitoring site.
Water 10 00362 g004
Figure 5. The comprehensive risk indexes during different runoff periods.
Water 10 00362 g005
Figure 6. The comparison results of the water pollution risks from the three methods.
Water 10 00362 g006
Table 1. The weight values of the water pollution parameters at each monitoring site of the mainstream of the Weihe River Basin.
Monitoring SiteBOD5CODPotassium PermanganateAmmonia NitrogenPetroleumNitrite Nitrogen
MS10.1780.2170.1690.1960.1430.088
MS20.1520.1920.1650.1820.1730.136
MS30.1480.1810.1510.2130.1670.14
MS40.1850.1760.1320.1870.1640.156
MS50.1510.1880.1840.2130.1630.101
MS60.1460.1980.1830.1750.1910.107
MS70.1710.190.1650.1890.1830.102
MS80.1690.1770.1730.2140.150.117
MS90.1730.1640.1840.1870.1710.121
MS100.1680.1780.1670.2030.1660.118
MS110.1530.1570.1780.2180.1650.129
MS120.1570.1620.1780.1980.1890.116
MS130.1670.1690.1730.1940.1750.122
MS140.1750.1640.1880.1860.1690.118
Table 2. The water pollution risk assessment grades and indexes for the six pollution parameters.
Pollution ParametersWater Pollution Risk Assessment Gradesand Index
IIIIIIIVV
Negligible RiskAcceptable RiskMarginal RiskUnacceptable RiskCatastrophic Risk
BOD50.1150.116–0.1350.135–0.1540.155–0.2310.332–0.634
COD0.1250.126–0.2550.256–0.3670.368–0.4500.451–0.783
Petroleum0.030.031–0.2130.214–0.3010.302–0.4230.424–0.598
Nitrite nitrogen0.0360.037–0.1430.144–0.2340.235–0.4160.417–0.524
Potassium permanganate0.0840.085–0.1380.139–0.2860.287–0.3710.372–0.605
Ammonia nitrogen0.0490.050–0.1860.187–0.2830.284–0.3910.392–0.421
Comprehensive level<0.250.25–0.350.35–0.450.45–0.65>0.65

